Chapter 17 The Prototype Phase Change Material …iffjones/JaakkoBob.pdf · Chapter 17 The...
28
Chapter 17 The Prototype Phase Change Material Ge 2 Sb 2 Te 5 : Amorphous Structure and Crystallization Jaakko Akola, Janne Kalikka and Robert O. Jones Abstract The widespread use of phase change materials in storage media is based on the extremely rapid and reversible switching between the amorphous and crystalline phases of some families of semiconducting alloys. Detailed information about the structure of the amorphous phase and the mechanism of crystallization are essential for the development of new storage media, and we study both aspects here using den- sity functional/molecular dynamics simulations of Ge 2 Sb 2 Te 5 , the prototype phase change material of the Ge/Sb/Te semiconductor family. J. Akola Department of Physics, Tampere University of Technology, 33101 Tampere, Finland e-mail: jaakko.akola@tut.fi J. Akola COMP Centre of Excellence, Department of Applied Physics, Aalto University, 00076 Aalto, Finland J. Kalikka Singapore University of Technology and Design, 8 Somapah Road, Singapore 487372, Singapore e-mail: [email protected] J. Kalikka Department of Nuclear Science and Engineering, Massachusetts Institute of Technology, Cambridge, MA 02139, USA R.O. Jones (B ) Peter Grünberg Institut PGI-1 and JARA/HPC, Forschungszentrum Jülich, 52425 Jülich, Germany e-mail: [email protected] R.O. Jones German Research School for Simulation Sciences, FZ Jülich and RWTH Aachen University, 52425 Jülich, Germany © Springer International Publishing Switzerland 2015 C. Massobrio et al. (eds.), Molecular Dynamics Simulations of Disordered Materials, Springer Series in Materials Science 215, DOI 10.1007/978-3-319-15675-0_17 457
Transcript of Chapter 17 The Prototype Phase Change Material …iffjones/JaakkoBob.pdf · Chapter 17 The...

Chapter 17The Prototype Phase Change MaterialGe2Sb2Te5: Amorphous Structureand Crystallization
Jaakko Akola, Janne Kalikka and Robert O. Jones
Abstract Thewidespread use of phase changematerials in storagemedia is based onthe extremely rapid and reversible switching between the amorphous and crystallinephases of some families of semiconducting alloys. Detailed information about thestructure of the amorphous phase and the mechanism of crystallization are essentialfor the development of new storage media, and we study both aspects here using den-sity functional/molecular dynamics simulations of Ge2Sb2Te5, the prototype phasechange material of the Ge/Sb/Te semiconductor family.
J. AkolaDepartment of Physics, Tampere University of Technology,33101 Tampere, Finlande-mail: [email protected]
J. AkolaCOMP Centre of Excellence, Department of Applied Physics,Aalto University, 00076 Aalto, Finland
J. KalikkaSingapore University of Technology and Design,8 Somapah Road, Singapore 487372, Singaporee-mail: [email protected]
J. KalikkaDepartment of Nuclear Science and Engineering,Massachusetts Institute of Technology, Cambridge, MA 02139, USA
R.O. Jones (B)
Peter Grünberg Institut PGI-1 and JARA/HPC, Forschungszentrum Jülich,52425 Jülich, Germanye-mail: [email protected]
R.O. JonesGerman Research School for Simulation Sciences,FZ Jülich and RWTH Aachen University, 52425 Jülich, Germany
© Springer International Publishing Switzerland 2015C. Massobrio et al. (eds.), Molecular Dynamics Simulationsof Disordered Materials, Springer Series in Materials Science 215,DOI 10.1007/978-3-319-15675-0_17
457

458 J. Akola et al.
17.1 Introduction
The 1960s saw a range of exciting developments in amorphous materials [1], one ofwhich was the much-cited paper of Ovshinsky [2] on the resistive switching in semi-conducting alloys. This was the beginning of the era of phase change (PC) materials.PC materials are based on the extremely rapid and reversible transition between theamorphous and crystalline form of nanosized “bits” in a very thin polycrystallinelayer, whose states must show sufficient contrast in resistivity or optical propertiesto be identified. It is clear that most materials do not satisfy these criteria, and greatefforts across more than 30years were necessary to identify and develop appropriatealloys. The original paper [2] discussed the alloy As30Ge10Si12Te48, and Te-basedalloys have been well represented ever since.
Alloys of the GexSbyTe1−x−y family are common in the PC world. GexTe1−x
alloys were the first to show real promise as PC storage media [3], and the widelystudied Ge2Sb2Te5 (GST-225) is used commercially in DVD-RAM (random accessmemory). There has been particular focus on the pseudobinary alloys along the tieline GeTe–Sb2Te3 in Fig. 17.1a, where GST-225 and Ge8Sb2Te11 (used in Blu-rayDisc memories) are well-known examples. Such alloys are denoted in Fig. 17.1 asGroup 1, and all have rock salt structures and numerous vacancies in the orderedphase [4]. Crystallization of amorphous bits in these materials usually begins fromsmall nuclei (Fig. 17.1b). Alloys near the Sb2Te3 end of the tie line crystallize morereadily, but have lower optical contrast than GeTe-rich alloys. Some compromisesare necessary in practice, and these will include the crystallization temperature [5].Sb-Te based alloys are also well represented in commercial PCM materials, often
Fig. 17.1 Phase diagram of PC materials and crystallization patterns. a The most commonly usedmaterials for optical recording are in groups 1 and 2. b Nucleation dominated recrystallization (asin GST), c growth-dominated recrystallization

17 The Prototype Phase Change Material Ge2Sb2Te5: Amorphous Structure … 459
with compositions that are near that of the eutecticmixture Sb70Te30, and are denotedas Group 2. Recrystallization in these alloys proceeds from the polycrystalline regionsurrounding the amorphous bit (Fig. 17.1c).
Central to our understanding of the properties of these materials is a knowledge ofthe structures of the different phases, but these are difficult to determine in binary orternary alloys with significant numbers of vacancies. It was noted as recently as 2005that “the local structural order of glasses in the ternary system GexSbyTe1−x−y isnot well established” [6]. Even the structure of the metastable, ordered phase of GSTis still open to question: Yamada [7] proposed that the metastable phase has a rocksalt structure with “Na” sites occupied randomly by Ge and Sb atoms and vacancies,and “Cl” sites by Te. Kolobov et al. [8], however, proposed that Ge and Sb atoms aredisplaced from their ideal positions, enabling the order-disorder transition to occuras an “umbrella flip” of Ge atoms from octahedral to tetrahedral positions. A modelof amorphous Ge1Sb2Te4 where a spinel structure (tetrahedral Ge) was comparedto the octahedral rock salt phase has also been studied [9], and x-ray fluorescenceholography of an epitaxial layer of GST indicated a cubic structure with tetrahedralsite symmetry about Ge atoms [10]. It is astonishing that PC materials have becomethe basis of commercially successful products with so much uncertainty about thestructures of the phases involved.
Density functional (DF) calculations are free of adjustable parameters, and theircombination with molecular dynamics [11] has had a major impact on materials sci-ence and chemistry, including chalcogenide materials. Nevertheless, their demandson computational resources restricted simulations on GST systems up to 2007 to rel-atively small unit cells (up to 56 atoms in [9], 108 atoms and 12 vacancies in [12],168 atoms in [13]) and time scales that are often much shorter than those measured(e.g. a total of 18 ps in [13]). In such cases, most of the atoms are near the “surface”of the simulation cell, and significant finite size effects are inevitable. Nevertheless,simulations on GST and other PC materials have the advantage that the physicaltime scale (several nanoseconds) is unusually short. This has encouraged us andother research groups to carry out extensive DF simulations on PC materials, partic-ularly GST alloys, and to take advantage of continuing improvements in computinghardware and software. It is now possible to simulate hundreds of atoms over timesthat approach the experimental time scale of both the quenching and crystallizationprocesses. The following article is restricted toGST (Group 1)materials, but it shouldreflect the sense of excitement that has accompanied this work.
17.2 Density Functional Calculations
The density functional (DF) formalism [14] is themost widely usedmethod for deter-mining electronic and structural properties of condensed matter that does not requireadjustable parameters. It is based on the electron density n(r) and reduces the prob-lem of determining ground state properties of an interacting system of electrons andions to the solution of single-particle Schrödinger-like equations. An approximation

460 J. Akola et al.
for the exchange-correlation energy Exc, one contribution to the total energy of thesystem, is unavoidable, but there has been substantial progress in this area in recentyears [15]. Crucial to the success of applications to PC materials has been the cou-pling of DF calculations to molecular dynamics (MD) [11], since the DF energysurfaces and forces can be used to determine the motion of the ions at a knowntemperature.
Most simulations of amorphous materials are started with a liquid sample at hightemperatures (typically above 3000 K), so that all memory of the initial solid config-uration is erased. It is important that cooling to the melting point and to room temper-ature and below be carried out as slowly as possible, as energetically unfavourableconfigurations may otherwise be frozen in. In the calculations described here, wehave used total simulation times of hundreds of picoseconds for samples of up to648 atoms. DF calculations of this scale are extremely demanding of present com-puter resources, but they do allow definite statements to be made concerning theconvergence of the simulation results as a function of sample size.
MD methods allow us to follow the coordinates Ri and velocities vi of all atomsthroughout the simulations, and insight into the local order can be found from thedistributions of the bond (θi jk) and dihedral angles (γi jkl ). The pair distributionfunction (PDF) g(r) is a spherically averaged distribution of interatomic vectors,
g(r) = 1
ρ2
⟨∑i
∑i �= j
δ(ri )δ(r j − r)
⟩, (17.1)
whereρ is the density. Partial PDF gαβ(r) can be calculated by restricting the analysisto the elements α and β. The local structure can also be characterized by the averagecoordination numbers, which are found by integrating gαβ(r) to the firstminima Rmin
nαβ =∫ Rmin
0dr 4πr2ραβgαβ(r). (17.2)
The partial density ραβ = ρ√
cαcβ , where cα and cβ are the concentrations of theelements. We calculate the structure factor S(Q) by Fourier transforming the gαβ(r)
to give the partial structure factors:
Sαβ(Q) = δαβ + ραβ
∫ ∞
0dr 4πr2
[gαβ(r) − 1
] sin(Qr)
Qr. (17.3)
These quantities can then be weighted according to the atomic fractions cα andform factors fα(Q) (for x-rays) or the Q-independent coherent scattering lengths bα
(for neutrons) for direct comparison with experiment.The cavity analysis is performed by introducing the concepts shown in Fig. 17.2
[16]. A vacancy domain (I) is a region where the minimum distance to a nearby atomis larger than a given cutoff (here 85% of the average Ge-Te distance, 2.8 Å), and

17 The Prototype Phase Change Material Ge2Sb2Te5: Amorphous Structure … 461
Fig. 17.2 Schematic formfor 2D-cavity
each domain is characterized by the point where the distance to all atoms is greatest.The cavity centre is found by locating the largest sphere that can be placed insidethe cavity, and the centres can be used to calculate RDF, including cavity-cavitycorrelation functions. Finally, a vacancy cell (II) is analogous to the Wigner-Seitzcell in crystals or Voronoi polyhedra in amorphous materials and can be determinedon an appropriatemeshwith respect to the surface points of the vacancy domains. Theimportance of cavities and their relatively small number provide additional incentivesfor choosing large simulation cells.
Dynamical information includes thevelocity-velocity autocorrelation functionCv:
Cv(t) = 1
N
N∑i=1
〈vi (0) · vi (t)〉〈vi (0) · vi (0)〉 , (17.4)
where N is the number of particles. The sampling can be improved by averagingthe autocorrelation function over several windows where the starting time (vi (0))is varied. The self-diffusion constant for all atoms or those of species α can bedetermined from Cv:
Dα = 1
3
∫ ∞
0dt Cv(t) (17.5)
or directly from the coordinates Rα
Dα = limt→∞
⟨|Rα(t) − Rα(0)|2⟩6t
, (17.6)
where the average is over all atoms of species α. Vibration frequency distributions(power spectra) can be obtained by Fourier transforming the velocity-velocity auto-correlation function obtained from long trajectories at the temperature in question.

462 J. Akola et al.
17.3 Results and Discussion
The structures and their changes with time and temperature provide a rich source ofinformation for comparisonwith experiment, andwedo this now for severalGe/Sb/Tecompounds. We provide most details for GST-225, a prototype PC material that isoften referred to simply as GST. In these materials it is convenient to separate thecomponents into types A (Ge, Sb) and B(Te). Details of all calculations can be foundin the original articles.
17.3.1 Ge2Sb2Te5 (GST-225)
The amorphous (a-), liquid (-) and crystalline (c-) phases of Ge2Sb2Te5 have beenstudied using a sample of 460 atoms and 52 vacancies in the unit cell over a total of400 ps [16, 17]. The starting geometry (Fig. 17.3a) was a rock salt crystal structure,with the Na sites occupied randomly by Ge and Sb atoms (20% each), and the Clsites by Te atoms [7]. At the end of the simulation (300 K), the amorphous structurein Fig. 17.3b was found. Cavities are shown by light blue isosurfaces, but we notethat the multivacancy in Fig. 17.3b is just one of numerous cavities in a-GST.
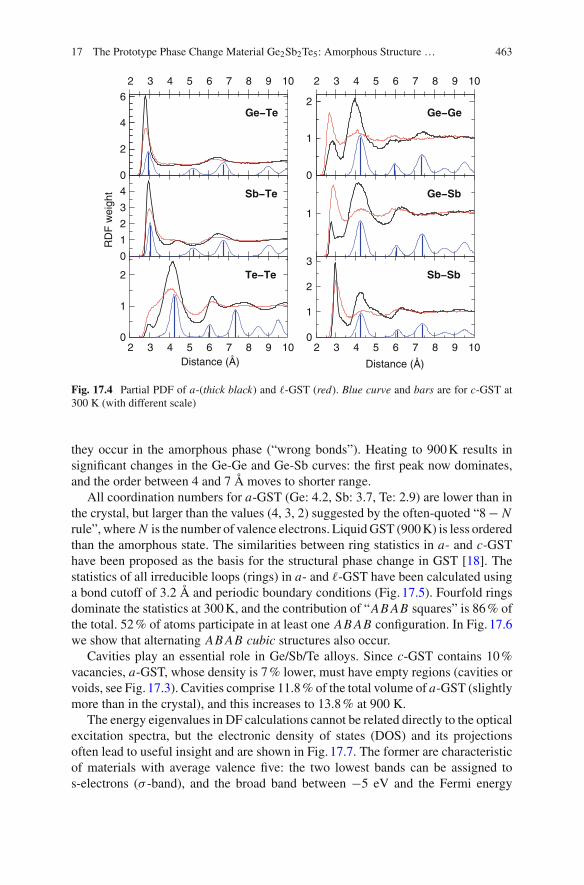
A striking (and unexpected) feature of the partial PDF (Fig. 17.4) is the medium-range order found among Te atoms up to 10 Å, with peaks at 4.16 and 6.14 Å, aminimum at 5.4 Å, and additional maxima at 7.8 and 9.8 Å. The weak maximum at2.95 Å and the low coordination number (0.3) show that there are few Te-Te bonds,and there is no significant order at 900 K. Te atoms prefer coordination with Ge/Sb,with Te forming the second-neighbour shell. Thermal fluctuations in c-GST lead tobroadening of the Bragg peaks. The “homopolar” Ge-Ge, Ge-Sb, and Sb-Sb bondsin the three phases are shown in Fig. 17.4. While these bonds are absent in c-GST,
Fig. 17.3 System of 460 atoms and 52 vacancies in a c-GST and b a-GST with one cavity high-lighted. Red Ge, blue Sb, yellow Te. Vacancies/Cavity are shown as light blue isosurfaces
17 The Prototype Phase Change Material Ge2Sb2Te5: Amorphous Structure … 463
0
1
2
3
2 3 4 5 6 7 8 9 10
Sb−Sb
Distance (Å)
0
1
2
2 3 4 5 6 7 8 9 10
Ge−Ge
1
Ge−Sb
0
1
2
2 3 4 5 6 7 8 9 10
Te−Te
Distance (Å)
0
2
4
6
2 3 4 5 6 7 8 9 10
Ge−Te
0
1
2
3
4
RD
F w
eigh
t Sb−Te
Fig. 17.4 Partial PDF of a-(thick black) and -GST (red). Blue curve and bars are for c-GST at300 K (with different scale)
they occur in the amorphous phase (“wrong bonds”). Heating to 900K results insignificant changes in the Ge-Ge and Ge-Sb curves: the first peak now dominates,and the order between 4 and 7 Å moves to shorter range.
All coordination numbers for a-GST (Ge: 4.2, Sb: 3.7, Te: 2.9) are lower than inthe crystal, but larger than the values (4, 3, 2) suggested by the often-quoted “8− Nrule”, where N is the number of valence electrons. LiquidGST (900K) is less orderedthan the amorphous state. The similarities between ring statistics in a- and c-GSThave been proposed as the basis for the structural phase change in GST [18]. Thestatistics of all irreducible loops (rings) in a- and -GST have been calculated usinga bond cutoff of 3.2 Å and periodic boundary conditions (Fig. 17.5). Fourfold ringsdominate the statistics at 300K, and the contribution of “AB AB squares” is 86% ofthe total. 52% of atoms participate in at least one AB AB configuration. In Fig. 17.6we show that alternating AB AB cubic structures also occur.
Cavities play an essential role in Ge/Sb/Te alloys. Since c-GST contains 10%vacancies, a-GST, whose density is 7% lower, must have empty regions (cavities orvoids, see Fig. 17.3). Cavities comprise 11.8% of the total volume of a-GST (slightlymore than in the crystal), and this increases to 13.8% at 900 K.
The energy eigenvalues in DF calculations cannot be related directly to the opticalexcitation spectra, but the electronic density of states (DOS) and its projectionsoften lead to useful insight and are shown in Fig. 17.7. The former are characteristicof materials with average valence five: the two lowest bands can be assigned tos-electrons (σ -band), and the broad band between −5 eV and the Fermi energy

464 J. Akola et al.
Fig. 17.5 Ring statistics for a-GST (300 K) and -GST (900 K). AB AB refers to even-memberedrings with bond alternation
Fig. 17.6 A cubic AB AB subunit in a-GST. A Ge-Ge bond (between the cube and its neighbours)and an Sb-Sb bond are evident. Cavities occur near the cube, and a threefold coordination is typicalfor Te
has p-character (π -band). The calculations for c- and a-GST show band gaps ofaround 0.2 eV at the Fermi energy. Photoemission measurements have shown thatthere are significant differences in the valence band DOS and the core levels of a-and c-GST and other Ge/Sb/Te alloys [19]. The differences measured by hard x-rayphotoemission spectroscopy (XPS [19]) are compared with our results in Fig. 17.7.The agreement is remarkably good, particularly for the DOS difference (Fig. 17.7c).
The distribution of vibration frequencies in condensed matter and molecules pro-vides important structural information and can be calculated: (a) from the Fouriertransform of the velocity-velocity autocorrelation function, calculated from trajecto-ries of 6000 time steps of 3.025 fs each, and (b) from the dynamical matrix calculatedfrom the second-order energy derivatives of a well-equilibrated structure at 0 K. Theresults for a-GST (Fig. 17.8) show that the results for the two methods agree verywell. The most pronounced features are peaks near 60 and 150 cm−1 and a tail forfrequencies above 180 cm−1. Projections onto the vibrations of different elementsand structural units show that the tail is associated with the vibrations of the lightestelement Ge, particularly atoms that are fourfold coordinated.
The original DF calculations [16] agreed reasonably well with measured S(Q)
and g(r) for GST, [18] but several details were open to improvement. In particular,

17 The Prototype Phase Change Material Ge2Sb2Te5: Amorphous Structure … 465
Fig. 17.7 a XPS valence band spectrum of c-(thick black) and a-GST (red) ([19], upper panel)and the calculated electronic DOS (lower panel). b Theoretical DOS of a-GST projected ontoatom-centred s-, p-, and d-components and atomic types. c DOS difference between c-GST anda-GST [from (a), positive values imply a larger weight on a-GST]. d Electronic DOS of -GST.The vertical dashed lines mark the Fermi energy
Fig. 17.8 Calculatedvibrational density of statesfor a-GST (VDOS, lowestcurve), and power spectrafrom simulation trajectoriesfor a-GST, for Ge, Sb and Te,and for fourfold coordinatedGe atoms (“4-Ge”). Curveshave maxima at 1.3 (a-GST)or 0.65 (projections)
0
0.5
1.0
1.5
2.0
2.5
3.0
3.5
4.0
0 50 100 150 200 250 300
Pow
ersp
ectr
a
(cm−1)
v−v ac
Ge
Sb
Te
4−Ge
VDOS
a−Ge2Sb2Te5 (300 K)

466 J. Akola et al.
we had used the approximation of Perdew, Burke and Ernzerhof (PBE) [20] for Exc,and the bond lengths that resulted were longer than those measured. A valuablecollaboration between theory and experiment began when we discovered that thestructure obtained in the original reverse Monte Carlo (RMC) fit to the x-ray diffrac-tion (XRD) measurements [18] gave rise to a metallic density of states, i.e. no bandgap at the Fermi energy. We combined the strengths of theory and experiment withthe goal of finding a structure that:
• reproduces the measured S(Q) and the total pair distribution function g(r) forXRD and/or neutron diffraction,
• has bond lengths that are are consistent with EXAFS measurements and not arti-ficially short,
• has an electronic structure with a band gap at the Fermi energy,• has a DF total energy close to the minimum.
We do this by combining data from high-energy XRD [18] and XPS measurementson a- and c-GST [19] with DF simulations of a 460-atom sample over hundreds ofpicoseconds. This strategy is related to the “experimentally constrained molecularrelaxation” (ECMR) of Biswas et al. [21, 22].
We adopted the approximation of Tao et al. (TPSS) [15], which has orbital-dependent terms that increase the computing demands, but the resultant structuresand energy differences are generally better for extended systems [15]. The structuresof c- and a-GST [16] were re-optimized using the TPSS functional, and the PDFfor c-GST agrees very well with XRD measurements (Fig. 17.9). Both EXAFS andXRD results indicate the presence of the double maximum in the PDF, and the calcu-lated Ge-Te and Sb-Te bond distributions have double maxima that were not evidentin the PBE results. The shorter Ge-Te and Sb-Te bond lengths (2.84 and 2.93 Å,respectively) agree very well with EXAFS values (2.83 and 2.91 Å) [8]. The longerbonds have maxima above 3.1 Å. TPSS bonds in a-GST are 1–2 % shorter than inthe calculations using the PBE functional, and the coordination numbers (Ge: 3.9,Sb: 3.5, Te: 2.7) are lower than in [16] (4.2, 3.7, and 2.9). The cohesive energy is2.62 eV, and c-GST is 58 meV/atom more stable than a-GST.
The re-optimized a-GST geometry was taken as input for RMC refinement usingthe experimental x-ray total structure factor S(Q). The experimental S(Q) can bereproduced very well with a range of input parameters, but RMC simulationswithoutconstraints on the bond angles always led to a metallic DOS, even when the initialstructure was semiconducting. A semiconducting structure that satisfies the x-raystructural information for a-GST can be obtained in practice only by using an iterativescheme where the bond angle distributions Te-Ge-Te, Te-Sb-Te, Ge-Te-Ge, Ge-Te-Sb, and Sb-Te-Sb are constrained to have values close to those found in the DFcalculations. The TPSS bond lengths are slightly shorter than PBE values, but the useof the PBE approximation instead of TPSS would lead with the present optimizationscheme to very similar structures.
The RMC optimization of the TPSS structure yields a structure factor S(Q) inexcellent agreement with XRD results (Fig. 17.9a), with minor differences in ampli-tude near the first two peaks. The excellent description of the high-Q region is

17 The Prototype Phase Change Material Ge2Sb2Te5: Amorphous Structure … 467
Fig. 17.9 a Structure factorS(Q) in a-GST. Green XRD[18]; black calculated forRMC-optimized geometry.Inset data for high Q values.b Total PDF (XRD weights)
(a)
(b)
important, because the short-range atomic correlations in the XRD pair distributionfunction g(r) (Fig. 17.9b) is obtained by Fourier transforming Q[S(Q) − 1] and isaffected strongly by the high-Q portion of S(Q). The calculated g(r) follows theexperimental curve almost perfectly with small deviations near the first peak, andthe total energy is only 79 meV/atom higher than that of the DF energy minimum.The electronic DOS shows a band gap at the Fermi level.
The ring statistics of amorphous GST-225, Ge8Sb2Te11, and GeTe are comparedin Fig. 17.10. There are many four-membered rings and few triangular configura-tions in all cases. As in GST-225, most of the four-membered rings in Ge8Sb2Te11show AB alternation, confirming that the basic building blocks in the amorphousand crystalline phases are AB AB squares [16, 23, 24]. The odd-even alternation isapparent in GST-8211 and GST-225, and the ring distributions of these twomaterialsare strikingly similar (Fig. 17.10).
For the optimized structure of a-GST-8211, cavities occupy 12.4% of the totalvolume, i.e. the small increase in Sb content is accompanied by a dramatic increase in

468 J. Akola et al.
Fig. 17.10 Statistics of irreducible rings (300 K) in Ge2Sb2Te5, Ge8Sb2Te11, and GeTe alloys.AB AB configurations refer to alternation of atomic types A (Ge, Sb) and B (Te). The bond cutoffdistance is 3.2 Å. Results for Ge2Sb2Te5 and GeTe from [16]
the number of cavities to a value near that in a-GST-225. The coordination numbersaround the cavity centers are Ge: 1.3, Sb: 0.4, and Te: 3.7, and other cavities: 0.2.Cavities are then surroundedmainly by Te atoms, andGe is amore common neighborthan Sb. These features reflect the small Sb content and the underlying cubic structurethat resembles the crystalline phase.
17.3.2 As-deposited Versus Melt-quenched GST-225
Atomistic simulations on phase-change materials have focused on melt-quenched(MQ) samples, where a liquid sample is cooled rapidly. Experimental samples areoften deposited on a substrate, and the structure is likely to differ. We have developeda method to generate an “as deposited” (AD) sample with 648 atoms at 300 K [25]and have compared the results with those for a 460-atom MQ sample, refined asdescribed above with respect to XRD and XPS data [26].
The simulations were carried out at 300 K, beginning with a random template of36 atoms in an area of 27.61 × 27.61 Å (layer thickness 1.4 Å). These atoms werefixed during deposition to minimize relaxation effects near the base of the system.17 layers of 36 atoms were then deposited on the sample and allowed to relax for5–10ps each. The vertical box dimension was adjusted for each layer to minimizethe interaction with the slab replica (vacuum region 10 Å). Deposition took a totalof 91 ps, and the result is shown in Fig. 17.11. There is limited mobility at 300 K,but some atoms mix with layers deposited previously, and the lower coordinationof Te enhances its concentration at the surface. The final vertical dimension of the648-atom sample is 15% larger than in the bulk.

17 The Prototype Phase Change Material Ge2Sb2Te5: Amorphous Structure … 469
The model AD system was then prepared by releasing the 32 template atoms anddecreasing the vertical box size (19 steps at 300 K) to obtain a cubic supercell (size27.61 Å, density 0.0308 atoms/Å3). The process lasted 67 ps in steps of 3–4ps, andthe system was equilibrated for 34ps before data collection (25ps). The pressurewas small (2.9± 1.8 kbar) at the final (experimental) density, and the final structurewas optimized at 0 K (Fig. 17.11c–d). The structure of the MQ sample [26] does notcorrespond to a DF energy minimum, so we performed a simulation at 300K usingthe same functional (PBEsol [27]) and atomic density as for AD. Initialization (5 ps,300 K) was followed by data collection (35 ps). The MQ structure is 11 meV/atommore stable than AD and 58 meV/atom less stable than the rock salt structure.
The structure factors S(Q) for the AD andMQ samples are compared with exper-iment in Fig. 17.12. The curves for AD and MQ are strikingly similar, and the agree-ment with the experiment is very good. We note only that the calculated heightsfor the first two peaks (2.1 and 3.3 Å−1) are somewhat low, and the shape of thethird peak differs slightly. The calculated structures are from DF/MD simulations at300 K, and deviations from experiment are caused in part by the approximations inthe Exc functional [25].
The electronic densities of states (DOS) in AD and MQ are very similar, withband gaps of 0.2–0.3 eV at the Fermi energy. The DOS profiles are in satisfactoryagreement with XPS data [19], the most significant difference being near the DOSminimum around −10 eV between two σ -bands.
The PDF of both samples [25] show that Ge-Te and Sb-Te bonds dominate (ABalternation). EXAFS measurements [8, 28, 30] have shown that Ge-Te distancesshrink upon amorphization (2.61–2.63 Å), suggesting that Ge may have tetrahedralcoordination. This differs from earlier DF simulations, which found mostly (dis-torted) octahedral configurations for Ge with Ge-Te bonds of 2.77–2.78 Å. Tetra-hedrally bonded Ge atoms also occur. The discrepancies in the Ge-Te bond lengthappear to have two causes: (a) Most approximations for Exc tend to overestimatebond lengths by 2–3 %, but the use of the PBEsol functional here reduces this error(the Ge-Te PDF maximum is at 2.72 Å in MQ). (b) Sample preparation is crucial:
Fig. 17.11 ADsample of a-GST at 300K. a Top view after 17 added layers (648 atoms). The upper-most atoms within 1.2nm are highlighted, and the red tetrahedra mark Ge atoms with tetrahedralcoordination. Ge, red; Sb, blue; Te, yellow. b Side view of the final surface. c-d Two perspectivesof final sample. Cavities (cyan isosurfaces) comprise 16.3% of the total volume

470 J. Akola et al.
Fig. 17.12 a Structure factor S(Q) of AD (black) and MQ (blue) samples at 300 K, and XRD(red). The calculated S(Q) are shifted by 0.4. b Electronic DOS of AD and MQ samples. Verticaldashed line marks band gap separating the σ -band with Te-5s character
AD has more tetrahedral Ge atoms, and the Ge-Te maximum shifts to 2.69 Å. Ge-Gebonds (2.52 Å), which correspond mainly to tetrahedral Ge atoms here, agree wellwith experiment (2.47 ± 0.03 Å) [28, 29]. Sb-Te bond lengths change little uponamorphization, and the first maximum of AD and MQ is at 2.89 Å.
The other PDF show clear differences between the samples, since the number of“wrong bonds” is significantly larger for AD. This is reflected in the Ge-Te and Sb-TePDF (AB bonds) as weaker first maxima and emerging second maxima at 4.2 Å. Thecorresponding partial coordination numbers [25] show that Ge and Sb have twice asmany wrong bonds (1.1 on average) as Te (including Te-Te bonds), although morethan half of the atoms are Te. The total coordination numbers for AD are Ge: 4.2, Sb:3.7, andTe: 2.8. Earlierwork onMQsamples [16, 23, 26] indicated that the total coor-dination numbers of Sb and Te in a-GST do not satisfy the “8− N rule” of covalentlybonded networks, and additional support for this conclusion is found by calculatingthe bond orders (number of chemical bonds) for each interatomic connection [25].
The AD structure of a-GST (648 atoms, over 200ps) differs fromMQ (460 atoms,[26]) in essential ways: (1) The environment of Ge atoms is predominantly tetrahe-dral in AD and disordered octahedral in MQ, and our results for the Ge-Te bondlengths agree with EXAFS measurements [8, 28, 30]. This resolves the contradic-tion between measured and bond lengths and those found in earlier DF calculations(2) homopolar and Ge-Sb bonds are more common and reduce the number of AB ABsquares, which are needed for rapid crystallization. Sb and Te aremore highly coordi-nated than expected from the “8−N rule”, so that a-GST cannot be seen as a covalentnetwork glass. The PBEsol functional gives improved results, and both samples tendto form fewer Te-Te bonds, and MQ is 11 meV/atom more stable than AD. Theirstructure factors and electronic properties are similar, so that distinguishing betweenthem using XRD alone remains a challenge.

17 The Prototype Phase Change Material Ge2Sb2Te5: Amorphous Structure … 471
17.4 Crystallization of Amorphous Ge2Sb2Te5
The essential feature of PC materials is the ultrafast phase transition between amor-phous and crystalline structures that occurs on a nanosecond time scale. In the previ-ous sections, we have discussed extensively the amorphous and crystalline structuresof GST and their properties. These correspond to the starting and end points for theactual phase transition, which are crucial to understand the function of PC materials.We nowpresent results for the nucleation-driven crystallization process ofGST usingDF calculations combined with MD [31]. A sample of a-GST with 460 atoms wasstudied at 500, 600, and 700 K, and a second sample of 648 atoms was simulated at600K. In all cases we used a fixed crystalline seed (58 atoms, 6 vacancies) in order tospeed up the crystallization process. More recent experience has shown that the timescale for the crystallization is of the order of several nanoseconds for these systemsizes in the absence of a fixed seed, while those here are of the order of 0.3–0.6ns.This means that we cannot discuss the onset of nucleation, but this is also true inthe case of smaller systems (<200 atoms) discussed by other groups. In very smallsystems, periodic boundary conditions bias the process severely. Our larger samplesreduce finite-size effects, and we show the effect of choosing different annealingtemperatures. Simulations of this scale (up to 648 atoms over 1ns) are near the limitof present day DF/MD calculations.
17.4.1 Simulation Details
The simulations follow the pattern described in previous sections. The CPMD pro-gram is used with Born-OppenheimerMD and a time step of 3.0236 fs (125 a.u.). Weemploy an NVT ensemble with cubic simulation cell, periodic boundary conditions,and a single point (k = 0) in the Brillouin zone. Simulations have been performed ontwo samples of a-GST (Fig. 17.1), with 460 and 648 atoms, respectively. We embed-ded in both a crystalline ‘seed’ of 4 × 4 × 4 sites (13 Ge, 13 Sb, and 32 Te atoms,6 vacancies) in a rock salt structure with lattice constant of 3.0 Å. The structure ofthe crystallite adopted the model of Yamada [7], which assumed that one sublatticeof the rock salt structure comprises Te atoms, the other a random arrangement ofGe, Sb, and vacancies. We removed the atoms of the amorphous structure inside thisvolume, fixed the coordinates of the seed, and optimized the resulting structure.
For the 460-atommodel, the initial geometry used was the structure of a-GST thatgave excellent agreement betweenDF simulations and experimental x-ray diffraction(XRD) and x-ray photoemission spectroscopy (XPS) measurements [26]. With fixedcoordinates of the seed, we performed DF/MD simulations at 500, 600, and 700Kover 600ps (500/600 K) and 350 ps (700 K). The path to crystallization at 600Kis shown in Fig. 17.13(a–d). The amorphous and crystalline densities of GST differ,and the size of the cubic simulation cell was changed from 24.629 Å (amorphousdensity of 0.0308 atoms/Å3) to 24.060 Å (crystalline density of 0.0330 atoms/Å3)in five steps of 0.114 Å.

472 J. Akola et al.
For the 648-atom structure, the initial coordinates of the 648-atom sample wereobtained from a previous computer-aided deposition simulation [25]. The size of thecubic box was reduced in two steps from 27.736 Å (amorphous density) to 27.150 Å(density 0.0324 atoms/Å3), which is incommensurate with the rock salt structurewith this number of atoms. Complete crystallization was not expected and was notfound at 600 K (see Fig. 17.13f), but the crystallite grew until making contact withits replica at the simulation cell boundaries.
17.4.2 Bond Orientational Order and Percolation
Crystallization is the ordering of a disordered system. In order to follow this process,it is necessary to label atoms which have a “crystalline” local environment. Thisis done by quantifying the directional order of a system of bonds for each atom.Angular correlations at an atomic scale can be achieved by projecting interatomicvectors ri j onto a basis of spherical harmonics Ylm
(ri j
), and the order parameter of
Steinhardt, Nelson, and Ronchetti has proved to be valuable in several contexts fordifferent symmetries [32].
Q̄l (i) =√√√√ 4π
2l + 1
l∑m=−l
∣∣Q̄lm (i)∣∣2, (17.7)
Fig. 17.13 Visualization of a–d the 460-atom and e–f 648-atom system at different stages ofcrystallization at 600 K. The atoms with crystalline local environment are highlighted with ball-and-stick. The fixed cubic seed is at the centre of (a) and (e). Green Ge, purple Sb, and orange Te
17 The Prototype Phase Change Material Ge2Sb2Te5: Amorphous Structure … 473
where
Q̄lm (i) = 1
Nb (i)
Nb(i)∑k=0
Qlm (k) , (17.8)
and Nb(i) includes the atom i and its neighbors, thereby averaging over an atom andits first coordination shell and including intermediate range order. The single atomquantity Qlm(i) is
Qlm (i) = 1
N (i)
N (i)∑j=1
Ylm(ri j
)(17.9)
where N (i) is the number of neighbors for atom i . For cubic structures, the firstnonzero value of Q̄ is for = 4, and we use this to define a crystalline atom as onefor which Q̄ ≥ 0.6.
Once we have obtained classification scheme for atoms that have a crystallinelocal environment, it is useful to analyze their connections between these atoms.In particular, we are interested in continuous paths over these atoms (bonds) whichextend over the whole system, i.e. percolation. The connection between statisticalmechanics, especially phase transitions, and percolation has a vast literature. In thecase of GST, simultaneous measurements of electrical resistivity and optical reflec-tivity showed a significant influence of percolation on electrical properties, but anegligible influence on optical properties [33]. Here, we have analyzed percolationof the simulation trajectories by locating crystalline atoms as defined above and locat-ing continuous paths of such atoms from an atom i to the same atom in a neighboringcell in all three Cartesian directions (for bonds of maximum length 3.20 Å).
17.4.3 Results for Nucleation-Driven Crystallization
We observed complete crystallization for the 460-atom simulations at 600K and700Kwithin thegiven time scale, and the former simulation is shown inFig. 17.13a–d.Crystal growth around the seed was evident in the simulation at 500K and in the648-atom simulation at 600 K Fig. 17.13e–f, but crystallization was not completewithin 600 ps. It should be noted that 500K is already within 100K of the experi-mental crystallization temperature (onset), whereas the process occurs in practice athigher temperatures (laser heating, current).
The amorphous phase is a metastable state, and crystallization results in a lowerenergy. Figure17.14 shows the DF energy, the fraction of crystalline atoms (viaorder parameter Q̄4 as described previously), and the number of AB AB squares inall simulations. Crystallization is faster at 700K than at other temperatures, with thecrystalline fraction increasing most rapidly between 150–205 ps., and it is completeat 600K within 600 ps. The number of AB AB squares and the strength of theBragg peaks correlate well with the number of crystalline atoms. At 600 K, thelatter increases by 40% between 330 and 435 ps, and it changes by 50% between150 and 205 ps at 700 K. The more rapid crystallization at higher temperatures is

474 J. Akola et al.
consistent with the higher atomic mobility and with the results of recent ultrafastheating calorimetry measurements [34]. For the individual elements, the fraction ofcrystalline atoms is lowest inGe until near the end of crystallization at both 600K and700 K, which is related to the coexistence of tetrahedral (minority) and octahedralGe in the amorphous state [16, 23]. The tetrahedral component of tetrahedral Gebecomes negligible during the crystallization process, and the Ge fraction becomescomparable to the other two.
The gradual transition between amorphous and crystalline structures is shown inthe evolution of the partial PDF at 600K in Fig. 17.15. The crystalline seed givesrise to Bragg peaks at 3.00, 4.24, 5.20, 6.00, 6.71 and 7.35 Å, which are enhancedby crystallization. The increase is most rapid between 280–300 and 480–500 ps at600 K (Fig. 17.15), and the rapid increase at 700K occurs between 80–100 ps and180–200 ps. The total coordination numbers were calculated from the PDF for Ge,Sb, and Te atoms at the beginning and end of the 460-atom simulations (500 K,600 K, 700 K), and they show the expected change from amorphous to crystallinevalues for the samples that order and smaller changes otherwise.
Fig. 17.14 a Total energy,b fraction of crystallineatoms, and c number ofAB AB rings/atom in eachsimulation. Thediscontinuities in slope(steps) in c are due tochanges in supercell size

17 The Prototype Phase Change Material Ge2Sb2Te5: Amorphous Structure … 475
PDFs can be constructed for all bond types, and Ge-Te and Sb-Te bonds are by farthe most abundant (AB alternation). “Wrong bonds” (Ge-Ge, Ge-Sb, Te-Te, and Sb-Sb) are those that do not occur in a widely accepted model of the metastable cubicstructure, [7] and are present throughout all simulations. The existence of wrongbonds is evident at 600K in maxima in the partial PDF (Fig. 17.15) of the fully crys-tallized samples. The number of these bonds decreases during all simulations, mostrapidly during fast crystallization, and are largest in the systems that do not crystal-lize completely (460-atom at 500 K, 648-atom at 600 K). At 700K, the mobility andthe ability to find energetically favorable configurations are higher than at 600 K,resulting in fewer wrong bonds in the fully crystallized structure. There are only four
0
1
2
3
4
5
6
2 4 6 8
g(r
)
0
1
2
3
4
5
6
2 4 6 8
0
1
2
3
4
5
6
7
2 4 6 8
g(r
)
0
1
2
3
4
5
6
2 4 6 8
0
1
2
3
4
5
6
7
2 4 6 8
g(r
)
Distance (Å)
0
1
2
3
4
5
6
2 4 6 8
Distance (Å)
Ge-Ge Ge-Sb
Ge-Te Sb-Sb
Sb-Te Te-Te
Fig. 17.15 PDFof atompairs in 600K simulation. Each plot is the average over 20 ps of a trajectory.Red 80–100 ps, green 180–200 ps, blue 280–300 ps,magenta 380–400 ps, black 480–500 ps, orange580–600 ps. Successive plots are shifted by 0.5. The vertical lines correspond to the fixed crystallineseed with lattice constant of 3.0 Å

476 J. Akola et al.
Ge-Ge bonds near the end, but the first peak shows an unusually short bond less than2.5 Å.
Percolation measures the connectivity of the growing crystallite with its replica,and it can be analyzed from the simulation trajectories in all three directions. Theresults for three temperatures of the 460-atommodel are shown inFig. 17.16.The sim-ulations began with the same structure, but no preferred direction for crystal growthwas found. The order of occurrence is z-, y-, and x-directions at 600K, and x-, z-, andy-directions for 700 K. Furthermore, percolation is present in the 500K simulation intwo directions, despite the fact that the system did not crystallize fully. Similarly, the648-atom system is found to percolate at 600K in all three directions (with some on-off character) although the system does not crystallize and the unit cell does not evenmatch with the dimensions of the crystal structure. As a general feature, we note thatpercolation can be achieved with as few as ∼20 % of the atoms being “crystalline”,and its onset occurs well before the critical stage of crystallization. Percolation isevident in Fig. 17.13b–c, where the crystallite has reached the cell boundaries in the460-atom simulation at 600 K, and this leads to a network of periodic images of thesimulation cell prior to a rapid collapse to the crystalline state (∼350–435 ps).
The evolution of crystallization is also apparent in the mean-square displace-ment (MSD) of the atomic coordinates from the starting structure (Fig. 17.17). Thereshould be no atomic diffusion in a crystalline material, and changes in MSD slowdown and eventually stop as crystallization occurs. The order of Ge and Sb varies:Sb is slightly more mobile than Ge at 500K until ∼500 ps, where the MSD of Geincreases rapidly. At 600 K, Ge has a higher MSD than Sb, while the reverse is trueat 700 K. Furthermore, we have observed that Sb has a higher mobility in the liquid
Fig. 17.16 Size of percolating crystalline cluster as a function of time. Left, middle and rightcolumns are 500, 600 and 700K simulations, respectively. Top, middle and bottom rows are perco-lation along x , y, and z axes, respectively

17 The Prototype Phase Change Material Ge2Sb2Te5: Amorphous Structure … 477
(900K) [16]. The standard deviation of the MSD of individual atoms σ (M SD) (orthe fraction σ (M SD) /M SD) displays that there is awide range of atomicmobilitiesin individual elements, e.g. for Ge atoms at 600K and Sb atoms at 700K.On the otherhand, Sb atoms at 600K and Ge atoms at 700K have less variance than Te atoms.
Ge and Sb atoms are generally more mobile than Te. Atoms crystallizing in thefirst shell outside the seed move less than atoms crystallizing in the second shell, andcrystal growth is faster in the direction parallel to the crystal lattice alignment of theseed. Some atoms move very little, while others diffuse far during the simulations,as shown for σ (M SD) /M SD (Fig. 17.17). The motion of individual atoms is aninteresting aspect of the crystallization process, and examples of mobile Ge/Sb withalmost stationary Te, and the reverse, can be found. Atoms can move long distancesduring crystallization, breaking and forming chemical bonds. There is no simple
Fig. 17.17 MSD for allatoms and for each elementat a 500 K, b 600 K, andc 700 K. Vertical dashedlines denote changes in boxsize. Insets showσ (M SD) /M SD. Fixedatoms were excluded
1
2
3
4
5
6
7
8
9
10(a)
(b)
(c)
MS
D (
Å2)
allGeSbTe
5
10
15
20
0 100 200 300 400 500 600
MS
D (
Å2)
5
10
15
20
25
30
35
40
0 50 100 150 200 250 300 350
MS
D (
Å2)
Time (ps)
0
5
10
0
10
20
0
20
40

478 J. Akola et al.
Fig. 17.18 Variation of total cavity volume in 460-atom simulations. a 600 K, b 700 K. Verticaldashed lines show changes in box size, shaded areas correspond to the periods of fastest crystal-lization [325–450 ps in (a) and 150–200 ps in (b)]
concerted diffusionlessmechanism, such as the umbrella flipmodel, that is consistentwith these findings.
The results in Figs. 17.17 show that crystallization is favored by the mobilitybrought by higher temperatures. Recent ultrafast differential scanning calorimetrymeasurements by Orava et al. [34] showed the highest crystal growth velocity at670K, which is consistent with the faster process rate in our simulations at 700 K.The diffusion constant of Sb is highest above 700 K (as for liquid GST at 900 K[16]), indicating that Sb is important in processes at higher temperatures. The numberof AB AB squares correlates with the number of crystalline atoms, and they havebeen considered crucial to the speed of crystallization [16, 24]. However, thesestructural units can break and re-form during crystallization [31, 35]. Furthermore,the original fixed seed of AB motif embedded in an amorphous surrounding raisesthe question of its stability, and we have performed an unconstrained MD simulationof the initial seeded structure at 600 K. This resulted in a reduction of 20–30 % ofthe total number of AB AB squares within the first 30 ps. The remaining squareswere scattered throughout the sample and did not form a crystallite. However, as ourmore recent simulations have shown, this unconstrained system still bears a memoryeffect that affects its crystallization properties.
The empty regions in space (vacancies, cavities), reflect the arrangements of thesurrounding atoms. The existence of cavities in both amorphous and crystallinephases is characteristic of materials in the (GeTe)1−x (Sb2Te3)x family [4], and it iswidely assumed that they play an essential role in the rapid phase changes that canoccur. The crystalline phase of GST has 10% vacancies (cavities) and 7% higherdensity than the amorphous phase, and it is natural to expect changes in the cavity

17 The Prototype Phase Change Material Ge2Sb2Te5: Amorphous Structure … 479
Fig. 17.19 Radialdistribution of cavity centresfrom centre of seed. a 600 Kand b 700 K simulation.Dashed vertical lines showthe distances to nearest andfarthest edges of the seed
0
1
2
3
4
5
6
Cav
ities
(ar
b.u.
)
50−100 ps200−250 ps350−400 ps500−550 ps
0
1
2
3
4
0 2 4 6 8 10 12 14 16 18 20
Cav
ities
(ar
b.u.
)
Distance (Å)
50−100 ps150−200 ps250−300 ps320−350 ps
(a)
(b)
volumes upon crystallization. Figure17.18 shows the evolution of total cavity volumein the 460-atom simulations at 600K and 700K. The box size is adjusted smaller dur-ing the course of the simulation, and this is associated with the slight downward trendprior to crystallization. The variation for constant cells (e.g. 0–100 ps, 200–300 ps,etc.) is not large at 600K. The total cavity volume changes little during the rapid stageof crystallization, but there is a small increase towards the end from 400–450 ps and150–200 ps at 600 and 700 K, respectively. The overall volume reduction from theamorphous to crystalline state is significant, of the order of 1/3, which is consistentwith the higher density and smaller fraction of cavities/vacancies in c-GST. [26]
It is interesting follow the “motion” of vacancies/cavities during crystallization.Recent simulations of crystallization in GST suggested that there is cavity diffusionto the crystal/glass interface. This was followed by Ge/Sb diffusion to these sites,aiding the formation of cubic, cavity-free crystallites [37]. Here, the fixed crystallineseed comprises, by definition, 6 vacancies as in c-GST, and we have followed howthe other vacancies rearrange in different shells of the growing crystallite. The radial

480 J. Akola et al.
distribution of vacancies from the centre of the seed (Fig. 17.19) shows that there arecavities from the limit determined by the box size down to the cutoff of the cavitydomains (2.8 Å). The ordering of the cavities is less pronounced at 700K due tothermal fluctuations of atoms which distort vacancies and their positions (centres).However, vacancies are present throughout the crystallite during its formation.
At 600 and 700 K, the sizes of individual cavities range between 20-200 Å3
depending on whether they comprise a single cavity or several joined ones (multi-vacancy). After crystallization, there is a higher abundance with volumes that aremultiples of∼35 Å3, which is approximately the size of a single vacancy in the GSTrock salt lattice with the above definition of a cavity. The decreasing size distributionat 700K before crystallization resembles a liquid, while there is more structure at600K pointing to a certain degree of ordering.
Once the cavity centres are known, one can compute partial distribution functionsbetween them (cavity-cavity) as well as with respect to the different atomic types(cavity-atom). This shows that there is a clear tendency for Ge and Sb atoms to moveaway from cavities during crystallization, although the final rock salt structure showsnearest-neighbor cavity-Sb “wrong bonds”. This is due to the inevitable anti-sitedefects, where some atoms (and cavities) are located in the wrong rock salt sublattice(A type atom/vacancy in B sublattice or vice versa). Te atoms make up initially morethan half of the total number of cavity neighbors, and the number of Te-cavity bondsremains large throughout the simulation. For the crystalline phase, the cavity PDFshow maxima (∼4.3 Å) for Ge, Sb, and cavities at distances corresponding to theopposite edges of AB AB squares, whereas for Te atoms and cavities there is amaximum (∼5.2 Å) corresponding to opposite corners of AB AB cubes. Furthercorrelations with the rock salt structure and AB alternation can be found at largerdistances. The overall picture of crystallization is motion of Ge and Sb atoms awayfrom cavities to occupy sites on one sublattice (A) of the rock salt structure. However,the phase transition occurs so rapidly that “wrong bonds” (anti-site defects) areinevitable.
17.5 Concluding Remarks
We have summarized here results of a series of simulations on Ge2Sb2Te5 (GST-225), as well as some work on GeTe, Ge8Sb2Te11, and Ge15Te85. The availabilityof massively parallel computers and efficient numerical algorithms make densityfunctional calculations possible for hundreds of atoms over time scales of hundredsof picoseconds, i.e. approaching the crystallization time of phase change materials.This is a very encouraging development, and the calculations have enabled us toidentify the crucial pattern (“AB AB squares”) in the phase transition in GST [16], tostudy the differences between members of the GST-family, and to identify structuraldifferences between as-deposited and melt-quenched structures of GST-225.
Other calculations have led to important results for GST alloys and other mate-rials. Concurrently with [16], Caravati et al. [23] performed DF/MD simulations on

17 The Prototype Phase Change Material Ge2Sb2Te5: Amorphous Structure … 481
a-GST-225 (270 atoms, cooling from 2300K to 300K in 58 ps). The simulated S(Q)
was very similar to that in [16], and the authors noted the coexistence of tetrahedraland octahedral sites in a-GST: One third of Ge atoms were in a tetrahedral environ-ment, while the remaining atoms showed a defective octahedral environment. Thesame authors studied the effects of stoichiometric defects [38] and pressure-inducedamorphization in the same material [39]. Hegedüs and Elliott [24] have performedDF/MD simulations (63 atoms, 1.3 ns) of the crystallization process in a-GST-225.Crystallization is the time-limiting process in the write/erase cycle of PC materialsand is the focus of much current research.
Our series of crystallization simulations has focused on 460- and 648-atom sam-ples of a-GST (GST) using a fixed crystalline nucleus up to 600 ps [31]. Our sim-ulations, the largest performed to date for crystallization in GST, have studied theprocess at three temperatures (500, 600 and 700 K). The onset of crystallizationfrom a completely disordered sample is being studied in our ongoing work, but thepresent results go beyond earlier work in several ways. We focus on changes in thesample crystallinity based on a bond orientational order parameter [32], numbers of“AB AB squares” and “wrong bonds”, percolation, and the difference in densitiesbetween the amorphous and crystalline phases is taken into account during crys-tallization by adjustment of the cell size. All samples display crystal growth of thenucleus, but the process is complete only in the 460-atom sample at 600 and 700 K.Each process involves a preliminary stage where the nucleus grows gradually andforms percolating connections (narrow necks) with replicas in the neighboring cells.Crystal growth is favored by the increased mobility brought by higher temperatures.The diffusive nature of the atomic motion is an important aspect of crystallization inGST, and atoms can move significant distances during the structural transition. Thisapplies to all elements, including Te.
The widely accepted model of the metastable structure of GST by Yamada [7, 40]considers a rock salt (Fm3̄m) structure with one sublattice containing Te atoms, theother a random mixture of Ge atoms (40%), Sb atoms (40%), and cavities (20%).However, this model does not include “wrong bonds”, and there may be substantialdisplacements from the ideal crystallographic positions, particularly for Ge [40].In our crystallized samples, the presence of wrong bonds, especially Te-Te, is par-ticularly striking. Analysis of x-ray diffraction results of GST films have showedthat exchanging all Sb atoms (atomic number 51) with Te (atomic number 52) in theYamada model did not diminish the R-factor significantly [41], confirming that XRDmeasurements alone cannot distinguish between these two elements. Our crystalliza-tion simulation show clear indications that total energy favors Te occupancy of onesublattice (B) of the rock salt structure. Nevertheless, the very short crystallizationtimes mean that other contributions to the free energy, particularly configurationalentropy, play crucial roles. Vibration frequencies are low inGST (typically 100 cm−1
or 3 THz) [17], which means that atoms cannot vibrate more than a few thousandtimes within 1 ns. The system can easily become trapped in metastable states uponrapid cooling, since configurations with “wrong bonds” (defects) are much morecommon than structures with a perfect Te sublattice.
482 J. Akola et al.
We have discussed alloys on the tie line GeTe–Sb2Te3 in Fig. 17.1a, which aregroup 1 materials where crystallization of the amorphous bits proceeds by nucle-ation from within. We noted above that amorphous bits of Sb-based materialsnear the Sb70Te30 eutectic (group 2), also used as PC materials, crystallize fromthe polycrystalline surroundings. We have simulated the amorphous structure ofAg3.5In3.8Sb75.0Te17.7 and suggested a plausible scheme for its crystallization [42].
Some words of caution are, however, appropriate. The discovery of medium-range order in Te atoms in a-GST and GeTe was unexpected and could not havebeen found in simulations with fewer atoms. This is also true for studies of cavities,which can occur as large multivacancies in these systems. Earlier simulations withless than 100 atoms certainly aided our understanding of the processes involved,but they cannot be expected to give reliable predictions. It is also crucial that theliquid state be cooled over a time scale that is physically relevant. The use of Born-Oppenheimer MD with an efficient predictor-corrector scheme for converging theorbital eigenfunctions has been decisive in our own work, since the time steps aretwoorders ofmagnitude greater than possiblewith standard techniques. Furthermore,high temperatures favour metallic samples in many of these systems, and the absenceof a gap in the eigenvalue spectrum often leads to instabilities in the Car-Parrinelloapproach. Similar findings were reported in other work [23].
The approximation used for the exchange-correlation is crucial to obtain an accu-rate description of the structures of several PC materials. Elemental Te provides aninterestingmaterial in this context, since experimental and calculated structure factorsand pair distribution functions often disagree. The results of DF calculations of struc-tural properties of Te depend significantly on the choice of the exchange-correlationenergy functional [43], and the best agreement with experiment is obtained usingrecently developed functionals that go beyond the gradient of the density(TPSS [15]).
While DF simulations of hundreds of atoms over time scales of nanoseconds arepossible today, they make major demands on computational resources and the effortrequired to analyze the results. This situation is unlikely to change soon, and oneshould ask whether simulations of “hundreds of atoms” are enough to answer theproblems we face. The development of classical force fields that have DF accuracy isimportant, and the work of Sosso et al. [44] is a very interesting development. Theseauthors used a huge database of DF calculations on Ge/Te systems to develop a forcefield for GeTe that permits MD simulations with much longer time scales and up toseveral thousand atoms.
Acknowledgments We thank all colleagues who worked with us on these problems, particularlyK. Kobayashi, S. Kohara, J. Larrucea, T. Matsunaga, and N. Yamada. J.A. thanks the Academy ofFinland for support.We acknowledge gratefully the computer time provided by the JARA-HPCVer-gabegremium on the JARA-HPC partition of the supercomputer JUQUEEN at the Forschungszen-trum Jülich, and for time granted on the supercomputer JUROPA at Jülich Supercomputer Centre.The German Research School for Simulation Sciences is a joint venture of the FZ Jülich and theRWTH Aachen University.

17 The Prototype Phase Change Material Ge2Sb2Te5: Amorphous Structure … 483
References
1. N.F. Mott, Adv. Phys. 16, 49 (1967)2. S.R. Ovshinsky, Phys. Rev. Lett. 21, 1450 (1968)3. M. Chen, K.A. Rubin, R.W. Barton, Appl. Phys. Lett. 49, 502 (1986)4. T. Matsunaga, R. Kojima, N. Yamada, K. Kifune, Y. Kubota, Y. Tabata, M. Takata, Inorg.
Chem. 45, 2235 (2006)5. N. Yamada, R. Kojima, T. Nishihara, A. Tsuchino, Y. Tomekawa, H. Kusada, in Proceedings
European Symposium on Phase Change and Ovonic Science (E/PCOS), Aachen, Germany,September 2009, pp. 23–28
6. J.K. Olson, H. Li, P.C. Taylor, J. Ovonic Res. 1, 1 (2005) (ISSN 1584–9953)7. N. Yamada, Mat. Res. Soc. Bull. 21, 48 (1996)8. A. Kolobov, P. Fons, A.I. Frenkel, A.I. Ankudinov, J. Tomonaga, T. Uruga, Nat. Mater. 3, 703
(2004)9. W. Wełnic, A. Pamungkas, R. Detemple, C. Steimer, S. Blügel, M. Wuttig, Nature Mater. 5,
56 (2006)10. S. Hosokawa, T. Ozaki, K. Hayashi, N. Happo, M. Fujiwara, K. Horii, P. Fons, A. V. Kolobov,
J. Tominaga, Appl. Phys. Lett. 90, 131913 (2007)11. R. Car, M. Parrinello, Phys. Rev. Lett 55, 2471 (1985)12. Z. Sun, J. Zhou, R. Ahuja, Phys. Rev. Lett. 98, 055505 (2007)13. C. Bichara, M. Johnson, J.P. Gaspard, Phys. Rev. B 75, 060201(R) (2007)14. R. O. Jones, O. Gunnarsson, Rev. Mod. Phys. 61, 689 (1989)15. J. Tao, J.P. Perdew, V.N. Staroverov, G.E. Scuseria, Phys. Rev. Lett. 91, 146401 (2003)16. J. Akola, R.O. Jones, Phys. Rev. B 76, 235201 (2007)17. J. Akola, R.O. Jones, J. Phys.: Condens. Matter 20, 465103 (2008)18. S. Kohara, K. Kato, S. Kimura, H. Tanaka, T. Usuki, K. Suzuya, H. Tanaka, Y. Moritomo,
T. Matsunaga, N. Yamada, Y. Tanaka, H. Suematsu, M. Takata, Appl. Phys. Lett. 89, 201910(2006)
19. J.-J. Kim, K. Kobayashi, E. Ikenaga, M. Kobata, S. Ueda, T. Matsunaga, K. Kifune, R. Kojima,N. Yamada, Phys. Rev. B 76, 115124 (2007)
20. J.P. Perdew, K. Burke, M. Ernzerhof, Phys. Rev. Lett. 77, 3865 (1996)21. P. Biswas, R. Atta-Fynn, D. A. Drabold, Phys. Rev. B 76, 125210 (2007)22. P. Biswas, D.N. Tafen, F. Inam, B. Cai, D.A. Drabold, J. Phys.: Condens. Matter 21, 084207
(2009)23. S. Caravati, M. Bernasconi, T.D. Kühne, M. Krack, M. Parrinello, Appl. Phys. Lett. 91, 171906
(2007)24. J. Hegedüs, S.R. Elliott, Nat. Mater. 7, 399 (2008)25. J. Akola, J. Larrucea, R.O. Jones, Phys. Rev. B 83, 094113 (2011)26. J. Akola, R.O. Jones, S. Kohara, S. Kimura, K. Kobayashi,M. Takata, T.Matsunaga, R. Kojima,
N. Yamada, Phys. Rev. B 80, 020201(R) (2009)27. J.P. Perdew, A. Ruzsinsky, G.I. Csonka, O.A. Vydrov, G.E. Scuseria, L.A. Constantin, X. Zhao,
K. Burke, Phys. Rev. Lett. 100, 136406 (2008)28. D.A. Baker,M.A. Paesler, G. Lucovsky, S.C. Agarwal, P.C. Taylor, Phys. Rev. Lett. 96, 2 55501
(2006)29. M.A. Paesler, D.A. Baker, G. Lucovsky, A.E. Edwards, P.C. Taylor. J. Phys. Chem. Solids 68,
873 (2007)30. P. Jovari, I. Kaban, J. Steiner, B. Beuneu, A. Schöps, A. Webb, J. Phys.: Condens. Matter 19,
335212 (2007)31. J. Kalikka, J. Akola, J. Larrucea, R. O. Jones, Phys. Rev. B 86, 144113 (2012)32. P.J. Steinhardt, D.R. Nelson, M. Ronchetti, Phys. Rev. B 28, 784 (1983)33. D.-H. Kim, F. Merget, M. Laurenzis, P.H. Bolivar, H. Kurz, J. Appl. Phys. 97, 083538 (2005)34. J. Orava, A.L. Greer, B. Ghoulipour, D.W. Hewak, C.E. Smith, Nature Mater. 11, 279 (2012)35. T.H. Lee, S.R. Elliott, Phys. Rev. Lett. 107, 145702 (2011)

484 J. Akola et al.
36. T. Matsunaga, R. Kojima, N. Yamada, K. Kifune, Y. Kubota, Y. Tabata, M. Takata, Inorg.Chem. 45, 2235 (2006)
37. T.H. Lee, S.R. Elliott, Phys. Rev. B 84, 094124 (2011)38. S. Caravati, M. Bernasconi, T.D. Kühne, M. Parrinello, J. Phys.: Condens. Matter 21, 255501
(2009)39. S. Caravati, M. Bernasconi, T.D. Kühne, M. Parrinello, Phys. Rev. Lett. 102, 205502 (2009)40. N. Yamada, T. Matsunaga, J. Appl. Phys. 88, 7020 (2000)41. T. Nonaka, G. Ohbayashi, Y. Toriumi, Y. Mori, H. Hashimoto, Thin Solid Films 370, 258
(2000)42. T. Matsunaga, J. Akola, S. Kohara, T. Honma, K. Kobayashi, E. Ikenaga, R.O. Jones, N.
Yamada, M. Takata, R. Kojima, Nature Mater. 10, 129 (2011)43. J. Akola, R.O. Jones, Phys. Rev. B 85, 134103 (2012)44. G.C. Sosso, G. Miceli, S. Caravati, J. Behler, M. Bernasconi, Phys. Rev. B 85, 174103 (2012)