CHAPTER 17 Financial statement analysis II. Contents Introduction – Framing of financial...
36
U se w ith G lobal Financial Accounting and R eporting ISBN 1-84480-265-5 © 2005 PeterW alton and W alterAerts CHAPTER 17 Financial statement analysis II
-
date post
19-Dec-2015 -
Category
Documents
-
view
225 -
download
2
Transcript of CHAPTER 17 Financial statement analysis II. Contents Introduction – Framing of financial...
Use with Global Financial Accounting and Reporting ISBN 1-84480-265-5© 2005 Peter Walton and Walter Aerts
CHAPTER 17Financial statement analysis II
Use with Global Financial Accounting and Reporting ISBN 1-84480-265-5© 2005 Peter Walton and Walter Aerts
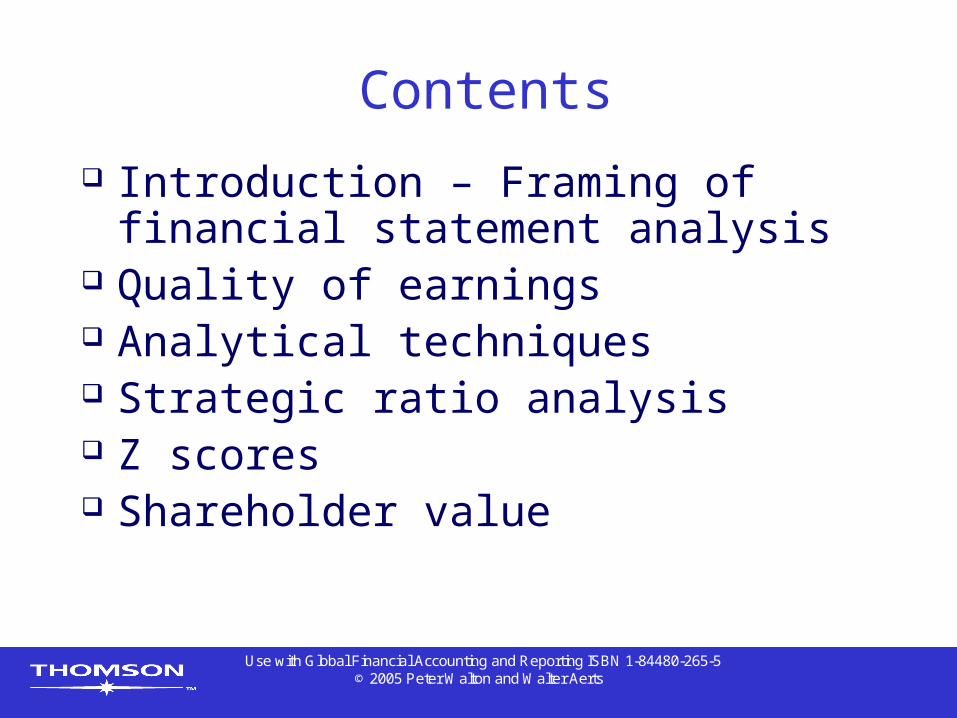
Contents
Introduction – Framing of financial statement analysis
Quality of earnings Analytical techniques Strategic ratio analysis Z scores Shareholder value
Use with Global Financial Accounting and Reporting ISBN 1-84480-265-5© 2005 Peter Walton and Walter Aerts
Framing of financial statement analysis
Accounting numbers are not the only input into the assessment of a company’s prospects
Figure 17.1 provides an overview of relevant framing factors
Increasing use of investor briefings by companies
Use with Global Financial Accounting and Reporting ISBN 1-84480-265-5© 2005 Peter Walton and Walter Aerts
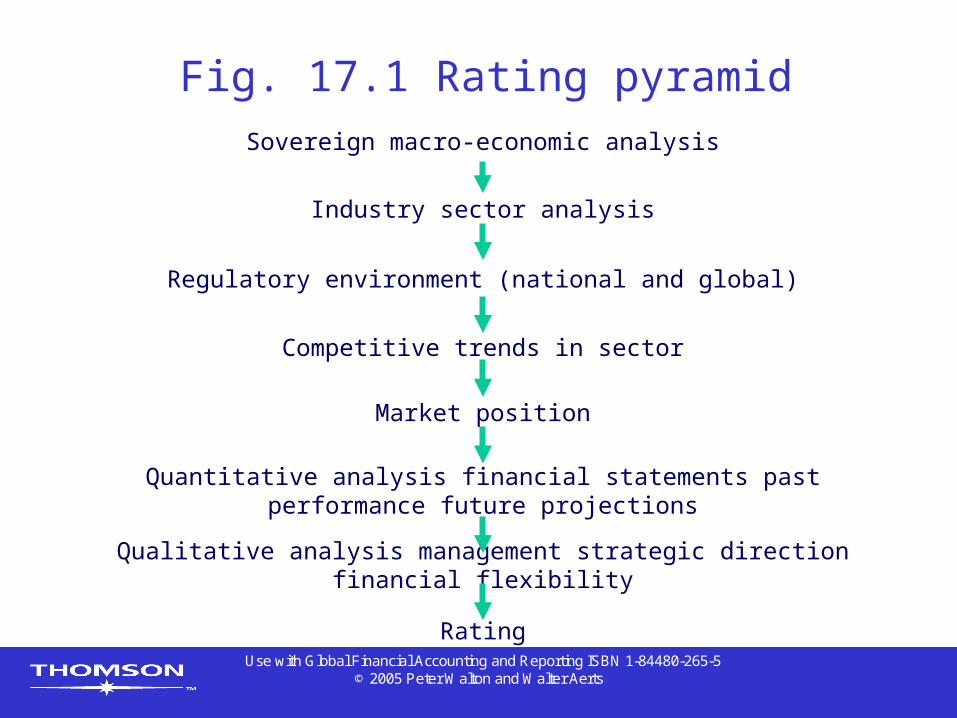
Fig. 17.1 Rating pyramidSovereign macro-economic analysis
Industry sector analysis
Regulatory environment (national and global)
Competitive trends in sector
Market position
Quantitative analysis financial statements past performance future projections
Qualitative analysis management strategic direction financial flexibility
Rating
Use with Global Financial Accounting and Reporting ISBN 1-84480-265-5© 2005 Peter Walton and Walter Aerts
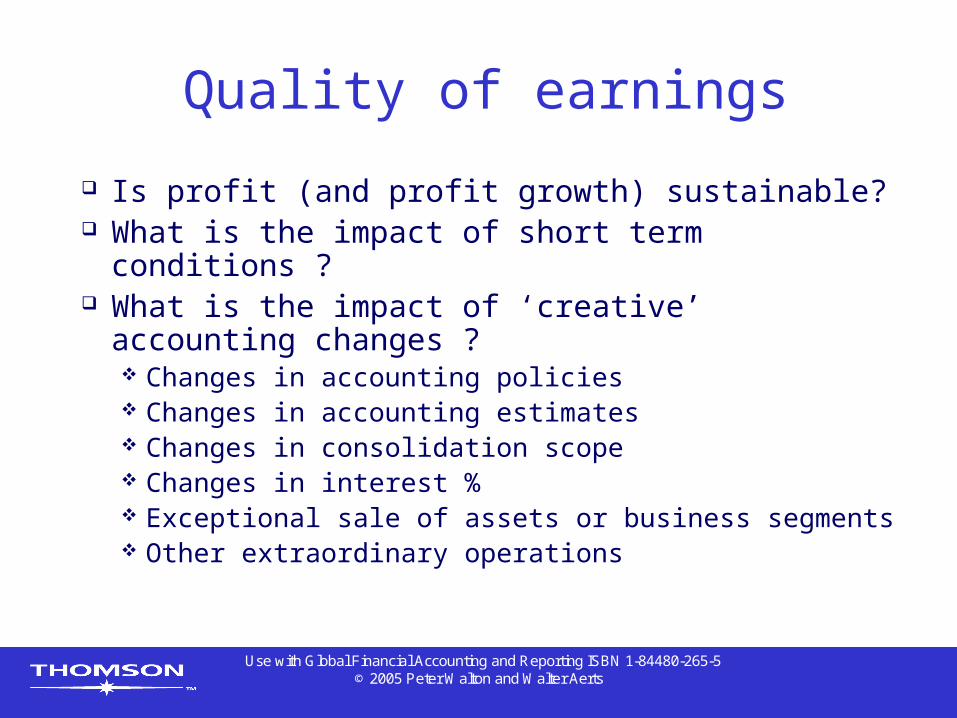
Quality of earnings
Is profit (and profit growth) sustainable? What is the impact of short term conditions
? What is the impact of ‘creative’ accounting
changes ? Changes in accounting policies Changes in accounting estimates Changes in consolidation scope Changes in interest % Exceptional sale of assets or business segments Other extraordinary operations
Use with Global Financial Accounting and Reporting ISBN 1-84480-265-5© 2005 Peter Walton and Walter Aerts
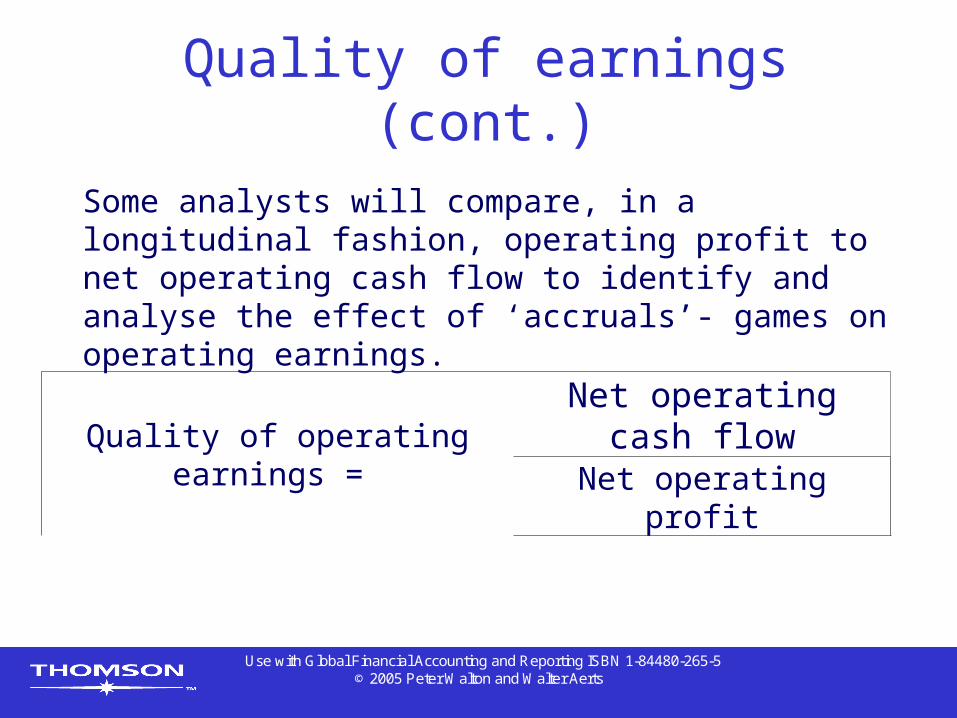
Quality of earnings (cont.)
Quality of operating earnings =
Net operating cash flow
Net operating profit
Some analysts will compare, in a longitudinal fashion, operating profit to net operating cash flow to identify and analyse the effect of ‘accruals’- games on operating earnings.
Use with Global Financial Accounting and Reporting ISBN 1-84480-265-5© 2005 Peter Walton and Walter Aerts
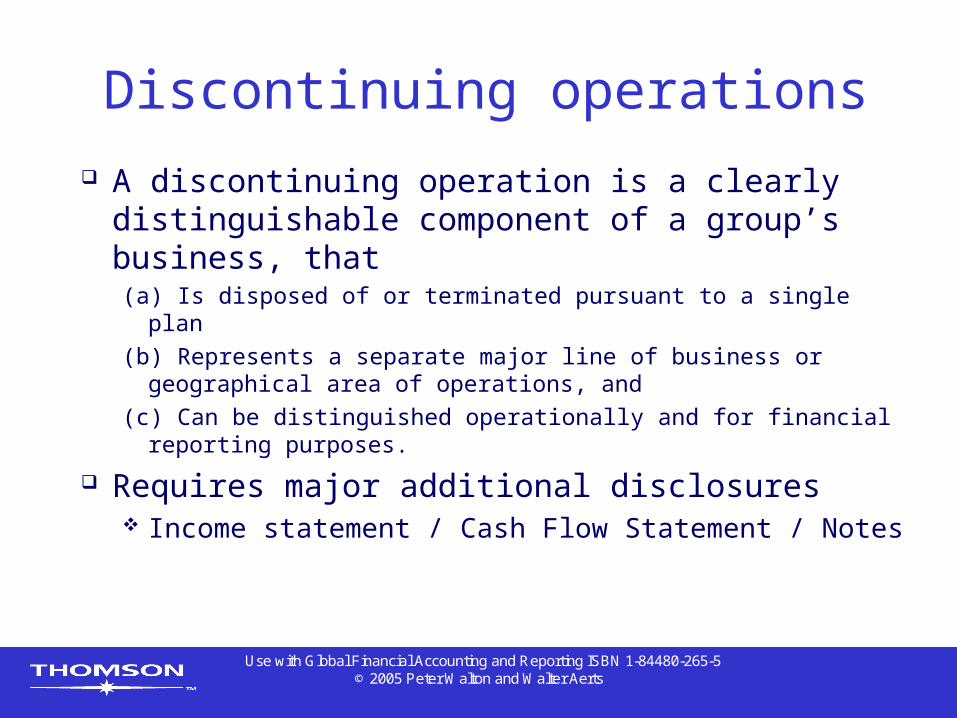
Discontinuing operations
A discontinuing operation is a clearly distinguishable component of a group’s business, that(a) Is disposed of or terminated pursuant to a single plan(b) Represents a separate major line of business or
geographical area of operations, and(c) Can be distinguished operationally and for financial
reporting purposes.
Requires major additional disclosures Income statement / Cash Flow Statement / Notes

Use with Global Financial Accounting and Reporting ISBN 1-84480-265-5© 2005 Peter Walton and Walter Aerts
XYZ GROUP - INCOME STATEMENT FOR THE YEAR ENDED 31 DECEMBER 20-2 (illustrating the classification of expenses by function)(in thousands of currency units)Continuing operations 20-2 20-1Revenue X XCost of sales (X) (X)Gross profit X XOther income X XDistribution costs (X) (X)Administrative expenses (X) (X)Other expenses (X) (X)Finance costs (X) (X)Share of profit of associates X XProfit before tax X XIncome tax expense (X) (X)Profit for the period from continuing
operations X X
IFRS 5 - Presentation of Discontinued Operations in the Income Statement (Extract)
continues

Use with Global Financial Accounting and Reporting ISBN 1-84480-265-5© 2005 Peter Walton and Walter Aerts
Discontinued operations
Profit for the period from discontinued operations1 X X
Profit for the period X X
Attributable to: Equity holders of the parent X X Minority interest X X
X X
1 The required analysis would be given in the notes
IFRS 5 - Presentation of Discontinued Operations in the Income Statement (Extract) – cont.
Source: IFRS 5 – Non-current assets held for sale and discontinued operations, Guidance on implementing
Use with Global Financial Accounting and Reporting ISBN 1-84480-265-5© 2005 Peter Walton and Walter Aerts
Analytical techniques
Common accounting base Common size Ebitda Objectives of analysis
Use with Global Financial Accounting and Reporting ISBN 1-84480-265-5© 2005 Peter Walton and Walter Aerts
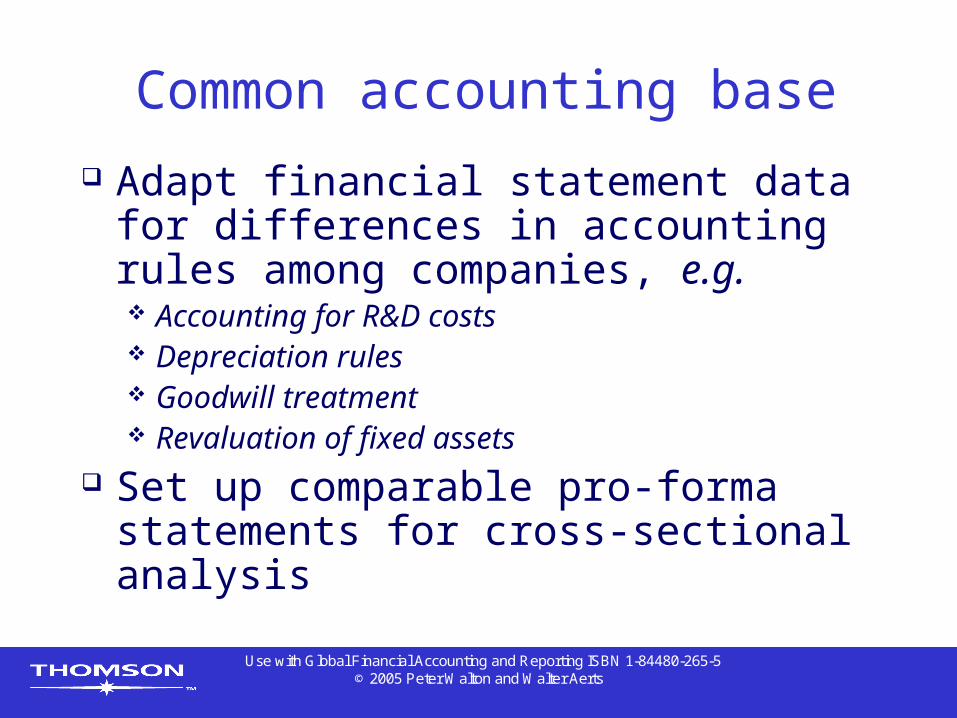
Common accounting base
Adapt financial statement data for differences in accounting rules among companies, e.g. Accounting for R&D costs Depreciation rules Goodwill treatment Revaluation of fixed assets
Set up comparable pro-forma statements for cross-sectional analysis
Use with Global Financial Accounting and Reporting ISBN 1-84480-265-5© 2005 Peter Walton and Walter Aerts
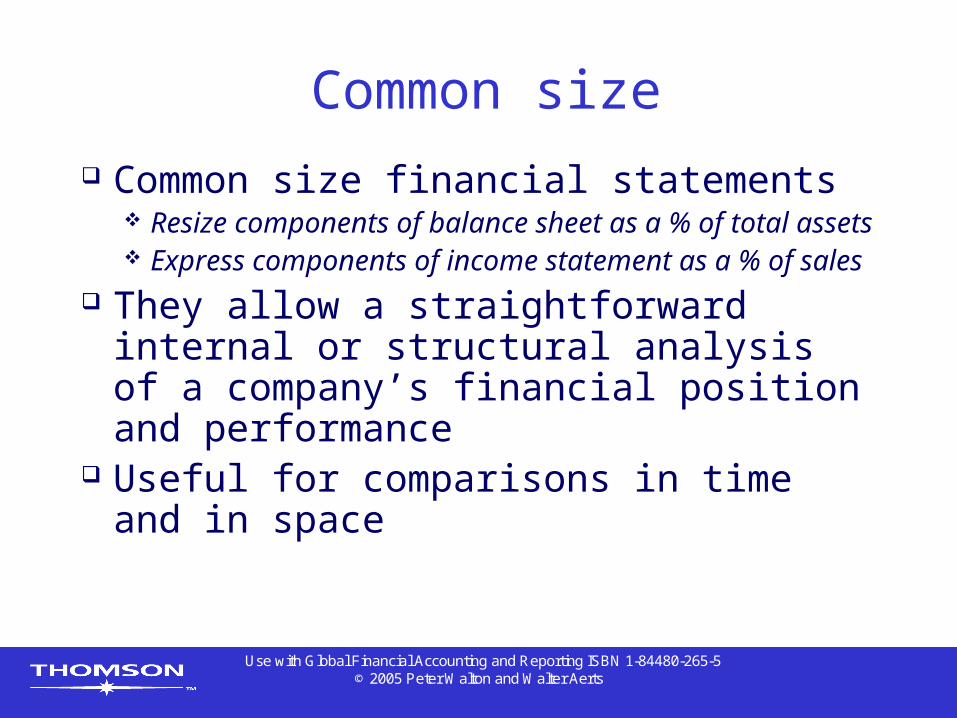
Common size Common size financial statements
Resize components of balance sheet as a % of total assets
Express components of income statement as a % of sales
They allow a straightforward internal or structural analysis of a company’s financial position and performance
Useful for comparisons in time and in space
Use with Global Financial Accounting and Reporting ISBN 1-84480-265-5© 2005 Peter Walton and Walter Aerts
Ebitda
‘Earnings before interest, taxation, depreciation and amortization’
Proxy for net operating cash flow Cleans operating result for non-
cash costs and non-cash revenues Robust measure for comparison of
performance in time and space

Use with Global Financial Accounting and Reporting ISBN 1-84480-265-5© 2005 Peter Walton and Walter Aerts
Objectives of analysis
Investors and creditors as predominant users of financial statements
Broadly, both investor and creditor will use the same indicators, but the relative importance of specific indicators will be different and will be contingent on the type of investor (and creditor) decisions to be made
Use with Global Financial Accounting and Reporting ISBN 1-84480-265-5© 2005 Peter Walton and Walter Aerts
Strategic ratio analysis
Sustainable growth ROI decomposition Financial leverage Operational gearing
Use with Global Financial Accounting and Reporting ISBN 1-84480-265-5© 2005 Peter Walton and Walter Aerts
Recap ratio analysis Understand accounting principles Develop a consistent analysis
framework Constraints of an historical perspective Garbage in, garbage out Take into account trends and industry
comparisons Take into account worldwide variations
in accounting rules
Use with Global Financial Accounting and Reporting ISBN 1-84480-265-5© 2005 Peter Walton and Walter Aerts
Strategic analysis Elements of strategic analysis:
Phase in life cycle of company and products Nature of market
• Difficult entry <> large margins• Easy entry <> margins usually very low
Nature of products• Niche products (low volume, high price)• Bulk (high volume, low margins)
…. Develop (combinations of) ratios which
will give insights to a company’s strategic positioning
Use with Global Financial Accounting and Reporting ISBN 1-84480-265-5© 2005 Peter Walton and Walter Aerts
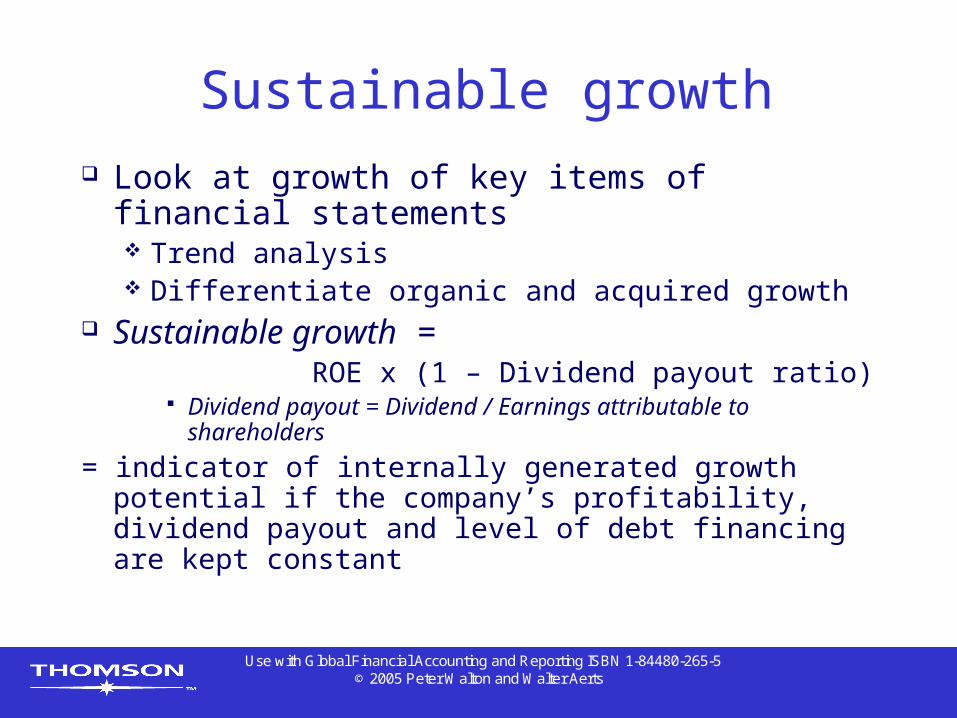
Sustainable growth Look at growth of key items of financial
statements Trend analysis Differentiate organic and acquired growth
Sustainable growth = ROE x (1 – Dividend payout ratio)
Dividend payout = Dividend / Earnings attributable to shareholders
= indicator of internally generated growth potential if the company’s profitability, dividend payout and level of debt financing are kept constant
Use with Global Financial Accounting and Reporting ISBN 1-84480-265-5© 2005 Peter Walton and Walter Aerts
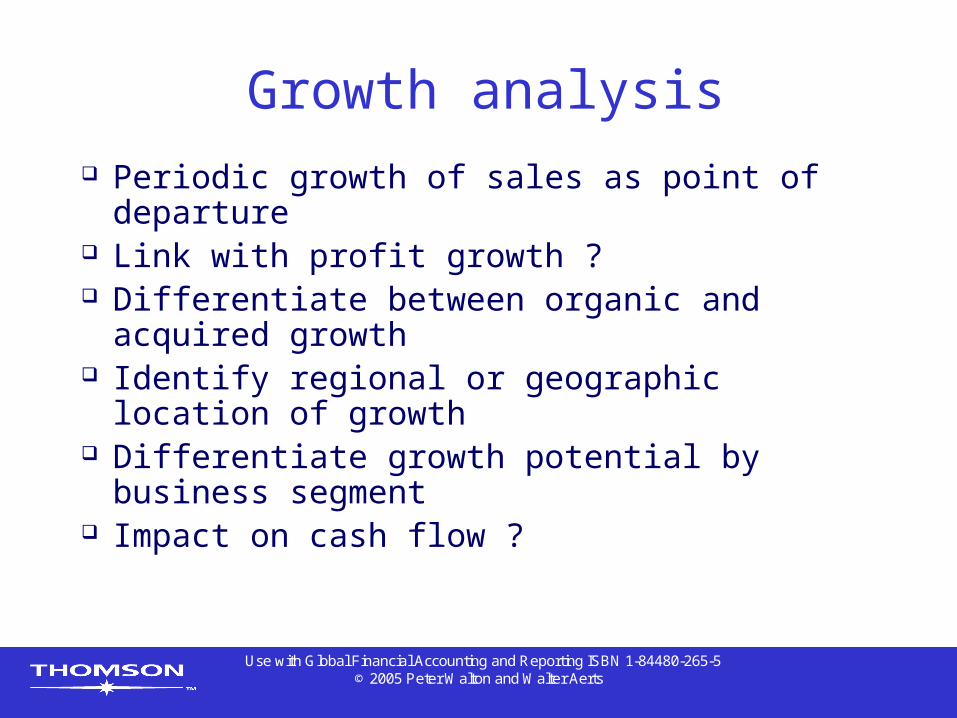
Growth analysis Periodic growth of sales as point of
departure Link with profit growth ? Differentiate between organic and acquired
growth Identify regional or geographic location of
growth Differentiate growth potential by business
segment Impact on cash flow ?
Use with Global Financial Accounting and Reporting ISBN 1-84480-265-5© 2005 Peter Walton and Walter Aerts
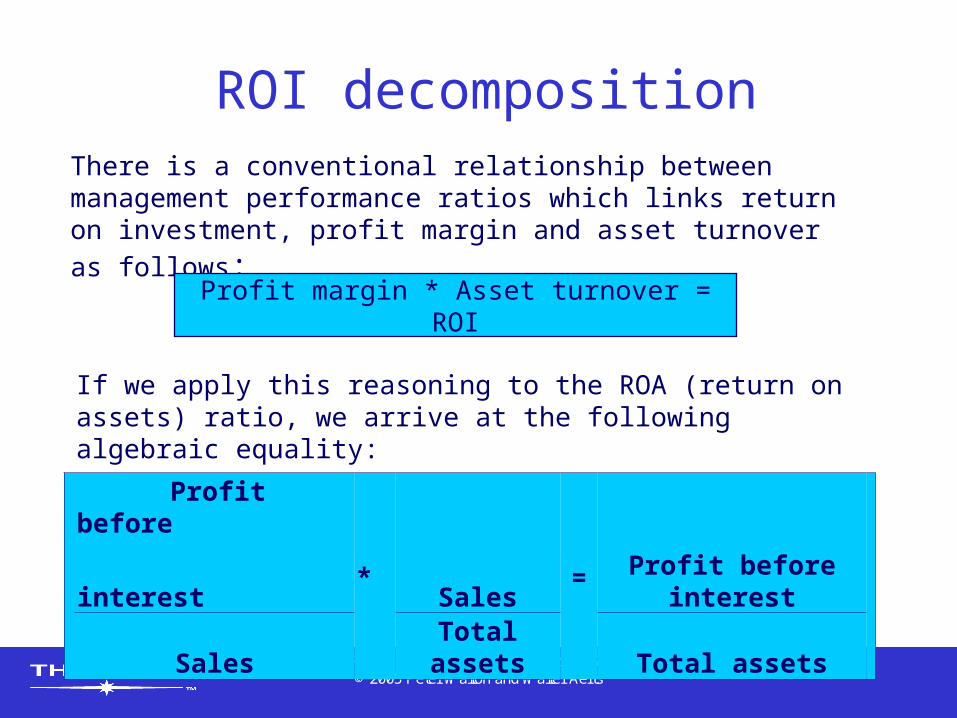
ROI decompositionThere is a conventional relationship between management performance ratios which links return on investment, profit margin and asset turnover as follows:
Profit margin * Asset turnover = ROI
If we apply this reasoning to the ROA (return on assets) ratio, we arrive at the following algebraic equality:
Profit before
interest * Sales =
Profit before interest
SalesTotal
assets Total assets
Use with Global Financial Accounting and Reporting ISBN 1-84480-265-5© 2005 Peter Walton and Walter Aerts
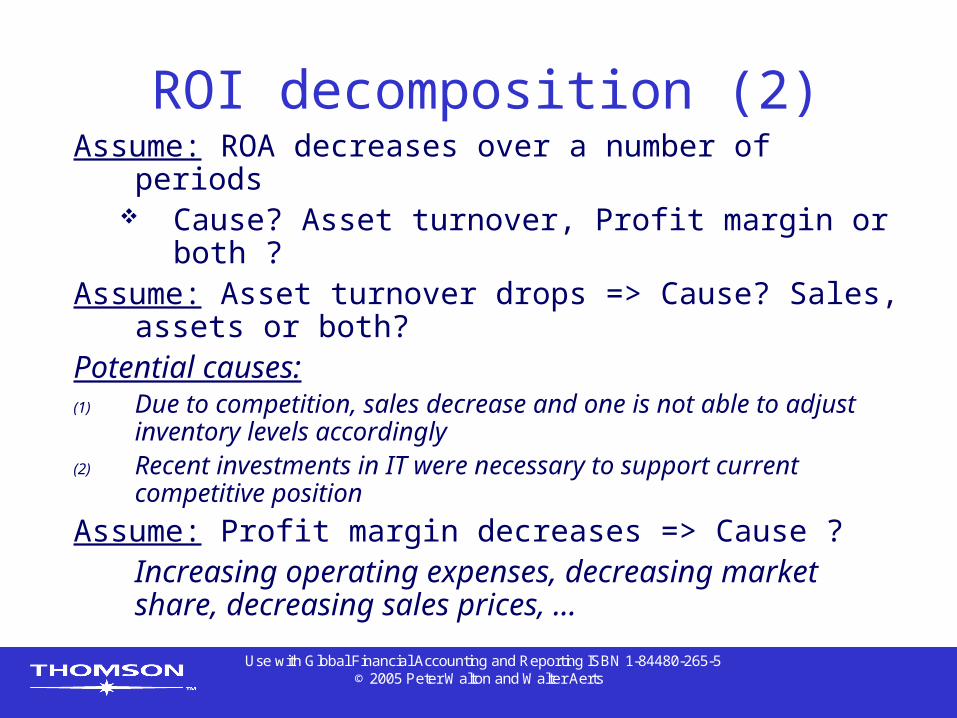
ROI decomposition (2)Assume: ROA decreases over a number of periods
Cause? Asset turnover, Profit margin or both ?
Assume: Asset turnover drops => Cause? Sales, assets or both?
Potential causes:(1) Due to competition, sales decrease and one is not able
to adjust inventory levels accordingly(2) Recent investments in IT were necessary to support
current competitive position
Assume: Profit margin decreases => Cause ?Increasing operating expenses, decreasing market share, decreasing sales prices, …

Use with Global Financial Accounting and Reporting ISBN 1-84480-265-5© 2005 Peter Walton and Walter Aerts
Financial leverageTaking the analysis one step further, the return on equity can be analytically linked to the return on assets ratio with the introduction the concept of financial leverage.
ROA * Financial leverage = ROE
Profit before interest *
Total assets =
Profit before interest
Total assets Equity Equity
Alternatively, we can start from the original ROE definition and get the following:
Net profit for the period *
Total assets =
Net profit for the period
Total assets Equity Equity
Starting with the ROA (return on assets) ratio, we arrive at the following algebraic equality:
Use with Global Financial Accounting and Reporting ISBN 1-84480-265-5© 2005 Peter Walton and Walter Aerts
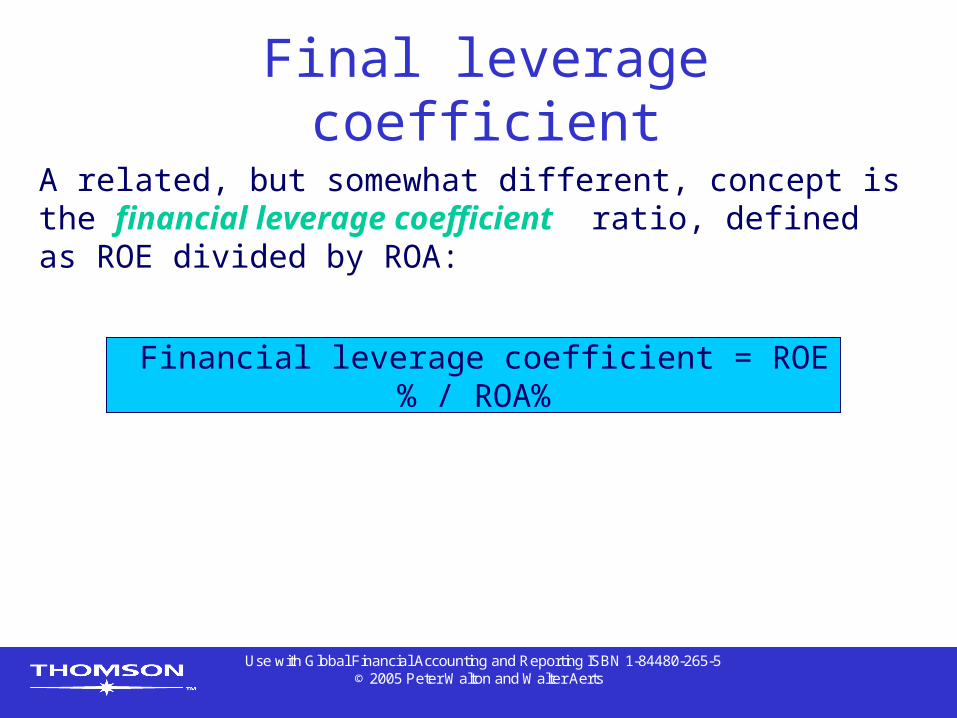
Final leverage coefficient
A related, but somewhat different, concept is the financial leverage coefficient ratio, defined as ROE divided by ROA:
Financial leverage coefficient = ROE% / ROA%

Use with Global Financial Accounting and Reporting ISBN 1-84480-265-5© 2005 Peter Walton and Walter Aerts
Table 17.1 Financial leverage effect at different debt/equity ratios
Total assets = 1,000 ROA = 10%After-tax cost of debt = 7%
Debt /Equity 100% 150% 300%
Profit before interest 100 100 100
Cost of debt 35 42 52.5
Net profit 65 58 47.5
ROE 13% 14.5% 19%
Financial leverage coefficient
13%/10% = 1.30
1.45 1.90
Use with Global Financial Accounting and Reporting ISBN 1-84480-265-5© 2005 Peter Walton and Walter Aerts
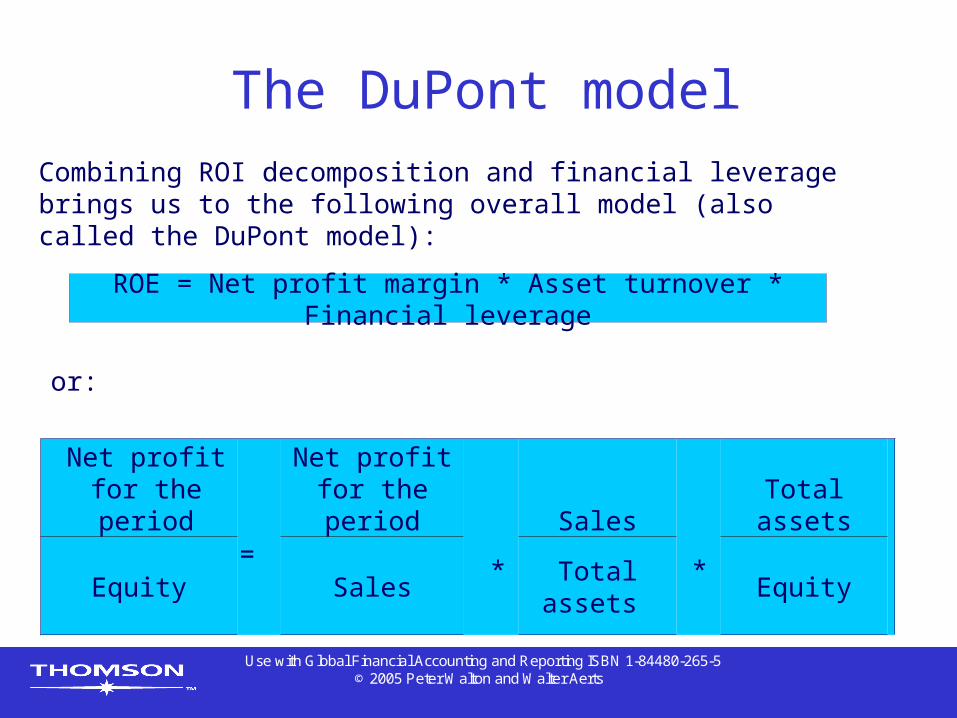
The DuPont modelCombining ROI decomposition and financial leverage brings us to the following overall model (also called the DuPont model):
Net profit for the period
=
Net profit for the period
*
Sales
*
Total assets
Equity SalesTotal
assets Equity
ROE = Net profit margin * Asset turnover * Financial leverage
or:
Use with Global Financial Accounting and Reporting ISBN 1-84480-265-5© 2005 Peter Walton and Walter Aerts
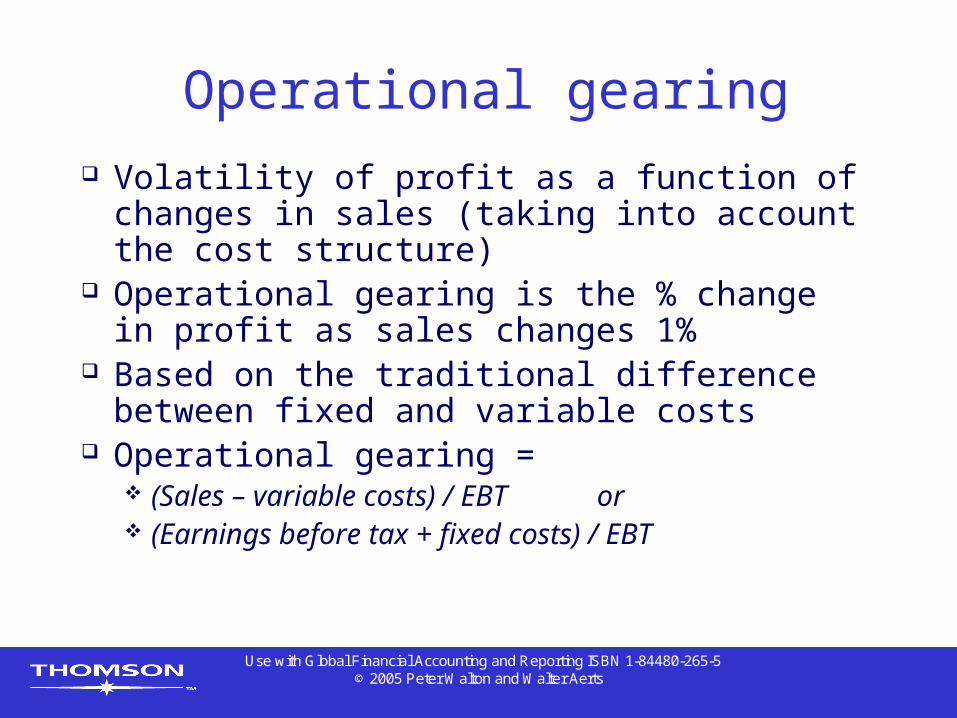
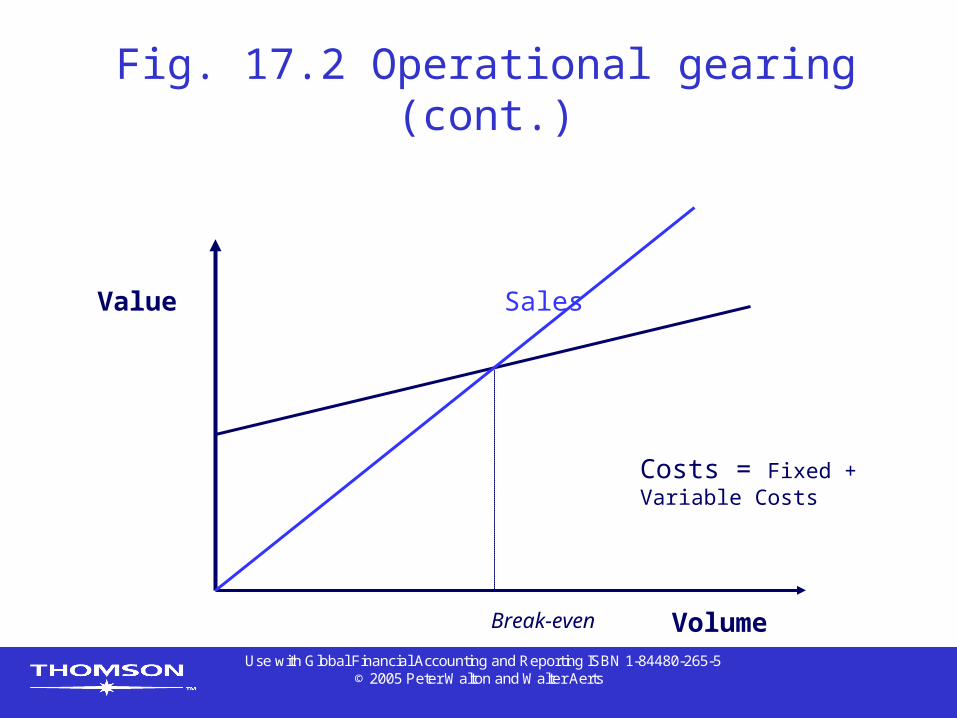
Operational gearing Volatility of profit as a function of changes
in sales (taking into account the cost structure)
Operational gearing is the % change in profit as sales changes 1%
Based on the traditional difference between fixed and variable costs
Operational gearing = (Sales – variable costs) / EBT or (Earnings before tax + fixed costs) / EBT
Use with Global Financial Accounting and Reporting ISBN 1-84480-265-5© 2005 Peter Walton and Walter Aerts
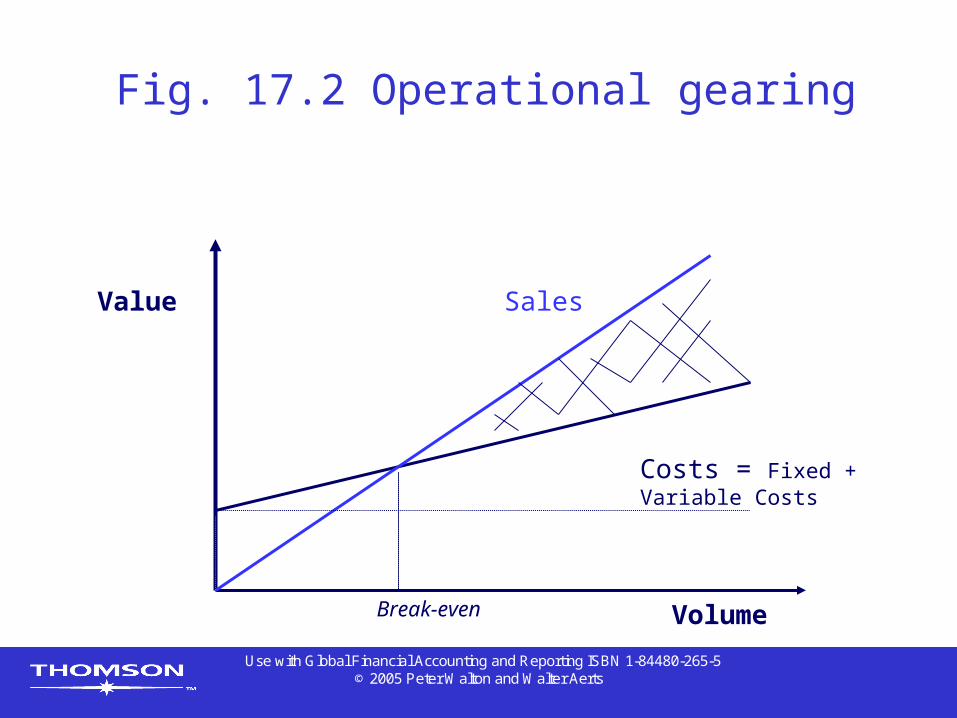
Fig. 17.2 Operational gearing
Value
Volume
Sales
Costs = Fixed + Variable Costs
Break-even
Use with Global Financial Accounting and Reporting ISBN 1-84480-265-5© 2005 Peter Walton and Walter Aerts
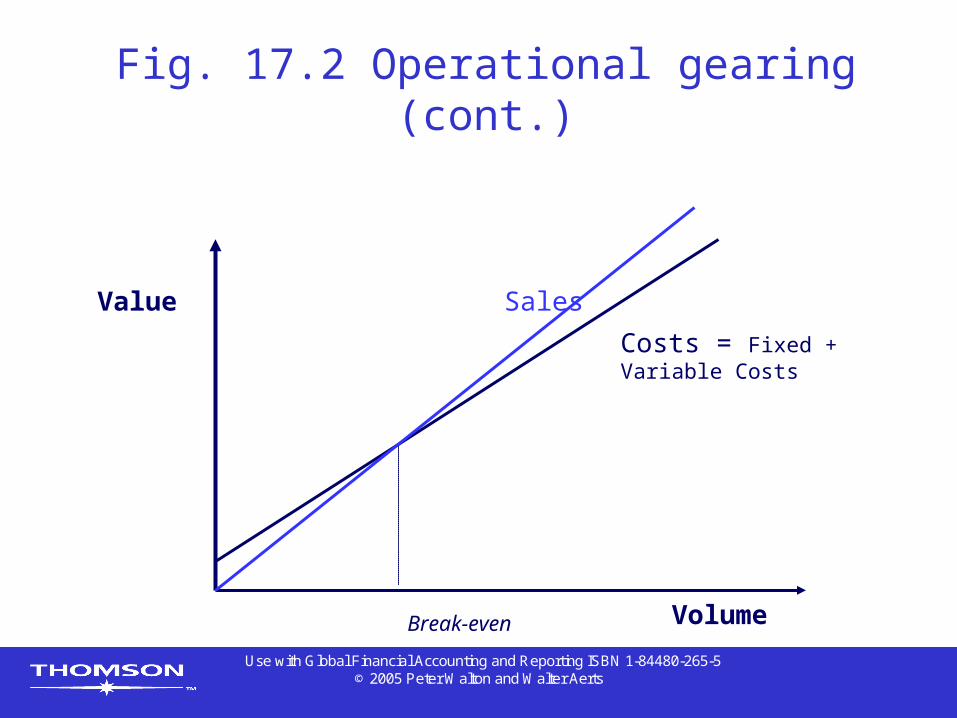
Fig. 17.2 Operational gearing (cont.)
Value
Volume
Sales
Costs = Fixed + Variable Costs
Break-even
Use with Global Financial Accounting and Reporting ISBN 1-84480-265-5© 2005 Peter Walton and Walter Aerts
Fig. 17.2 Operational gearing (cont.)
Value
Volume
Sales
Break-even
Costs = Fixed + Variable Costs

Use with Global Financial Accounting and Reporting ISBN 1-84480-265-5© 2005 Peter Walton and Walter Aerts
Different cost structures
Sales Fixed costs
Variable costs
PbT Operational gearing
Co. A 100 20 70 10 3:1
Co.B 100 70 20 10 8:1
If sales increase by 10%, profit before tax of company A increases by 30% and profit of company B by 80%
A decrease in sales will have a more dramatic effect in company B
Use with Global Financial Accounting and Reporting ISBN 1-84480-265-5© 2005 Peter Walton and Walter Aerts
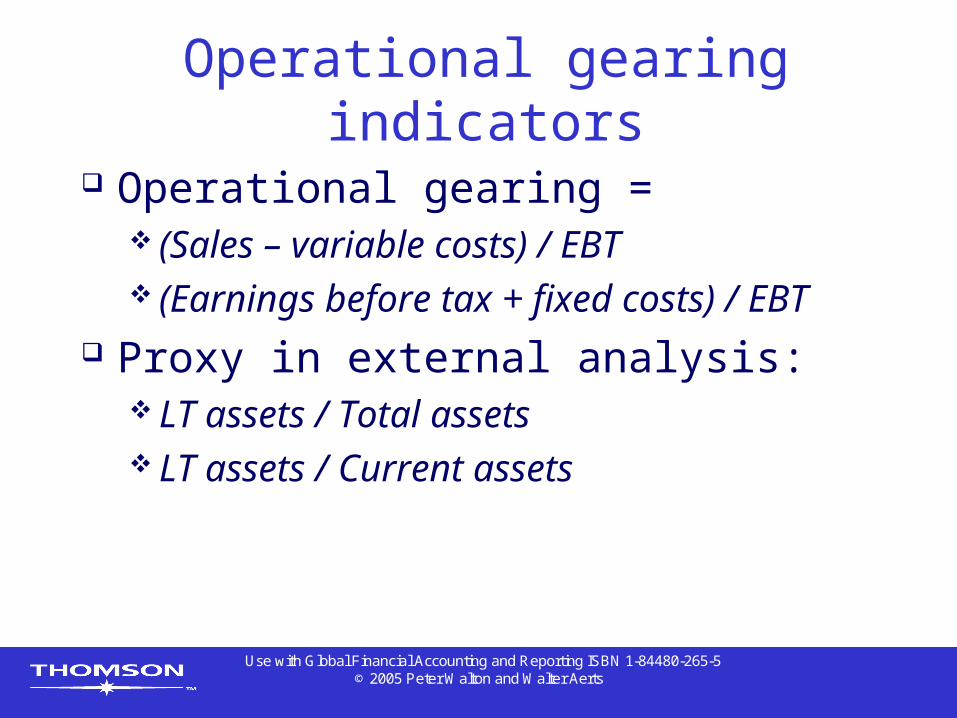
Operational gearing indicators
Operational gearing = (Sales – variable costs) / EBT (Earnings before tax + fixed costs) /
EBT Proxy in external analysis:
LT assets / Total assets LT assets / Current assets
Use with Global Financial Accounting and Reporting ISBN 1-84480-265-5© 2005 Peter Walton and Walter Aerts
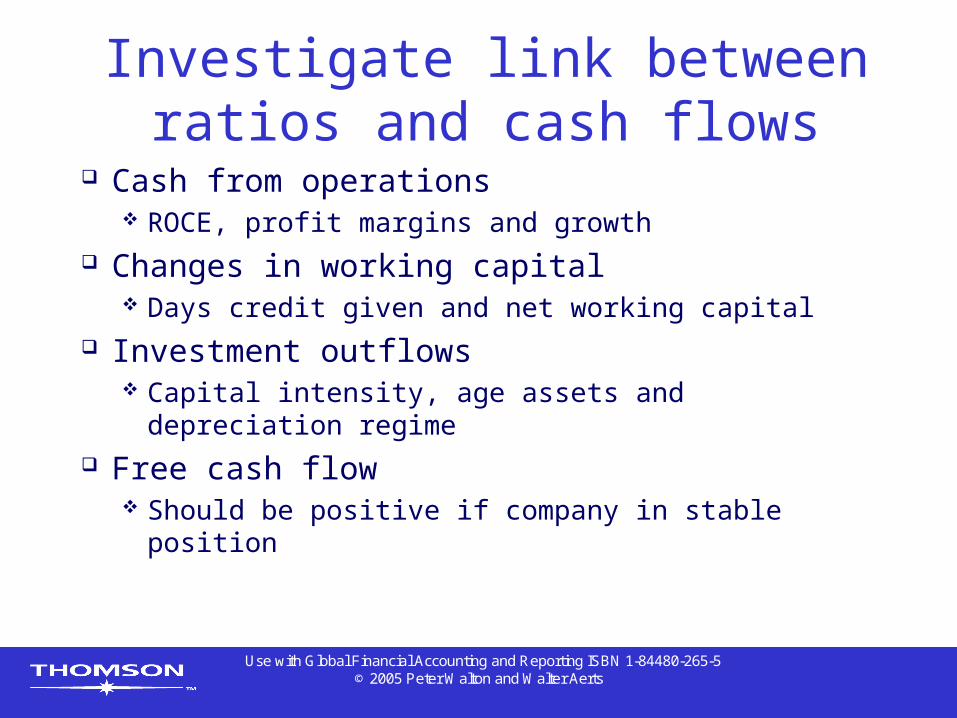
Investigate link between ratios and cash flows
Cash from operations ROCE, profit margins and growth
Changes in working capital Days credit given and net working capital
Investment outflows Capital intensity, age assets and depreciation
regime Free cash flow
Should be positive if company in stable position
Use with Global Financial Accounting and Reporting ISBN 1-84480-265-5© 2005 Peter Walton and Walter Aerts
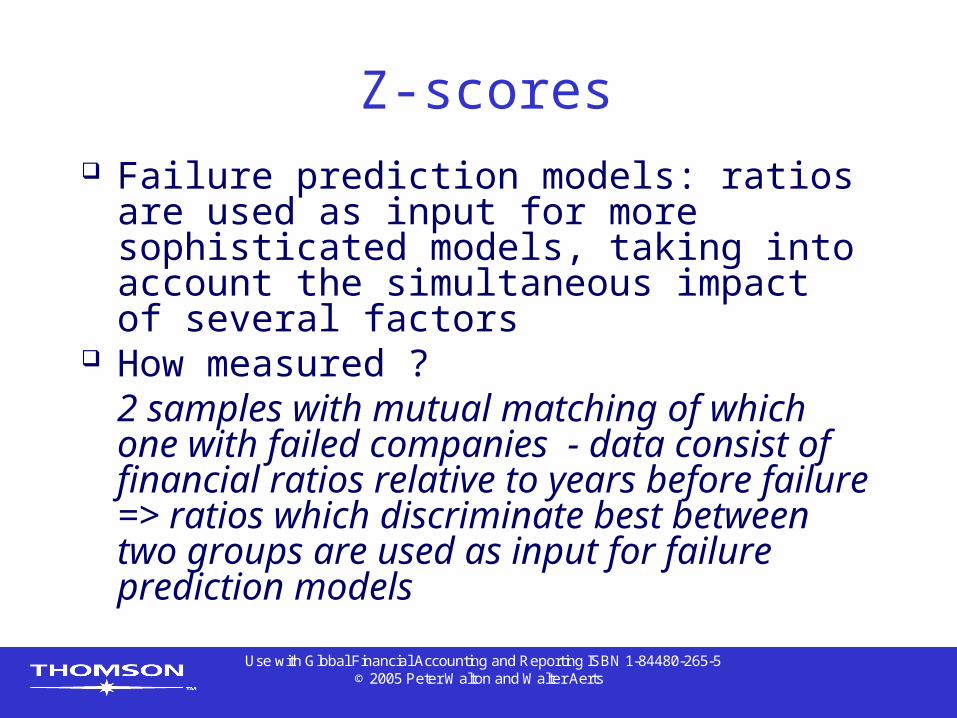
Z-scores Failure prediction models: ratios are
used as input for more sophisticated models, taking into account the simultaneous impact of several factors
How measured ? 2 samples with mutual matching of which one with failed companies - data consist of financial ratios relative to years before failure => ratios which discriminate best between two groups are used as input for failure prediction models
Use with Global Financial Accounting and Reporting ISBN 1-84480-265-5© 2005 Peter Walton and Walter Aerts
Shareholder value
Focus on present (discounted) value of forecast earnings
Time value of money and present value calculations
Forecast cash flows Discount rate

Use with Global Financial Accounting and Reporting ISBN 1-84480-265-5© 2005 Peter Walton and Walter Aerts
Present valueThe essence of present value is that a rational person will prefer to have a receipt sooner rather than later because the money can be used to generate more money.
For example, if a company has a choice of receiving $1,000 now or $1,000 in a year’s time, it would prefer to have the cash now because it could be invested and earn a return. If the money was put into risk free securities where it could earn 15 per cent, then $1,000 now would be worth $1,150 in a year’s time.
Use with Global Financial Accounting and Reporting ISBN 1-84480-265-5© 2005 Peter Walton and Walter Aerts
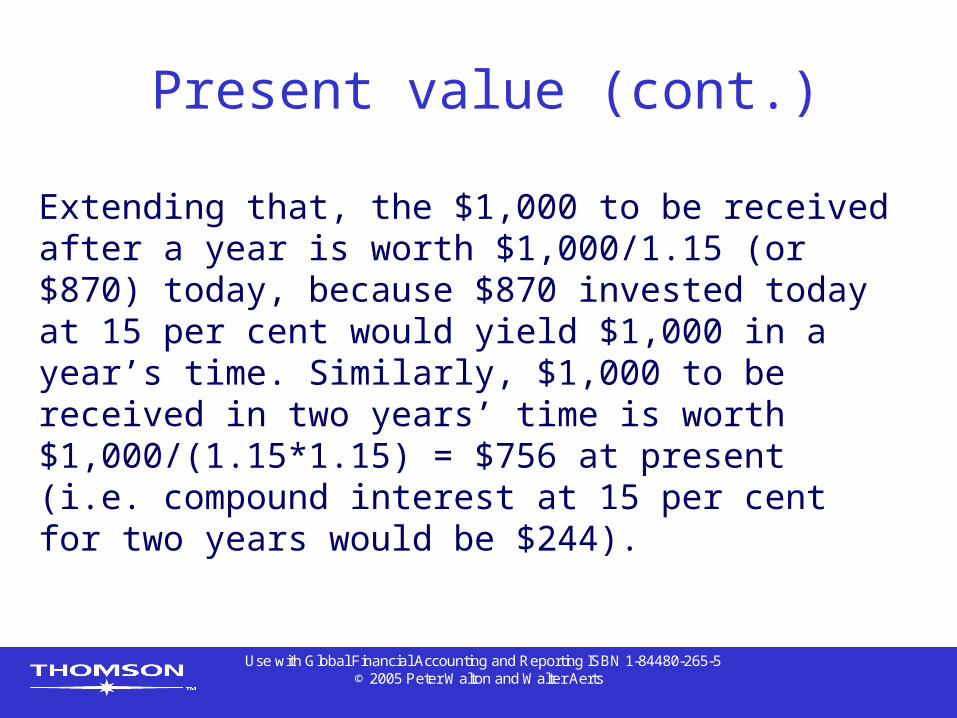
Present value (cont.)
Extending that, the $1,000 to be received after a year is worth $1,000/1.15 (or $870) today, because $870 invested today at 15 per cent would yield $1,000 in a year’s time. Similarly, $1,000 to be received in two years’ time is worth $1,000/(1.15*1.15) = $756 at present (i.e. compound interest at 15 per cent for two years would be $244).