Chapter 16-17 An Introduction and Application to Infrared ...web.iyte.edu.tr › ~serifeyalcin ›...
35
Chapter 16 - 17 An Introduction and Application to Infrared Spectrometry The infrared region of the spectrum encompasses radiation with wavenumbers ranging from about 12,800 to 10 cm -1 or wavelengths from 0.78 to 1000 m. The infrared spectrum is divided into near-, mid-, and far- infrared radiation.
Transcript of Chapter 16-17 An Introduction and Application to Infrared ...web.iyte.edu.tr › ~serifeyalcin ›...

Chapter 16-17
An Introduction and Application to Infrared
SpectrometryThe infrared region of the spectrum encompasses radiation with
wavenumbers ranging from about 12,800 to 10 cm-1 or wavelengths from
0.78 to 1000 m. The infrared spectrum is divided into near-, mid-, and far-
infrared radiation.

Infrared Spectroscopy
A) IntroductionA) 1.)Infrared (IR) spectroscopy: based on IR absorption by molecules as undergo
vibrational and rotational transitions. Absorption of radiation in this region by a typical
organic molecule results in the excitation of vibrational, rotational and bending
modes, while the molecule itself remains in its electronic ground state.
Potential energy resembles classic Harmonic Oscillator
Po
ten
tia
l E
ne
rgy (
E)
Interatomic Distance (r)
rotational transitions
Vibrational transitions

2.) IR radiation is in the range of 12,800 – 10 cm-1 or l = 0.78 – 1000 m
- rotational transitions have small energy differences
• ≤ 100 cm-1, l > 100 m
- vibrational transitions occur at higher energies
- rotational and vibrational transitions often occur together
3.) Typical IR spectrum for Organic Molecule
Wavenumber (cm-1)
% T
ran
sm
itta
nce

Wide Range of Types of Electromagnetic Radiation in nature.1. Only a small fraction (350-780 nM is visible light).
2. The complete variety of electromagnetic radiation is used throughout spectroscopy.
3. Different energies allow monitoring of different types of interactions with matter.
E=hn = hc/l

3.) Typical IR spectrum for Organic Molecule
- many more bands then in UV-vis, fluorescence or phosphorescence
- bands are also much sharper
- pattern is distinct for given molecule
• except for optical isomers
- good qualitative tool
• can be used for compound identification
• group analysis
- also quantitative tool
• intensity of bands related to amount of compound present
- spectra usually shown as percent transmittance (instead of absorbance)
vs. wavenumber (instead of l) for convenience
Hexane
Hexene
Hexyne
B) Theory of IR Absorption
1.) Molecular Vibrations
i.) Harmonic Oscillator Model:
- approximate representation of atomic stretching
- two masses attached by a spring
E = ½ ky2
where:
y is spring displacement
k is spring constant
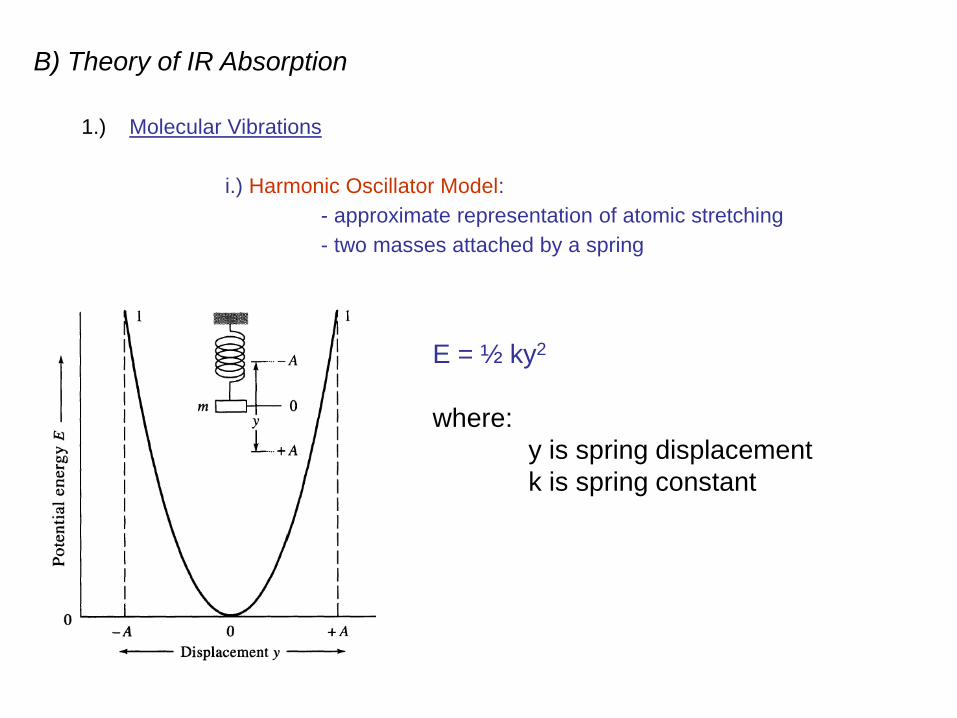
Vibrational frequency given by:
where:
n : frequency
k: force constant (measure of bond stiffness)
: reduced mass – m1m2/m1+m2
If know n and atoms in bond, can get k:
Single bonds:
k ~ 3x10² to 8 x10² N/m (Avg ~ 5x10²)
double and triple bonds ~ 2x and 3x k for
single bond.
So, vibration n occur in order:
single < double < triple
1/ 2 /k mn
kn

ii.) Anharmonic oscillation:
- harmonic oscillation model good at low energy levels (n0, n1, n2, …)
- not good at high energy levels due to atomic repulsion & attraction
• as atoms approach, coulombic repulsion force adds to the bond
force making energy increase greater then harmonic
• as atoms separate, approach dissociation energy and the harmonic
function rises quicker
Harmonic oscillation
Anharmonic oscillation
Because of anharmonics: at low DE, Dn =±2, ±3 are observed which cause the appearance of
overtone lines at frequencies at ~ 2-3 times the fundamental frequency. Normally Dn = ± 1
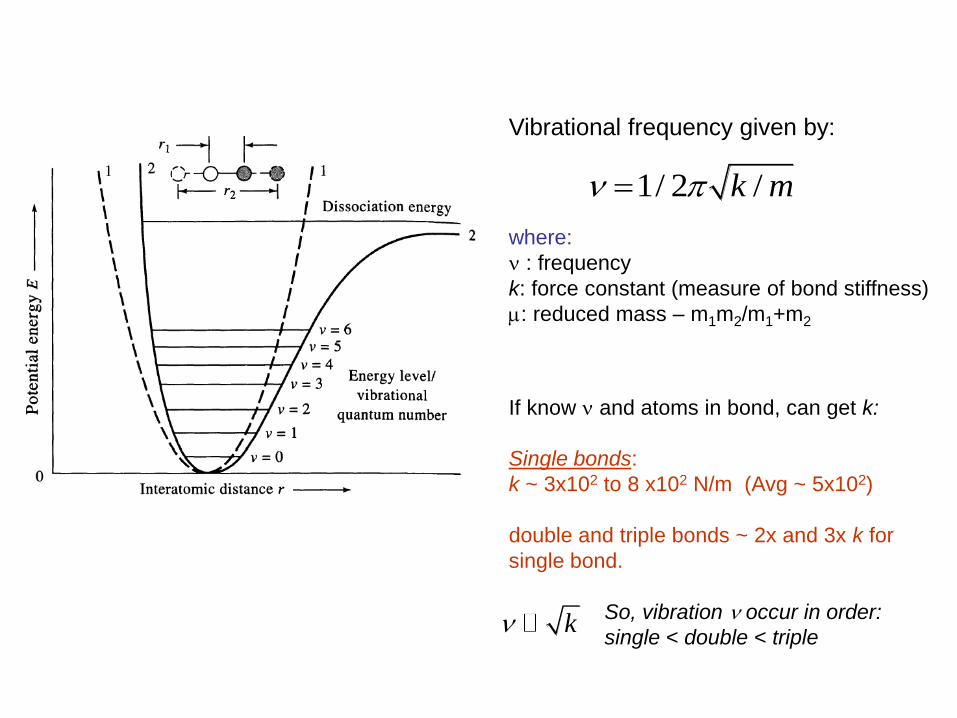
iii.) Types of Molecular Vibrations
Bond Stretching Bond Bending
symmetric
asymmetric
In-plane rocking
In-plane scissoring
Out-of-plane wagging
Out-of-plane twisting

symmetric asymmetric
In-plane rocking
In-plane scissoring
Out-of-plane waggingOut-of-plane twisting
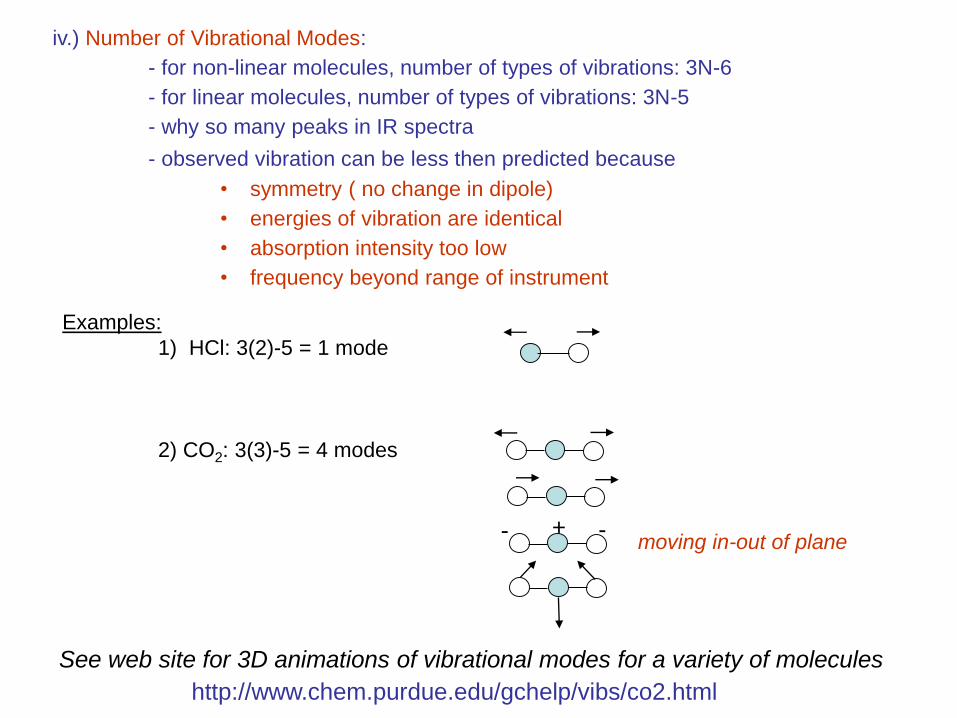
iv.) Number of Vibrational Modes:
- for non-linear molecules, number of types of vibrations: 3N-6
- for linear molecules, number of types of vibrations: 3N-5
- why so many peaks in IR spectra
- observed vibration can be less then predicted because
• symmetry ( no change in dipole)
• energies of vibration are identical
• absorption intensity too low
• frequency beyond range of instrument
http://www.chem.purdue.edu/gchelp/vibs/co2.html
See web site for 3D animations of vibrational modes for a variety of molecules
Examples:
1) HCl: 3(2)-5 = 1 mode
2) CO2: 3(3)-5 = 4 modes
- -moving in-out of plane
+
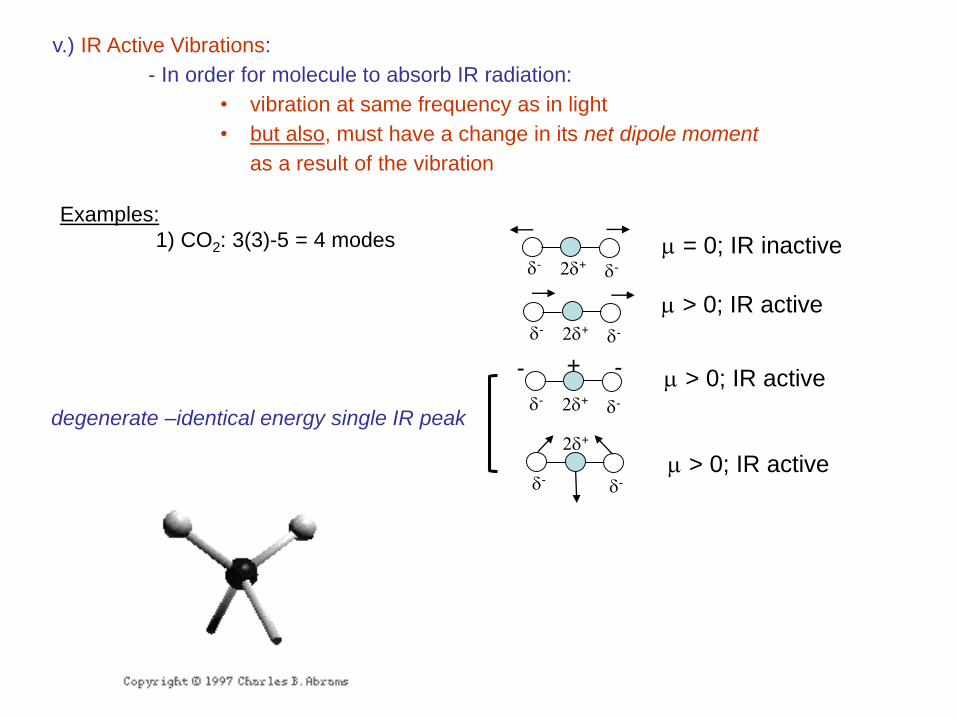
v.) IR Active Vibrations:
- In order for molecule to absorb IR radiation:
• vibration at same frequency as in light
• but also, must have a change in its net dipole moment
as a result of the vibration
Examples:
1) CO2: 3(3)-5 = 4 modes
- -+
= 0; IR inactive
> 0; IR active
> 0; IR active
> 0; IR actived- d-
2d+
d- d-2d+
d- d-2d+
d- d-2d+
degenerate –identical energy single IR peak


Example 8: Calculate the absorption frequency for the C-H stretch with a force constant of k =
5.0x10² N/m.

C) Instrumentation1.) Basic Design
- normal IR instrument similar to UV-vis
- main differences are light source & detector
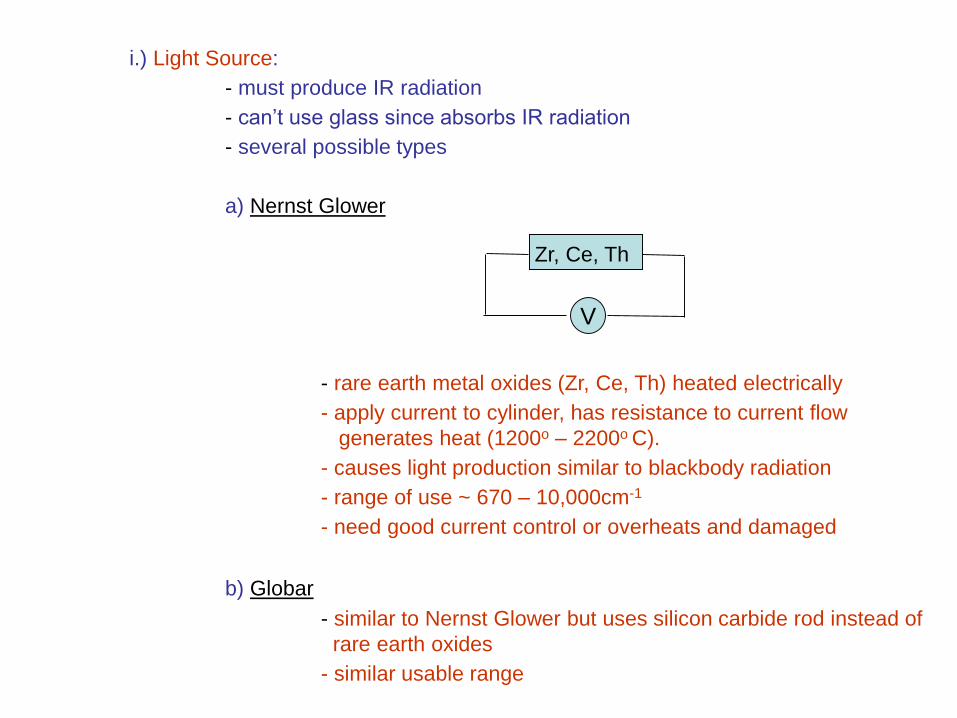
i.) Light Source:
- must produce IR radiation
- can’t use glass since absorbs IR radiation
- several possible types
a) Nernst Glower
- rare earth metal oxides (Zr, Ce, Th) heated electrically
- apply current to cylinder, has resistance to current flow
generates heat (1200o – 2200o C).
- causes light production similar to blackbody radiation
- range of use ~ 670 – 10,000cm-1
- need good current control or overheats and damaged
b) Globar
- similar to Nernst Glower but uses silicon carbide rod instead of
rare earth oxides
- similar usable range
V
Zr, Ce, Th

c) Incandescent Wire Source
- tightly wound nichrome or rodium wire that is electrically heated
- same principal as Nernst Glower
- lower intensity then Nernst Glower or Globar, but longer lifetime
d) CO2 Laser
- CO2 laser gas mixture consists of 70% He, 15% CO2, and 15% N2
- a voltage is placed across the gas, exciting N2 to lowest vibrational levels.
- the excited N2 populate the asymmetric vibrational states in the CO2 through
collisions.
- infrared output of the laser is the result of transitions between rotational states of
the CO2 molecule of the first asymmetric vibrational mode to rotational states of
both the first symmetric stretch mode and the second bending mode
- gives off band of ~ 100 cm-1’s in range of 900-1100 cm-1
- small range but can choose which band used & many compounds have IR
absorbance in this region
- much more intense than Blackbody sources
e) Others
- mercury arc (l > 50 m) (far IR)
- tungsten lamp (4000 -12,800cm-1) (near IR)

ii.) Detectors:
- two main types in common IR instruments
a) Thermal Detectors
1.) Thermocouple
- two pieces of dissimilar metals fused together at the ends
- when heated, metals heat at different rates
- potential difference is created between two metals that varies with their
difference in temperature
- usually made with blackened surface (to improve heat absorption)
- placed in evacuated tube with window transparent to IR (not glass or
quartz)
- IR “hits” and heats one of the two wires.
- can use several thermocouples to increase sensitivity.
V
- +
hn metal1 metal2
IR transparent
material (NaCl)

2.) Bolometer
- strips of metal (Pt, Ni) or semiconductor that has a large change in
resistance to current with temperature.
- as light is absorbed by blackened surface, resistance increases and
current decreases
- very sensitive i
A
hn
b) Photoconducting Detectors
- thin film of semiconductor (ex. PbS) on a nonconducting glass surface
and sealed in a vacuum.
- absorption of light by semiconductor moves from non-conducting to
conducting state
- decrease in resistance increase in current
- range: 10,000 -333 cm-1 at room temperaturevacuum
Transparent
to IR
glass
semiconductor
hn

c) Pyroelectric Detectors
- pyroelectric (ceramic, lithium tantalate) material get polarized (separation
of (+) and (-) charges) in presence of electric field.
- temperature dependent polarization
- measure degree of polarization related to temperature of crystal
- fast response, good for FTIR

iii.) Other Components
a.) Sample Cell
- must be made of IR transparent material (KBr pellets or NaCl)
b.) monochromator
- reflective grating is common
- can’t use glass prism, since absorbs IR
NaCl platesLiguid Sample Holder

iv.) Overall Instrument Design
-Need chopper to discriminate source light
from background IR radiation
-Monochromator after sample cell
-Not done in UV-Vis since letting in all
hn to sample may cause
photdegradation (too much energy)
-IR lower energy
-Advantage that allows
monochromator to be used to screen
out more background IR light
-Problems:
-Source weak , need long scans
-Detector response slow – rounded
peaks

v.) Fourier Transfer IR (FTIR) – alternative to Normal IR
- Based on Michelson Interferometer
Principal:
1) light from source is split by central mirror into 2 beams of equal intensity
2) beams go to two other mirrors, reflected by central mirror, recombine and pass
through sample to detector
3) two side mirrors. One fixed and other movable
a) move second mirror, light in two-paths travel different distances before
recombined
b) constructive & destructive interference
c) as mirror is moved, get a change in signal
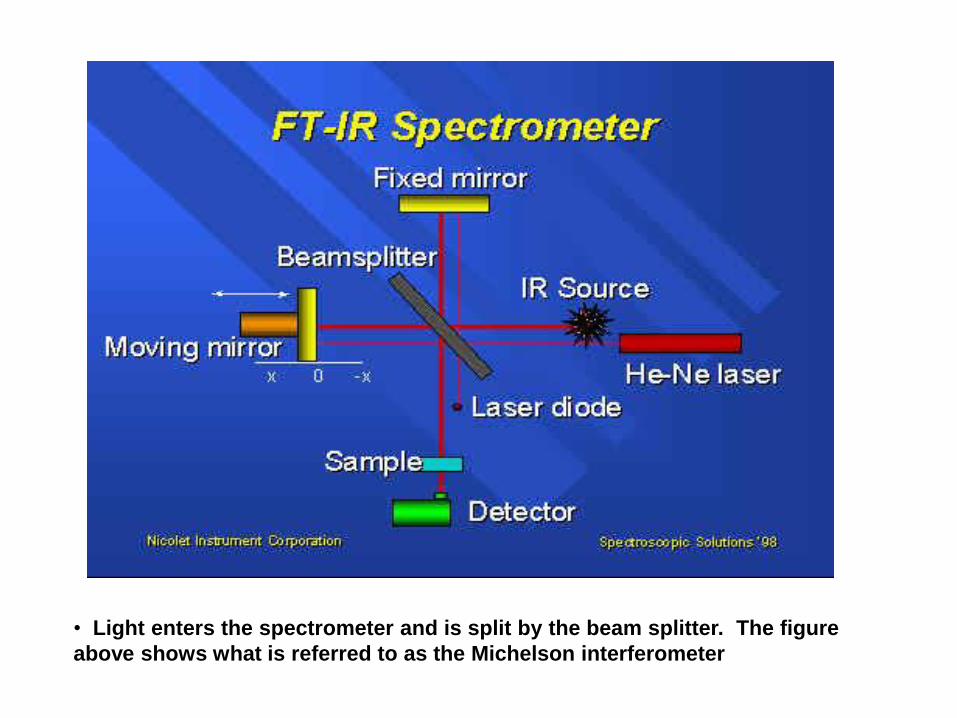
• Light enters the spectrometer and is split by the beam splitter. The figure
above shows what is referred to as the Michelson interferometer
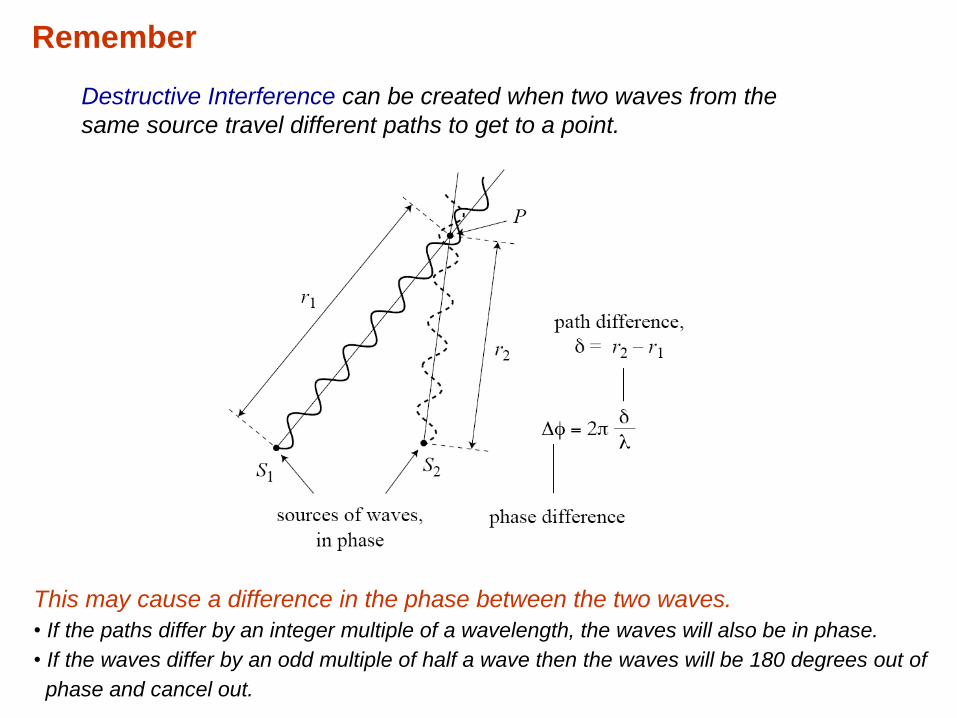
Destructive Interference can be created when two waves from the
same source travel different paths to get to a point.
This may cause a difference in the phase between the two waves.
• If the paths differ by an integer multiple of a wavelength, the waves will also be in phase.
• If the waves differ by an odd multiple of half a wave then the waves will be 180 degrees out of
phase and cancel out.
Remember
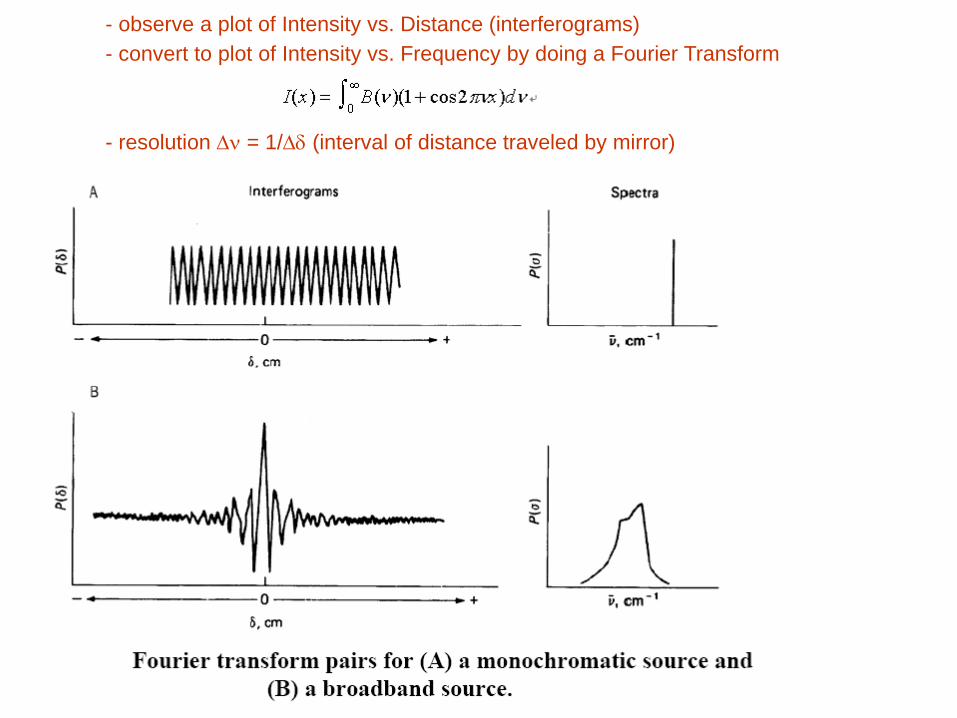
- observe a plot of Intensity vs. Distance (interferograms)
- convert to plot of Intensity vs. Frequency by doing a Fourier Transform
- resolution Dn = 1/Dd (interval of distance traveled by mirror)
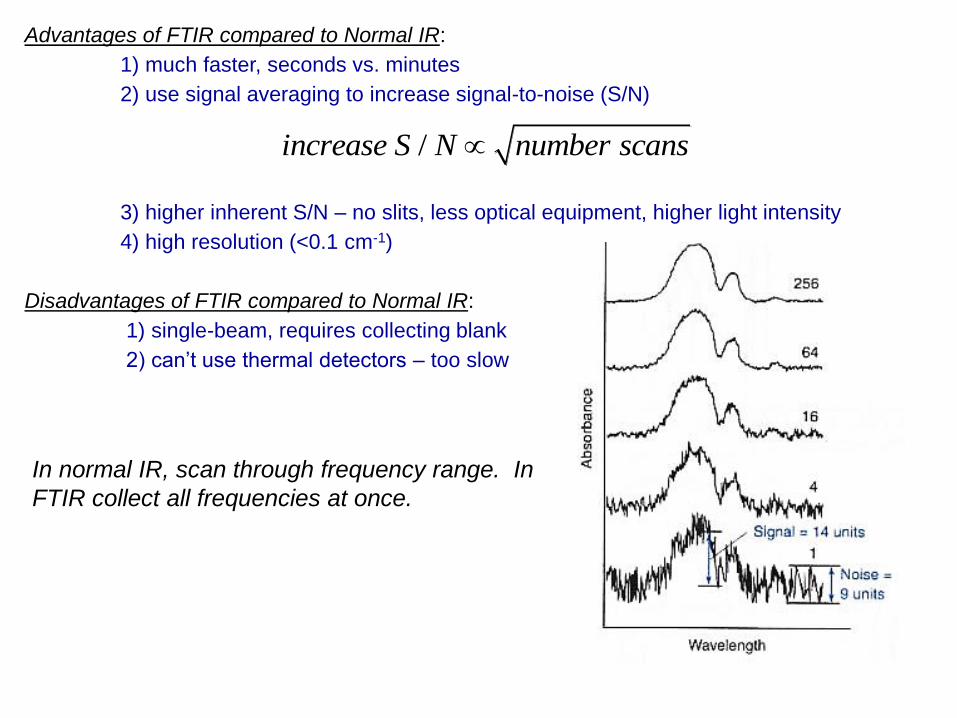
Advantages of FTIR compared to Normal IR:
1) much faster, seconds vs. minutes
2) use signal averaging to increase signal-to-noise (S/N)
3) higher inherent S/N – no slits, less optical equipment, higher light intensity
4) high resolution (<0.1 cm-1)
Disadvantages of FTIR compared to Normal IR:
1) single-beam, requires collecting blank
2) can’t use thermal detectors – too slow
In normal IR, scan through frequency range. In
FTIR collect all frequencies at once.
/increase S N number scans

Advantages of FTIR:
Enhanced signal-to-noise
Rapid scanning
High resolution (<0.1 cm-1)
Accurate and reproducible frequency determinations
Larger energy throughput
Free from problems of stray radiation

D) Application of IR
1.) Qualitative Analysis (Compound Identification)
- main application
- Use of IR, with NMR and MS, in late 1950’s revolutionized organic
chemistry
► decreased the time to confirm compound identification 10-
1000 fold
i.) General Scheme
1) examine what functional groups are present by looking at group
frequency region
- 3600 cm-1 to 1200 cm-1
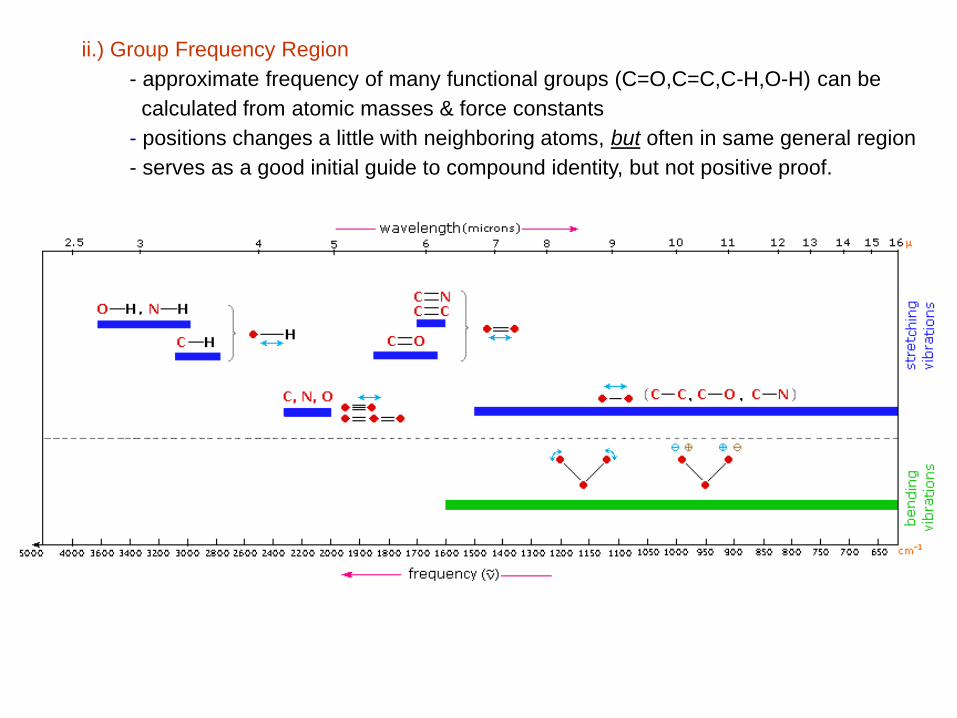
ii.) Group Frequency Region
- approximate frequency of many functional groups (C=O,C=C,C-H,O-H) can be
calculated from atomic masses & force constants
- positions changes a little with neighboring atoms, but often in same general region
- serves as a good initial guide to compound identity, but not positive proof.

Bond Type of Compound Frequency Range, cm-1 Intensity
C-H Alkanes 2850-2970 Strong
C-H Alkenes 3010-3095
675-995
Medium
strong
C-H Alkynes 3300 Strong
C-H Aromatic rings 3010-3100
690-900
Medium
strong
0-H Monomeric alcohols, phenols
Hydrogen-bonded alchohols, phenols
Monomeric carboxylic acids
Hydrogen-bonded carboxylic acids
3590-3650
3200-3600
3500-3650
2500-2700
Variable
Variable, sometimes broad
Medium
broad
N-H Amines, amides 3300-3500 medium
C=C Alkenes 1610-1680 Variable
C=C Aromatic rings 1500-1600 Variable
Alkynes 2100-2260 Variable
C-N Amines, amides 1180-1360 Strong
Nitriles 2210-2280 Strong
C-O Alcohols, ethers,carboxylic acids, esters 1050-1300 Strong
C=O Aldehydes, ketones, carboxylic acids, esters 1690-1760 Strong
NO2 Nitro compounds 1500-1570
1300-1370
Strong
C C
H
C C H
C C
C N
Abbreviated Table of Group Frequencies for Organic Groups
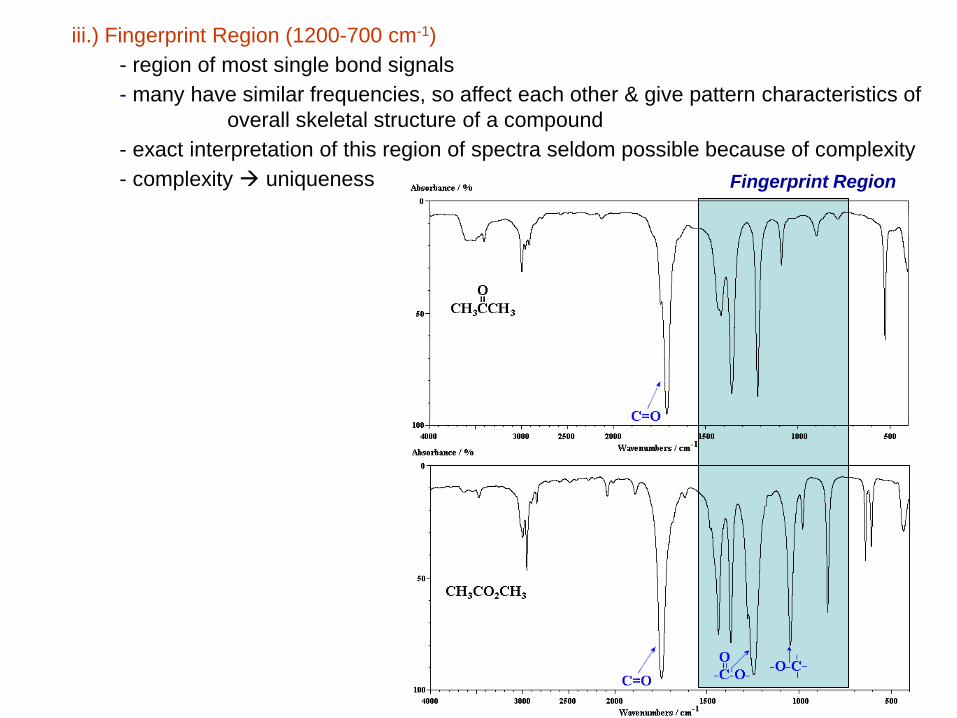
iii.) Fingerprint Region (1200-700 cm-1)
- region of most single bond signals
- many have similar frequencies, so affect each other & give pattern characteristics of
overall skeletal structure of a compound
- exact interpretation of this region of spectra seldom possible because of complexity
- complexity uniqueness Fingerprint Region

iv.) Computer Searches
- many modern instruments have reference IR spectra on file (~100,000 compounds)
- matches based on location of strongest band, then 2nd strongest band, etc
overall skeletal structure of a compound
- exact interpretation of this region of spectra seldom possible because of complexity
- complexity uniqueness
Bio-Rad SearchIT database
of ~200,000 IR spectra

2.) Quantitative Analysis
- not as good as UV/Vis in terms of accuracy and precision
► more complex spectra
► narrower bands (Beer’s Law deviation)
► limitations of IR instruments (lower light throughput, weaker detectors)
► high background IR
► difficult to match reference and sample cells
► changes in e (A=ebc) common
- potential advantage is good selectivity, since so many compounds have different IR
spectra
► one common application is determination of air contaminants.
Contaminants Concn, ppm Found, ppm Relative error, %
Carbon Monoxide 50 49.1 1.8
Methylethyl ketone 100 98.3 1.7
Methyl alcohol 100 99.0 1.0
Ethylene oxide 50 49.9 0.2
chloroform 100 99.5 0.5

Example 9: The spectrum is for a substance with an empirical formula of C3H5N. What is the
compound?
Nitrile or
alkyne groupNo aromatics
Aliphatic
hydrogensOne or more
alkane groups