Chapter 14 TRANSPORT AND COMMUNICATIONS
26
Chapter 14 TRANSPORT AND COMMUNICATIONS A well functioning Transport and communication system is a critical pre-requisite for a country’s development. Investment in the infrastructure directly affects economic growth through many changes such as allowing producers to find the best markets for their goods, reducing transportation time and cost and generating employment opportunity. In addition, efficient transport and communication systems also have network effects and allow adoption of latest production techniques such as just-in time manufacturing. Infrastructure development has been a priority area for Pakistan as evidenced by a number of projects completed or in progress. Major infrastructure projects completed during the last seven years include: Islamabad-Lahore Motorway (M-2), Makran Costal Highway, Nauttal-Sibi section including Sibi Bypass, Dera Allah Yar- Nauttal Section, Khajuri-Bewata Section N-70, Kohat Tunnel and Access Roads, Mansehar-Naran Section, Karachi Northern Bypass, Qazi Ahmed & Shahpur Jehania road, Ratodero-Shahdadkot-Qubo Saeed Khan, Pindi Bhattian-Faisalabad Motorway (M-3), Lahore-Sahiwal Section, Rahim Yar Khan- TMP Section, Baberlo-Pano Aqil Section, Torkham-Jalalabad road, rehabilitation of Band Road Lahore and inauguration of Gwader Port etc. Major on-going projects including, Islamabad- Peshawar Motorway (M-1), Lakpass Tunnel, Gwadar-Turbat-Hoshab (M-8), Khuzdar- Shahdadkot Section, Kalat-Quetta-Chaman Section, Sibi-Dhadar Section, Lyari Expressway, D.I. Khan-Mughalkot Section, Islamabad-Murree Dual Carriageway and R.Y. Khan-Bahawalpur Section. In the long term the transport system is likely to experience tremendous improvement with the implementation of the National Trade Corridor (NTC) programme. I. TRANSPORT i. Road Transport Road transport is the backbone of Pakistan’s transport system, accounting for 90 percent of national passenger traffic and 96 percent of freight movement. Over the past ten years, road traffic – both passenger and freight – has grown much faster than the country’s economic growth. The 10,849 km long National Highway and Motorway network contributes 4.2 percent of the total road network. They carry 90 percent of Pakistan’s total traffic. Pakistan, with about 156 million people, has a reasonably developed transport system. However, when compared with other developed and developing countries, the road density of Pakistan is low. This fact is documented in Fig-14.1. A commonly used indicator for development of the road system is road density (total length of road / total area), which is often used as an index of prosperity, economic activity and development. Pakistan intends to double its current road density of 0.31-km/sq. km to 0.64-km/sq. km gradually over the next 10 years. a) Road Network Pakistan has a road network covering 259,197 kilometres including 172,827 KM of high type roads and 86,370 KM of low type roads. Total roads, which were 229,595 KM in 1996-97, increased to 259,197 KM by 2006-07― an increase of 13 percent. During the out-going fiscal year, the length of the high typed road network increased by 3.2 percent but the length of the low type road network declined by 5.6 percent. Extent of high type roads have increased by 37 percent since 1996-97. A sizable and continuous improvement of the high type road network can be observed from 2001 to 2007, where the network grew at an 207
Transcript of Chapter 14 TRANSPORT AND COMMUNICATIONS

Chapter 14
TRANSPORT AND COMMUNICATIONS
A well functioning Transport and communication system is a critical pre-requisite for a country’s development. Investment in the infrastructure directly affects economic growth through many changes such as allowing producers to find the best markets for their goods, reducing transportation time and cost and generating employment opportunity. In addition, efficient transport and communication systems also have network effects and allow adoption of latest production techniques such as just-in time manufacturing.
Infrastructure development has been a priority area for Pakistan as evidenced by a number of projects completed or in progress. Major infrastructure projects completed during the last seven years include: Islamabad-Lahore Motorway (M-2), Makran Costal Highway, Nauttal-Sibi section including Sibi Bypass, Dera Allah Yar-Nauttal Section, Khajuri-Bewata Section N-70, Kohat Tunnel and Access Roads, Mansehar-Naran Section, Karachi Northern Bypass, Qazi Ahmed & Shahpur Jehania road, Ratodero-Shahdadkot-Qubo Saeed Khan, Pindi Bhattian-Faisalabad Motorway (M-3), Lahore-Sahiwal Section, Rahim Yar Khan-TMP Section, Baberlo-Pano Aqil Section, Torkham-Jalalabad road, rehabilitation of Band Road Lahore and inauguration of Gwader Port etc. Major on-going projects including, Islamabad-Peshawar Motorway (M-1), Lakpass Tunnel, Gwadar-Turbat-Hoshab (M-8), Khuzdar-Shahdadkot Section, Kalat-Quetta-Chaman Section, Sibi-Dhadar Section, Lyari Expressway, D.I. Khan-Mughalkot Section, Islamabad-Murree Dual Carriageway and R.Y. Khan-Bahawalpur Section. In the long term the transport system is likely to experience tremendous improvement with the implementation of the National Trade Corridor (NTC) programme.
I. TRANSPORT
i. Road Transport
Road transport is the backbone of Pakistan’s transport system, accounting for 90 percent of national passenger traffic and 96 percent of freight movement. Over the past ten years, road traffic – both passenger and freight – has grown much faster than the country’s economic growth. The 10,849 km long National Highway and Motorway network contributes 4.2 percent of the total road network. They carry 90 percent of Pakistan’s total traffic.
Pakistan, with about 156 million people, has a reasonably developed transport system. However, when compared with other developed and developing countries, the road density of Pakistan is low. This fact is documented in Fig-14.1. A commonly used indicator for development of the road system is road density (total length of road / total area), which is often used as an index of prosperity, economic activity and development. Pakistan intends to double its current road density of 0.31-km/sq. km to 0.64-km/sq. km gradually over the next 10 years.
a) Road Network
Pakistan has a road network covering 259,197 kilometres including 172,827 KM of high type roads and 86,370 KM of low type roads. Total roads, which were 229,595 KM in 1996-97, increased to 259,197 KM by 2006-07― an increase of 13 percent. During the out-going fiscal year, the length of the high typed road network increased by 3.2 percent but the length of the low type road network declined by 5.6 percent. Extent of high type roads have increased by 37 percent since 1996-97. A sizable and continuous improvement of the high type road network can be observed from 2001 to 2007, where the network grew at an
207

Economic Survey 2006-07
average rate of 3.3 percent. The continuous improvement and rehabilitation of the existing roads reflects the government’s enhanced focus on infrastructure. As a result of an emphasis on high type roads, many low typed roads were converted to high typed roads during this period. There are many ways by which availability of improved and wide spread modern road networks can facilitate economic activity. For example, they could help alleviate poverty by providing access to far flung rural areas, create more jobs by supporting
economic activity along the network and provide numerous small-scale investment opportunities. In addition, introduction of Khushal Pakistan Programme, has helped to rehabilitate and modernise rural road network along with implementation of wide ranging development activities through various district governments under the devolution programme. The annual growth of roads in Pakistan between 1996-97 and 2006-07 is given in Table-14.1 and Fig-14.2
Fig-14.1 Road Density Comparisons
3.07
1.62 1.7
1.62
1.04
1
0.68
0.2 0.
32
0.23
0.17
0.15
0.08
0.65
0
0.5
1
1.5
2
2.5
3
3.5
Japan
France
Hungary
UK Italy
India
USA
Spain
Malaysia
Pakistan
Brazil
Indonesia
China
Argentina
Source: National Highway Authority
Roa
d Le
ngth
/ Sq
. Km
of A
rea
Fig-14.2: Length of Roads
5000
070
000
9000
01100
0013
0000
1500
0017
0000
1900
00
1996
-97
1997
-98
1998
-99
1999
-200
0
2000
-01
2001
-02
2002
-03
2003
-04
2004
-05
2005
-06
2006
-07
Kilo
met
ers
High Type Road Low Type Road Source: NTRC
208
Transport and Communications
b) National Highway Authority (NHA)
The NHA is currently the custodian of nearly all of Pakistan's major inter-provincial road links called the national highways, including the motorways and strategic roads. These roads comprise only around 4 percent of Pakistan's total road network but carry 80 percent of the country’s commercial traffic. Consequently, the network is under pressure and its importance from a development perspective cannot be over emphasized. The province wise breakup of NHA network is given in Table.14.2.
The present highway network is under strain by rising traffic flow and a slow pace of increase in capacity. Consolidation, preservation and
improvement of the existing highways are needed on an urgent basis. Gradual extension of the network is also equally important to develop remote areas and to better connect major economic and social centers of Pakistan. The details of major projects completed and on going projects are shown in Table.14.3 and Table.14.4
Table:14.2 Province Wise Break-up Province Km % Share Punjab 2475 22.81 Sindh 1604 14.78 NWFP 1651 15.22 Balochistan 4177 38.50 NA/AJK 942 08.69 Total 10849 100%
Source: NHA
Table:14.3 Major Completed Road Projects S.No. Project Length (KM) Province
1. Makran Costal Highway 634 Balochistan 2. Nauttal-Sibi section including Sibi Bypass 86 Balochistan 3. Dera Allah Yar-Nauttal Section 60 Balochistan 4. Khajuri-Bewata Section N-70 68 Balochistan 5. Kohat Tunnel and Access Roads 31 NWFP 6. Mansehra-Naran Section 124 NWFP 7. D.I.Khan-CRBC (Indus Highway) 14 NWFP 8. Karachi Northern Bypass 57 Sindh 9. Qazi Ahmed & Shahpur Jehania Road 102 Sindh
Table 14.1: Length of Roads (Kilometres) High Type Low Type # Total Fiscal Year
Length %Change Length %Change Length % Change 1996-97 126,117 6.5 103,478 3.6 229,595 5.2 1997-98 133,462 5.8 107,423 3.8 240,885 4.9 1998-99 137,352 2.9 110,132 2.5 247,484 2.7 1999-2000 138,200 0.6 110,140 0 248,340 0.3 2000-01 144,652 4.7 105,320 -4.4 249,972 0.7 2001-02 148,877 2.9 102,784 -2.4 251,661 0.7 2002-03 153,225 2.9 98,943 -3.7 252,168 0.2 2003-04 158,543 3.5 97,527 -1.4 256,070 1.5 2004-05 162,841 2.7 95,373 -2.2 258,214 0.8 2005-06 167,530 2.9 91,491 -4.1 259,021 0.3 2006-07* 172,827 3.2 86,370 -5.6 259,197 0.1 * Estimated Source: Ministry of Communications # : The percentage change in low type roads can be negative as many of these roads are being converted to high type roads.
209

Economic Survey 2006-07
Table:14.3 Major Completed Road Projects S.No. Project Length (KM) Province
10. Ratodero-Shahdadkot-Qubo Saeed Khan 64 Sindh 11. Pindi Bhattian-Faisalabad Motorway, M-3 52 Punjab 12. Lahore-Sahiwal Section 40 Punjab 13. Okara Bypass 13 Punjab 14. Rahim Yar Khan-TMP Section 80 Punjab 15. Baberlo-Pano Aqil Section 30 Sindh 16. Rehabilitation of Bund Road Lahore 19 Punjab 17. Torkham-Jalalabad Road. 75 Afghanistan
Source: NHA
Table:14.4 Major Ongoing Road Projects S.No. Project Length (KM) Province
1. Gwadar-Turbat-Hoshab (M-8) 193 Balochistan 2. Khuzdar-Shahdadkot Section 82 Balochistan 3. Khanozai-Muslim Bagh Section 50 Balochistan 4. Kalat-Quetta-Chaman Section 230 Balochistan 5. Gawadar-Pleri Section 67 Balochistan 6. Sibi-Dhadar Section 26 Balochistan 7. Lakpass Tunnel 280 m Balochistan 8. Lyari Expressway 32 Sindh 9. Lowari Rail Tunnel and access roads 27 N.W.F.P
10. Naran-Jhalkhad-Chillas Section 40 N.W.F.P 11. Dualization of Takht Bahi-Dargai Road 30 N.W.F.P 12. D.I.Khan-Mughalkot Section 124 N.W.F.P 13. Islamabad-Peshawar Motorway 152 N.W.F.P/Punjab 14. Islamabad-Murree Dual Carriageway 43 Punjab 15. R.Y.Khan-Bahawalpur Section 90 Punjab
Source: NHA
ii. Pakistan Railways
A well functioning railway system is crucial for sustainable economic growth. Railways have a definite edge over roads for long haul and mass scale traffic movement, both for passenger and freight, as a safe, economical and environment friendly mode of transport. It not only contributes to economic growth but also promotes national integration. Pakistan Railways was the primary mode of transportation in the country till seventies. However, due to diversion of resources to expansion of road network, the performance of Pakistan Railway declined and it’s share of inland traffic reduced from 41 percent to 10 percent for passenger and 73 percent to 4 percent for freight traffic.
During the last seven years (2000-2007), Pakistan Railways has shown improving trend in both passenger and freight traffic, registering an average increase of 5.6 percent and 8.0 percent per annum, respectively. A positive growth of 5.7 percent and 6.9 percent has been recorded in passenger traffic and freight traffic, respectively during 2005-06. Further, the passenger and freight carried by railways increased by 6.3 percent and 7.0 percent respectively during July-March 2006-07. The positive growth trend for seven consecutive years (2000-2007) can be attributed to the wide range of improvements made by the Pakistan Railways through completion of a number of development projects and better policies aimed at modernization of PR. Pakistan Railways has introduced 9 new train services in
210

Transport and Communications
order to facilitate passengers as well as freight customers. (Table.14.6). PR has also improved the
quality of its services, timeliness and cleanliness. This trend is reported in Table.14.5.
Table 14.5 Trend of Passengers Traffic and Freight Traffic (Road vs Rail)
Passenger Traffic (Million passenger Km) Freight (Million Ton KM) Fiscal Year Road %Change Rail %Change Road %Change Rail %Change
1996-97 163,751 5.9 19,114 1.1 84,345 5.6 4,607 -9.3 1997-98 173,857 6.2 18,774 -1.8 89,527 6.1 4,447 -3.5 1998-99 185,236 6.5 18,980 1.1 95,246 6.4 3,967 -10.8 1999-00 196,692 6.2 18,495 -2.6 101,261 6.3 3,753 -5.4 2000-01 208,370 5.9 19,590 5.9 107,085 5.7 4,520 20.4 2001-02 209,381 0.5 20,783 6.1 108,818 0.2 4,573 1.2 2002-03 215,872 3.1 22,306 7.3 110,172 1.2 4,820 5.4 2003-04 222,779 3.2 23,045 3.3 114,244 3.7 5,336 10.7 2004-05 232,191 4.2 24,238 5.2 116,327 1.8 5,532 3.6 2005-06 238,077 2.5 25,621 5.7 117,035 0.6 5,916 6.9
(Jul-Mar) 2005-06
179,005
19,672
87,996
3,539
2006-07* 191,057 6.7 20,921 6.3 88,032 0.04 3,786 7.0 * Estimated Source: Ministry of Railways & Ministry of Communications
In order to continue improvements and to consolidate reforms, Pakistan Railways has prepared a business plan for 2005-11. The plan places emphasis on encouraging private sector participation in order to increase its competitiveness, responsiveness and efficiency. Pakistan Railway is planning to take a series of interlinked initiatives, which will enable it to
compete efficiently in the fast growing transport sector in Pakistan.
Pakistan has awarded a contract to an international consortium to carry out a feasibility study for establishing a rail link with China. A rail link could further boost trade relations between the two countries by facilitating the already growing trade with China and operations of Gwadar Sea Port.
Table: 14.6 New Trains S.No Trains Section Date of
Commencement i) Thar Express Karachi-Zero Point 18-02-2006 ii) Margala Express Lahore-Rawalpindi 22-05-2006 iii) Marvi Express Mirpurkhas-Khokhropar 07-06-2006 iv) Sindh Express Lahore-Karachi 24-07-2006 v) Buraq Express Rawalpindi-Karachi 14-08-2006 vi) Peshawar Express Peshawar-Rawalpindi 15-12-2006 vii) Pakistan Express Rawalpindi-Karachi(Via Hafizabad, Faisalabad And
Multan 16-12-2006
viii) Jinnah Express Karachi-Rawalpindi. 08-01-2007 ix) Sir Syed Express Rawalpindi-Karachi 08-03-2007
Source: M/O Railways
211
Economic Survey 2006-07
An amount of Rs. 10.42 billion was allocated to PR development for the financial year 2006-07. The major development schemes under taken were Track Renewal of 221 KM of Rails and 455 KMs of sleepers for the planned main line from Karachi-Khanpur. Twenty locomotives in CKD condition were imported from China, out of which 10 locomotives were manufactured in Pakistan Locomotive Factory. The rehabilitation programme for old locomotives will be continued. The earning of Pakistan Railways since 1998-99 are given in Table.14.7.
Table-14.7 : Earnings of Pakistan Railways (Rs. Million)
Year Earnings % Change 1998-99 9,310 -- 1999-2000 9,889 6.2 2000-01 11,938 20.7 2001-02 13,046 9.3 2002-03 14,812 13.5 2003-04 14,636 -1.2 2004-05 18,027 23.2 2005-06 18,184 0.9
Source: Ministry of Railways
iii) Civil Aviation Authority (CAA)
After the completion of a new terminal complex (NTCL) at the Lahore airport, the construction of a new Islamabad international airport (NIIA) is expected to play a major role in the national aviation sector. The airport shall be developed by the Civil Aviation Authority (CAA) on self-finance basis with an estimated total cost of Rs. 25 billion on 3200 acres of land. The CAA is also going to undertake the development work on the New Gwadar International Airport through Public Sector Development Programme (PSDP), at a total estimated cost of Rs. 3.6 billion. The airport is planned for latest generation wide bodied aircraft in order to accommodate all the future requirements of Gwadar city. A new green field international airport, initiated by the local business community, is under completion in Sialkot. The project is being constructed on a build, own and operate (BOO) basis and is mainly for commercial purposes. It is likely to boost exports of leather and surgical goods. The plans for upgrading Multan and Peshawar International Airports have also been prepared with estimated cost of Rs. 2.6 billion and Rs. 0.6 billion respectively.
a) Pakistan International Airlines (PIA)
Civil aviation plays an important role in the development of the economy by providing rapid access between the different parts of the country as well as to other parts of the world. Private participation has also been encouraged through concessions and incentives for development of airports and airlines to increase availability of air transport services within and out side the country. Pakistan International Airlines carried 4.245 million passengers during July-March 2006-07 as compared to 4.355 million passengers in the same period of last year. This decrease of 2.5 percent is likely due to grounding of PIA F 27 fleet in July 2006. The airline’s revenue was 11.557 million RPKs in July-March 2006-07 as against 11.649 million PKRs generated in the corresponding period of last year, registering a marginal decrease of 0.8 percent. The passenger capacity remained almost unchanged during the first 9 months (July-March) of the current fiscal year over the same period last year. During July-March 2006-07, cargo traffic was 304.0 million Revenue Freight Tonne Kilometre (RFTKS) as against 313.8 RFTKS in the same period last year thus registering a decline of 3.1 percent. The cargo handling capacity in terms of Available Freight Tonne Kilometre (AFTKS) has increased to 517.0 million during July-March 2006-07 as against 500.4 million in 2005-06, thus registering an increase of 3.3 percent. The airline is pursuing a long term fleet modernization plan which envisages induction of two additional Boeing 777-300ER family aircraft during July-March 2006-07. In addition one B777-200ER was inducted on long term lease during the same period. As replacement of grounded F27 aircraft, 4 ATR42 500 were also added to the PIA fleet during the same period thus bringing total number of aircraft in PIA fleet to thirty nine.
iv) Ports & Shipping
a) Karachi Port Trust (KPT)
The steady and continuous progress made by KPT has helped boost the national economy. The KPT established an annual cargo handling record of over 32.3 million tons during 2005-06 showing a sizable growth of 12.8 percent over 2004-05. However, during the first nine months of the current fiscal year, the port handled a cargo volume of 22.4 million tonnes as compared to 24.6
212
Transport and Communications
million tonnes handled in the corresponding period last year registering a decline trend of 8.7 percent. This is mainly due to a fall in imports of fertilizer by 49 percent, sugar by 38 percent, iron scrap by 60 percent and crude oil by 16 percent which led to an over all decrease of import cargo
by 12 percent during first nine month of current financial year. However, the volume of export increased by 4.1 percent during first nine months of current fiscal year. Statistics of cargo handled during the last ten years are given in Table 14.8
Table 14.8 : Cargo Handled at Karachi Port (000 Ton)
Year Imports %Change Exports %Change Total % Change 1996-97 18,362 -1.9 5,113 5.2 23,457 -0.4 1997-98 17,114 -6.8 5,570 8.9 22,684 -3.4 1998-99 18,318 7.0 5,735 3.0 24,053 6.0 1999-2000 17,149 -0.9 5,613 -2.1 23,762 -1.2 2000-01 20,064 10.5 5,918 5.4 25,98 9.3 2001-02 20,330 1.3 6,362 7.5 26,692 2.7 2002-03 19,609 -3.5 6,273 -1.4 25,852 -3.1 2003-04 21,732 10.8 6,081 -3.1 27,813 7.6 2004-05 22,100 1.7 6,515 7.1 28,615 2.9 2005-06 25,573 15.7 6,697 2.8 32,270 12.8 July –March 2005-06 19,625 4,947 24,572 2006-07 17,277 -12.0 5,150 4.1 22,427 -8.7
Source: KPT
The existing port facilities appear to be inadequate to handle the growing cargo at the port. In order to address these constraints, the KPT has launched a number of projects, which are at different stages of execution. A number of projects have been formulated for phased implementation on a BOT basis covering various activities in port operations. The KPT has commissioned the project titled “Karachi Interval Container Terminal (KICT)”. The project is already operational at the west wharf and it has annual capacity of 350,000 twenty equal units (TEU). An additional $ 65 million was invested to enhance its capacity upto 525,000 TEU. The 3rd phase of the project was launched on March 7, 2005, with an investment of US$ 55 million to extend the capacity up to 700,000 TEU. In addition, KPT has awarded a contract for a second container terminal on BOT basis with estimated cost of US$ 75 million. To ease transportation problem between the port and the factory, the KPT has pledged to contribute over Rs.2.8 billion for reconstruction of roads. As the new generation of container ships come on board, KPT is taking initiatives to be able to cater to the even higher capacity fifth and sixth generation ships. This involves the development of 10 deep
draught berths with the total cost of US $ 1,087 million.
b) Port Qasim
Port Qasim is fast becoming a major contributor to national economy of Pakistan with an impressive growth in port operations. During 2005-06 cargo handled at the port increased by 10.8 percent from 21.3 million tonne to 23.6 million with the increase of marine traffic by 8 percent. The cargo handling during July- March 2006-07 increased from 16.8 million tonne to 19.7 million tonne over the corresponding period last year. This is an increase of 17 percent which is higher than 14 percent increase recorded for the same period last year. During the last 3 years a marked improvement has also been witnessed in revenue growth. The revenue generation over the last five years was increased from Rs. 2 billion to Rs.3.4 billion. The PQA is currently pursuing a large number of projects for capacity enhancement and industrialization, attracting foreign direct investment (FDI) and simultaneously undertaking major infrastructure development to enhance its efficiency. The port has already attracted US $ 1.5 billion of FDI.
213
Economic Survey 2006-07
c) Pakistan National Shipping Corporation (PNSC)
PNSC manages 15 vessels with a total capacity of 636,182 dwt. The existing fleet consist of 10 multi-purpose cargo vessels, 4 Aframax crude oil tankers and one Panamax bulk carrier vessel which were acquired through PNSC’s own resources. The four Aframax oil tankers are participating in national and regional crude oil trade. PNSC has carried crude oil cargoes for India, Bangladesh and Sri Lanka. During fist nine months of the current fiscal year, the PNSC has lifted 5.4 million tonne of liquid cargo and 1.0 million tonne of dry cargo. The Corporation is continuing with its efforts to add more vessels at a total cost of about US$ 150 million out of which US$ 135 million is being arranged through foreign financing.
d) Gwadar Port
The Gawadar port was inaugurated on 20th March 2007. Gwadar, a district of Balochistan enjoys a strategic position on the coastline of Pakistan. Balochistan in general and Gwadar in particular has been neglected in the past but its 600 km long coastline has been brought to the lime-light by the present government which is determined to develop this Port into one of the most modern Ports in the world. This port would be an integral component of the trade corridor for Central Asian states, China and the Gulf as 60 percent trade of oil and gas is done through this route.
A deep sea port like Gwadar is already attracting global attention, and once it is fully developed with all supporting facilities required to handle trans-shipment and trade, Gwadar will become one of the important gateways to prosperity for the people of Pakistan in general and Balochistan in particular. Gwadar could spur economic progress through out the region by reducing the transport time between China, Middle East, Central Asian States, Europe and Africa. Some experts even estimate that Pakistan could earn up to US $ 60 billion per annum out of transit trade when Gawadar Port and the National Trade Corridor are fully developed and operational.
The operation and management of the port was recently handed over to the Singapore Port Authority (SPA) under a 40 year agreement between the Gawadar Port Authority (GPA) and
the Concession Holding Company (CHC) a subsidiary of the GPA that is operating 22 ports in 11 countries. The company will invest $ 550 million in next five years. The port will not only promote trade and transport with Gulf States, but will also provide transshipment of containerized cargo, unlock the development potential of hinterland and will become a regional hub for major trade and commercial activities.
e) Future Outlook
National Trade Corridor
In order to create a growth-facilitating infrastructure a major initiative namely the “National Trade Corridor” has been launched, to revamp the whole transport sector including ports, roads, railway, aviation etc. A framework to develop and improve the North South Corridor has been incorporated in it. The framework takes a holistic and integrated approach to reduce the cost of doing business in Pakistan by improving the trade and transport logistics chain and bringing it up to international standards. The initiative is in line with Medium Term Development Framework (MTDF). The government’s strategy to establish a multi-modal transport system is based on emphasis on asset management with consolidation, upgradation, rehabilitation and maintenance of the existing system; enhanced private sector participation in transport and use of modern technology to increase sector efficiency. The strategy aimed at enhancing regional connectivity to improve links to the Central Asian States, Iran, Afghanistan and India. With the development of the North-South and East West trade links, energy and industrial corridors with China, Central Asian Republics, Afghanistan and Iran would also be developed.
Basic theme of the National Trade Corridor Improvement Program is “Decreasing the cost of doing business through improvements in the trade logistics”. Basic thrust would be to get results through short term / long term measures. In the short term, quick results would be achieved with small investments through policy interventions, systematic & procedural improvements, reducing costs & time and eliminating red-tapism. Long-term measures include higher investments on infrastructure, deep-rooted institutional reforms to
214
Transport and Communications
ensure sustainability and conducive environment for pragmatic investment by the private sector.
An efficient and well-integrated transport system facilitates the development of a competitive economy and creates vast opportunities to reduce poverty. It also ensures safety in mobility and augment regional connectivity. All these efforts are expected to help increase Pakistan’s exports from US$ 17 billion in 2006 to around US$ 250 billion by 2030. This program would not only target the trade
facilitation and infrastructure development, but also will serve for developing an energy and Industry corridor in future. Pakistan can establish exclusive industrial zones for Chinese and other Central Asian entrepreneurs near the industrial cities of Karachi, Lahore, Faisalabad and Peshawar. The NTC will also boost the emerging trade and business status of the Gawadar Port. The main findings of the National Trade Corridor’s (NTC) are highlighted in Box-14.1
BOX-14.1
Logistic costs will come down from 11 percent of Foreign Trade Account to 6.11 percent
Customs clearance times will reduce from 4 days to less than one day.
Freight Forwarding Rules (FFR) formulation by Central Board of Revenue (CBR) and Pakistan Institute of Freight Forwardor Association (PIFFA) has started; State Bank of Pakistan (SBP) now allows external remittance to Freight Forwarded (FF); FF trainings are being organized.
Duty rationalized on equipment for establishing wholesale/retail chain stores.
National Trade Facilitation Strategy would be developed.
Private terminal operators directed to install scanners-specifications and the time lines communicated to the terminal operators by CBR.
Road Freight Industry (RFI) Strategy Paper has been Prepared;
Duty on multi-axle trucks and prime movers rationalized.
Stakeholder consensus developed to allow import of second hand multi-axle trucks to all industry but age limited to 4 years.
Port Qasim Authority (PQA) and Karachi Port Trust (KPT) Business Plan (covering study of management practices of Malaysia, Singapore, and other best practice Ports) are under preparation.
Reduction in wet charges by 15 percent and reduction in free dwell time at port by 15 percent has been notified and being implemented. Reduction in free dwell time has indirectly increased the port capacity. Double charging during port handling by the shipping lines and terminal operators would be removed.
World class airlines such as Virgin Atlantic, Singapore and Ettihad have been invited to start their operations. Bi-lateral and Air Service Agreements being expended with several countries. Operational frequencies have been given to 7 foreign airlines resulting in 29 additional landings per week. These include Thai, Cathay Pacific, Malaysian, Turkish, Bahrain, Gulf & Ettihad.
External communications/ media strategy has been developed to inform all stakeholders about the National Trade Corridor Improvement Programe (NTCIP) Vision.
Deep draught vessels contribute to reduce the costs of trade. Berths and channels at Karachi and Qasim ports have been planned to be deepened to attract large size vessels having deep draughts.
215

Economic Survey 2006-07
KPT, PQA and Gwadar Port Authority (QPA) would be transformed into commercial organizations with corporate culture.
A “Ports Maintenance & Management Training” program is under preparation for young officers from all the three ports.
Pakistan Railways has become the first government entity to prepare draft Corporate Business Plan. Next step is to develop a separate dedicated freight business unit to improve the railway’s financial health and then gradually transform the Railways into a commercial corporation.
Numbers of freight trains from port to upcountry and back have increased from one to 5 trains daily. Projects of doubling of main line track and induction of new locomotives, flat-bed container wagons
& new passenger coaches have been approved and under implementation. State-of-the-Art auto-block, computer based signaling system on the main line has been planned to ensure better speed &safety.
Freight Business Unit would be established after completion of financial restructuring of PR to establish separate line of business.
Proactive marketing has resulted in agreement with private parties to start two new express freight trains thus increasing total to 5 fast cargo trains overall.
National Expressway Corridor Improvement/Rehabilitation Plan costing US$ 2.0 billion has been appraised and approved.
The spot interdictions on N-5 have been reduced by 70 percent which has resulted in reduction in the turn around time.
Pilot overloading control program is being implemented by NHA. New Aviation Policy is being developed with contribution of all stakeholders including
public/private sector and international development partners to bring the civil aviation at par to the best international standards.
Source: Planning Commission
II. TELECOM SECTOR
The Government and the Regulator (Pakistan Telecommunication Authority) have created a business friendly environment in the telecom sector of Pakistan through a series of initiatives. The Government has announced various business centric policies, which take into account the market demands and challenges, are open and consistent, and are creating a conducive environment for healthy business activities in the sector. Competition has now been introduced in each segment of Pakistan’s telecom sector including fixed line, mobile and other value added telecom services. An unprecedented growth has been witnessed in almost every segment and the cellular phone sector in particular. Total teledensity in the country has reached 40.2 (as of end April 07) registering year on year (YoY) growth of 53 percent (Table.14.9). During July-April 2006-07, telecom sector attracted US$ 1.4 billion which is expected to cross one and half billion dollar mark
at the end of year. As a result of strong growth in the sector the revenues of the telecome companies reached Rs. 193 billion last year and is expected to cross Rs. 240 billion in 2006-07. Consequently, the contribution of telecom sector in the government’s exchequer is also expected to cross Rs. 81 billion during 2006-07. The success of telecom sector in Pakistan is now globally recognized and it has emerged as a role model for other emerging telecom markets.
Table: 14.9 Teledensities of Regional Countries (%) 2002-
03 2003-
04 2004-
05 2005-
06 2006-07*
Pakistan 4.3 6.3 11.9 26.2 40.2 Sri Lanka 12.2 16.6 23.4 29.0 37.0 India 7.1 8.9 11.5 12.8 15.4 Bangladesh 1.6 2.0 4.5 9.0 15.0 Nepal 1.8 2.0 3.0 3.5 6.5 Teledensity includes fixed, WLL and mobile * As of 30th April 2007
Source: PTA
216

Transport and Communications
i). Telecom Sector Growth
The dramatic growth on the telecom sector has been supported by prudent government policies. Teledensity of the country has improved many folds in the last couple of years. Currently the total teledensity in Pakistan is over 40.2 percent, which was just 2.8 percent at the end of 2000. Total number of mobile subscribers in Pakistan has crossed 55.6 million by end March 2007 whereby mobile density has hit 35.8 percent, far surpassing the fixed line teledensity which is 3.32 percent with total working connections of 5.2 million. The Wireless Local Loop (WLL) subscribers are also on the rise and have reached 1.6 million. Similarly, value added services, such as payphones and Internet usage are also on the rise. There are 353,194 PCOs working across Pakistan and more than 2.4 million registered Internet subscribers with an estimated 12 million Internet users. (Table.14.10 ).
Table:14.10 Teledensity of Pakistan (%)
Years Fixed Cellular WLL Total
2001-02 2.50 1.16 3.66 2002-03 2.69 1.62 4.31 2003-04 2.94 3.31 6.25 2004-05 3.43 8.29 0.17 11.89 2005-06 3.37 22.16 0.66 26.19 Mar 2007 3.32 35.79 1.06 40.17
Source: PTA
a) Cellular Mobile
The growing competition in the vibrant cellular market of Pakistan has compelled the operators to offer very competitive services. Four out of five GSM operators performed well during the year exhibiting tremendous growth in their subscriber base and provided the market with new, innovative and value added services. Added competition from Telenor and Warid has provided real momentum for the growth of Pakistani mobile market. These two companies have given an impetus in the industry for lower tariffs, expanded
networks, customized packages and high tech services. During the year, wireless companies continued to expand their network and subscribers exponentially. Today, mobile segment of telecom sector is considered to be the most thriving one. On average, approximately 2.3 million subscribers have been added on cellular mobile networks each month in Pakistan during the first nine months of 2006-07. This is an exemplary growth in relation to the population of any country in Asian region. Total mobile subscribers at the end of April 2007 crossed the 58.6 million mark (Fig-14.3).
Fig-14.3: Cellular Mobile Subscribers
58.6
34.5
12.8
5.02.41.6
0
10
20
30
40
50
60
70
2002 2003 2004 2005 2006 Apr-07
Source: PTA
Mill
ion
The entry of Warid and Telenor in 2005 resulted in significant changes in the market; one of them was market structure with respect to subscribers’ share. These two companies started attracting customers, which reduced the market share of the dominant player, Mobilink from 64 percent in June 2004 to 44 percent in March 2007. The two new companies now have over 32 percent (As of March 2007) of the market share which is very healthy development with regard to competition and maturity in the market. Herfindahl Index, also known as Herfindahl – Hirschman Index (HHI, is a measure of the size of firms in relationship to the industry an indicator to the amount of competition among them) a widely used measure of the industry concentration, also shows an improvement in Pakistan’s mobile market competition, particularly during the last one year (Fig-14.4 & Fig-14.5). Socio-economic impact of mobile phone is also given in Box 14.2
217

Economic Survey 2006-07
Fig-14.4: Celluar Market Share (Jun 06) Fig-14.5: Cellular Market Share (Mar 07)
Paktel3%
Instaphone1%
Telenor10%
Warid14%
Ufone22%
Mobilink50%
Mobilink44%
Warid16%
Telenor16%
Paktel2%
Instaphone1%
Ufone21%
Source: PTA Source: PTA
b) Fixed Line Services
In the Long-distance and International (LDI) segment, 13 companies are operational out of the total 14 LDI licensees. PTA also awarded licenses to 38 Fixed Local Loop (FLL) companies for their operations in various telecom regions. So far, 4 companies have launched their services, with limited network coverage in few cities of Punjab and Sindh. Few other companies like Neyatel, Multinet Broadband and Stanlay are at their rollout stage; however, their coverage is limited with low capacity. Currently, there are 5.2 million fixed line subscribers with 98 percent subscribers of the incumbent operator, PTCL (Fig-14.6).
Fig-14.6: Fixed Line Subscribers
5.245.234.5
4.03.7
5.18
0
1
2
3
4
5
6
2002 2003 2004 2005 2006 'Dec 06
Source: PTA
Mill
ion
c) Wireless Local Loop
WLL technology was introduced in Pakistan in 2004 with the objective to bridge the digital divide between the rural and urban areas as the deployment of WLL services is much easier than the fixed line. The total WLL subscribers have reached 1.6 million which are now 30 percent of
the fixed line subscribers. WLL density has also increased to 1.06 percent. Now 5 WLL operators are providing their services in the country. The coverage extended by PTCL for WLL services has reached over 1,080 cities/towns of Pakistan (Fig-14.7).
Fig-7: WLL Subscribers1,647,846
1,025,328
264,828
17,391
0
200,000
400,000
600,000
800,000
1,000,000
1,200,000
1,400,000
1,600,000
1,800,000
2003-04 2004-05 2005-06 Mar-07Source: PTA
Subs
crib
ers
ii). Sector Accomplishment
a) FDI in Telecom Sector
In the last 2-3 years Telecom sector has attracted record inflows of FDI. During 2005-06, telecom sector received over US$ 1.9 billion FDI and emerged as the single largest sector attracting FDI. In the year 2005-06, telecom sector received 54.1 percent of the total FDI which is even higher than last year’s 32.4 percent. During July-April 2006-07, telecom sector attracted US$ 1.4 billion which is expected to cross one and half billion dollar mark at the end of year (Fig-14.8).
218
Transport and Communications
Fig-14.8: FDI in Telecom Sector
6.1
13.5 20
7.1
494.
4
1,90
5.1
484.
7
798.
0
949.
4 1,52
4.0
3,52
1.0
1.71.3
21.8
54.1
32.4
0
500
1000
1500
2000
2500
3000
3500
4000
2001-02 2002-03 2003-04 2004-05 2005-06Source: PTA
US$
milli
on
0
10
20
30
40
50
60
Perc
enta
ge
FDI in TelecomjTotal FDITelecom (%) Share
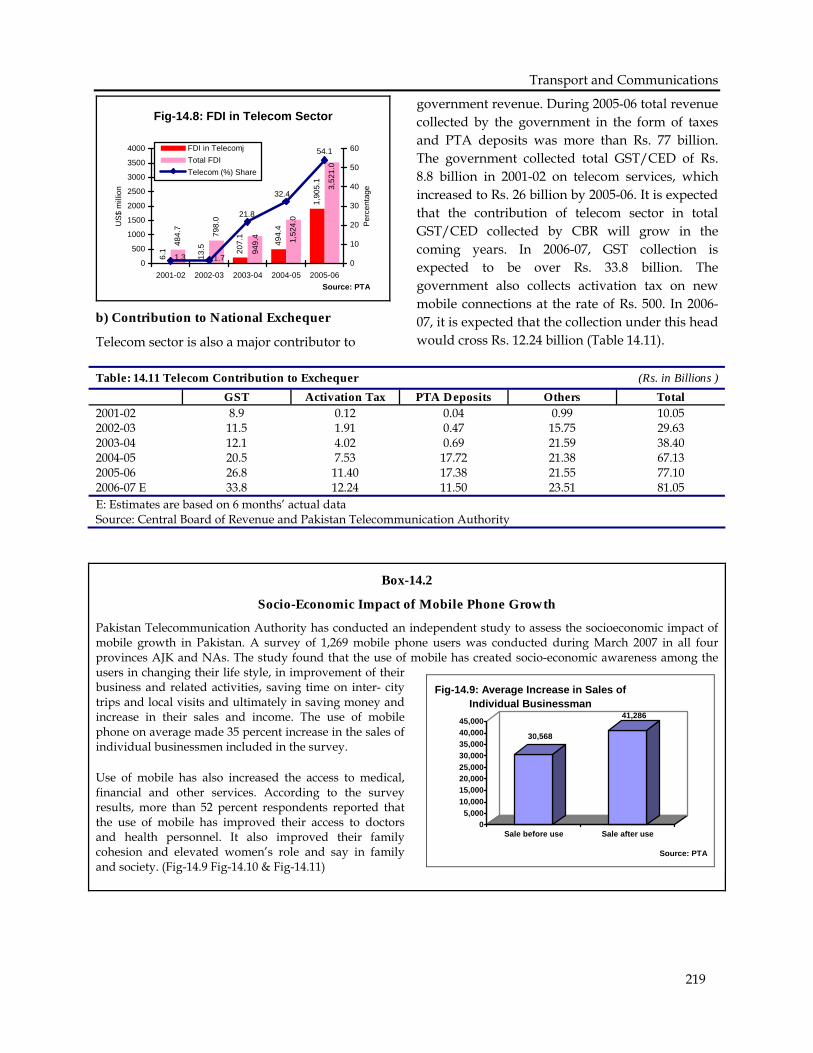
b) Contribution to National Exchequer
Telecom sector is also a major contributor to
government revenue. During 2005-06 total revenue collected by the government in the form of taxes and PTA deposits was more than Rs. 77 billion. The government collected total GST/CED of Rs. 8.8 billion in 2001-02 on telecom services, which increased to Rs. 26 billion by 2005-06. It is expected that the contribution of telecom sector in total GST/CED collected by CBR will grow in the coming years. In 2006-07, GST collection is expected to be over Rs. 33.8 billion. The government also collects activation tax on new mobile connections at the rate of Rs. 500. In 2006-07, it is expected that the collection under this head would cross Rs. 12.24 billion (Table 14.11).
Table: 14.11 Telecom Contribution to Exchequer (Rs. in Billions ) GST Activation Tax PTA Deposits Others Total
2001-02 8.9 0.12 0.04 0.99 10.05 2002-03 11.5 1.91 0.47 15.75 29.63 2003-04 12.1 4.02 0.69 21.59 38.40 2004-05 20.5 7.53 17.72 21.38 67.13 2005-06 26.8 11.40 17.38 21.55 77.10 2006-07 E 33.8 12.24 11.50 23.51 81.05 E: Estimates are based on 6 months’ actual data Source: Central Board of Revenue and Pakistan Telecommunication Authority
Box-14.2
Socio-Economic Impact of Mobile Phone Growth
Pakistan Telecommunication Authority has conducted an independent study to assess the socioeconomic impact of mobile growth in Pakistan. A survey of 1,269 mobile phone users was conducted during March 2007 in all four provinces AJK and NAs. The study found that the use of mobile has created socio-economic awareness among the users in changing their life style, in improvement of their business and related activities, saving time on inter- city trips and local visits and ultimately in saving money and increase in their sales and income. The use of mobile phone on average made 35 percent increase in the sales of individual businessmen included in the survey.
Use of mobile has also increased the access to medical, financial and other services. According to the survey results, more than 52 percent respondents reported that the use of mobile has improved their access to doctors and health personnel. It also improved their family cohesion and elevated women’s role and say in family and society. (Fig-14.9 Fig-14.10 & Fig-14.11)
30,568
41,286
05,000
10,00015,00020,00025,00030,00035,00040,00045,000
Sale before use Sale after use
Source: PTA
Fig-14.9: Average Increase in Sales of Individual Businessman
219

Economic Survey 2006-07
Fig-14.10: Use of Mobile for Social Activities
95.7 95.083.4
44.1
0
20
40
60
80
100
120
Regular contactwith family
Regular contactwith friends
Help in familycohesion
Increasedworman's say in
family affairs
Source: PTA
Fig-14.11: Use of Mobile Phones for Business/Work Related Activities
42.3
22.3
36.2
52.3
43.3 43.441.4
4.4
0
10
20
30
40
50
60
Find
new
busi
ness
oppo
rtuni
ty
Com
mun
icat
ew
ith c
lient
s
Plac
ing
orde
r
Obt
ain
info
rmat
ion
onne
w p
rodu
cts
Obt
ain
info
rmat
ion
onco
st a
nd
Obt
ain
bank
ing
info
rmat
ion
Hel
p im
prov
eco
mm
unic
atio
nw
ith e
mpl
oyee
s
othe
rs
Source: PTA
Employment Generation
The study also analyzed the business outlook and the value chain of the mobile sector in the country. It estimated the current employment level of 354,042 employees engaged in the telecom sector at various level of value chain including employment at Telecom Companies, vendors, tower businesses and cell phone shops. It is projected that 58,009 direct and indirect employment opportunities will be created in 2007-08.
iii) Reduction in Telecom Services Tariff
Significant reduction has been witnessed in the tariffs of almost all the telecom services over the last two to three years. The national and international long distance tariffs which were Rs. 34 and Rs. 70 per minute in 1996 respectively, have reduced significantly to as low as Rs. 0.67 and Rs. 0.79 per minute, respectively through calling cards. The incumbent operator PTCL has also reduced its NWD and international tariff drastically. In addition, the new local loop operators are also offering zero line rental packages and free local
call packages to telecom subscribers. Similarly tariffs of mobile services have also reduced. The minimum prepaid on-net tariffs which were Rs. 5.75 per minute in 2003-04 have reduced to Rs. 1.50 per minute. The international long distance tariffs from cellular mobile have also reduced and are as low as Rs.1.95 per minute. The cellular mobile operators are also offering friends and family packages in which the tariff is as low as Rs.0.99 per minute. The cellular mobile operators are offering per second, per 30 second and per minute billing to their subscribers. (The details of telecome tariff can see in Table 14.12).
Table: 14.12 Telecom Tariffs (Rupees) 2003-04 2004-05 2005-06 Mar-07 Fixed Local Loop
PTCL Installation Charges Urban 1350 750 750 750 Rural - 500 500 500 Local call Charges (per 5 min.) 2.01 2.01 2.01 2.01 Local mobile (per min.) 2.8 2.80 2.12 2.50 Long Distance Tariffs(per min.) 3.00-7.39 3.00-5.25 3.00-4.00 2.00 International Long Distance (per min. Minimum tariffs)
26.09 20.00 18.00 2.00
Wireless Local Loop (Minimum Tariffs available) Line Rent - 149 Zero Zero Local calls -
220

Transport and Communications
Table: 14.12 Telecom Tariffs (Rupees) 2003-04 2004-05 2005-06 Mar-07 On net (per min.) - 0.4 Free Free Off net (per 5 min.) - 2.01 2.01 2.01
NWD - 3.15-4.75 1.49-2.99 1.49-1.99 International Prepaid Calling Cards (Minimum Tariffs available) Long Distance (per min.) 0.67 0.67 Intl’ Long Distance (per min.) 1.99 0.79 Cellular Mobile (Minimum Tariffs available) Airtime Tariffs (per min.) On net 5.75 5.00 2.50 1.50
Off net Cell 7.75 7.00 2.50 1.90 Fixed. 7.76 7.76 2.50 1.90 NWD (per min.) On net 14.75 12.75 2.50 1.50 Off net Cell 16.48 14.39 2.50 1.80 Fixed. 18.75 16.39 2.50 1.90 International Long Distance (per min.) 34.75 22 3.75 1.90 SMS On net 1.5 1.50 0.50 0.20
Off net 1.5 1.50 1.00 1.00 Source: PTA
iv) International Recognition of Telecom
Policies a) ITU Elections
Pakistan contested ITU elections for a Council Seat and Radio Regulation Board (RRB) membership. The elections were contested with full preparations and campaign was launched jointly by Ministry of Foreign Affairs, Ministry of Information Technology & Telecom (MOIT&T) and Pakistan Telecommunications Authority. Pakistan won the Council seat (117 votes) and Chairman PTA got elected as Member RRB (110 votes) with a comfortable margin. The number of votes obtained for both the candidates have increased considerably from previous elections indicating an enhanced position and image of Pakistan at international level.
b) Telecom Regulatory Environment in Pakistan – rated the best by LIRNEasia
Sectoral growth and regulator’s performance have been appreciated internationally. Last year, PTA received two international awards - “GSMA – Government Leadership Award” in recognition of effective regulatory framework for cellular growth,
and Global Regulatory Exchange (G-REX) Award for PTA’s active participation in the policy dialogue among the telecom regulatory bodies. Recently a study has been conducted by LIRNEasia (Organization based in Sri-Lanka) for the regulatory assessment of the Telecom Authorities in the six selected countries of Asia (Pakistan, Indonesia, Sri Lanka, India, Philippines and Thailand). This study has rated the Telecom Regulatory Environment (TRE) of Pakistan as the best in the group of these six countries. TRE, has been rated the best on the basis of its effective regulation in terms of market entry, interconnection, universal service and utilization of scarce resources.
V. Regulatory Measures
After successful deregulation of the telecom sector, the PTA is endeavoring for higher telecom growth in the country. Prudent and transparent policies are also in place to achieve this objective and the PTA has taken several measures for the uplift of the sector including Mobile Number Portability (MNP), simplified licensing, telecom liberalization in AJK and NAs, International Mobile Equipment
221

Economic Survey 2006-07
Identity (IMEI) system to counter mobile handset theft, rural telecom development, quality of service and consumer protection.
a) Licensing of Telecom Services
Issuance of licenses for the telecom services in Pakistan is one of the core functions of the PTA. In this regard, transparent and simple procedures have been adopted and till now, the PTA has issued 6 cellular mobile licenses and 92 WLL licenses for operations in different telecom regions. Similarly, a total of 84 licenses have been issued for the provision of Fixed Local Loop services to 37 companies. Also, the PTA has issued 14 licenses to 14 telecom companies for provision of Long Distance and International services in the country. In addition, 720 licenses have been issued for value added services.
The Class Value Added Services (CVAS) Regime was implemented in October 2005. So far 182 CVAS licenses have been awarded. This new regime is more simplified under which more than 15 different individual license categories have been merged into just two license categories i.e. Data type and Voice type. Under the existing value added service, old licenses are also being converted into new CVAL licenses.
b) Telecom Developments in AJ&K and NAs
Keeping in view the rising demand of AJK and NAs for advanced telecom facilities, the PTA has initiated the liberalization of telecom sector in the area after the mutual decision of the Governments of Pakistan and AJ&K to open the telecom sector for private operators for enhancing telecom facilities in the region. In this regard, licensing for cellular mobile took place in June 2006 in Islamabad where Mobilink, Warid, Ufone and Telenor were awarded licenses to operate services in AJ&K and NAs. Similarly, licensing for fixed line and wireless local loop is also underway. Currently there are over 260,000 cellular mobile connections in the region provided by the cellular companies.
c) Rural Telecom Development
For the provision of affordable telecom services in underserved and unserved rural areas, the Government and the PTA have initiated a project
wherein a fund has been created namely the Universal Service Fund (USF). The basic objective of the USF is to expand telecom infrastructure and services to unserved and underserved areas by providing subsidy to the telecom operators in these areas. Contribution to this fund is made by the telecom operators set under the policy as well as by the government and international development agencies. So far an amount of Rs. 4.82 billion has been collected in this account. The Ministry of IT & Telecom (MoIT&T) has also issued the policy for the utlisation of this fund for rural telecom development.
The PTA has developed a strategy for the establishment of Telecentres in rural areas and the project consists of two Phases; in the first phase, PTA has launched a Telecentre project called “Rabta Ghar” all across the country. Under the scheme, 400 Telecentres will be established in the first phase for which the equipment worth over Rs. 50,000/- will be provided free of cost. The PTA has also arranged free delivery, installation and training of the “Rabta Ghar”. In the second Phase of Rural Telephony scheme, Telecentres will be established through micro financing from local Banks. For this scheme all major banks and all micro finance banks were approached to provide micro credit for the establishment of Telecentres.
In addition to the PTA's efforts for promoting rural telephony, the MoIT&T has also issued a Policy Guideline on the “Provision of Pay phone / PCO Service for Broader Coverage, Outreach and Economic Opportunity”. The policy has been framed with a view to expanding telecom services in far flung areas by allowing local loop and cellular mobile operators to establish PCOs. Resultantly, Mobilink has launched its PCOs on a large scale.
d) Payphones Concessions and Facilitation
To make payphone business sustainable, the PTA has announced a substantial reduction in the Annual License Fee (ALF) of Card Pay Phone Operators (CPPO) i.e. PTA will now charge only 0.1 percent ALF from Card Pay Phone Operators on their gross revenue with effect from 1st July 2006 instead of 1.5 percent. Further, the Authority also rescheduled the Annual License fee
222

Transport and Communications
outstanding up to June 30, 2005 for all payphone licensees. The ALF shall be payable in 6 equal installments on a bimonthly basis starting from December 16, 2006.
The business of Fixed Line CPPO segment which had mushroom growth in the last few years is shrinking due to growth of mobile PCOs. Due to this reason as well as for economy of scale, consolidation of some businesses is expected in future. In this regard, the operators’ requested and PTA assured the operators that it will facilitate Mergers & Acquisitions of Payphone Operators/Companies. Payphone operators will submit specific proposals to PTA for consideration of mergers. Mobile operators have been asked to facilitate Payphone operators by offering discount on Mobile Termination Rates and to consider offering better packages to licensed payphone operators. PTCL was also asked to revise its tariffs for the payphone industry.
III. Electronic Media
a) Pakistan Electronic Media Regulatory Authority (PEMRA)
PEMRA was established in March 2002 with a view to open up electronic media to the private sector. The Government’s intention behind the establishment of PEMRA was to improve the standards of information, education and entertainment and to enlarge the choice available to the people of Pakistan in the media. Since its inception, PEMRA has made efforts in establishing standards of directness of information. The process of licensing through transparent bidding has earned appreciation from stakeholders as well as the general public. In a short span of 5 years, it has endeavoured to change the broadcast media landscape of Pakistan, working as a catalyst for growth and development and has awarded broadcast licenses in various categories.
During the first nine months of the current fiscal year, 350 licences have been awarded for establishment of Cable TV in different cities of Pakistan. During this period PEMRA has also awarded 3 licences for satellite TV and 2 licences for Internet Protocol TV (IPTV) channel distribution service. PEMRA has also granted
Landing Rights Permissions to 10 Foreign Satellite TV channels. The PEMRA has issued a total of 19 satellite TV licences since 2002, out of which 16 are operational including 4 for educational purposes, 103 FM licences out of which 68 are operational, 6 Multi Channel Multi Point Distribution Service (MMDS) licences with 5 operational and Landing Rights Permission to 23 foreign channels. PEMRA is also in the process of issuing Direct to Home (DTH) and teleport licences.
b) Pakistan Television Corporation Limited (PTV) PTV has played a significant role in helping the earth quake affected people of Northern Areas of Pakistan and Kashmir. In this respect PTV has established a TV Centre in AJ&K with three re-broadcast centres at Kotli, Rawalakot and Bagh. The Government is giving priority towards the socio-economic uplift in less-developed areas of the country. PTV has also been telecasting regional languages programmes round the clock. A channel called “Bolan” was launched for the viewer of Baluchistan. PTV is operating with four channels in the country, namely PTV-I, PTV-2(PTV-World), PTV-3 and PTV National. The Rebroadcast Centres, which extend the PTV signal to remote areas, include 49 for PTV-I, 30 for PTV-2 and 13 for PTV-3.
c) Pakistan Broadcasting Corporation (PBC) Radio is the fastest, mobile and cheapest electronic media which is capable of reaching the masses far and near. With its varied and wide ranging programmes, PBC is catering to all segments of society. PBC has 31 Broadcasting Houses, 33 medium wave transmitters, 8 short wave transmitters and 21 FM transmitters which transmitted programmes for listeners at home and abroad. Programmes in 21 national and regional languages are broadcast on the medium wave in Home Service and 16 foreign languages in the External Service for foreigners and in national language in the World Service for Pakistanis living abroad. The network of Radio Pakistan covers 98 percent of the population and 80 percent of the total area of the country.
Radio Pakistan introduced FM Service in October 1998, which was warmly welcomed by the listeners. In view of its popularity PBC launched
223

Economic Survey 2006-07
FM 101 Service through a network in July, 2002. Presently 8 FM Stations are broadcasting FM 101 Service. This service has gained tremendous popularity among the youths and may rightly be called radio of the youth.
To boost agriculture production and promote awareness amongst farmers regarding cultivation and protection of cereal and cash crops, a crop cultivation week was celebrated through different radio stations. Similarly exclusive programmes were broadcast to educate the general public in connection with monsoon and spring tree plantation campaign. Music based programmes are the popular programmes among the audience of Radio Pakistan. During the year under review proper attention was given to the production and presentation of musical programmes. PBC News is the biggest source of dissemination of news in the country. Its General News room in Islamabad and attached units are presently putting on air 136 news bulletins daily. These include national, regional, external, sports, business, weather and local bulletins. It also broadcasts hourly headlines bulletin on FM-101 network.IV.
Pakistan Post Office
Pakistan Post Office a state enterprise dedicated to providing wide range of postal products and public services. An efficient postal system is essential for cohesiveness of a vast country with a large population like Pakistan. As a true emblem of federation, it is committed to serving every one, every day and every where. It provides postal facilities through a network of 12, 339 post offices across the country. In compliance with the Government welfare policies, the Pakistan Post Office is providing a variety of services on behalf of Federal and Provincial Governments and autonomous/corporate entities. In order to facilitate payment of utility bills, Pakistan Post is collecting P.T.C.L, Electricity and Gas bills through out the country, while WASA bills are being collected in Hyderabad, Multan Quettan and Sialkot, by the post offices. Pakistan Post earned Rs. 331.260 million in the shape of commission during July- March, 2006-07. It has taken various measures to streamline the post office system on modern lines, including adoption of better information technology. A number of information technology projects have already been completed/ implemented and a few more are in the pipeline.
224
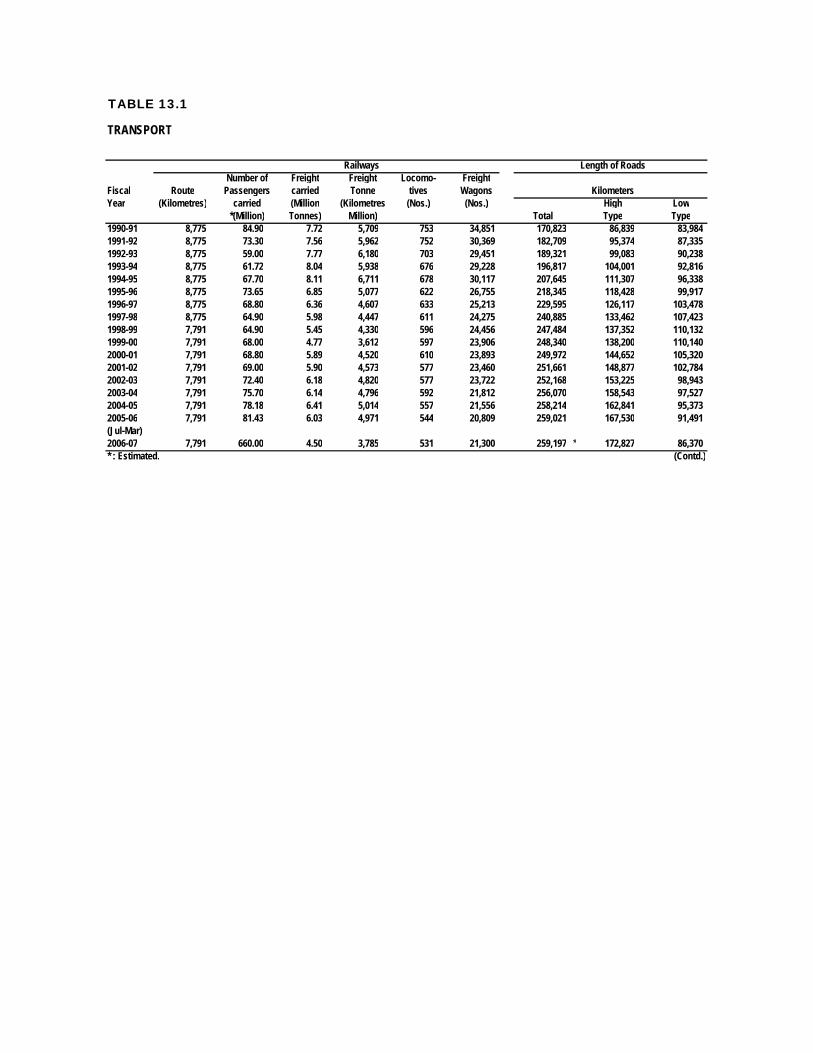
TABLE 13.1
Railways Length of RoadsNumber of Freight Freight Locomo- Freight
Fiscal Route Passengers carried Tonne tives Wagons KilometersYear (Kilometres) carried (Million (Kilometres (Nos.) (Nos.) High Low
*(Million) Tonnes) Million) Total Type Type1990-91 8,775 84.90 7.72 5,709 753 34,851 170,823 86,839 83,9841991-92 8,775 73.30 7.56 5,962 752 30,369 182,709 95,374 87,3351992-93 8,775 59.00 7.77 6,180 703 29,451 189,321 99,083 90,2381993-94 8,775 61.72 8.04 5,938 676 29,228 196,817 104,001 92,8161994-95 8,775 67.70 8.11 6,711 678 30,117 207,645 111,307 96,3381995-96 8,775 73.65 6.85 5,077 622 26,755 218,345 118,428 99,9171996-97 8,775 68.80 6.36 4,607 633 25,213 229,595 126,117 103,4781997-98 8,775 64.90 5.98 4,447 611 24,275 240,885 133,462 107,423 1998-99 7,791 64.90 5.45 4,330 596 24,456 247,484 137,352 110,132 1999-00 7,791 68.00 4.77 3,612 597 23,906 248,340 138,200 110,140 2000-01 7,791 68.80 5.89 4,520 610 23,893 249,972 144,652 105,320 2001-02 7,791 69.00 5.90 4,573 577 23,460 251,661 148,877 102,784 2002-03 7,791 72.40 6.18 4,820 577 23,722 252,168 153,225 98,943 2003-04 7,791 75.70 6.14 4,796 592 21,812 256,070 158,543 97,5272004-05 7,791 78.18 6.41 5,014 557 21,556 258,214 162,841 95,3732005-06 7,791 81.43 6.03 4,971 544 20,809 259,021 167,530 91,491(Jul-Mar)2006-07 7,791 660.00 4.50 3,785 531 21,300 259,197 * 172,827 86,370* : Estimated. (Contd.)
TRANSPORT
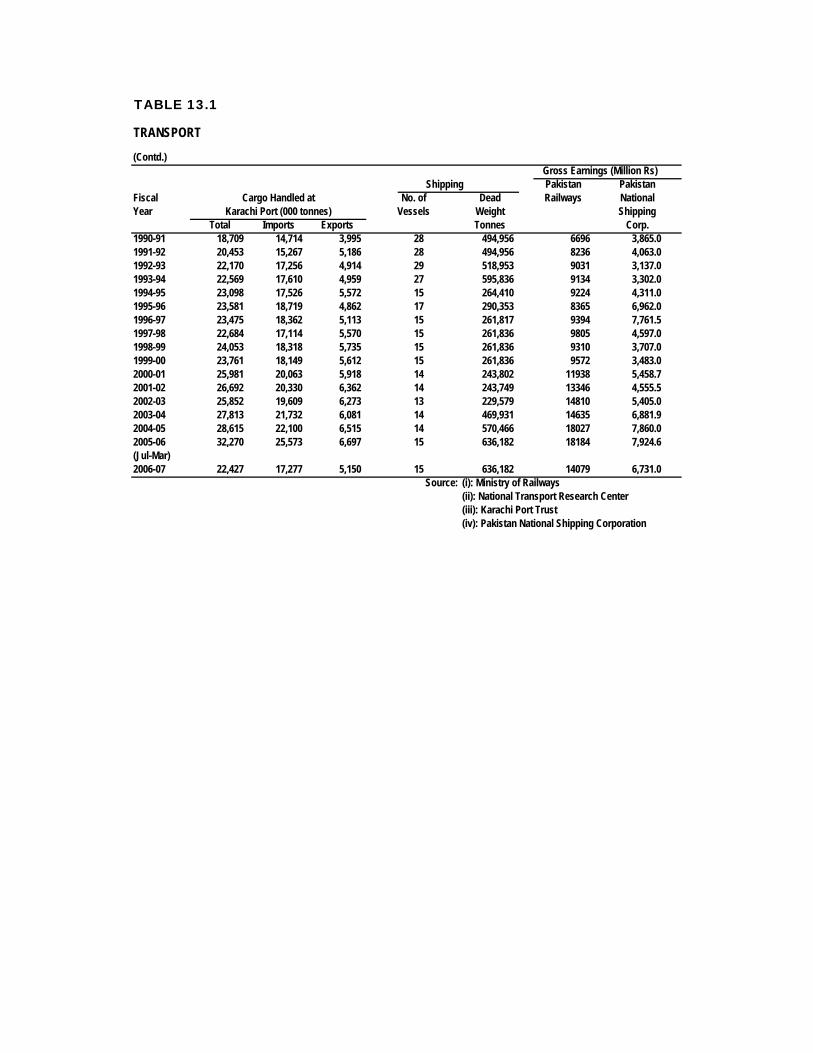
TABLE 13.1
(Contd.)Gross Earnings (Million Rs)
Shipping Pakistan PakistanFiscal Cargo Handled at No. of Dead Railways NationalYear Karachi Port (000 tonnes) Vessels Weight Shipping
Total Imports Exports Tonnes Corp.1990-91 18,709 14,714 3,995 28 494,956 6696 3,865.01991-92 20,453 15,267 5,186 28 494,956 8236 4,063.01992-93 22,170 17,256 4,914 29 518,953 9031 3,137.01993-94 22,569 17,610 4,959 27 595,836 9134 3,302.01994-95 23,098 17,526 5,572 15 264,410 9224 4,311.01995-96 23,581 18,719 4,862 17 290,353 8365 6,962.01996-97 23,475 18,362 5,113 15 261,817 9394 7,761.51997-98 22,684 17,114 5,570 15 261,836 9805 4,597.01998-99 24,053 18,318 5,735 15 261,836 9310 3,707.01999-00 23,761 18,149 5,612 15 261,836 9572 3,483.02000-01 25,981 20,063 5,918 14 243,802 11938 5,458.72001-02 26,692 20,330 6,362 14 243,749 13346 4,555.52002-03 25,852 19,609 6,273 13 229,579 14810 5,405.02003-04 27,813 21,732 6,081 14 469,931 14635 6,881.92004-05 28,615 22,100 6,515 14 570,466 18027 7,860.02005-06 32,270 25,573 6,697 15 636,182 18184 7,924.6(Jul-Mar)2006-07 22,427 17,277 5,150 15 636,182 14079 6,731.0
Source: (i): Ministry of Railways(ii): National Transport Research Center(iii): Karachi Port Trust(iv): Pakistan National Shipping Corporation
TRANSPORT
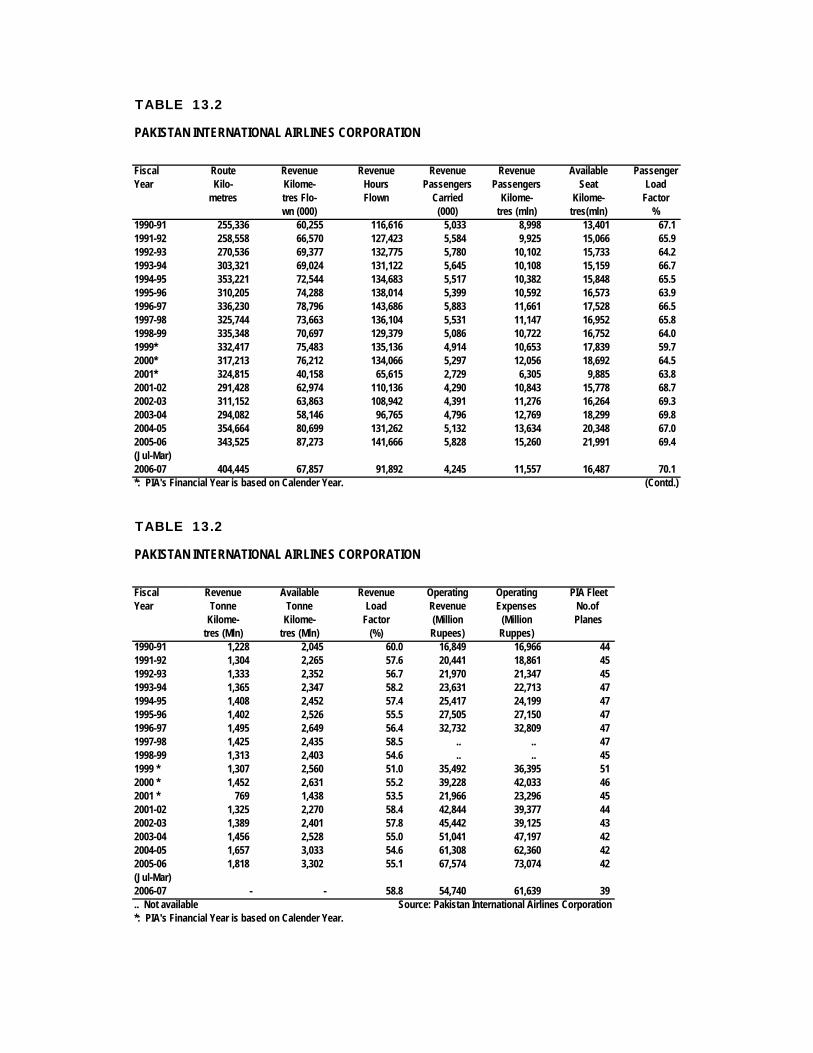
TABLE 13.2
Fiscal Route Revenue Revenue Revenue Revenue Available PassengerYear Kilo- Kilome- Hours Passengers Passengers Seat Load
metres tres Flo- Flown Carried Kilome- Kilome- Factorwn (000) (000) tres (mln) tres(mln) %
1990-91 255,336 60,255 116,616 5,033 8,998 13,401 67.11991-92 258,558 66,570 127,423 5,584 9,925 15,066 65.91992-93 270,536 69,377 132,775 5,780 10,102 15,733 64.21993-94 303,321 69,024 131,122 5,645 10,108 15,159 66.71994-95 353,221 72,544 134,683 5,517 10,382 15,848 65.51995-96 310,205 74,288 138,014 5,399 10,592 16,573 63.91996-97 336,230 78,796 143,686 5,883 11,661 17,528 66.51997-98 325,744 73,663 136,104 5,531 11,147 16,952 65.81998-99 335,348 70,697 129,379 5,086 10,722 16,752 64.01999* 332,417 75,483 135,136 4,914 10,653 17,839 59.72000* 317,213 76,212 134,066 5,297 12,056 18,692 64.52001* 324,815 40,158 65,615 2,729 6,305 9,885 63.82001-02 291,428 62,974 110,136 4,290 10,843 15,778 68.72002-03 311,152 63,863 108,942 4,391 11,276 16,264 69.32003-04 294,082 58,146 96,765 4,796 12,769 18,299 69.82004-05 354,664 80,699 131,262 5,132 13,634 20,348 67.02005-06 343,525 87,273 141,666 5,828 15,260 21,991 69.4(Jul-Mar)2006-07 404,445 67,857 91,892 4,245 11,557 16,487 70.1*: PIA's Financial Year is based on Calender Year. (Contd.)
TABLE 13.2
Fiscal Revenue Available Revenue Operating Operating PIA FleetYear Tonne Tonne Load Revenue Expenses No.of
Kilome- Kilome- Factor (Million (Million Planestres (Mln) tres (Mln) (%) Rupees) Ruppes)
1990-91 1,228 2,045 60.0 16,849 16,966 441991-92 1,304 2,265 57.6 20,441 18,861 451992-93 1,333 2,352 56.7 21,970 21,347 451993-94 1,365 2,347 58.2 23,631 22,713 471994-95 1,408 2,452 57.4 25,417 24,199 471995-96 1,402 2,526 55.5 27,505 27,150 471996-97 1,495 2,649 56.4 32,732 32,809 471997-98 1,425 2,435 58.5 .. .. 471998-99 1,313 2,403 54.6 .. .. 451999 * 1,307 2,560 51.0 35,492 36,395 512000 * 1,452 2,631 55.2 39,228 42,033 462001 * 769 1,438 53.5 21,966 23,296 452001-02 1,325 2,270 58.4 42,844 39,377 442002-03 1,389 2,401 57.8 45,442 39,125 432003-04 1,456 2,528 55.0 51,041 47,197 422004-05 1,657 3,033 54.6 61,308 62,360 422005-06 1,818 3,302 55.1 67,574 73,074 42(Jul-Mar)2006-07 - - 58.8 54,740 61,639 39.. Not available Source: Pakistan International Airlines Corporation*: PIA's Financial Year is based on Calender Year.
PAKISTAN INTERNATIONAL AIRLINES CORPORATION
PAKISTAN INTERNATIONAL AIRLINES CORPORATION

TABLE 13.3
Calendar Motor Cars Motor Motor MotorYear Jeeps & Sta- Cabs/ Buses Trucks Cycle Cycle Others Total
tion Wagons Taxis (2 Wheels) (3 Wheels)1990 682,636 32,304 84,016 105,245 1,250,749 50,862 507,025 2,712,8371991 731,960 33,235 89,094 107,171 1,381,136 52,439 528,878 2,923,9131992 819,350 41,245 94,988 111,391 1,497,017 56,267 558,926 3,179,1841993 868,159 47,897 98,681 114,394 1,573,370 59,510 589,281 3,351,2921994 902,654 52,444 107,440 118,389 1,679,259 62,183 615,497 3,537,8661995 923,577 53,400 113,516 119,174 1,754,737 63,370 642,174 3,669,9481996 966,747 54,501 114,415 123,658 1,842,531 69,756 666,549 3,838,1571997 1,068,116 83,182 119,365 131,322 1,995,421 76,224 700,315 4,173,9451998 1,085,969 83,687 125,929 132,895 2,068,730 81,777 724,309 4,303,2961999 1,162,876 83,844 150,108 145,111 2,175,488 95,345 746,718 4,559,4902000 1,182,307 83,892 154,401 148,569 2,260,772 99,376 772,279 4,701,5962001 1,201,738 93,940 158,694 157,027 2,346,056 103,407 797,840 4,843,7022002 1,282,371 83,954 162,672 170,615 2,407,466 115,919 825,552 5,048,5492003 1,292,888 84,277 162,957 178,883 2,444,567 122,448 846,017 5,132,0372004 1,301,406 84,311 163,242 181,150 2,681,066 124,076 860,480 5,395,7312005 1,321,590 85,619 165,775 183,962 2,722,645 126,004 873,825 5,479,4172006 1,496,780 96,968 192,753 208,347 3,083,558 142,705 989,658 6,210,769
Source: Federal Bureau of Statistics
NUMBER OF MOTOR VEHICLES REGISTERED

TABLE 13.4
Mcy/ Motor Jeep Stn. Tractor Buses M.Cab MotorYear Scooter Car Wagon Taxi Rck1991-92 971.80 429.10 31.60 43.60 275.30 45.00 33.50 42.401992-93 1,165.50 465.80 35.60 48.80 353.00 51.70 40.00 46.701993-94 1,287.30 493.70 38.00 52.70 376.60 56.40 44.50 50.501994-95 1,482.00 516.80 41.30 56.00 399.80 60.90 47.90 53.401995-96 1,481.90 538.40 43.50 59.00 424.80 64.50 51.40 58.701996-97 1,576.00 564.50 45.50 62.00 439.80 68.20 54.10 65.601997-98 1,691.40 593.00 47.80 65.00 463.60 72.50 57.30 74.601998-99 1,833.70 731.30 16.70 60.60 489.80 84.40 68.50 56.701999-00 2,010.00 815.70 17.00 73.90 528.40 92.80 69.80 59.902000-01 2,218.90 928.00 18.30 93.80 579.40 86.60 79.80 72.402001-02 2,481.10 1,040.00 43.40 122.70 630.50 96.60 96.40 80.802002-03 2,656.20 1,110.00 44.40 126.40 663.20 98.30 104.10 80.902003-04 2,882.50 1,193.10 47.80 132.40 722.70 100.40 112.60 81.002004-05 3,063.00 1,264.70 51.80 140.50 778.10 102.40 120.30 81.302005-06 3,791.00 1,999.20 65.70 140.80 822.30 103.60 122.10 77.80(Jul-Mar)2006-07 * 4,463.80 1,682.20 85.40 169.10 877.80 108.40 119.10 79.00* Estimated (Contd.)
TABLE 13.4
Year D.Van Trucks Pickup Ambu- Others Totallance Oil Water
1991-92 61.40 75.80 30.20 1.70 4.00 0.60 49.50 2,095.501992-93 69.80 84.20 39.50 2.00 4.30 0.70 52.70 2,460.001993-94 74.00 92.00 44.10 2.30 4.70 0.70 73.60 2,690.401994-95 78.20 98.30 47.10 2.70 5.10 0.80 60.70 2,951.601995-96 81.30 104.20 50.50 3.30 5.60 0.90 63.70 3,000.201996-97 84.30 110.30 50.20 3.70 6.10 1.10 66.50 3,195.801997-98 87.60 117.10 56.10 4.30 6.80 1.30 69.70 3,405.301998-99 51.70 121.00 56.40 1.50 6.80 0.70 74.70 3,651.701999-00 55.50 127.40 61.60 1.70 7.00 0.70 78.80 3,997.202000-01 72.40 132.30 68.40 1.70 7.20 0.80 89.00 4,471.002001-02 116.90 145.20 78.30 4.10 7.60 0.90 71.50 5,016.802002-03 120.30 146.70 80.60 4.30 7.60 0.90 71.40 5,315.002003-04 121.30 149.20 84.40 4.40 7.60 0.90 71.30 5,711.202004-05 121.90 151.80 87.60 4.50 7.70 0.90 69.40 6,048.302005-06 143.30 151.80 93.50 4.50 7.70 0.90 60.20 7,084.50(Jul-Mar)2006-07 * 148.90 173.30 104.50 4.60 7.80 0.90 38.50 8,063.60* : Estimated Source: National Transport Research Center
Tankers
MOTOR VEHICLES ON ROAD (000 Number)
MOTOR VEHICLES ON ROAD (000 Number)
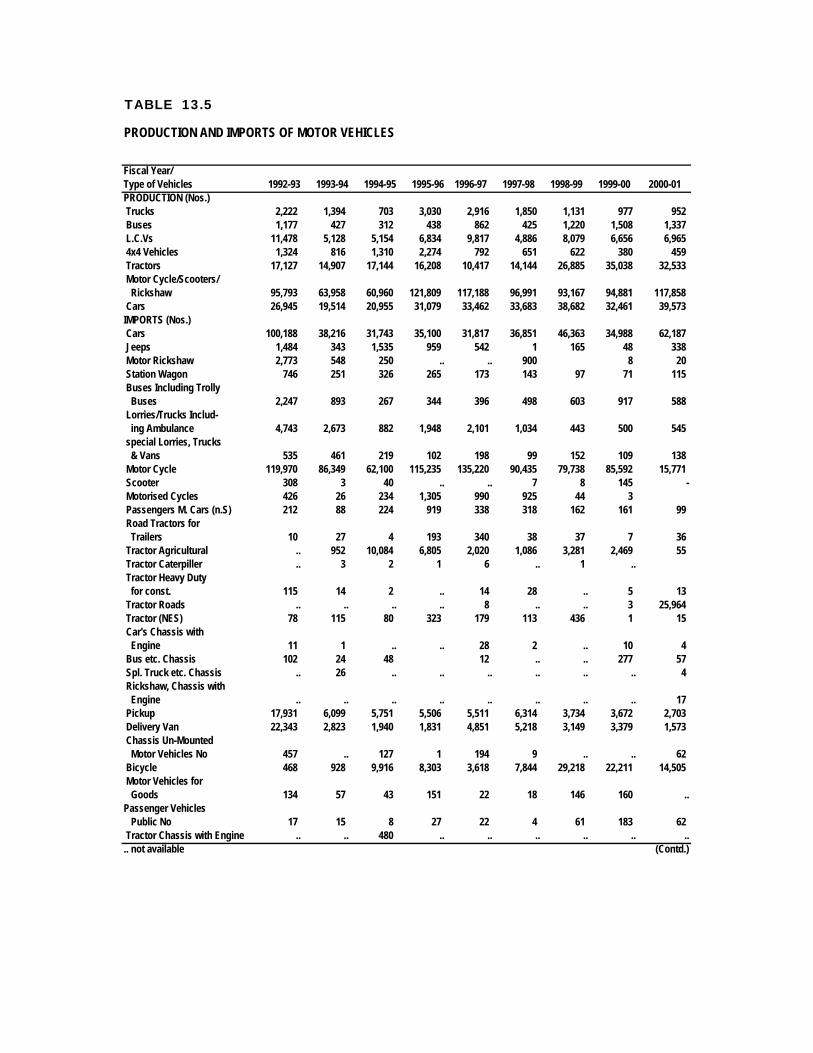
TABLE 13.5
Fiscal Year/Type of Vehicles 1992-93 1993-94 1994-95 1995-96 1996-97 1997-98 1998-99 1999-00 2000-01PRODUCTION (Nos.) Trucks 2,222 1,394 703 3,030 2,916 1,850 1,131 977 952 Buses 1,177 427 312 438 862 425 1,220 1,508 1,337 L.C.Vs 11,478 5,128 5,154 6,834 9,817 4,886 8,079 6,656 6,965 4x4 Vehicles 1,324 816 1,310 2,274 792 651 622 380 459 Tractors 17,127 14,907 17,144 16,208 10,417 14,144 26,885 35,038 32,533 Motor Cycle/Scooters/ Rickshaw 95,793 63,958 60,960 121,809 117,188 96,991 93,167 94,881 117,858 Cars 26,945 19,514 20,955 31,079 33,462 33,683 38,682 32,461 39,573IMPORTS (Nos.) Cars 100,188 38,216 31,743 35,100 31,817 36,851 46,363 34,988 62,187 Jeeps 1,484 343 1,535 959 542 1 165 48 338 Motor Rickshaw 2,773 548 250 .. .. 900 8 20 Station Wagon 746 251 326 265 173 143 97 71 115 Buses Including Trolly Buses 2,247 893 267 344 396 498 603 917 588 Lorries/Trucks Includ- ing Ambulance 4,743 2,673 882 1,948 2,101 1,034 443 500 545 special Lorries, Trucks & Vans 535 461 219 102 198 99 152 109 138 Motor Cycle 119,970 86,349 62,100 115,235 135,220 90,435 79,738 85,592 15,771 Scooter 308 3 40 .. .. 7 8 145 - Motorised Cycles 426 26 234 1,305 990 925 44 3 Passengers M. Cars (n.S) 212 88 224 919 338 318 162 161 99 Road Tractors for Trailers 10 27 4 193 340 38 37 7 36 Tractor Agricultural .. 952 10,084 6,805 2,020 1,086 3,281 2,469 55 Tractor Caterpiller .. 3 2 1 6 .. 1 .. Tractor Heavy Duty for const. 115 14 2 .. 14 28 .. 5 13 Tractor Roads .. .. .. .. 8 .. .. 3 25,964 Tractor (NES) 78 115 80 323 179 113 436 1 15 Car's Chassis with Engine 11 1 .. .. 28 2 .. 10 4 Bus etc. Chassis 102 24 48 12 .. .. 277 57 Spl. Truck etc. Chassis .. 26 .. .. .. .. .. .. 4 Rickshaw, Chassis with Engine .. .. .. .. .. .. .. .. 17 Pickup 17,931 6,099 5,751 5,506 5,511 6,314 3,734 3,672 2,703 Delivery Van 22,343 2,823 1,940 1,831 4,851 5,218 3,149 3,379 1,573 Chassis Un-Mounted Motor Vehicles No 457 .. 127 1 194 9 .. .. 62 Bicycle 468 928 9,916 8,303 3,618 7,844 29,218 22,211 14,505 Motor Vehicles for Goods 134 57 43 151 22 18 146 160 ..Passenger Vehicles Public No 17 15 8 27 22 4 61 183 62 Tractor Chassis with Engine .. .. 480 .. .. .. .. .. .... not available (Contd.)
PRODUCTION AND IMPORTS OF MOTOR VEHICLES

TABLE 13.5
Fiscal Year/Type of Vehicles 2001-02 2002-03 2003-04 2004-05 2005-06 2005-06 2006-07PRODUCTION (Nos.) Trucks 1,141 1,950 2,022 3,204 4,518 3,267 3,266 Buses 1,099 1,340 1,380 1,762 627 518 627 L.C.Vs 8,491 12,174 14,089 23,613 29,581 20,743 24,071 4x4 Vehicles 570 374 801 1,564 2,472 - - Tractors 24,331 76,501 36,103 43,746 49,439 36,839 39,602 Motor Cycle 133,334 176,591 327,446 476,333 752,603 504,420 609,562 Cars 40,601 62,893 99,263 126,817 163,114 114,309 118,668IMPORTS (Nos.)
Cars 40,079 60,554 88,130 66,338 36,563 21,256 44,683 Jeeps 666 6,010 11,435 5,409 2,108 1,386 15,750 Motor Rickshaw 101 3 3 15 12 1,351 Station Wagon 165 440 154 37 284 224 58 Buses Including Trolly Buses 700 1,230 2,429 411 577 437 31 Lorries/Trucks Includ- ing Ambulance 728 14,036 2,883 2,616 3,659 2,295 3,218 special Lorries, Trucks & Vans 157 54 95 1,544 548 425 5,760 Motor Cycle 111,711 143,952 127,861 189,721 3,009 3,005 2,781 Scooter - - - - .. .. .. Motorised Cycles 509 675 4,143 9,472 5,728 8,675 Passengers M. Cars (n.S) 161 194 243 244 1,587 1,074 948 Road Tractors for Trailers 18 122 124 117 76 48 11 Tractor Agricultural 220 14,000 11,420 6,543 7,346 5,535 2,346 Tractor Caterpiller 44 1 30 91 .. .. .. Tractor Heavy Duty for const. 4 120 219 563 632 495 704 Tractor Roads 15,174 1,115 2,104 1,646 2,104 1,832 205 Tractor (NES) 115 496 736 2,167 1,811 1,126 3,140 Car's Chassis with Engine 1 .. .. 3,233 Bus etc. Chassis 60 46 164 18 58 16 30 Spl. Truck etc. Chassis .. 34 6 Rickshaw, Chassis with Engine 36 10 2 144 195 187 16,982 Pickup 3,600 5,162 6,857 5,394 1,143 493 718 Delivery Van 2,120 471 26 178 245 169 4 Chassis Un-Mounted 168 Motor Vehicles No Bicycle 20,240 37,836 39,894 61,187 52,022 40,276 41,620 Motor Vehicles for Goods 2 234 511 269 604 500 44Passenger Vehicles Public No 6 473 721 1,519 5,228 4,092 642 Tractor Chassis with Engine .... not available
PRODUCTION AND IMPORTS OF MOTOR VEHICLES
July - March

TABLE 13.6
Fiscal No of Post Telephones Internet No.of Internet No of MobileYear Offices (000 Nos.) Connections Cities PCO Phones
Urban Rural Total Urban Rural Total (Million) connected *1990-91 1,867 11,546 13,413 195 302 497 1188 .. 3,8611991-92 1,909 11,471 13,380 299 210 509 1461 .. 4,6761992-93 1,983 11,213 13,196 320 210 530 1548 .. 5,6181993-94 1,970 11,315 13,285 327 85 412 1801 .. 6,4221994-95 2,026 11,294 13,320 330 86 416 2126 .. 4,6001995-96 2,092 11,327 13,419 319 104 423 2376 .. 9,410 68,038 1996-97 2,024 11,192 13,216 340 93 433 2558 .. 10,040 135,027 1997-98 2,044 11,250 13,294 356 92 448 2756 0.01 10,071 196,096 1998-99 2,103 10,751 12,854 308 93 401 2861 0.20 10,107 265,614 1999-00 2,103 10,751 12,854 293 91 384 3124 0.50 10,400 306,463 2000-01 2,302 9,932 12,234 293 91 384 3340 0.80 66,968 742,606 2001-02 1,983 10,284 12,267 258 104 362 3656 1.00 97,751 1,698,536 2002-03 1,808 10,446 12,254 239 87 326 4940 1.60 1,350 139,493 2,404,400 2003-04 2,267 9,840 12,107 215 73 288 4460 2.00 1,898 180,901 5,022,908 2004-05 1,831 10,499 12,330 215 77 292 5191 2.10 2,210 217,597 12,771,203 2005-06 1,845 10,494 12,339 - - - 5128 2.40 2,389 353,194 34,506,557Jul-Mar2005-06 1,875 10,536 12,411 - - - 5,174 - 2,339 236,166 27,344,9382006-07 1,845 10,494 12,339 - - - 5,200 2.50 2,444 353,194 55,600,211
Source: (i): Pakistan Post Office(ii): Pakistan Telecommunications Company Ltd
Note : Telegraph offices closed in 2006 (iii): Pakistan Telecommunication Authority
POST AND TELECOMMUNICATIONS
.. Not Available* Included Cardpay Phones
No of Tele-graph Offices