Chapter 14 REPET for Background/Foreground Separation in Audiozra446/doc/Rafii-Liutkus-Pardo - REPET...
17
Chapter 14 REPET for Background/Foreground Separation in Audio Zafar Rafii, Antoine Liutkus and Bryan Pardo Abstract Repetition is a fundamental element in generating and perceiving structure. In audio, mixtures are often composed of structures where a repeating background signal is superimposed with a varying foreground signal (e.g., a singer overlaying varying vocals on a repeating accompaniment or a varying speech signal mixed up with a repeating background noise). On this basis, we present the REpeating Pattern Extraction Technique (REPET), a simple approach for separating the repeating back- ground from the non-repeating foreground in an audio mixture. The basic idea is to find the repeating elements in the mixture, derive the underlying repeating models, and extract the repeating background by comparing the models to the mixture. Unlike other separation approaches, REPET does not depend on special parameterizations, does not rely on complex frameworks, and does not require external information. Because it is only based on repetition, it has the advantage of being simple, fast, blind, and therefore completely and easily automatable. 14.1 Introduction Figure–ground perception is the ability to segregate a scene into a foreground com- ponent (figure) and a background component (ground). In vision, the most famous example is probably the Rubin vase: depending on one’s attention, one would per- ceive either a vase or two faces [19]. In auditory scene analysis [2], different cues Z. Rafii (B ) · B. Pardo Northwestern University, Evanston, IL, USA e-mail: zafarrafi[email protected] B. Pardo e-mail: [email protected] A. Liutkus Inria, PAROLE,Villiers-lès-Nancy, France e-mail: [email protected] G. R. Naik and W. Wang (eds.), Blind Source Separation, 395 Signals and Communication Technology, DOI: 10.1007/978-3-642-55016-4_14, © Springer-Verlag Berlin Heidelberg 2014
Transcript of Chapter 14 REPET for Background/Foreground Separation in Audiozra446/doc/Rafii-Liutkus-Pardo - REPET...
Chapter 14REPET for Background/ForegroundSeparation in Audio
Zafar Rafii, Antoine Liutkus and Bryan Pardo
Abstract Repetition is a fundamental element in generating andperceiving structure.In audio, mixtures are often composed of structures where a repeating backgroundsignal is superimposed with a varying foreground signal (e.g., a singer overlayingvarying vocals on a repeating accompaniment or a varying speech signal mixed upwith a repeating background noise). On this basis, we present the REpeating PatternExtraction Technique (REPET), a simple approach for separating the repeating back-ground from the non-repeating foreground in an audio mixture. The basic idea is tofind the repeating elements in the mixture, derive the underlying repeating models,and extract the repeating background by comparing themodels to themixture. Unlikeother separation approaches, REPET does not depend on special parameterizations,does not rely on complex frameworks, and does not require external information.Because it is only based on repetition, it has the advantage of being simple, fast,blind, and therefore completely and easily automatable.
14.1 Introduction
Figure–ground perception is the ability to segregate a scene into a foreground com-ponent (figure) and a background component (ground). In vision, the most famousexample is probably the Rubin vase: depending on one’s attention, one would per-ceive either a vase or two faces [19]. In auditory scene analysis [2], different cues
Z. Rafii (B) · B. PardoNorthwestern University, Evanston, IL, USAe-mail: [email protected]
B. Pardoe-mail: [email protected]
A. LiutkusInria, PAROLE,Villiers-lès-Nancy, Francee-mail: [email protected]
G. R. Naik and W. Wang (eds.), Blind Source Separation, 395Signals and Communication Technology, DOI: 10.1007/978-3-642-55016-4_14,© Springer-Verlag Berlin Heidelberg 2014
396 Z. Rafii et al.
can be used to segregate foreground and background: loudness (e.g., the foregroundsignal is louder), spatial location (e.g., the foreground signal is in the center of thestereo field), or timbre (e.g., the foreground signal is a woman speaking).
Unlike fixed images (e.g., Rubin vase), audio has also a temporal dimension thatcan be exploited for segregation. Particularly, auditory scenes are often composed ofa background component that is more stable or repeating in time (e.g., air conditionernoise or footsteps), and a foreground component that is more variable in time (e.g.,a human talking or a saxophone solo). The most notable examples are probably seen(or rather heard) in music. Indeed, musical works are often organized into struc-tures where a varying melody is overlaid on a repeating background (e.g., rappingover a repeating drum loop or playing a solo over a repeating chord progression).This implies that there should be patterns repeating in time that could be used todiscriminate the background from the foreground in an auditory scene.
Repetition also appears as an exploitable cue for source separation in audio. Byidentifying and extracting the repeating patterns (e.g., drum loop or guitar riff), weshow that it is possible to separate the repeating background from the non-repeatingforeground in an audio mixture. This idea is supported by recent findings in cognitivepsychology which showed that human listeners are able to segregate individual audiosources if they repeat across different mixtures, even in the absence of other cues(e.g., spatial location) and without a prior knowledge of the sources [10].
In this chapter, we present the REpeating Pattern Extraction Technique (REPET),a simple method that uses repetition as a basis for background/foreground separationin audio. The basic idea is to find the repeating elements in the mixture, derive theunderlying repeating models, and extract the repeating background by comparingthe models to the mixture. The rest of this chapter is organized as follows.
In Sect. 14.2, we present the original REPET. The original REPET aims at iden-tifying and extracting the repeating patterns in an audio mixture, by estimating aperiod of the underlying repeating structure and modeling a segment of the periodi-cally repeating background [13, 16]. The idea can be loosely related to backgroundsubtraction, a technique used in computer vision for separating moving foregroundobjects from a fixed background scene in a sequence of video frames [12].
In Sect. 14.3, we present the adaptive REPET. The original REPET works wellwhen the repeating background is relatively stable (e.g., a verse or the chorus ina song); however, the repeating background can also vary over time (e.g., a versefollowed by the chorus in the song). The adaptive REPET is an extension of theoriginal REPET that can handle varying repeating structures, by estimating the time-varying repeating periods and extracting the repeating background locally, withoutthe need for segmentation or windowing [9].
In Sect. 14.4, we present REPET-SIM. The REPET methods work well when therepeating background has periodically repeating patterns (e.g., jackhammer noise);however, the repeating patterns can also happen intermittently or without a global orlocal periodicity (e.g., frogs by a pond). REPET-SIM is a generalization of REPETthat can also handle non-periodically repeating structures, by using a similaritymatrixto identify the repeating elements [14, 15].
14 REPET for Background/Foreground Separation in Audio 397
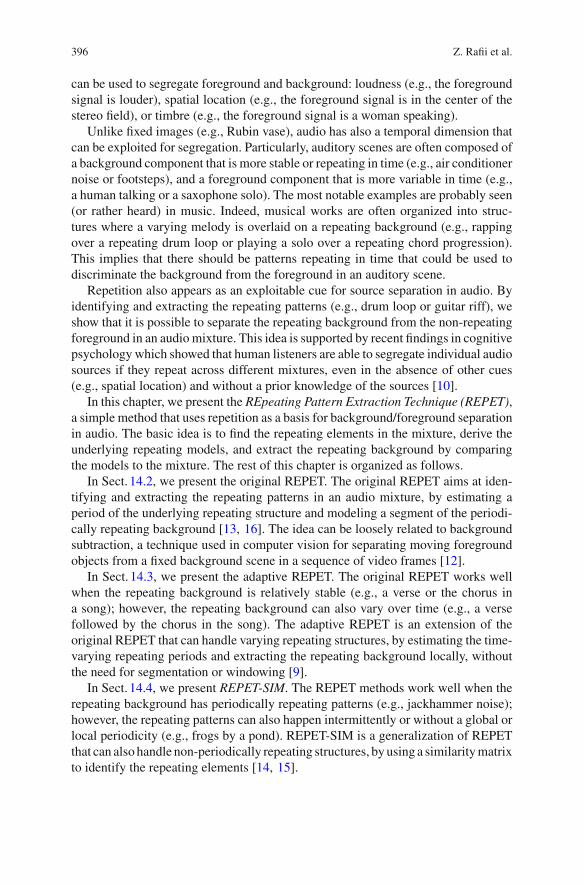
Fig. 14.1 Overviewof the originalREPET.Stage 1 calculation of the beat spectrumb and estimationof a repeating period p. Stage 2 segmentation of the mixture spectrogram V and calculation of therepeating segmentmodel S.Stage 3 calculation of the repeating spectrogrammodelW andderivationof the soft time–frequency mask M
14.2 REpeating Pattern Extraction Technique
The original REPET aims at identifying and extracting the repeating patterns inan audio mixture, by estimating a period of the underlying repeating structure andmodeling a segment of the periodically repeating background [13, 16].
The original REPET can be summarized in three stages (see Fig. 14.1): (1) identi-fication of a repeating period (see Sect. 14.2.1), (2) modeling of a repeating segment(see Sect. 14.2.2), and (3) extraction of the repeating structure (see Sect. 14.2.3).
14.2.1 Repeating Period Identification
Periodicities in a signal can be found by using the autocorrelation, which is the cross-correlation of a signal with itself. The function basically measures the similaritybetween a segment and a lagged version of itself over successive time lags.
Given amixture signal x , we first compute its short-time Fourier transform (STFT)X using windows of N samples. We then derive the magnitude spectrogram V by
398 Z. Rafii et al.
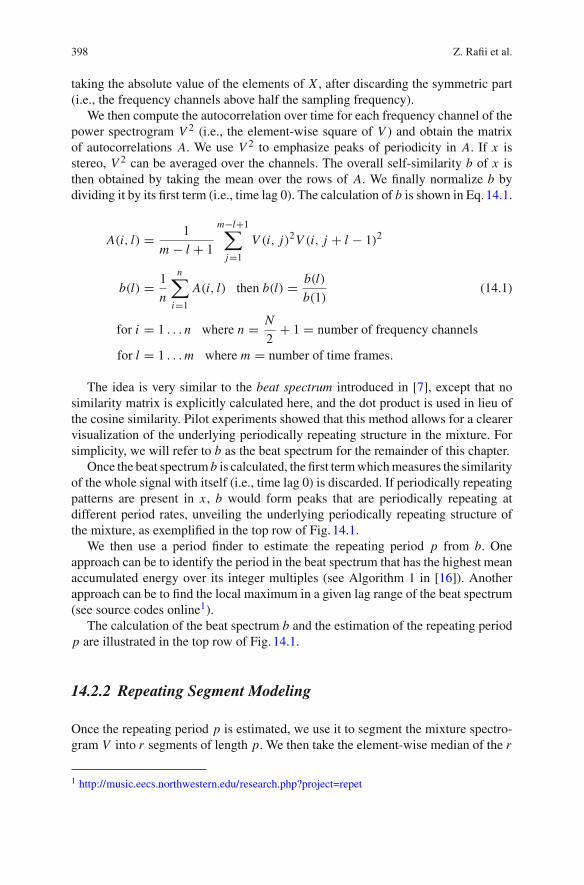
taking the absolute value of the elements of X , after discarding the symmetric part(i.e., the frequency channels above half the sampling frequency).
We then compute the autocorrelation over time for each frequency channel of thepower spectrogram V 2 (i.e., the element-wise square of V ) and obtain the matrixof autocorrelations A. We use V 2 to emphasize peaks of periodicity in A. If x isstereo, V 2 can be averaged over the channels. The overall self-similarity b of x isthen obtained by taking the mean over the rows of A. We finally normalize b bydividing it by its first term (i.e., time lag 0). The calculation of b is shown in Eq.14.1.
A(i, l) = 1
m − l + 1
m−l+1∑
j=1
V (i, j)2V (i, j + l − 1)2
b(l) = 1
n
n∑
i=1
A(i, l) then b(l) = b(l)
b(1)(14.1)
for i = 1 . . . n where n = N
2+ 1 = number of frequency channels
for l = 1 . . .m where m = number of time frames.
The idea is very similar to the beat spectrum introduced in [7], except that nosimilarity matrix is explicitly calculated here, and the dot product is used in lieu ofthe cosine similarity. Pilot experiments showed that this method allows for a clearervisualization of the underlying periodically repeating structure in the mixture. Forsimplicity, we will refer to b as the beat spectrum for the remainder of this chapter.
Once the beat spectrum b is calculated, the first termwhichmeasures the similarityof the whole signal with itself (i.e., time lag 0) is discarded. If periodically repeatingpatterns are present in x , b would form peaks that are periodically repeating atdifferent period rates, unveiling the underlying periodically repeating structure ofthe mixture, as exemplified in the top row of Fig. 14.1.
We then use a period finder to estimate the repeating period p from b. Oneapproach can be to identify the period in the beat spectrum that has the highest meanaccumulated energy over its integer multiples (see Algorithm 1 in [16]). Anotherapproach can be to find the local maximum in a given lag range of the beat spectrum(see source codes online1).
The calculation of the beat spectrum b and the estimation of the repeating periodp are illustrated in the top row of Fig. 14.1.
14.2.2 Repeating Segment Modeling
Once the repeating period p is estimated, we use it to segment the mixture spectro-gram V into r segments of length p. We then take the element-wise median of the r
1 http://music.eecs.northwestern.edu/research.php?project=repet
14 REPET for Background/Foreground Separation in Audio 399
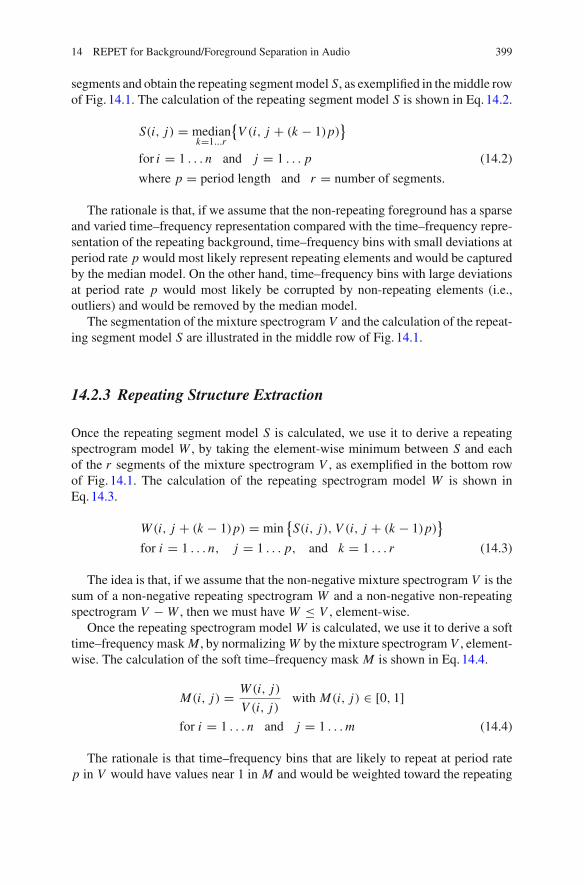
segments and obtain the repeating segmentmodel S, as exemplified in themiddle rowof Fig. 14.1. The calculation of the repeating segment model S is shown in Eq.14.2.
S(i, j) = mediank=1...r
{V (i, j + (k − 1)p)
}
for i = 1 . . . n and j = 1 . . . p (14.2)
where p = period length and r = number of segments.
The rationale is that, if we assume that the non-repeating foreground has a sparseand varied time–frequency representation compared with the time–frequency repre-sentation of the repeating background, time–frequency bins with small deviations atperiod rate p would most likely represent repeating elements and would be capturedby the median model. On the other hand, time–frequency bins with large deviationsat period rate p would most likely be corrupted by non-repeating elements (i.e.,outliers) and would be removed by the median model.
The segmentation of the mixture spectrogram V and the calculation of the repeat-ing segment model S are illustrated in the middle row of Fig. 14.1.
14.2.3 Repeating Structure Extraction
Once the repeating segment model S is calculated, we use it to derive a repeatingspectrogram model W , by taking the element-wise minimum between S and eachof the r segments of the mixture spectrogram V , as exemplified in the bottom rowof Fig. 14.1. The calculation of the repeating spectrogram model W is shown inEq.14.3.
W (i, j + (k − 1)p) = min{
S(i, j), V (i, j + (k − 1)p)}
for i = 1 . . . n, j = 1 . . . p, and k = 1 . . . r (14.3)
The idea is that, if we assume that the non-negative mixture spectrogram V is thesum of a non-negative repeating spectrogram W and a non-negative non-repeatingspectrogram V − W , then we must have W ≤ V , element-wise.
Once the repeating spectrogram model W is calculated, we use it to derive a softtime–frequency mask M , by normalizing W by the mixture spectrogram V , element-wise. The calculation of the soft time–frequency mask M is shown in Eq.14.4.
M(i, j) = W (i, j)
V (i, j)with M(i, j) ∈ [0, 1]
for i = 1 . . . n and j = 1 . . .m (14.4)
The rationale is that time–frequency bins that are likely to repeat at period ratep in V would have values near 1 in M and would be weighted toward the repeating
400 Z. Rafii et al.
background. On the other hand, time–frequency bins that are not likely to repeat atperiod rate p in V would have values near 0 in M and would be weighted toward thenon-repeating foreground.
We could further derive a binary time–frequency mask by setting time–frequencybins in M with values above a chosen threshold t ∈ [0, 1] to 1, while the rest isset to 0. Pilot experiments showed that the estimates sound better when using a softtime–frequency mask.
The time–frequency mask M is then symmetrized and multiplied to the STFTX of the mixture x , element-wise. The estimated background signal is obtained byinverting the resulting STFT into the time domain. The estimated foreground signalis obtained by simply subtracting the background signal from the mixture signal.
The calculation of the repeating spectrogram model W and the derivation of thesoft time–frequency mask M are illustrated in the bottom row of Fig. 14.1.
Experiments on a data set of song clips showed that the original REPET can beeffectively applied for music/voice separation [13, 16], performing as well as twostate-of-the-art methods, one based on a pitch-based method [8] and the other basedon non-negative matrix factorization (NMF) and a source-filter model [3]. Exper-iments showed that REPET can also be combined with other methods to improvebackground/foreground separation; for example, it can be used as a preprocessor topitch detection algorithms to improve melody extraction [16], or as a postprocessorto a singing voice separation algorithm to improve music/voice separation [17].
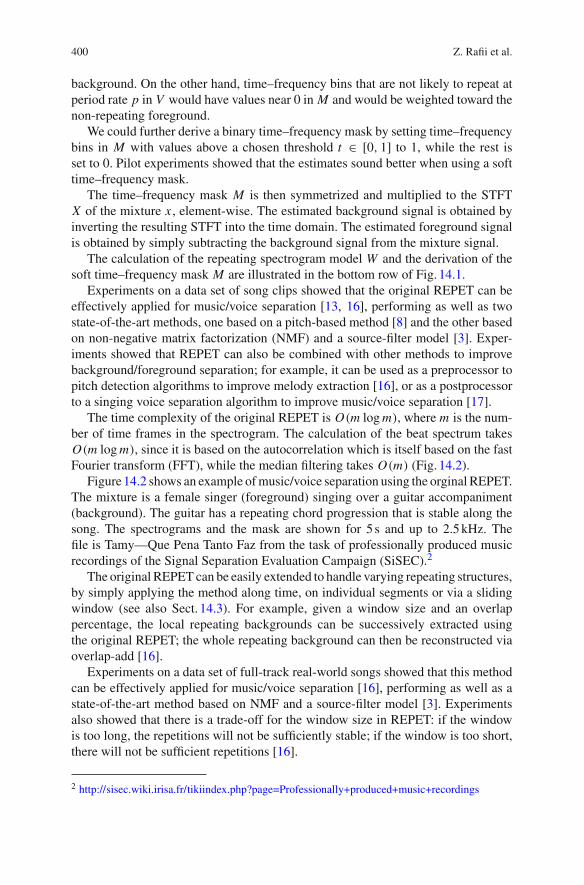
The time complexity of the original REPET is O(m logm), where m is the num-ber of time frames in the spectrogram. The calculation of the beat spectrum takesO(m logm), since it is based on the autocorrelation which is itself based on the fastFourier transform (FFT), while the median filtering takes O(m) (Fig. 14.2).
Figure14.2 shows an example ofmusic/voice separation using the orginal REPET.The mixture is a female singer (foreground) singing over a guitar accompaniment(background). The guitar has a repeating chord progression that is stable along thesong. The spectrograms and the mask are shown for 5 s and up to 2.5kHz. Thefile is Tamy—Que Pena Tanto Faz from the task of professionally produced musicrecordings of the Signal Separation Evaluation Campaign (SiSEC).2
The original REPET can be easily extended to handle varying repeating structures,by simply applying the method along time, on individual segments or via a slidingwindow (see also Sect. 14.3). For example, given a window size and an overlappercentage, the local repeating backgrounds can be successively extracted usingthe original REPET; the whole repeating background can then be reconstructed viaoverlap-add [16].
Experiments on a data set of full-track real-world songs showed that this methodcan be effectively applied for music/voice separation [16], performing as well as astate-of-the-art method based on NMF and a source-filter model [3]. Experimentsalso showed that there is a trade-off for the window size in REPET: if the windowis too long, the repetitions will not be sufficiently stable; if the window is too short,there will not be sufficient repetitions [16].
2 http://sisec.wiki.irisa.fr/tikiindex.php?page=Professionally+produced+music+recordings
14 REPET for Background/Foreground Separation in Audio 401
Fig. 14.2 Example of music/voice separation using the orginal REPET
14.3 Adaptive REPET
The original REPET works well when the repeating background is relatively stable(e.g., a verse or the chorus in a song); however, the repeating background can alsovary over time (e.g., a verse followed by the chorus in the song). The adaptive REPETis an extension of the original REPET that can handle varying repeating structures,by estimating the time-varying repeating periods and extracting the repeating back-ground locally, without the need for segmentation or windowing [9].
The adaptive REPET can be summarized in three stages (see Fig. 14.3): (1) iden-tification of the repeating periods (see Sect. 14.3.1), (2) modeling of a repeatingspectrogram (see Sect. 14.3.2), and (3) extraction of the repeating structure (seeSect. 14.3.3).
14.3.1 Repeating Periods Identification
The beat spectrum helps to find the global periodicity in a signal. Local period-icities can be found by computing beat spectra over successive windows. A beatspectrogram thus helps to visualize the variations of periodicity over time.
Given a mixture signal x , we first compute its magnitude spectrogram V (seeSect. 14.2.1). Given a window size w ≤ m, where m is the number of time frames in
402 Z. Rafii et al.
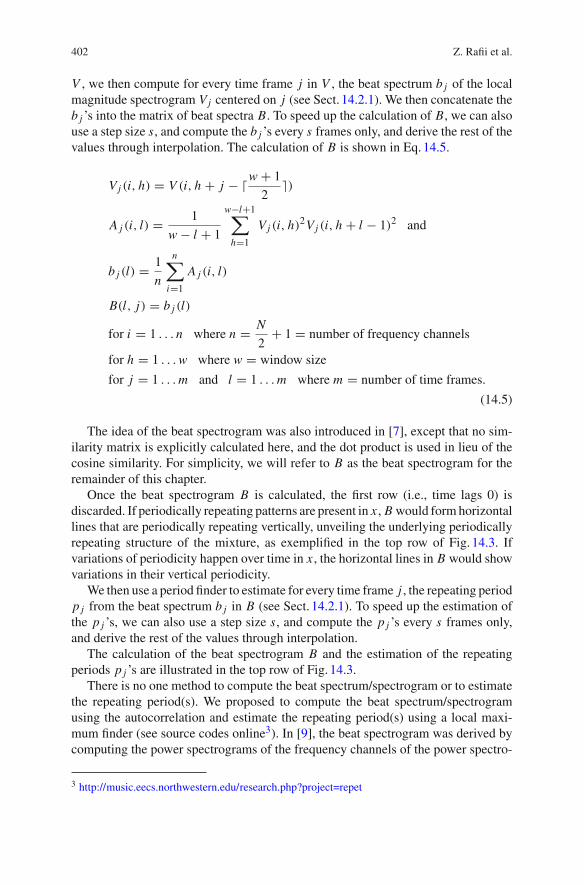
V , we then compute for every time frame j in V , the beat spectrum b j of the localmagnitude spectrogram Vj centered on j (see Sect. 14.2.1). We then concatenate theb j ’s into the matrix of beat spectra B. To speed up the calculation of B, we can alsouse a step size s, and compute the b j ’s every s frames only, and derive the rest of thevalues through interpolation. The calculation of B is shown in Eq.14.5.
Vj (i, h) = V (i, h + j − �w + 1
2�)
A j (i, l) = 1
w − l + 1
w−l+1∑
h=1
Vj (i, h)2Vj (i, h + l − 1)2 and
b j (l) = 1
n
n∑
i=1
A j (i, l)
B(l, j) = b j (l)
for i = 1 . . . n where n = N
2+ 1 = number of frequency channels
for h = 1 . . .w where w = window size
for j = 1 . . .m and l = 1 . . .m where m = number of time frames.
(14.5)
The idea of the beat spectrogram was also introduced in [7], except that no sim-ilarity matrix is explicitly calculated here, and the dot product is used in lieu of thecosine similarity. For simplicity, we will refer to B as the beat spectrogram for theremainder of this chapter.
Once the beat spectrogram B is calculated, the first row (i.e., time lags 0) isdiscarded. If periodically repeating patterns are present in x , B would formhorizontallines that are periodically repeating vertically, unveiling the underlying periodicallyrepeating structure of the mixture, as exemplified in the top row of Fig. 14.3. Ifvariations of periodicity happen over time in x , the horizontal lines in B would showvariations in their vertical periodicity.
We then use a period finder to estimate for every time frame j , the repeating periodp j from the beat spectrum b j in B (see Sect. 14.2.1). To speed up the estimation ofthe p j ’s, we can also use a step size s, and compute the p j ’s every s frames only,and derive the rest of the values through interpolation.
The calculation of the beat spectrogram B and the estimation of the repeatingperiods p j ’s are illustrated in the top row of Fig. 14.3.
There is no one method to compute the beat spectrum/spectrogram or to estimatethe repeating period(s). We proposed to compute the beat spectrum/spectrogramusing the autocorrelation and estimate the repeating period(s) using a local maxi-mum finder (see source codes online3). In [9], the beat spectrogram was derived bycomputing the power spectrograms of the frequency channels of the power spectro-
3 http://music.eecs.northwestern.edu/research.php?project=repet
14 REPET for Background/Foreground Separation in Audio 403
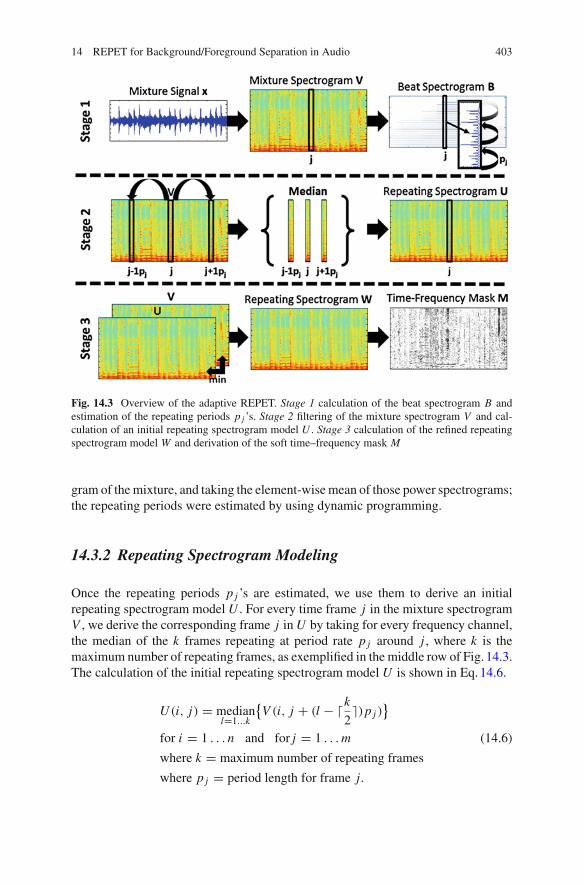
Fig. 14.3 Overview of the adaptive REPET. Stage 1 calculation of the beat spectrogram B andestimation of the repeating periods p j ’s. Stage 2 filtering of the mixture spectrogram V and cal-culation of an initial repeating spectrogram model U . Stage 3 calculation of the refined repeatingspectrogram model W and derivation of the soft time–frequency mask M
gram of themixture, and taking the element-wisemean of those power spectrograms;the repeating periods were estimated by using dynamic programming.
14.3.2 Repeating Spectrogram Modeling
Once the repeating periods p j ’s are estimated, we use them to derive an initialrepeating spectrogram model U . For every time frame j in the mixture spectrogramV , we derive the corresponding frame j in U by taking for every frequency channel,the median of the k frames repeating at period rate p j around j , where k is themaximum number of repeating frames, as exemplified in the middle row of Fig. 14.3.The calculation of the initial repeating spectrogram model U is shown in Eq.14.6.
U (i, j) = medianl=1...k
{V (i, j + (l − �k
2�)p j )
}
for i = 1 . . . n and for j = 1 . . .m (14.6)
where k = maximum number of repeating frames
where p j = period length for frame j.

404 Z. Rafii et al.
The rationale is that, if we assume that the non-repeating foreground has a sparseand varied time–frequency representation compared with the time–frequency repre-sentation of the repeating background, time–frequency bins with small deviations attheir period rate p j would most likely represent repeating elements and would becaptured by the median model. On the other hand, time–frequency bins with largedeviations at their period rate p j would most likely be corrupted by non-repeatingelements (i.e., outliers) and would be removed by the median model.
The filtering of themixture spectrogram V and the calculation of the initial repeat-ing spectrogram model U are illustrated in the middle row of Fig. 14.3.
Note that, compared with the original REPET that uses the same repeating periodfor each time frame of the mixture spectrogram (see Sect. 14.2), the adaptive REPETuses a different repeating period for each time frame, so that it can also handle varyingrepeating structures where the repeating period can also change over time.
14.3.3 Repeating Structure Extraction
Once the initial repeating spectrogram model U is calculated, we use it to derivea refined repeating spectrogram model W , by taking the element-wise minimumbetween U and the mixture spectrogram V , as exemplified in the bottom row ofFig. 14.3. The calculation of the refined repeating spectrogram model W is shownin Eq.14.7.
W (i, j) = min{U (i, j), V (i, j)
}
for i = 1 . . . n and j = 1 . . .m (14.7)
The idea is that, if we assume that the non-negative mixture spectrogram V is thesum of a non-negative repeating spectrogram W and a non-negative non-repeatingspectrogram V −W , thenwemust have W ≤ V , element-wise (see also Sect. 14.2.3).
Once the refined repeating spectrogrammodel W is calculated, we use it to derivea soft time–frequency mask M (see Sect. 14.2.3).
The calculation of the refined repeating spectrogram model W and the derivationof the soft time–frequency mask M are illustrated in the bottom row of Fig. 14.3.
Experiments on a data set of full-track real-world songs showed that the adaptiveREPET can be effectively applied for music/voice separation [9], performing aswell as a state-of-the-art method based on multiple median filtering of the mixturespectrogram at different frequency resolutions [5] (Fig. 14.4).
The time complexity of the adaptiveREPET is O(m logm), wherem is the numberof time frames in the spectrogram. The calculation of the beat spectrogram takesO(m logm), since it is based on the beat spectrum (see Sect. 14.2.3), while themedian filtering takes O(m).
Figure14.4 shows an example of music/voice separation using the adaptiveREPET. The mixture is a male singer (foreground) singing over a guitar and drums
14 REPET for Background/Foreground Separation in Audio 405
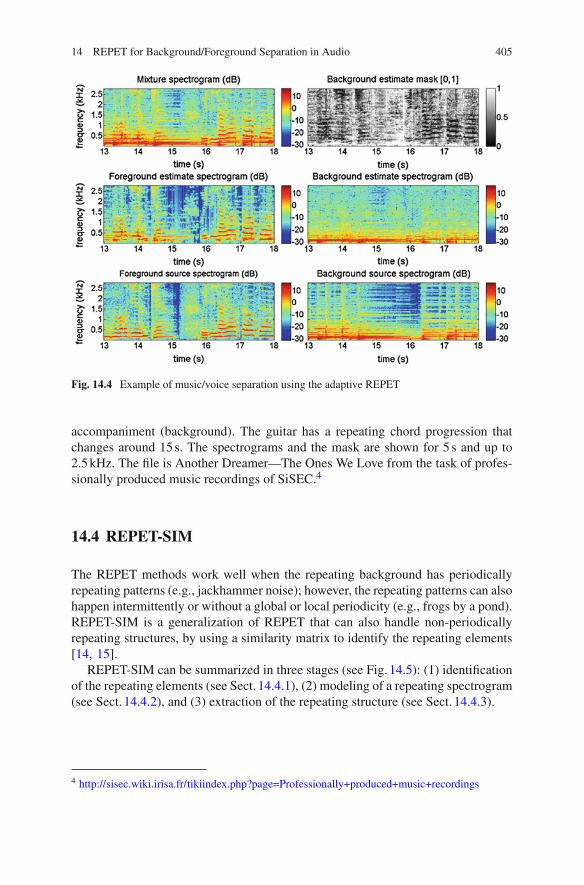
Fig. 14.4 Example of music/voice separation using the adaptive REPET
accompaniment (background). The guitar has a repeating chord progression thatchanges around 15s. The spectrograms and the mask are shown for 5 s and up to2.5kHz. The file is Another Dreamer—The Ones We Love from the task of profes-sionally produced music recordings of SiSEC.4
14.4 REPET-SIM
The REPET methods work well when the repeating background has periodicallyrepeating patterns (e.g., jackhammer noise); however, the repeating patterns can alsohappen intermittently or without a global or local periodicity (e.g., frogs by a pond).REPET-SIM is a generalization of REPET that can also handle non-periodicallyrepeating structures, by using a similarity matrix to identify the repeating elements[14, 15].
REPET-SIM can be summarized in three stages (see Fig. 14.5): (1) identificationof the repeating elements (see Sect. 14.4.1), (2) modeling of a repeating spectrogram(see Sect. 14.4.2), and (3) extraction of the repeating structure (see Sect. 14.4.3).
4 http://sisec.wiki.irisa.fr/tikiindex.php?page=Professionally+produced+music+recordings
406 Z. Rafii et al.
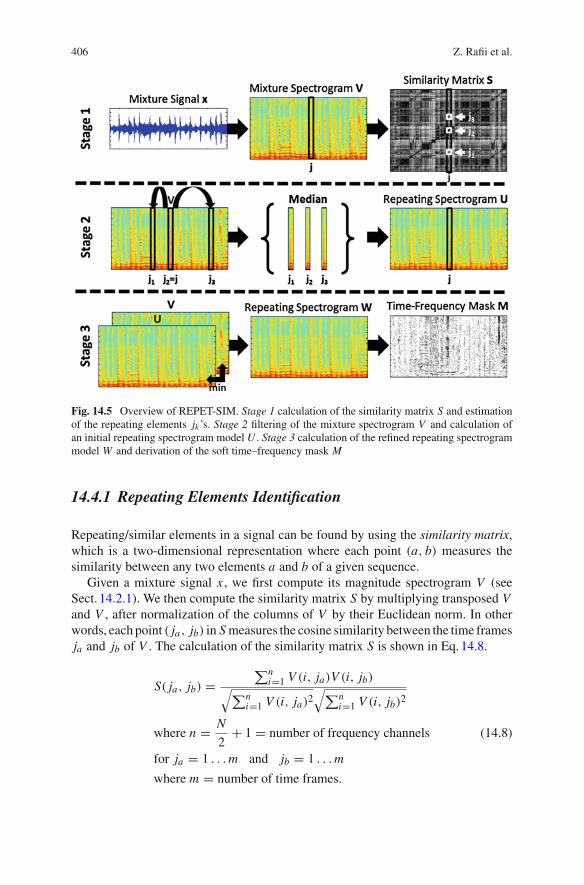
Fig. 14.5 Overview of REPET-SIM. Stage 1 calculation of the similarity matrix S and estimationof the repeating elements jk ’s. Stage 2 filtering of the mixture spectrogram V and calculation ofan initial repeating spectrogram model U . Stage 3 calculation of the refined repeating spectrogrammodel W and derivation of the soft time–frequency mask M
14.4.1 Repeating Elements Identification
Repeating/similar elements in a signal can be found by using the similarity matrix,which is a two-dimensional representation where each point (a, b) measures thesimilarity between any two elements a and b of a given sequence.
Given a mixture signal x , we first compute its magnitude spectrogram V (seeSect. 14.2.1). We then compute the similarity matrix S by multiplying transposed Vand V , after normalization of the columns of V by their Euclidean norm. In otherwords, each point ( ja, jb) in S measures the cosine similarity between the time framesja and jb of V . The calculation of the similarity matrix S is shown in Eq.14.8.
S( ja, jb) =∑n
i=1 V (i, ja)V (i, jb)√∑ni=1 V (i, ja)2
√∑ni=1 V (i, jb)2
where n = N
2+ 1 = number of frequency channels (14.8)
for ja = 1 . . .m and jb = 1 . . .m
where m = number of time frames.
14 REPET for Background/Foreground Separation in Audio 407
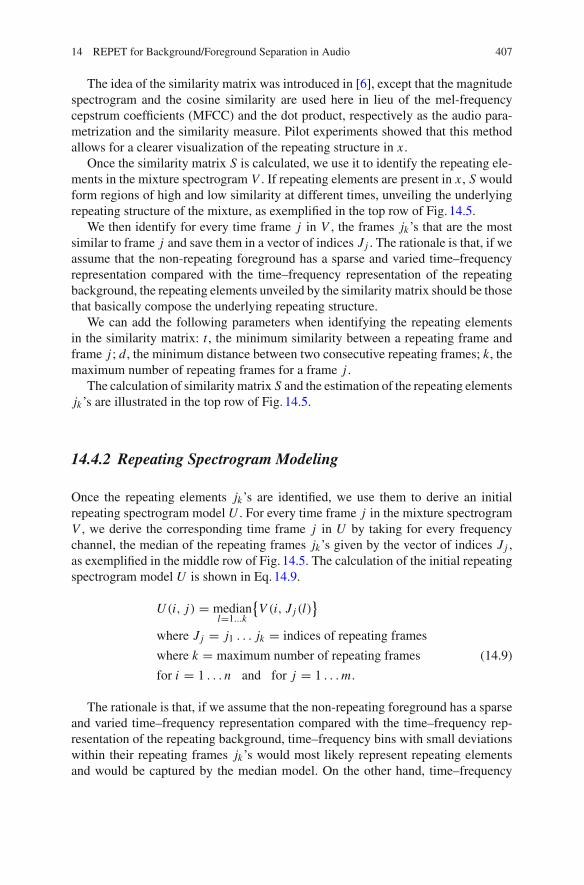
The idea of the similarity matrix was introduced in [6], except that the magnitudespectrogram and the cosine similarity are used here in lieu of the mel-frequencycepstrum coefficients (MFCC) and the dot product, respectively as the audio para-metrization and the similarity measure. Pilot experiments showed that this methodallows for a clearer visualization of the repeating structure in x .
Once the similarity matrix S is calculated, we use it to identify the repeating ele-ments in the mixture spectrogram V . If repeating elements are present in x , S wouldform regions of high and low similarity at different times, unveiling the underlyingrepeating structure of the mixture, as exemplified in the top row of Fig. 14.5.
We then identify for every time frame j in V , the frames jk’s that are the mostsimilar to frame j and save them in a vector of indices J j . The rationale is that, if weassume that the non-repeating foreground has a sparse and varied time–frequencyrepresentation compared with the time–frequency representation of the repeatingbackground, the repeating elements unveiled by the similarity matrix should be thosethat basically compose the underlying repeating structure.
We can add the following parameters when identifying the repeating elementsin the similarity matrix: t , the minimum similarity between a repeating frame andframe j ; d, the minimum distance between two consecutive repeating frames; k, themaximum number of repeating frames for a frame j .
The calculation of similaritymatrix S and the estimation of the repeating elementsjk’s are illustrated in the top row of Fig. 14.5.
14.4.2 Repeating Spectrogram Modeling
Once the repeating elements jk’s are identified, we use them to derive an initialrepeating spectrogram model U . For every time frame j in the mixture spectrogramV , we derive the corresponding time frame j in U by taking for every frequencychannel, the median of the repeating frames jk’s given by the vector of indices J j ,as exemplified in the middle row of Fig. 14.5. The calculation of the initial repeatingspectrogram model U is shown in Eq.14.9.
U (i, j) = medianl=1...k
{V (i, J j (l)
}
where J j = j1 . . . jk = indices of repeating frames
where k = maximum number of repeating frames (14.9)
for i = 1 . . . n and for j = 1 . . .m.
The rationale is that, if we assume that the non-repeating foreground has a sparseand varied time–frequency representation compared with the time–frequency rep-resentation of the repeating background, time–frequency bins with small deviationswithin their repeating frames jk’s would most likely represent repeating elementsand would be captured by the median model. On the other hand, time–frequency
408 Z. Rafii et al.
bins with large deviations within their repeating frames jk’s would most likely becorrupted by non-repeating elements (i.e., outliers) and would be removed by themedian model.
The filtering of themixture spectrogram V and the calculation of the initial repeat-ing spectrogram model U are illustrated in the middle row of Fig. 14.5.
Note that, compared with the REPET methods that look for periodically repeat-ing elements for each time frame of the mixture spectrogram (see Sects. 14.2 and14.3), REPET-SIM also looks for non-periodically repeating elements for each timeframe, so that it can also handle non-periodically repeating structureswhere repeatingelements can also happen intermittently.
14.4.3 Repeating Structure Extraction
Once the initial repeating spectrogram model U is calculated, we use it to derive arefined repeating spectrogrammodelW , as exemplified in the bottom rowof Fig. 14.5(see Sect. 14.3.3).
Once the refined repeating spectrogrammodel W is calculated, we use it to derivea soft time–frequency mask M (see Sect. 14.2.3).
The calculation of the refined repeating spectrogram model W and the derivationof the soft time–frequency mask M are illustrated in the bottom row of Fig. 14.5.
Experiments on a data set of full-track real-world songs showed that REPET-SIMcan be effectively applied for music/voice separation [14], performing as well as astate-of-the-artmethod based onmultiplemedianfiltering of themixture spectrogramat different frequency resolutions [5], and the adaptive REPET [9].
Note that FitzGerald proposed a method very similar to REPET-SIM, except thathe computed a distance matrix based on the Euclidean distance and he did not use aminimum distance parameter [4].
The time complexity of the REPET-SIM is O(m2), where m is the number of timeframes in the spectrogram.The calculation of the similaritymatrix takes O(m2), sinceit is based onmatrixmultiplication, while themedian filtering takes O(m) (Fig. 14.6).
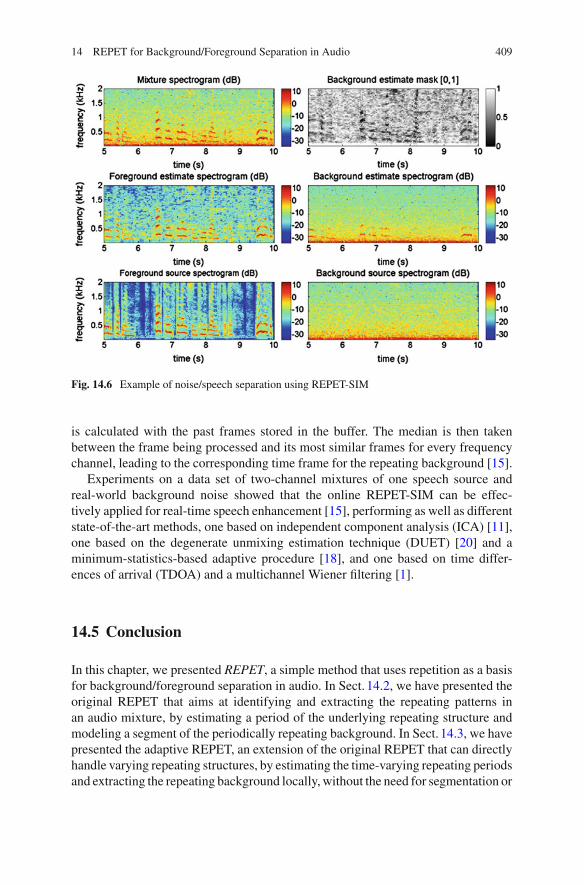
Figure14.6 shows an example of noise/speech separation using REPET-SIM. Themixture is a female speaker (foreground) speaking in a town square (background).The square has repeating noisy elements (passers-by and cars) that happen intermit-tently. The spectrograms and the mask are shown for 5 s and up to 2kHz. The fileis dev_Sq1_Co_B from the task of two-channel mixtures of speech and real-worldbackground noise of the SiSEC.5
REPET-SIM can be easily implemented online to handle real-time computing,particularly for real-time speech enhancement. The online REPET-SIM simplyprocesses the time frames of the mixture one after the other given a buffer thattemporally stores past frames. For every time frame being processed, the similarity
5 http://sisec.wiki.irisa.fr/tiki-index.php?page=Two-channel+mixtures+of+speech+and+realworld+background+noise
14 REPET for Background/Foreground Separation in Audio 409
Fig. 14.6 Example of noise/speech separation using REPET-SIM
is calculated with the past frames stored in the buffer. The median is then takenbetween the frame being processed and its most similar frames for every frequencychannel, leading to the corresponding time frame for the repeating background [15].
Experiments on a data set of two-channel mixtures of one speech source andreal-world background noise showed that the online REPET-SIM can be effec-tively applied for real-time speech enhancement [15], performing as well as differentstate-of-the-art methods, one based on independent component analysis (ICA) [11],one based on the degenerate unmixing estimation technique (DUET) [20] and aminimum-statistics-based adaptive procedure [18], and one based on time differ-ences of arrival (TDOA) and a multichannel Wiener filtering [1].
14.5 Conclusion
In this chapter, we presented REPET, a simple method that uses repetition as a basisfor background/foreground separation in audio. In Sect. 14.2, we have presented theoriginal REPET that aims at identifying and extracting the repeating patterns inan audio mixture, by estimating a period of the underlying repeating structure andmodeling a segment of the periodically repeating background. In Sect. 14.3, we havepresented the adaptive REPET, an extension of the original REPET that can directlyhandle varying repeating structures, by estimating the time-varying repeating periodsand extracting the repeating background locally, without the need for segmentation or
410 Z. Rafii et al.
windowing. InSect. 14.4,wehave presentedREPET-SIM, a generalization ofREPETthat can also handle non-periodically repeating structures, by using a similaritymatrixto identify repeating elements.
Experiments on various data sets showed that REPET can be effectively appliedfor background/foreground separation, performing as well as different state-of-the-art approaches, while being computationally efficient. Unlike other separationapproaches, REPET does not depend on special parameterizations, does not rely oncomplex frameworks, and does not require external information. Because it is onlybased on repetition, it has the advantage of being simple, fast, blind, and thereforecompletely and easily automatable.
More information about REPET, including source codes, audio examples, andrelated publications, can be found online.6 This work was in part supported by NSFgrant number IIS-0812314.
References
1. Blandin, C., Ozerov, A., Vincent, E.:Multi-source TDOA estimation in reverberant audio usingangular spectra and clustering. Signal Process. 92(8), 1950–1960 (2012)
2. Bregman, A.S.: Auditory Scene Analysis. MIT Press, Cambridge (1990)3. Durrieu, J.L., David, B., Richard, G.: A musically motivated mid-level representation for pitch
estimation andmusical audio source separation. IEEE J. Sel. Top. Sig. Process. 5(6), 1180–1191(2011)
4. FitzGerald, D.: Vocal separation using nearest neighbours and median filtering. In: 23rd IETIrish Signals and Systems Conference. Maynooth, Ireland (2012)
5. FitzGerald, D., Gainza, M.: Single channel vocal separation using median filtering and factori-sation techniques. ISAST Trans. Electron. Signal Process. 4(1), 62–73 (2010)
6. Foote, J.: Visualizing music and audio using self-similarity. In: 7th ACM International Con-ference on Multimedia, pp. 77–80. Orlando, FL, USA (1999)
7. Foote, J., Uchihashi, S.: The beat spectrum: a new approach to rhythm analysis. In: IEEEInternational Conference on Multimedia and Expo, pp. 881–884. Tokyo, Japan (2001)
8. Hsu, C.L., Jang, J.S.R.: On the improvement of singing voice separation for monaural record-ings using the MIR-1K dataset. IEEE Trans Audio Speech Lang. Process. 18(2), 310–319(2010)
9. Liutkus, A., Rafii, Z., Badeau, R., Pardo, B., Richard, G.: Adaptive filtering for music/voiceseparation exploiting the repeating musical structure. In: 37th International Conference onAcoustics, Speech and Signal Processing. Kyoto, Japan (2012)
10. McDermott, J.H., Wrobleski, D., Oxenham, A.J.: Recovering sound sources from embeddedrepetition. Proc Nat. Acad. Sci. U.S.A. 108(3), 1188–1193 (2011)
11. Nesta, F., Matassoni, M.: Robust automatic speech recognition through on-line semi blindsource extraction. In: CHIME 2011 Workshop on Machine Listening in Multisource Environ-ments, pp. 18–23. Florence, Italy (2011)
12. Piccardi, M.: Background subtraction techniques: a review. In: IEEE International Conferenceon Systems, Man and Cybernetics. The Hague, The Netherlands (2004)
13. Rafii, Z., Pardo, B.: A simple music/voice separation system based on the extraction of therepeating musical structure. In: 36th International Conference on Acoustics, Speech and SignalProcessing. Prague, Czech Republic (2011)
6 http://music.eecs.northwestern.edu/research.php?project=repet
14 REPET for Background/Foreground Separation in Audio 411
14. Rafii, Z., Pardo, B.: Music/voice separation using the similarity matrix. In: 13th InternationalSociety for Music Information Retrieval. Porto, Portugal (2012)
15. Rafii, Z., Pardo, B.: Online REPET-SIM for real-time speech enhancement. In: 38th Inter-national Conference on Acoustics, Speech and Signal Processing. Vancouver, BC, Canada(2013)
16. Rafii, Z., Pardo, B.: REpeating Pattern Extraction Technique (REPET): A simple method formusic/voice separation. IEEE Trans. Audio Speech Lang. Process 21(1), 71–82 (2013)
17. Rafii, Z., Sun, D.L., Germain, F.G., Mysore, G.J.: Combining modeling of singing voice andbackground music for automatic separation of musical mixtures. In: 14th International Societyfor Music Information Retrieval. Curitiba, PR, Brazil (2013).
18. Rangachari, S., Loizou, P.C.: A noise-estimation algorithm for highly non-stationary environ-ments. Speech Commun. 48(2), 220–231 (2006)
19. Rubin, E.: Synsoplevede Figurer. Gyldendal, Skive (1915)20. Özgür Yilmaz, Rickard, S.: Blind separation of speech mixtures via time–frequency masking.
IEEE Trans. Signal Process. 52(7), 1830–1847 (2004)