Chapter 13 Phonons - Western Michigan Universityhomepages.wmich.edu/~leehs/ME695/Chapter 13.pdf ·...
37
13-1 Chapter 13 Phonons Contents Chapter 13 Phonons ...................................................................................................... 13-1 Contents .......................................................................................................................... 13-1 13.1 Crystal Vibration................................................................................................ 13-2 13.1.1 One Atom in a Primitive cell ..................................................................... 13-2 13.1.2 Two Atoms in a Unit cell ........................................................................... 13-5 13.2 Specific Heat .................................................................................................... 13-10 13.2.1 Internal Energy......................................................................................... 13-10 13.2.2 Debye Model ............................................................................................ 13-11 Example 13.1 Atomic Size and Specific Heat .......................................................... 13-17 13.3 Lattice Thermal Conductivity .......................................................................... 13-21 13.3.1 Klemens-Callaway Model ....................................................................... 13-21 13.3.2 Umklapp Processes .................................................................................. 13-25 13.3.3 Callaway Model ....................................................................................... 13-27 13.3.4 Phonon Relaxation Times ........................................................................ 13-27 Example 13.2 Lattice Thermal Conductivity............................................................ 13-32 Problems ....................................................................................................................... 13-34 References..................................................................................................................... 13-36 The quantized energy of a lattice vibration is called a phonon, which is in analogy with a photon of the electromagnetic wave.
Transcript of Chapter 13 Phonons - Western Michigan Universityhomepages.wmich.edu/~leehs/ME695/Chapter 13.pdf ·...

13-1
Chapter 13 Phonons
Contents
Chapter 13 Phonons ...................................................................................................... 13-1
Contents .......................................................................................................................... 13-1 13.1 Crystal Vibration ................................................................................................ 13-2
13.1.1 One Atom in a Primitive cell ..................................................................... 13-2 13.1.2 Two Atoms in a Unit cell ........................................................................... 13-5
13.2 Specific Heat .................................................................................................... 13-10 13.2.1 Internal Energy......................................................................................... 13-10
13.2.2 Debye Model ............................................................................................ 13-11
Example 13.1 Atomic Size and Specific Heat .......................................................... 13-17
13.3 Lattice Thermal Conductivity .......................................................................... 13-21 13.3.1 Klemens-Callaway Model ....................................................................... 13-21 13.3.2 Umklapp Processes .................................................................................. 13-25
13.3.3 Callaway Model ....................................................................................... 13-27 13.3.4 Phonon Relaxation Times ........................................................................ 13-27
Example 13.2 Lattice Thermal Conductivity ............................................................ 13-32 Problems ....................................................................................................................... 13-34 References ..................................................................................................................... 13-36
The quantized energy of a lattice vibration is called a phonon, which is in analogy with a photon
of the electromagnetic wave.

13-2
13.1 Crystal Vibration
13.1.1 One Atom in a Primitive cell
Consider the one-dimensional elastic vibration of a crystal with one atom in a unit cell in Figure
13.1. We want to find the frequency of an elastic wave in terms of the wavevector k. There are
the precise equation if each atom were connected to its neighbors by perfect springs with spring
constant C.
Figure 13.1 One-dimensional monatomic lattice chain model. a is the distance between atoms
(lattice constant). The atoms as displaced during passage of a longitudinal wave.
We assume that the force at x is proportional to the displacement as
nnnnn xxCxxCf 11 (13.1)
Using the Newton’s second law of motion with an atom of mass m,
2
2
dt
xdmf n
n
(13.2)
Combining these two, we have
Na
a
xn-1xn xn+1 xn+2 xn+3 xn+4

13-3
nnnn xxxC
dt
xdm 2112
2
(13.3)
The general solution is found to be
tknai
n Aex (13.4)
where is the angular frequency of f, where f is the frequency. We consider the standing
wave for a crystal which has a finite number N of atoms. N is large and we simply connect the two
remote ends of the chain making a circular chain. The periodic boundary conditions requires that
1iknae (13.5)
Since knaiknaeikna sincos , we have
1cos kna (13.6)
which leads to
N
n
ak
2 , where n = 1, 2, …..N (13.7)
Note that k is changed by a2 . Considering the first Billouin zone, using periodicity we have
ak
a
(13.8)
Thus, the displacement of phonons can always be described by a wavevector within the Brillouin
zone. Taking the second derivative of Equation (13.4) gives
13-4
tknain Aedt
xd 2
2
2
(13.9)
Inserting Equations (13.4) and (13.9) into (13.3) gives
tknaiikaika
tknaitankitankitknai
eeeCA
AeAeAeCAe
2
2112
(13.10)
which leads to
21
22ikaika ee
m
C
(13.11)
Solving for , we have
2sin
4 ka
m
C
(13.12)
The solution describes a wave propagating along the chain with phase velocity sv , and group
velocity gv . The frequency is plotted against the wavevector k in Figure 13.2. Such a curve is
known as a dispersion relation. The group velocity is
kvg
(13.13)
When k is small compared with /k, is linear in k. The phase velocity is equal to the speed of
sound sv as

13-5
kvs
(13.14)
Figure 13.2 Phonon dispersion curve of a one-dimensional monatomic lattice chain for Brillouin
zone. The Debye approximation use a linear relationship between the frequency and the
wavevector.
It can be seen in Figure 13.2 that the dispersion curve in the Brillouin zone differs greatly from
dispersion curve for a continuum, which for comparison has been assumed to have the same
behavior as the discrete chain in the long-wavelength limit (small k).
13.1.2 Two Atoms in a Unit cell
Consider the one-dimensional elastic vibration of a crystal with two different mass atoms in a unit
cell, which are connected with spring constant C (Figure 13.3).

13-6
Figure 13.3 Diatomic linear chain of different atoms, connected with spring constant C.
For large M,
nnnnn XxCXxCF 1 (13.15)
For small m,
nnnnn xXCxXCf 1 (13.16)
Using the Newton’s second law of motion, we have
𝑀𝑑2𝑋𝑛𝑑𝑡2
= 𝐶(𝑥𝑛 + 𝑥𝑛+1 − 2𝑋𝑛) (13.17)
nnnn xXXC
dt
xdm 212
2
(13.18)
The determinant should be zero and then

13-7
0242 224 ikaika eeCmMCMm (13.19)
Solving for and ,
kamMCMmCMmC
mMcos1822
2
1 222
1
(13.20)
and
kamMCMmCMmC
mMcos1822
2
1 222
2
(13.21)
When k is small, 1cos ka which leads to 01 and
mM
MmC
22
(13.22)
When k is /a at the boundary of the Brillouin zone, 1cos ka which leads to
M
C21
(13.23)
m
C22
(13.24)
In Figure 13.4, the lower branch has the same structure as the single branch we found in the
monatomic lattice: vanishes linearly in k for small k, and the curve becomes flat at the edges of
the Brillouin zone. This branch is known as the acoustical branch because its dispersion relation
is of the form = vk characteristic of sound waves at small k. The second branch starts as

13-8
mMMmC 22 at k = 0 and decreases with increasing k. This branch is known as the
optical branch because the long wavelength optical modes in ionic crystals can interact with
electromagnetic radiation, and are responsible for much of the characteristic optical behavior of
such crystals.
Figure 13.4 Phonon dispersion curve of a one-dimensional diatomic lattice chain for Brillouin
zone.
If there are p-atoms in a 3-dimensional lattice, there are 3×p branches to the dispersion relation:
three acoustical branches and (3×p-3) optical branches. For example one atom in a lattice has 3
acoustical and zero optical branches. If there are two atoms in a lattice, there will be 6 branches: 3
acoustical and 3 optical branches as shown in Figure 13.5. We have longitudinal acoustical LA
and transverse acoustical TA modes, and longitudinal optical LO and transverse optical TO modes.
The group velocity of the upper optical modes is small so that they are not very effective in
transporting energy, but they may affect heat flow by interacting with the acoustical modes which
are mainly responsible for the thermal conductivity.
13-9
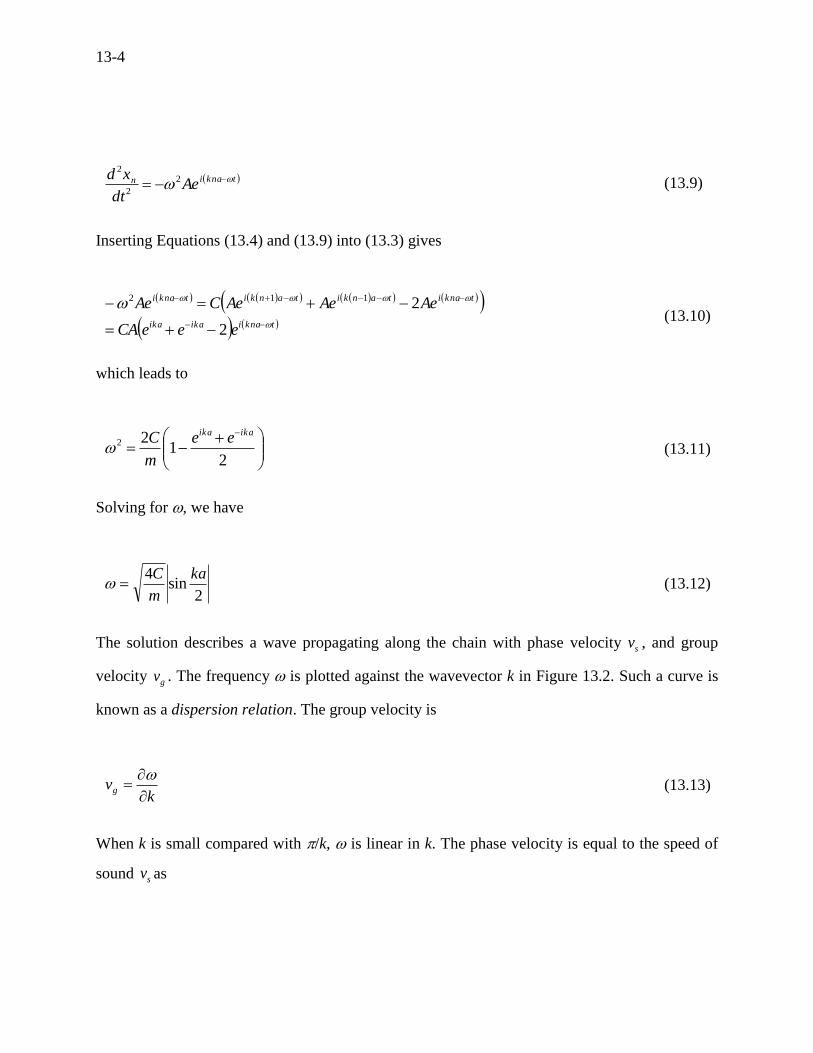
Figure 13.5 Phonon dispersion relations of a three-dimensional diatomic lattice for Brillouin
zone.
Although a crystal may be said to have three acoustical branches, this does not necessary mean
that these must everywhere have different frequencies. In a cubic structure of PbTe, the two
transverse branches are degenerate, which is shown in Figure 13.6 (a). It should be noted that
“optical” is the term used to describe all branches that have a non-zero frequency at k = 0.

13-10
(a)
(b)
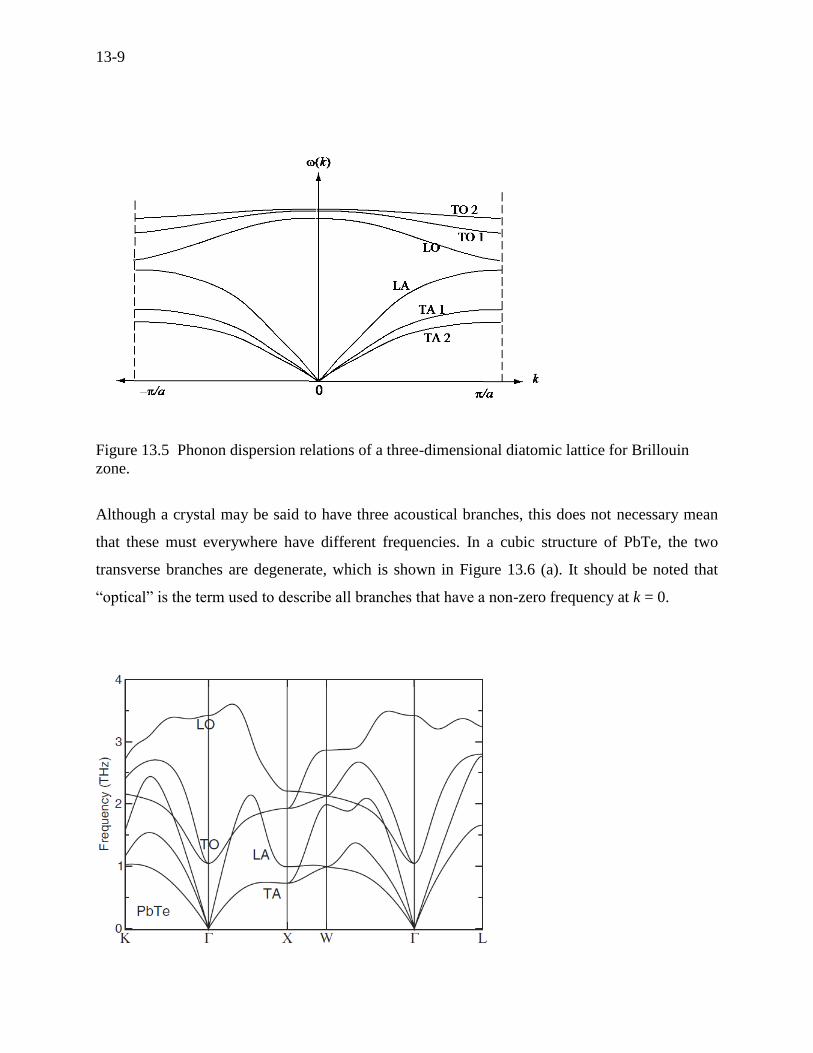
Figure 13.6 (a) Calculated phonon dispersion of PbTe by Zhang et al. (2009)[1], (b) The
Brillouin zone of PbTe. Points of high symmetry are denoted by , L, X etc.
13.2 Specific Heat
The heat capacity is the ratio of the amount of heat energy per unit temperature rise. The specific
heat is the heat capacity per unit mass, which is a characteristic of the material.
13.2.1 Internal Energy
In quantum statistics, the energy of a linear lattice vibration is given by
2
1, phofE
(13.25)
where ½ is the zero point energy which has no contribution to the heat capacity. is the energy
of a phonon. phof , is the thermal equilibrium occupancy (digit number) of phonons, which is
called the Bose-Einstein distribution function as

13-11
1
1,
TkphoBe
f
(13.26)
The internal energy U, which is the total vibrational energy, can be obtained by summing over all
normal modes, approximating the lattice as a continuum but with a maximum frequency.
dgEU ph
p
max
0
(13.27)
where p is pth branch (the index of phonon branches) and gph() is the phonon density of states.
13.2.2 Debye Model
In the Debye model, the lattice vibrates as if it were an elastic continuum, but the vibration
frequencies cannot exceed a certain maximum value, chosen to make the total number of modes
equal to the total number of classical degrees of freedom. The Debye model replaces all branches
of the vibrational spectrum with three branches, each with the same linear dispersion relations.
The velocity of sound is taken as constant for each branches, as it would be for a classical elastic
continuum. In the Debye model the optical modes are unceremoniously lumped into the top of the
distribution of acoustic modes, as if they were merely elastic waves of very short wavelength.
Despite its obvious crudity, the Debye approximation has the great advantage of supreme
simplicity. If any one parameter is required to measure the energy scale of the vibrations of a solid,
the Debye temperature is the most appropriate. If any one function is required to present the
distribution of the lattice frequency, the phonon density of states is the simplest.
The dispersion relation is approximated, as in Equation (13.14), to be
kvs (13.28)

13-12
For each branch, the total number of modes (degree of freedom) N is obtained by dividing a sphere
of k-space by a volume of the smallest wavevector k.
2
3
3
3
62
3
4
Vk
L
k
kN
(13.29)
where 3LV and 333
svk , we have
32
3
6 sv
VN
(13.30)
If there are N primitive cells in a specimen, the total number of acoustic phonon modes is N. Debye
treated each mode as a quantized harmonic oscillator. The Debye cutoff frequency D should be
3
1
26
V
NvsD
(13.31)
which was also shown in Figure 13.2. The phonon density of states (DOS) per each branch is
obtained by taking derivative of Equation (13.30) with respect to as
𝑔𝑝ℎ(𝜔) =𝑑𝑁(𝜔)
𝑑𝜔=
𝑉𝜔2
2𝜋2𝑣𝑠3 (13.32)
Substituting Equation (13.31) into Equation (13.32), the phonon density of states is expressed by

13-13
3
23
D
ph
Ng
(13.33)
which is a functional distribution of spectrum. Substituting Equations (13.25) and (13.33) into
(13.27), the internal energy U is expressed as
d
N
eU
DpTk
D
B
3
2
0
3
1
(13.34)
where p is the index of phonon branches (modes). The thermodynamic definition of specific heat
is
V
VdT
dU
Vdc
1
(13.35)
where d is the density and, assuming p to be 3 for bulk materials (Debye model), the specific heat
is then
de
e
Tkk
Vd
Nc
DTk
Tk
B
BV
D
B
B
3
2
0
2
2
3
13
(13.36)
The phonon density of states per branch per mode is expressed as
3
2
,
3
D
brphg
(13.37)
which was compared with experiment by Rauh (1981) [2]. The region of lower frequencies in the
experimental curve of Figure 13.7 shows the mixture of acoustical and optical branches
significantly contribute to the phonon density of states resulting in underestimate of the Debye
model, which is shown in Figure 13.6 as expected. The region of higher frequencies in the
experimental curve shows overestimate of the Debye model. Interestingly the integrated density

13-14
of states of the simple Debye model approximately matches that of the experimental density of
states.
Figure 13.7 Phonon density of states versus frequency for Bi2Te3 [3].The Debye model is
compared with experiment by Rauh (1981)[2].
Debye Temperature
The Debye temperature D is defined as
B
DD
k
(13.38)
Equivalently,
TkT B
DD
(13.39)
Specific Heat

13-15
From Equation (13.36), the specific heat Vc is finally obtained by
dx
e
exTk
Vd
Nc
T
x
x
D
BV
D
0
2
43
19
(13.40)
where
Tkx
B
(13.41)
Equation (13.40) is well known the Debye formula which is widely used in the literature.
The velocity of Sound and Atomic Size
The velocity of sound is estimated using Equations (13.31) and (13.38) as
DB
sV
Nkv
3
1
26
(13.42)
N/V can be approximately obtained assuming a cubic structure. N is the number of primitive cells
and V is the crystal volume that is the product of N and volume 3 of the primitive cell as [4]
33
1
N
N
V
N
(13.43)
where is the atomic size. Note that the Debye model assumes one atom in a primitive unit cell,
in which is the lattice constant a. However, when a crystal has more than one atom ( an ) in a
primitive cell, 𝛿 is not the lattice constant. In that case, the volume of the atomic size 3 is
expressed by

13-16
an
a33
(13.44)
Hence, the velocity of sound in Equation (13.42) can be expressed by
DB
s
kv 3
126
(13.45)
where 3 is the volume of the primitive cell. When na = 1, we have that a = as Debye model
assumed. It is seen that the vibration modes are derived based on atoms rather than lattices. We
can also approximately calculate the size of the primitive cell (atomic size) for a binary
compound using the atomic masses and the mass densities by
3133 1 yy BA , 31
AAAA dNM and
31
BABB dNM
(13.46)
yMyMM BAAB 1 (13.47)
3A
ABAB
N
Md
(13.48)
where y is the fraction of component A, NA is the Avogadro’s number, BAM , are the atomic masses
of component A or B, ABM are the mean atomic masses of component A and B, and BAd , are the
mass densities of component A or B.

13-17
Example 13.1 Atomic Size and Specific Heat
PbTe (lead telluride) is a widespread thermoelectric material with the Debye temperature D of
136 K. (a) Estimate the atomic size of the PbTe, (b) determine the velocity of sound (phase
velocity) for the PbTe, and (c) determine the specific heat at room temperature.
Solution:
From Equation (13.46) with y = 0.5 for component Pb and the periodic tables in Appendices A-1
and A-5, the atomic size is
mcmg
gdNM PbAPbPb
10
3/1
323
311012.3
34.1110022.6
2.207
mcmg
gdNM TeATeTe
10
3/1
323
3110236.3
25.610022.6
6.127
3133 1 yy TePb = 3.179 × 10⁻⁸ cm = 3.179 Å
From Equation (13.45), the velocity of sound is
smmKJs
KJkv D
Bs /10452.110179.31366
210626.6
1038.16 3103
12
34
23
3
12
From Equation (13.47) and (13.48), the mean atomic mass and density of PbTe can be calculated
gggyMyMM TePbPbTe 4.1675.016.1275.02.2071
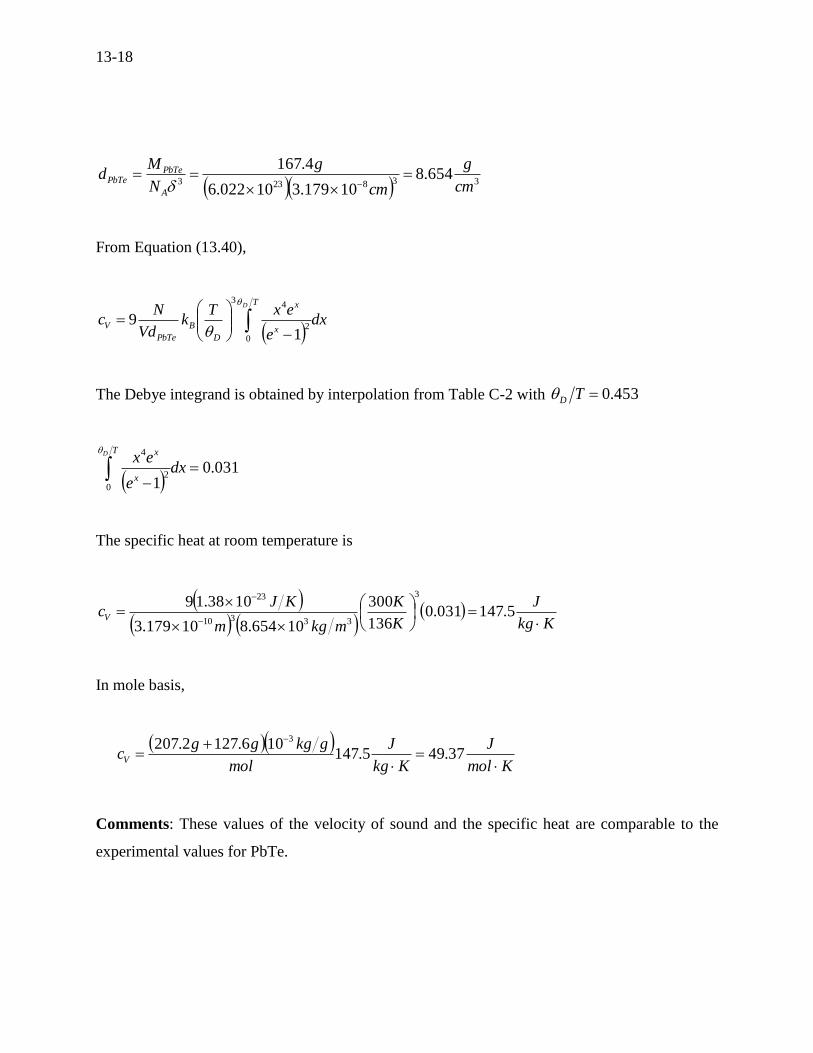
13-18
338233654.8
10179.310022.6
4.167
cm
g
cm
g
N
Md
A
PbTePbTe
From Equation (13.40),
dx
e
exTk
Vd
Nc
T
x
x
D
B
PbTe
V
D
0
2
43
19
The Debye integrand is obtained by interpolation from Table C-2 with 453.0TD
031.0
10
2
4
dxe
exT
x
xD
The specific heat at room temperature is
Kkg
J
K
K
mkgm
KJcV
5.147031.0136
300
10654.810179.3
1038.193
33310
23
In mole basis,
Kmol
J
Kkg
J
mol
gkgggcV
37.495.147106.1272.207 3
Comments: These values of the velocity of sound and the specific heat are comparable to the
experimental values for PbTe.

13-19
The calculated temperature-dependent specific heat for Mg2Si is plotted along with the
measurements by Gerstein (1967)[5] in Figure 13.8.
Figure 13.8 Specific heat of Mg2Si [3]. The marks are the measurements by Gerstein (1967) [5]
and the solid line is the calculation by Equation (13.40) using the Debye temperature of 417 K.
Dulong-Petit Law
Equation (13.34) with three branches in a three-dimensional crystal can be expressed as
dx
e
x
xTNkU
x
xB
0
3
3 1
33
(13.49)
where T
x D
When the temperature is much higher than the Debye temperature ( 1 Tx D ), the bracket
may be expanded as

13-20
13
....!430
1
!26
1
21
3
1
3
1
3
0
2
3
0
422
3
0
2
3
0
3
3
dxxx
dxxxx
xx
dxe
xx
xdx
e
x
x
xx
x
x
x
x
(13.50)
Then, the internal energy U becomes
TNkU B3 (13.51)
Since V
VdT
dU
Vdc
1 from Equation (13.35), the specific heat at high temperatures is
BV kVd
Nc 3
(13.52)
Here we have the famous classical Dulong-Petit law, showing that the atomic heat of all solids
tends to the same value at high temperatures. The specific heat due to the lattice vibrations is just
3 kB per atom.
Debye T3 Law
When the temperature is much lower than the Debye temperature ( 1 Tx D ), one can derive
3TcV (13.53)
This is known the Debye T3 law which is experimentally observed in Figure 13.8 at very low
temperatures.

13-21
13.3 Lattice Thermal Conductivity
13.3.1 Klemens-Callaway Model
The heat current density (heat flux) is given by
x
TkTkq lll
(13.54)
A temperature gradient causes thermal non-equilibrium. The heat current density is the product of
the energy of lattice vibrations and the group velocity as
𝑞𝑙 =∑∑𝐸(𝜔)𝑣𝑥𝑘𝑝
(13.55)
Where p is the index of phonon branches, k the wavevector, and xv the one-dimensional energy
transport velocity of the phonons (group velocity). Using Equation (13.25), the heat current density
lq is
𝑞𝑙 =∑∑ℏ𝜔𝑓𝑝ℎ(𝜔)𝑣𝑥𝑘𝑝
(13.56)
This means that the heat current density lq is the product of three terms: the energy of phonon
, the nonequilibrium (disturbed) phonon distribution number phf , and the group velocity
xv . The phonon distribution number departs from equilibrium in the presence of a temperature
gradient, and in the absence of any interactions it would vary with time at any point in the crystal.
In order to obtain phf , the Boltzmann transport equation is used as given in Equation (12.2).
coll
t
f
r
fr
k
fk
t
f
dt
df
(13.57)

13-22
Under the condition that external forces and electric field do not affect the vibrational motion of
the atoms in a crystal, k has a value of zero. Using the relaxation time approximation in Section
12.1, we have
x
T
T
fvf
ph
xcph
,0
(13.58)
where c is the combined relaxation time. Inserting this into Equation (13.56) gives
𝑞𝑙 = −∑∑ℏ𝜔𝜏𝑐𝑣𝑥2𝜕𝑓0,𝑝ℎ
𝜕𝑇
𝜕𝑇
𝜕𝑥𝑘𝑝
(13.59)
From Equation (13.54), the lattice thermal conductivity 𝑘𝑙 is expressed as
𝑘𝑙 =∑∑ℏ𝜔𝜏𝑐𝑣𝑥2𝜕𝑓0,𝑝ℎ
𝜕𝑇𝑘𝑝
(13.60)
For cubic and isotropic systems, the average velocity is 22 31 vvx . The lattice thermal
conductivity is
𝑘𝑙 =1
3∑∑ℏ𝜔𝜏𝑐𝑣
2𝜕𝑓0,𝑝ℎ
𝜕𝑇𝑘𝑝
(13.61)
This can be expressed in the form of integral using the phonon density of states as
𝑘𝑙 =1
3∑∫ ℏ𝜔𝜏𝑐𝑣
2𝜕𝑓0,𝑝ℎ
𝜕𝑇𝑔𝑝ℎ(𝜔)𝑑𝜔
𝜔𝐷
0𝑝
(13.62)
which, using Equation (13.32) per unit volume, leads to
13-23
𝑘𝑙 =1
3𝑘𝐵∑∫ 𝜏𝑐𝑣
2 (ℏ𝜔
𝑘𝐵𝑇)2 𝑒ℏ𝜔 𝑘𝐵𝑇⁄
(𝑒ℏ𝜔 𝑘𝐵𝑇⁄ − 1)2(
𝜔2
2𝜋2𝑣3)𝑑𝜔
𝜔𝐷
0𝑝
(13.63)
It is assumed that there are three acoustic branches, which are one longitudinal and two transverse
branches (p = 3). This assumption is later verified numerically by Esfarjani et al. (2011) [6]. Using
Equation (13.31), the lattice thermal conductivity finally gives
T
x
x
cBB
l
D
dxe
exTk
v
kk
0
2
43
212
(13.64)
where the phonon velocity v is very close to the velocity of sound vs and Tkx B . This is a
well-known Klemens-Callaway model of the lattice thermal conductivity. In the case that both
and v are independent of frequency , comparing Equation (13.36) for Vc , the lattice thermal
conductivity lk is expressed as
Vcl Cvk 2
3
1
(13.65)
where VC is the heat capacity (specific heat per volume), dcC VV . Using the mean free path
v ,
Vl Cvk 3
1
(13.66)
Although the above model is fairly crude, the expression for the lattice thermal conductivity is
actually a surprisingly good approximation. Very often, the above equation is used to estimate the
mean free path on the basis of experimental results for the other parameters in the equation.

13-24
Figure 13.9 Various mechanisms reducing the lattice thermal conductivity.
If the lattice vibrations are entirely the normal modes (N-processes) as shown in the specific heat,
a heat flow will transport without decaying or scattering, which implies that the lattice thermal
conductivity be infinite as harmonic oscillations. In fact, anharmonicity persists along with the N-
processes. The major mechanism of anharmonicity is called the Umklapp processes (U-processes)
which was discovered by Peierls (1929). The U-processes do not obey the conservation of
momentums while the N-processes do obey, causing the scattering of phonons. The U-processes
increase with increasing temperature.
From Equation (13.66), since the velocity of sound v is independent of temperature, the lattice
thermal conductivity lk depends on the mean free path and the heat capacity VC . At low
temperatures, the U-processes is reduced and the mean free path may reach several millimeters,
being comparable with the dimensions of specimens. The mean free path thus becomes constant
at the grain boundaries. Hence lk depends on VC that varies as T3 which is shown in Figure 13.9.

13-25
At high temperatures, VC is almost constant and T1 . Then the Umklapp processes
predominate lk so that Tkl 1 .
Phonon Relaxation Time
The scattering rate is the reciprocal of the relaxation time . The scattering may be caused by the
coexistence of different processes and a relaxation time can be defined for each process. The
combined relaxation time c can be calculated from individual relaxation time i according to
Matthiessen’s rule (1862),
i ic
11
(13.67)
The Matthiessen’s rule assumes that the scattering mechanisms are independent of each other
(Ashcroft and Mermin, 1976)[7].
13.3.2 Umklapp Processes
We consider three-phonon processes in a lattice. For example, when the sum of two wavevectors
is within the first Brillouin zone at low temperatures, it is the normal processes as shown in Figure
13.10 (a). At high temperatures it may be the case that the sum of the two wavevectors falls outside
of the zone as shown in Figure 13.10 (b). However, there is a rule that no wavevector must be so
large as to lie outside the first Brillouin zone. In other words, the phonon wavelength cannot be
smaller than the lattice constant. In such a case, the sum of the two wavevectors is forced to lie
inside the first Brillouin zone rather than falling outside the zone, using the reciprocal lattice vector
G and losing the conservation of momentum. This is the Umklapp process or anharmonicity. The
wavevectors can be written as

13-26
Gkkk 321 (13.68)
When the process is normal, G = 0. On the other hand, when the process is Umklapp
process, 0G .
(a) (b)
(c)
Figure 13.10 (a) Normal process 321 kkk , (b) Unacceptable process 321 kkk , and (c)
Umklapp process Gkkk 321 , where G is the reciprocal lattice vector.

13-27
13.3.3 Callaway Model
The normal processes are harmonic oscillations and cannot be expressed as the scattering or the
relaxation time. On the other hand, normal process cannot be ignored because they indirectly cause
the scattering. Callaway (1959)[8] suggested an expression based on the work of Debye (1912)[9]
and Klemens (1955)[10], which is widely used. The lattice thermal conductivity is given by
21 kkkl (13.69)
T
x
x
cB
s
B D
dxe
exTk
v
kk
/
0 2
43
21
12
(13.70)
T
x
x
U
c
U
T
x
x
U
c
B
s
B
D
D
dxe
ex
dxe
ex
Tk
v
kk
/
0 2
4
2
/
0 2
4
3
22
11
1
1
2
(13.71)
where is the ratio of the Umklapp processes to the N-processes, c and U are the combined
and Umklapp relaxation times, respectively. The second Callaway term 2k is large for a pure
crystal but decrease rapidly with addition of defects so that it is dominant over a wide temperature
range for the pure crystal but becomes almost negligible for an impure crystal [11]. Most doped
crystal compounds that have intrinsic defects are impure in fact, so that 1kkl .
13.3.4 Phonon Relaxation Times

13-28
Extensive studies have been made into phonon relaxation times, including normal-mode processes
(N-processes), Umklapp processes, point defect scattering, electron-phonon scattering, and
boundary scattering. We use here the expressions suggested by Steigmeier and Abeles (1964) [12].
Vining (1991) [13] and Minnich (2009) [14] also used those scattering expressions.
Scattering by N-Processes and Umklapp Processes
The Umklapp processes are three-phonon scattering involving anharmonicity. The N-processes do
not directly cause the scattering but help the Umklapp processes contribute to the scattering.
Therefore, they can be expressed in terms of the relaxation time in 1k even when 2k is neglected
in Equation (13.70). The Umklapp scattering rate is the inverse of the relaxation time, which was
first studied by Leibfried and Schlömann (1954).[15] Later, a modified expression including the
effect of the N-processes was given by [12, 13, 16]
2
3
2
231
21
1
9
51
4
6
3
20x
T
MN
DAB
AU
(13.72)
where AN is Avogadro’s number, the Grüneisen anharmonicity parameter, ABM the atomic
mass of compounds A and B, the mean atomic size (see Equation (13.46)), and Tkx B .
The N-process scattering rate is given by
11 UN
(13.73)
where 2 is often used for a good approximation.
Scattering by Point Defects

13-29
The point defects may include vacancies, isotopes, dislocations, substitute atoms, etc. A defect
with dimensions much smaller than the phonon wavelength can be considered as a point defect
[11]. The scattering is then caused by the difference in mass and the difference in bonding between
the atoms.[11] The scattering rate for point defects is given by Klemens (1960)[17], which is
3
4
4
01
4 s
B
PDv
xTk
V
(13.74)
where 0V is the atomic volume (3 ) and the mass-fluctuation-scattering parameter for a binary
compound is given by[12]
22
1
s
ABM
Myy
(13.75)
BA MMM , )1( yMyMM BAAB , and BA (13.76)
where y is the fraction of component A, the atomic size (see Equation (13.46)) and s the
strain parameter [12].
Electron-Phonon Scattering
The scattering of phonons by electrons will be active when the band degeneracy temperature is
comparable with the temperature of the lattice [18]. Ziman (1956) derived an expression for
electron-phonon scattering, which is

13-30
216
216
4
3
,
2
1
,
,
2
,
2
1
1ln
4 x
E
xEE
x
E
xEE
rc
sida
iEP
ircFrc
ircFrc
e
ex
dE
vm
(13.77)
where a is the acoustic deformation potential, TkvmE Bsidirc 22
,,
and Tkx B .
Boundary Scattering
The phonon-boundary scattering rate is assumed independent of temperature and frequency. The
boundary scattering rate with an assumption of purely diffuse scattering is given by[4]
L
vsB 1
(13.78)
where L is the effective length of the sample. The total scattering time can be approximated by
adding the scattering rates in accordance with Matthiessen’s rule in Equation (13.67),
BEPPDUNc
111111
(13.79)
In order to visualize the individual effect of the phonon scattering mechanisms, the
weighted phonon relaxation times of 24 1 xx eex is plotted in Figure 13.11 for
PbTe. It is seen that the Umklapp processes dominates the phonon relaxation time at
low frequencies and the point defects become dominant at high frequencies. The
electron-phonon scattering has a minimal effect on the relaxation time.

13-31
Figure 13.11 Weighted phonon relaxation time versus frequency for PbTe [3].
Since we have developed the expressions for the different relaxation times, we can calculate the
lattice thermal conductivity versus temperature using of Equation (13.64) along with the
electronic thermal conductivity as shown in Figure 13.12 for PbTe. It is seen that the lattice and
electronic contributions to the combined thermal conductivity are almost equal. The total
(combined) thermal conductivity shows a good agreement with the experimental data by Pei at
al. (2012)[19].

13-32
Figure 13.12 The electronic, lattice, and combined thermal conductivities versus temperature for
PbTe. The electron doping concentration of 1.8 × 1019 cm-3 was used [3].
Example 13.2 Lattice Thermal Conductivity
PbTe (lead telluride) is a widespread thermoelectric material with Debye temperature D 136 K.
Assuming that the Umklapp processes are the dominant scattering mechanism for PbTe, (a)
determine the Debye cutoff frequency f, not angular frequency ( fD 2 ), (b) determine the
lattice thermal conductivity using the Grüneisen parameter = 1.5 at room temperature, and (c)
estimate the phonon mean free path assuming the Dulong-Petit law for the heat capacity.
Solution:
From Equation (13.46) with y = 0.5 and the periodic tables in Appendices A-1 and A-5, the atomic
size is estimated as shown Example 13.1,
mcmg
gdNM PbAPbPb
10
3/1
323
311012.3
34.1110022.6
2.207
mcmg
gdNM TeATeTe
10
3/1
323
3110236.3
25.610022.6
6.127
3133 1 yy TePb = 3.179 × 10⁻⁸ cm = 3.179 Å
From Equation (13.45), the velocity of sound is
smmKJs
KJkv D
Bs /10452.110179.31366
210626.6
1038.16 3103
12
34
23
3
12

13-33
From Equation (13.38), since fD 2 , the Debye cutoff frequency is
1121084.22
sk
f DBD
=2.84 THz
From Equation (13.76), the mean atomic mass is
gyMyMM TePbPbTe 4.167)1(
From Equation (13.72), using = 2, the Umklapp relaxation time that is here the combined one as
1
2
3
2
231
2
1
9
51
4
6
3
20
x
T
MNx
DPbTePbTe
AU
From Equation (13.64), the lattice thermal conductivity is
T
x
x
UB
s
Bl
D
dxe
exx
Tk
v
kk
0
2
43
212
The equation can be rewritten as
T
x
x
DPbTePbTe
AB
s
Bl
D
dxe
exx
T
MN
Tk
v
kk
0
2
42
1
3
2
231
23
211
9
51
4
6
3
20
2

13-34
The Debye integral with 453.0TD can be obtained by interpolation from Table F-2.
450.0
10
2
2
T
x
xD
dxe
ex
The lattice thermal conductivity is finally obtained as
mK
Wkl 0.4
Since KTKD 300136 , the heat capacity of the Dulong-Petit law from Equation (13.52)
can be used as
Km
Jkk
V
NC B
BV 3
6
310289.1
33
From Equation (13.66), the phonon mean free path is
nmmCv
k
Vs
l 4.6104.63 9
Comments: The value of 4.0 W/mK for the lattice thermal conductivity seems high compared to
the experimental value of about 1.3 W/mK in Figure 13.12. This value may be improved if we use
the Matthiessen’s rule with all the phonon scattering mechanisms.
Problems
13.1. Derive Equation (13.12).

13-35
13.2. Derive Equations (13.22) and (13.23) with a brief explanation.
13.3. Derive Equation (13.40).
13.4. Estimate the atomic size for a faced centered cubic structure of Mg2Si using both
methods: a) lattice constant = 6.338 Å, and (b) atomic masses and mass densities for the
binary compound (y = 0.33).
13.5. Plot the theoretical phonon density of states versus frequency as shown Figure 13.7 for
Bi2Te3 with the Debye temperature D of 165 K and the fraction of components and the
mass densities.
13.6. Mg2Si (magnesium silicide) is a widespread thermoelectric material with the Debye
temperature D of 417 K. (a) Estimate the atomic size, (b) determine the velocity of sound
(phase velocity), and (c) determine the specific heat for Mg2Si.
13.7. Provide the theoretical curve for the specific heat of Mg2Si with the Debye temperature D
of 417 K as shown in Figure 13.8.
13.8. Derive the equation for the classical Dulong-Petit law.
13.9. Derive Equation (13.64) and (13.66).
13.10. Mg2Si (magnesium silicide) is a widespread thermoelectric material with the Debye
temperature D of 417 K. Assuming that the Umklapp processes are a dominant scattering
mechanism, (a) determine the Debye cutoff frequency f, not angular frequency ( fD 2 ),
(b) determine the lattice thermal conductivity using Grüneisen parameter = 1.67 at room

13-36
temperature, and (c) estimate the phonon mean free path assuming the Dulong-Petit law
for the heat capacity.
References
1. Zhang, Y., et al., Thermodynamic properties of PbTe, PbSe, and PbS: First-principles
study. Physical Review B, 2009. 80(2).
2. Rauh, H., et al., Generalised phonon density of states of the layer compounds Bi2Se3
Bi2Te3 Sb2Te3 and Bi2(Te05Se05)3. J. Phys. C: Solid State Phys., 1981. 14: p. 2705-2712.
3. Lee, H., A Theoretical Model of Thermoelectric Transport Properties for Electrons and
Phonons. Journal of Electronic Materials, 2016. 45(2): p. 1115-1141.
4. Ziman, J.M., Electrons and phonons. 1960, London: Oxford University Press.
5. Gerstein, B.C., Thermal Study of Groups II—IV Semiconductors. Lattice Heat Capacities
and Free Energies of Formation. Heat Capacity of Mg2Si from 15°—300°K. The Journal
of Chemical Physics, 1967. 47(6): p. 2109.
6. Esfarjani, K., G. Chen, and H.T. Stokes, Heat transport in silicon from first-principles
calculations. Physical Review B, 2011. 84(8).
7. Ashcroft, N.W. and N.D. Mermin, Solid state physics. 1976, New York: Holt, Rinehart and
Winston.
8. Callaway, J., Model for Lattice Thermal Conductivity at Low Temperatures. Physical
Review, 1959. 113(4): p. 1046-1051.
9. Debye, P., The theory of specific heats. Ann. Phys. Lpz. (4), 1912. 39: p. 798.
10. Klemens, P.G., The scattering of low-frequency lattice wavesby static imperfections. Proc.
Phys. Soc., 1955. 68(12): p. 1113-1128.
11. Berman, R., Thermal conduction in solids. 1976, Oxford: Clarendon Press.
12. Steigmeier, E. and B. Abeles, Scattering of Phonons by Electrons in Germanium-Silicon
Alloys. Physical Review, 1964. 136(4A): p. A1149-A1155.
13. Vining, C.B., A model for the high-temperature transport properties of heavily doped n-
type silicon-germanium alloys. Journal of Applied Physics, 1991. 69(1): p. 331.
14. Minnich, A., et al., Modeling study of thermoelectric SiGe nanocomposites. Physical
Review B, 2009. 80(15).
15. Leibfried, G. and E. Schlomann, Warmeleitung in elektrisch isolierenden Kristallen.
Nachrichten der Akademie der Wissenschaften in Gottingen, lia, Mathematisch-
Physikalische Klasse, 1954: p. 71-93.
16. Klemens, P.G., Thermal conductivity and lattice vibrational modes. Solid StatePhysics
Chapter 7. 1958, New York: Academic Press Inc.
17. Klemens, P., Thermal Resistance due to Point Defects at High Temperatures. Physical
Review, 1960. 119(2): p. 507-509.

13-37
18. Ziman, J.M., The effect of free electrons in lattice conduction. The Philosophical Magazine,
1956. 1(2): p. 191-198.
19. Pei, Y., et al., Low effective mass leading to high thermoelectric performance. Energy &
Environmental Science, 2012. 5(7): p. 7963.