Chapter 13: Government Spending, Taxing, and National Debt.
21
Chapter 13: Government Spending, Taxing, and National Debt
-
date post
21-Dec-2015 -
Category
Documents
-
view
218 -
download
1
Transcript of Chapter 13: Government Spending, Taxing, and National Debt.
Chapter 13: Government Spending, Taxing, and National Debt
Chapter 13: Government Spending, Taxing, and National Debt
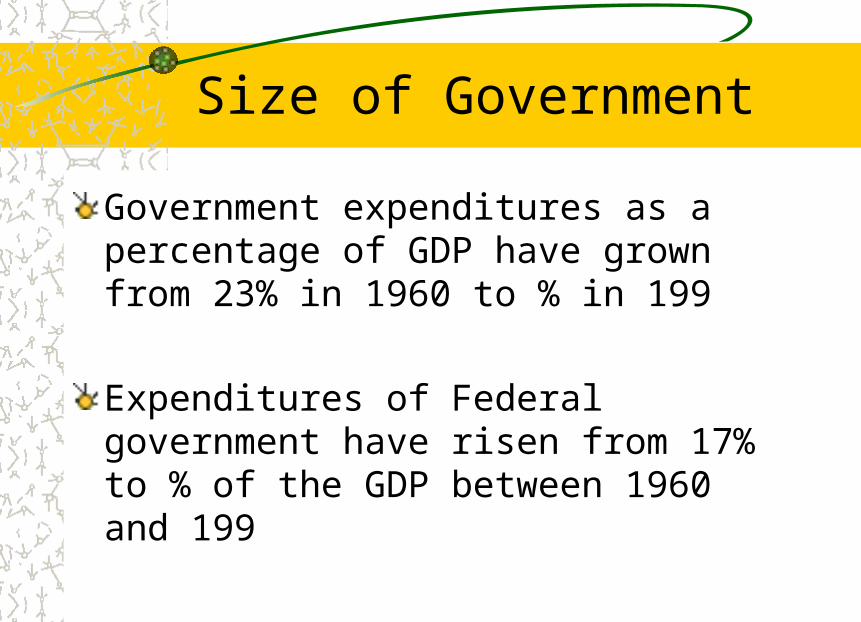
Size of Government
Government expenditures as a percentage of GDP have grown from 23% in 1960 to % in 199
Expenditures of Federal government have risen from 17% to % of the GDP between 1960 and 199
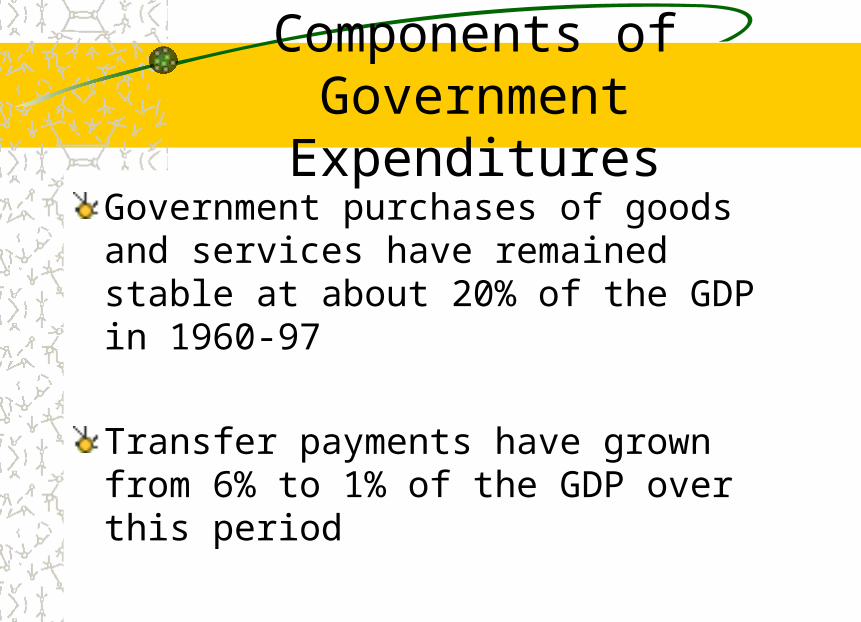
Components of Government Expenditures
Government purchases of goods and services have remained stable at about 20% of the GDP in 1960-97
Transfer payments have grown from 6% to 1% of the GDP over this period
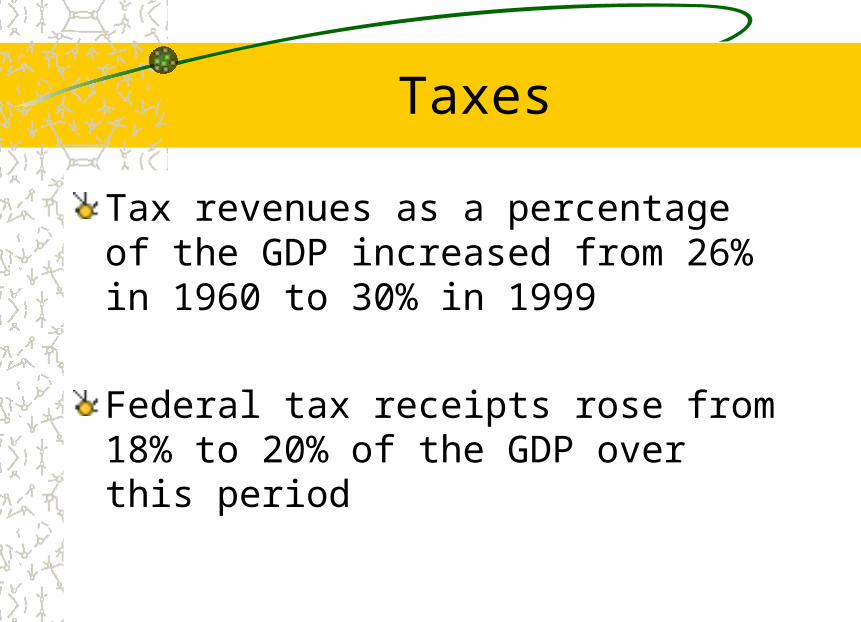
Taxes
Tax revenues as a percentage of the GDP increased from 26% in 1960 to 30% in 1999
Federal tax receipts rose from 18% to 20% of the GDP over this period
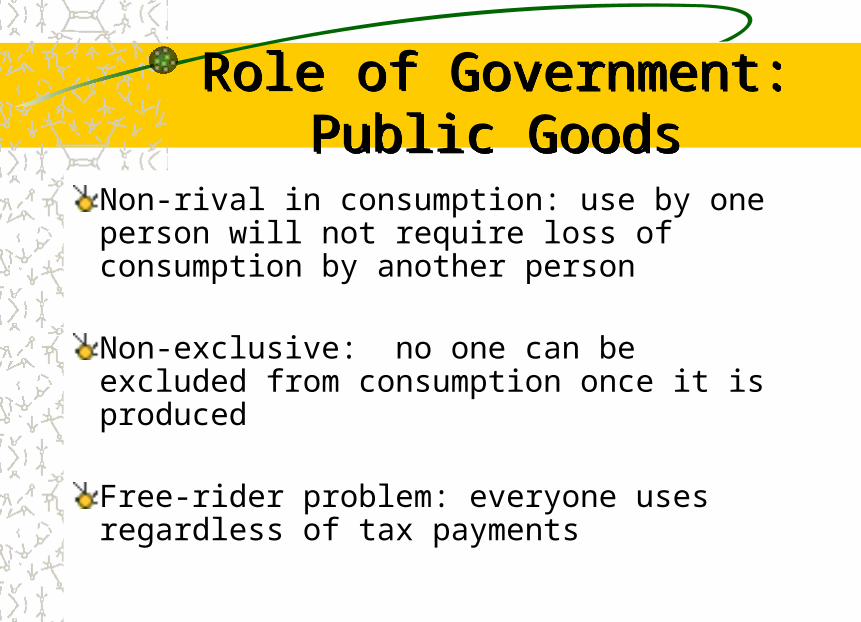
Role of Government: Public GoodsRole of Government: Public Goods
Non-rival in consumption: use by one person will not require loss of consumption by another person
Non-exclusive: no one can be excluded from consumption once it is produced
Free-rider problem: everyone uses regardless of tax payments
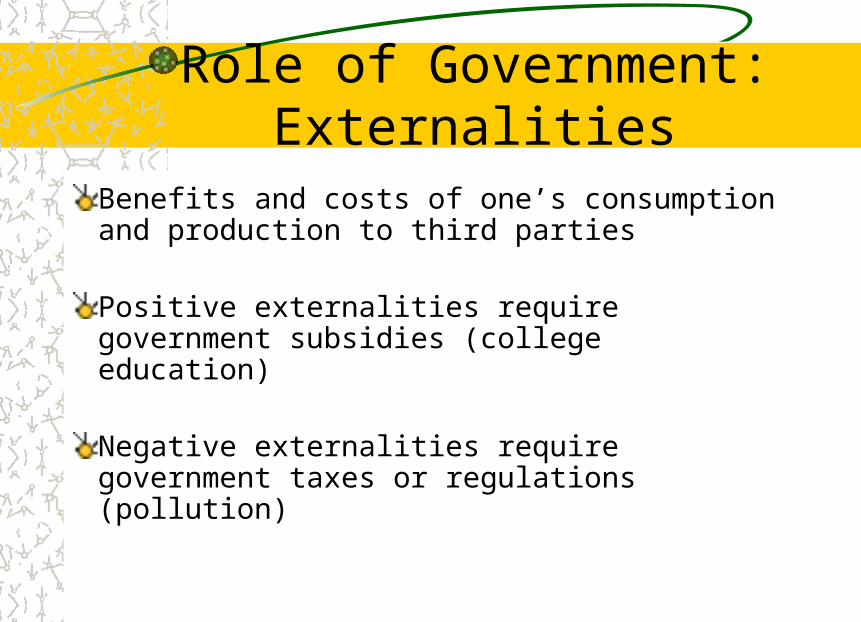
Role of Government: Externalities
Benefits and costs of one’s consumption and production to third parties
Positive externalities require government subsidies (college education)
Negative externalities require government taxes or regulations (pollution)

Positive Externalities: MSB>MPB
Price
Quantity
MPB
P
P’
Q Q’
A
MSB
B
MPC=MSC
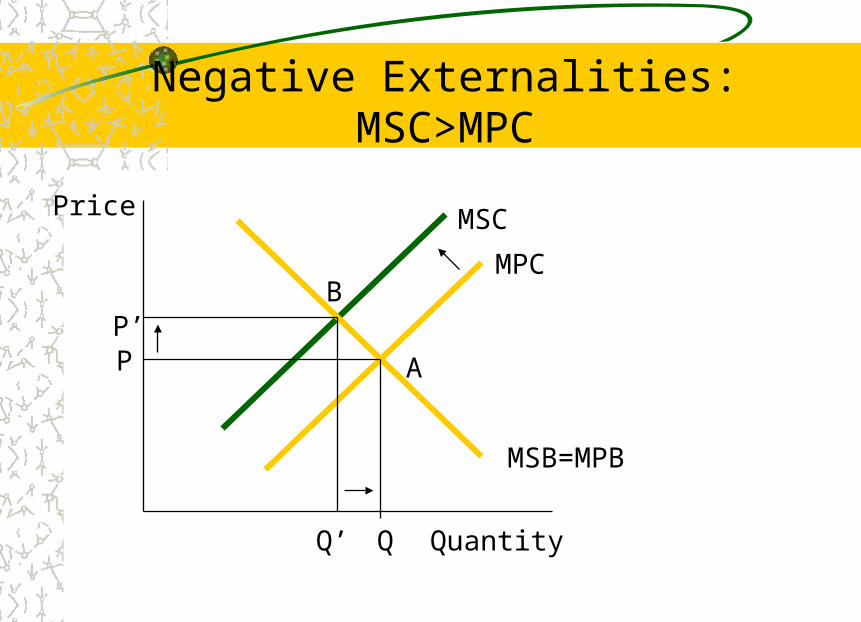
Negative Externalities: MSC>MPC
Price
Quantity
MSC
PP’
Q’ Q
MPCB
A
MSB=MPB
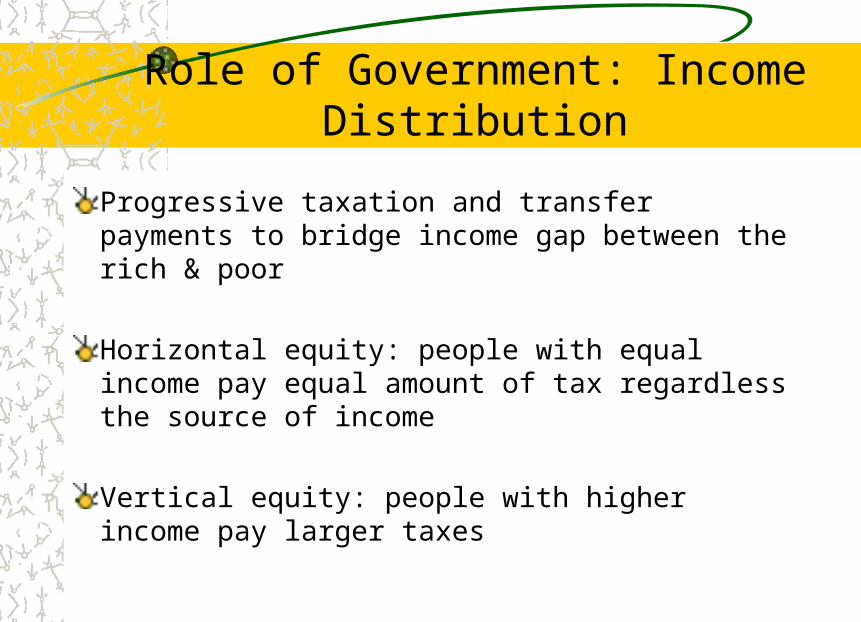
Role of Government: Income Distribution
Progressive taxation and transfer payments to bridge income gap between the rich & poor
Horizontal equity: people with equal income pay equal amount of tax regardless the source of income
Vertical equity: people with higher income pay larger taxes
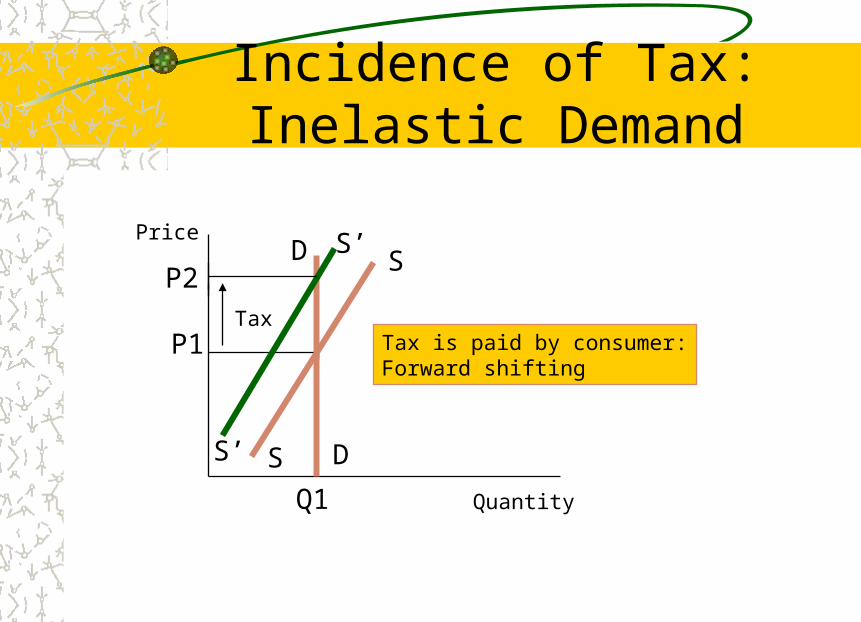
Incidence of Tax: Inelastic Demand
Quantity
Price
P1
Q1
D
D
S
S
P2S’
S’
Tax is paid by consumer:Forward shifting
Tax
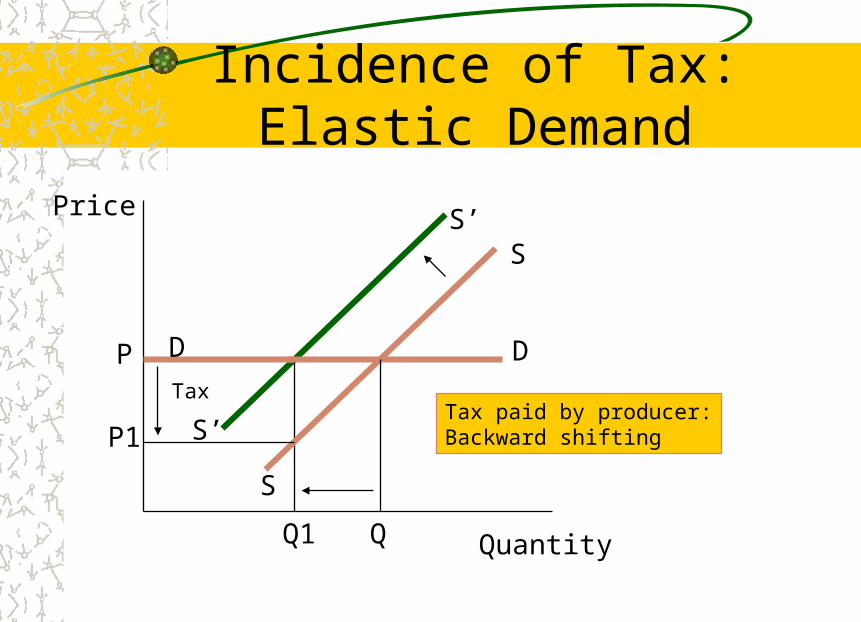
Incidence of Tax: Elastic Demand
Price
Quantity
S’
S’
P
Q1
DD
S
S
Q
P1
TaxTax paid by producer:Backward shifting
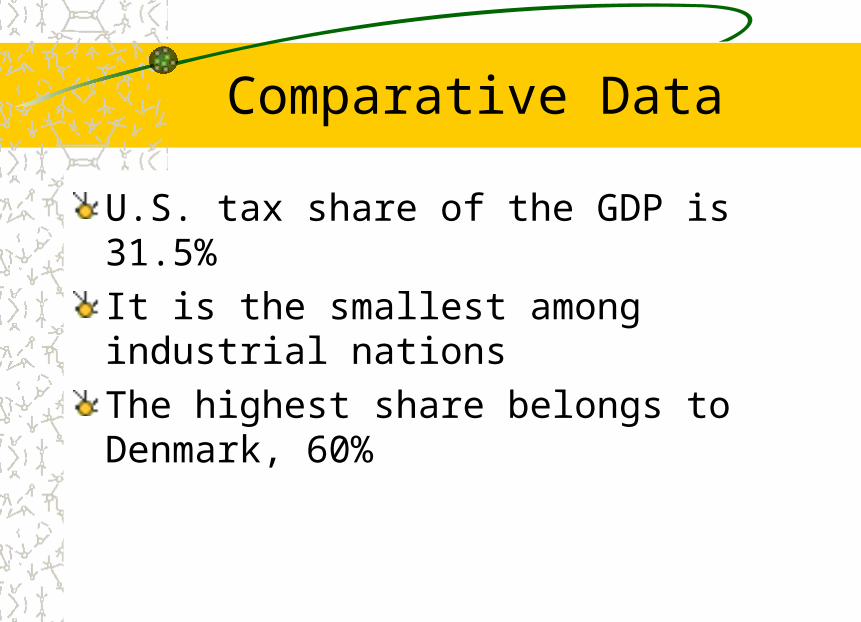
Comparative Data
U.S. tax share of the GDP is 31.5%It is the smallest among industrial nationsThe highest share belongs to Denmark, 60%
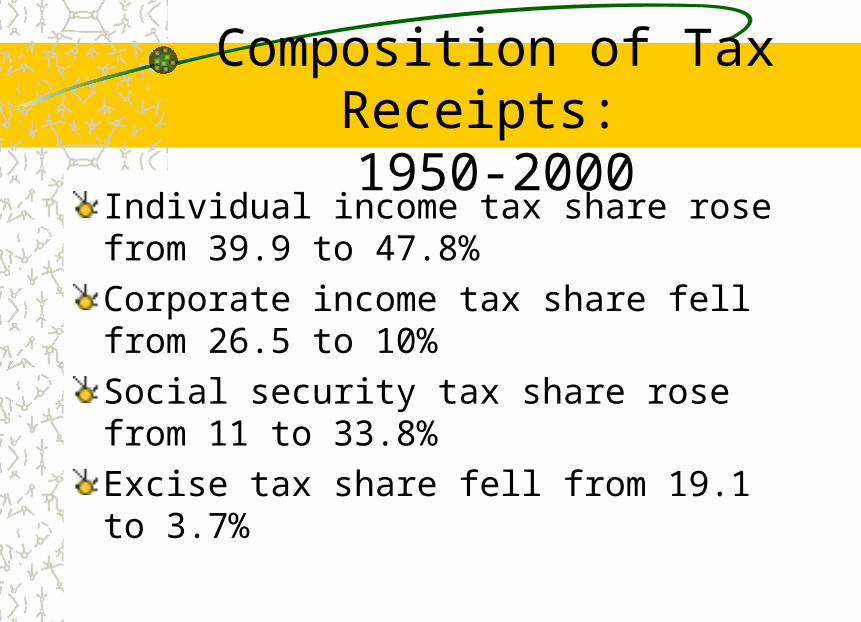
Composition of Tax Receipts: 1950-2000
Individual income tax share rose from 39.9 to 47.8%Corporate income tax share fell from 26.5 to 10%Social security tax share rose from 11 to 33.8%Excise tax share fell from 19.1 to 3.7%
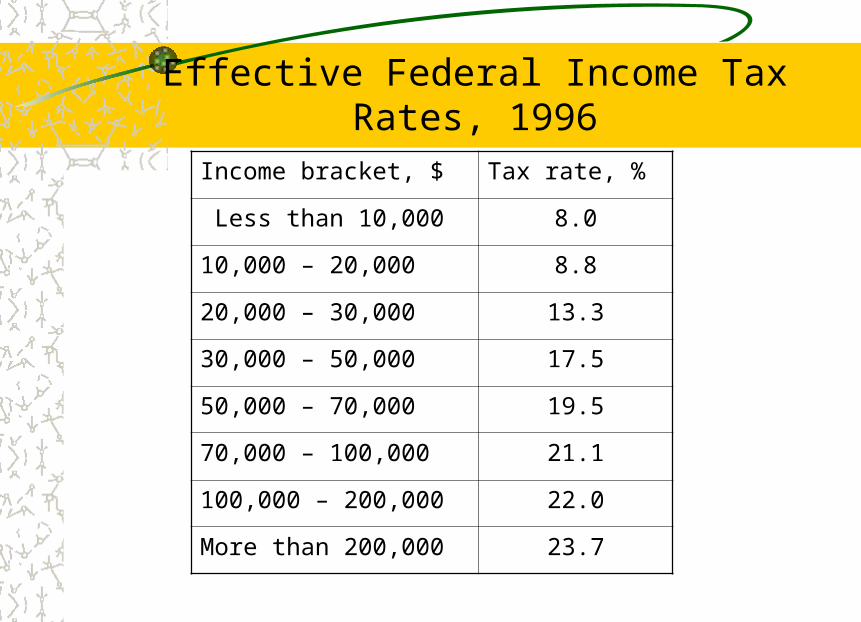
Effective Federal Income Tax Rates, 1996
Income bracket, $ Tax rate, %
Less than 10,000 8.0
10,000 – 20,000 8.8
20,000 – 30,000 13.3
30,000 – 50,000 17.5
50,000 – 70,000 19.5
70,000 – 100,000 21.1
100,000 – 200,000 22.0
More than 200,000 23.7
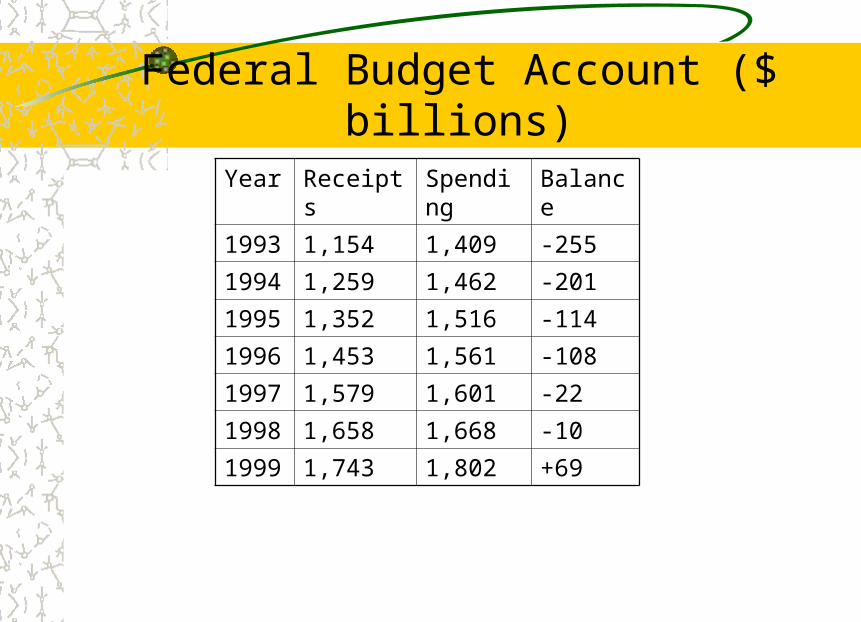
Federal Budget Account ($ billions)
Year Receipts Spending Balance
1993 1,154 1,409 -255
1994 1,259 1,462 -201
1995 1,352 1,516 -114
1996 1,453 1,561 -108
1997 1,579 1,601 -22
1998 1,658 1,668 -10
1999 1,743 1,802 +69
Public Debt
Government borrows money from investors through the issuance and sale of government securities or bonds
Investors hold the bonds for a certain time period to make interest income
Government Securities
Non-marketable securities– U.S. Savings Bonds & Notes: redeemable in cash for
the face value after maturity
Marketable securities– Treasury bills (< 1 year; low interest rate)– Treasury notes (1-5 years)– Treasury bonds (> 5 years, high interest rate)
National Debt
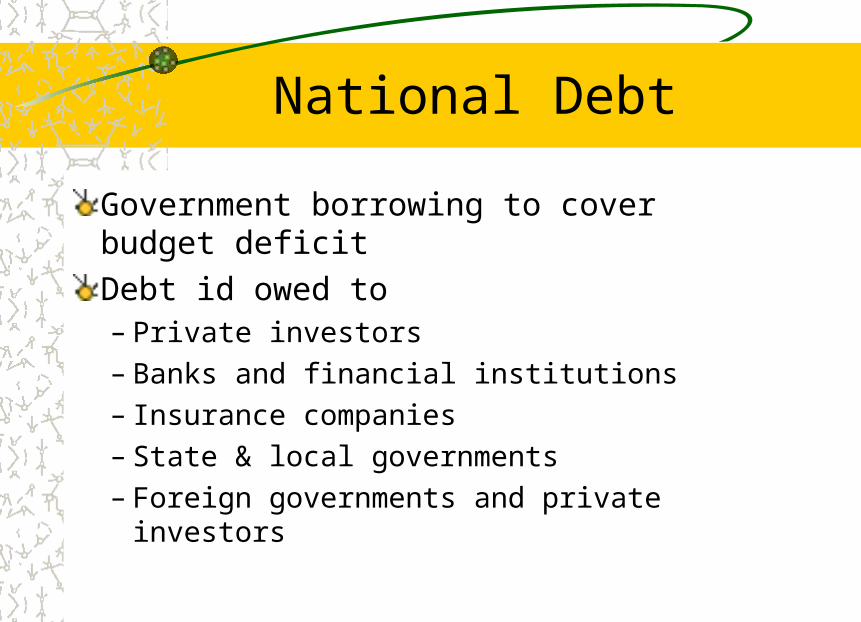
Government borrowing to cover budget deficitDebt id owed to – Private investors– Banks and financial institutions– Insurance companies– State & local governments– Foreign governments and private investors
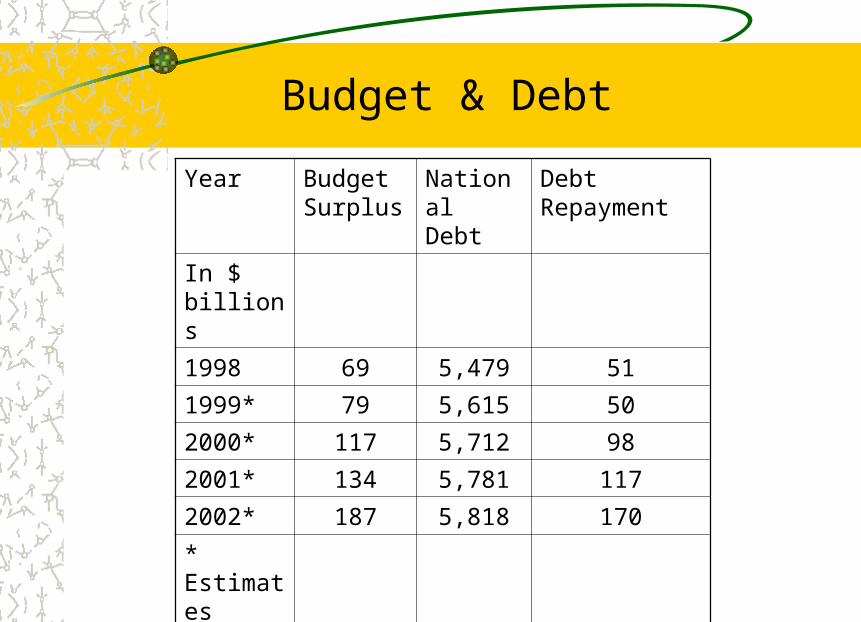
Budget & Debt
Year Budget Surplus
National Debt
Debt Repayment
In $ billions
1998 69 5,479 51
1999* 79 5,615 50
2000* 117 5,712 98
2001* 134 5,781 117
2002* 187 5,818 170
* Estimates
Economic Effects of Federal Debt
Primary burden: opportunity cost of servicing the debt in terms of reduced public investment
Inflationary effect: higher interest rates and prices
Economic Effects of Federal Debt
Income distribution effect: income transfer from government to high income investors
Output effect: higher taxes and opportunity cost of productive investment