Chapter 13 and 14 – Molecular Absorption Spectroscopy 13_14_molecular... · UV/Vis – excitation...
17
ICP-OES High temperatures, more complete atomization – emission. Multi-element analysis One set of conditions for all analyses Inert Ar atmosphere so fewer chemical interferences (metal oxide formation) Aersol mist, desolvation, atomization, excitation
-
Upload
nguyenkhanh -
Category
Documents
-
view
230 -
download
1
Transcript of Chapter 13 and 14 – Molecular Absorption Spectroscopy 13_14_molecular... · UV/Vis – excitation...

ICP-OES
High temperatures, more complete atomization – emission. Multi-element analysis One set of conditions for all analyses Inert Ar atmosphere so fewer chemical interferences (metal oxide formation)
Aersol mist, desolvation, atomization, excitation
Chapter 13 and 14 – Molecular Absorption Spectroscopy
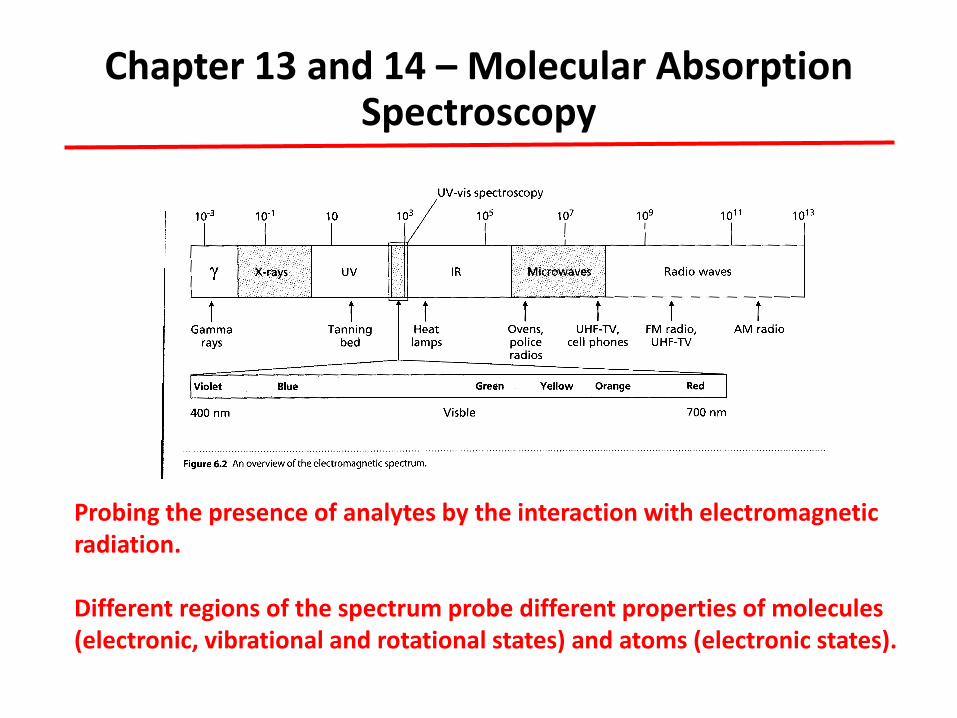
Probing the presence of analytes by the interaction with electromagnetic radiation.
Different regions of the spectrum probe different properties of molecules (electronic, vibrational and rotational states) and atoms (electronic states).
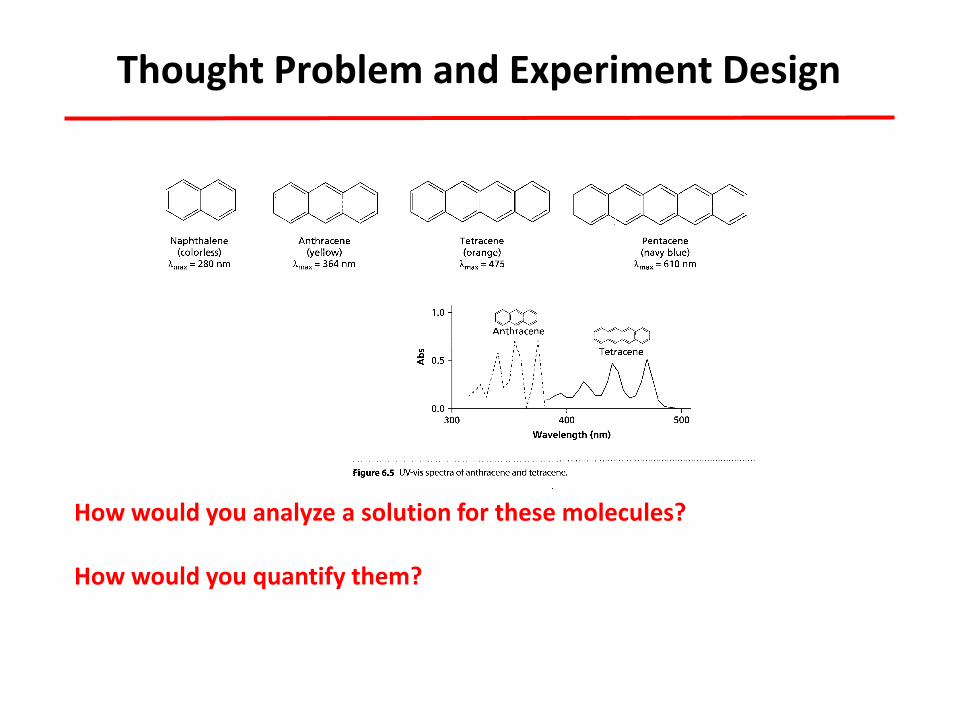
Thought Problem and Experiment Design
How would you analyze a solution for these molecules?
How would you quantify them?

Basic Instrument Design
What properties of the different components would be important?
What region of the electromagnetic spectrum is used for thesemeasurements?
What properties of molecules are probed? Qualitative andquantitative analysis?
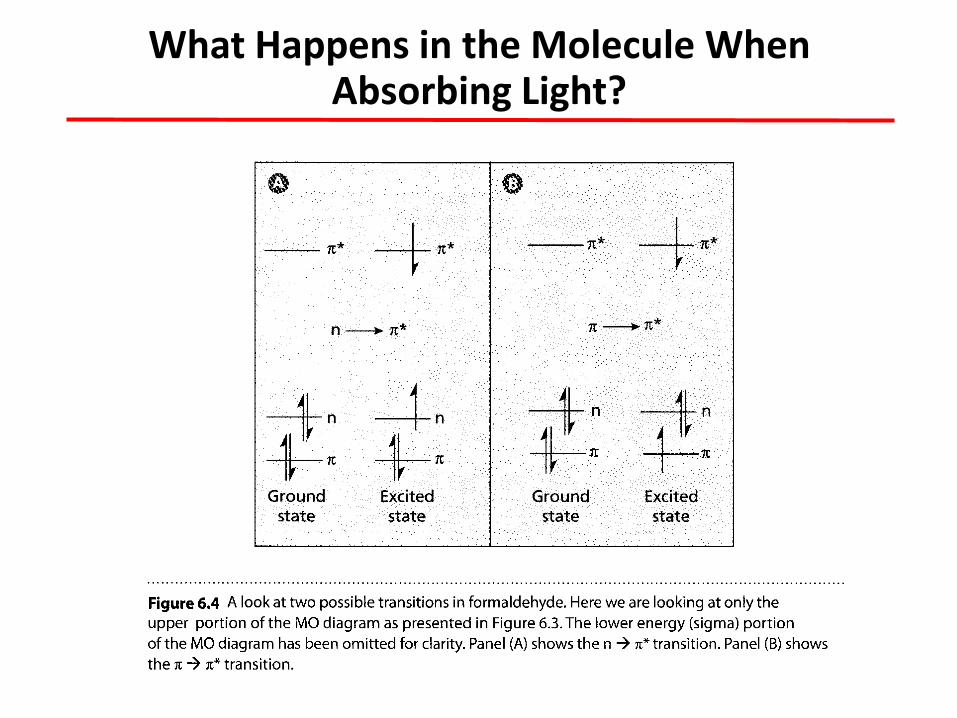
What Happens in the Molecule When Absorbing Light?

Absorbance Measurements in Gas vs. Absorbance Measurements in Gas vs. Liquid PhaseLiquid Phase
Absorption spectra for vapor Absorption spectra for vapor shows much fine structure shows much fine structure (e.g., numerous rotational and (e.g., numerous rotational and vibrationalvibrational states associated states associated with excited electronic state are with excited electronic state are visible.visible.
In condensed state, less In condensed state, less rotational freedom so rotational rotational freedom so rotational states not observed.states not observed.
When When chromophorechromophore is is surrounded by solvent surrounded by solvent molecules, energies of molecules, energies of vibrationalvibrational levels are modified levels are modified in a in a nonuniformnonuniform way . Energy of way . Energy of a given state appears as a a given state appears as a broad peak.broad peak.
Solvent matters!!!
Polar solvents tend to obliterate the fine structure.
As a rule, same solvent system should be used when comparing absorption spectra for identification purposes.

Absorbing SpeciesAbsorbing Species
Excitation event (10-9 s)M + hυ M*
Relaxation eventM* M + heat or light
non-bonding
σ
π
n
π*
σ*
bonding
bonding
anti-bonding
anti-bondingUV/Vis – excitation of
bonding electrons!
Can be used for quantitative purposes and for functional group (type of bonding) information.
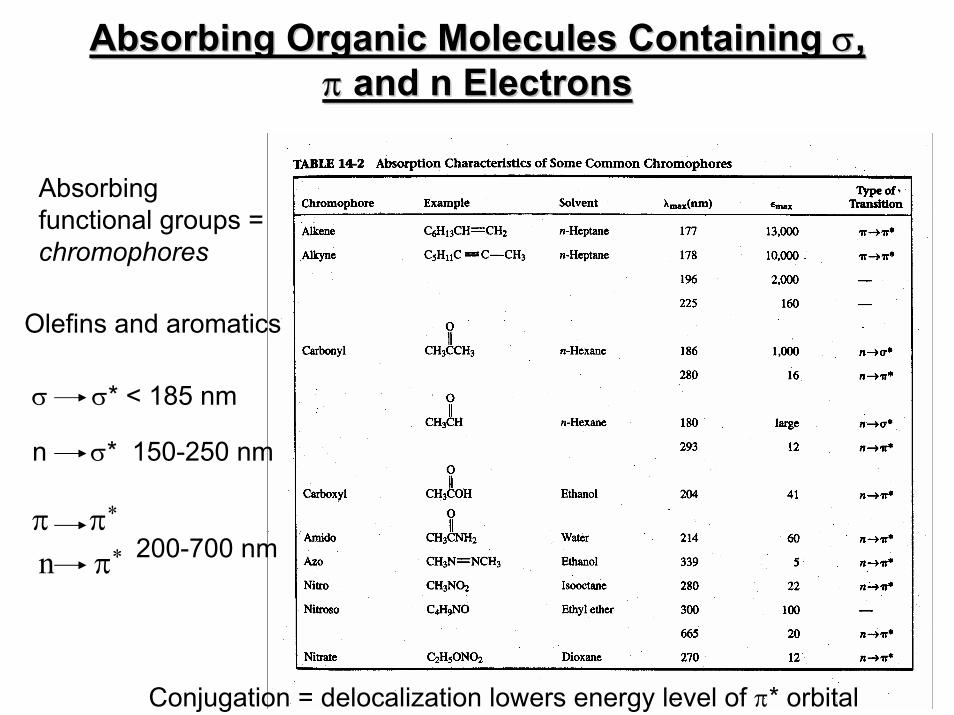
Absorbing Organic Molecules Containing Absorbing Organic Molecules Containing σσ, , ππ and n Electronsand n Electrons
σ σ* < 185 nm
Olefins and aromatics
n σ* 150-250 nm
π π*
n π* 200-700 nm
Conjugation = delocalization lowers energy level of π* orbital
Absorbing functional groups = chromophores

Quantitative Aspects of Absorbance

Deviations from Beer’s Law Relationship
High concentrations!
𝐴 λ = 𝜀 λ 𝑏𝐶
ε = 8.7 x 10¹⁹ P A P = probability of electronic transition (0-1)A = capture cross section area (10-15 cm2)
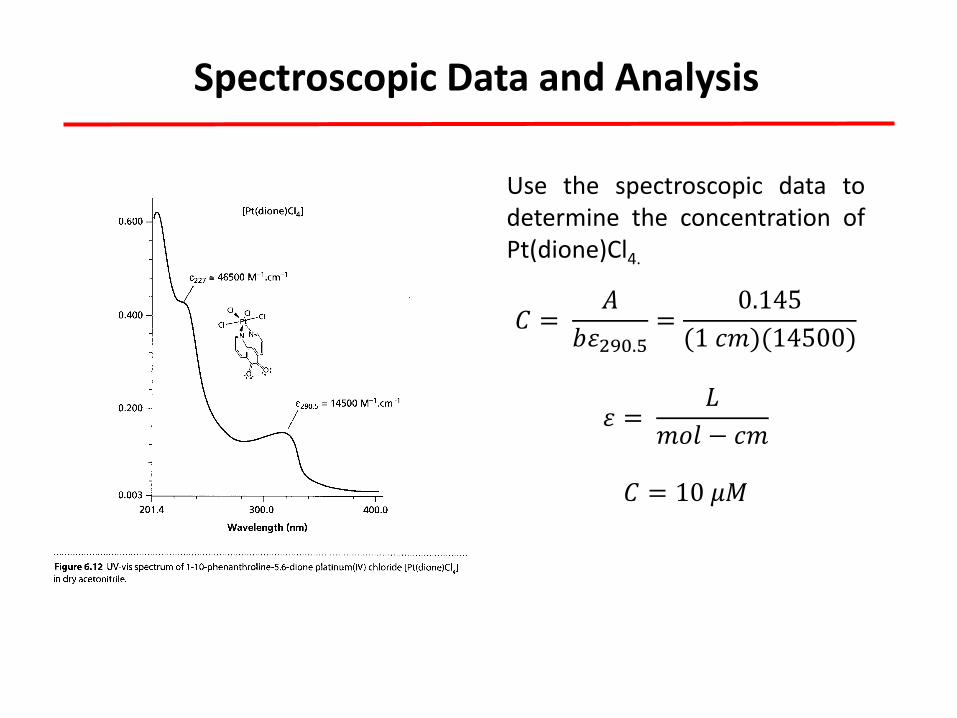
Spectroscopic Data and Analysis
Use the spectroscopic data todetermine the concentration ofPt(dione)Cl4.
𝐶 =𝐴
𝑏𝜀290.5=
0.145
(1 𝑐𝑚)(14500)
𝜀 =𝐿
𝑚𝑜𝑙 − 𝑐𝑚
𝐶 = 10 𝜇𝑀

Conc (nM) Signal Mean Std Dev. Conc (nM) Mean Std Dev.
0.00 10.00 9.75 9.25 9.67 0.312 0.00 9.67 0.31
3.00 20.00 21.32 19.15 20.16 0.893 3.00 20.16 0.89
5.00 30.00 32.3 28.75 30.35 1.470 5.00 30.35 1.47
7.00 40.00 39.65 38.26 39.30 0.751 7.00 39.30 0.75
9.00 50.00 47.55 49.5 49.02 1.057 9.00 49.02 1.06
11.00 60.00 61.35 58.75 60.03 1.062 11.00 60.03 1.06
Ymin 10.60 Ymin = Yblank + 3*s Yblank = mean
Ymin 12.78 Ymin = Yblank + 10*s
Cmin 0.20 S/N=3 Cmin = (Ymin-Yblank)/m
Cmin 0.68 S/N=10 Cmin = (Ymin-Yblank)/m
m = 4.61 7.88 b =
sm = 0.17 1.14 sb =
R2= 0.99 1.49 sy =
y = 4.6077x + 7.8763R² = 0.9949
0.00
10.00
20.00
30.00
40.00
50.00
60.00
70.00
0.00 2.00 4.00 6.00 8.00 10.00 12.00
Sign
al
Concentration (nM)

Single Beam Spectrometer
Smaller footprint and simpler design – low cost Slow and time consuming – sequential analyte and background scans Subject to 1/f (flicker noise) – long time, low frequency measurement
Monochromator before sample. Reduces sample heating from full power light.
𝐴 = −𝑙𝑜𝑔𝑃
𝑃0= 𝑙𝑜𝑔
𝑃𝑜𝑃
Light loss mechanisms: reflection., refraction, scattering, diffraction

Dual Beam Spectrometer
More complicated footprint and more optical components Less time consuming measurements (analyte and background together) Less subject to drift
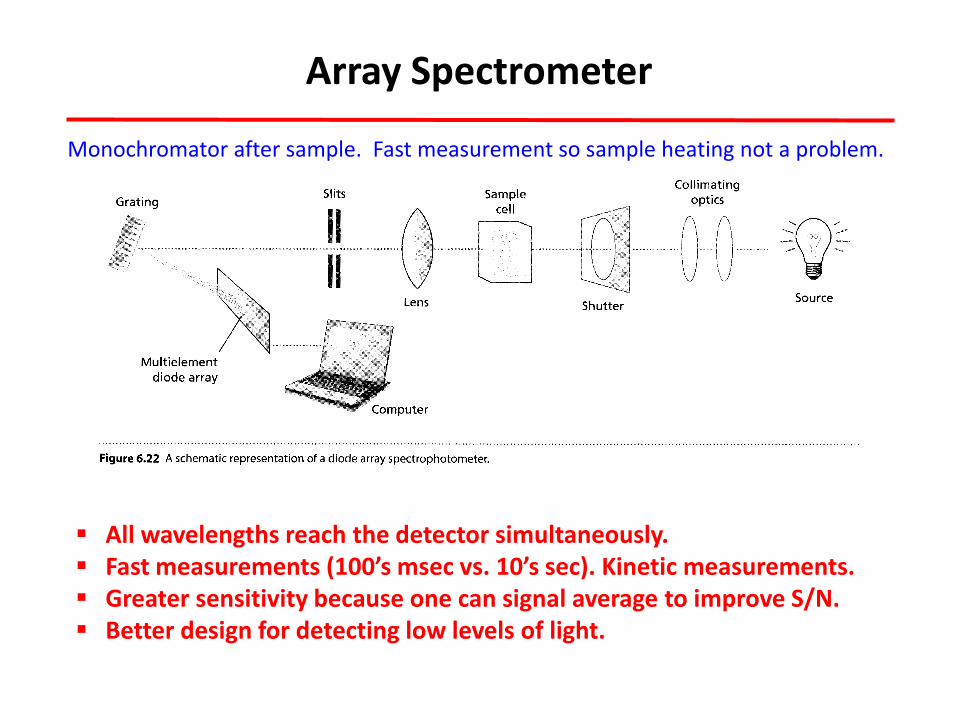
Array Spectrometer
All wavelengths reach the detector simultaneously. Fast measurements (100’s msec vs. 10’s sec). Kinetic measurements. Greater sensitivity because one can signal average to improve S/N. Better design for detecting low levels of light.
Monochromator after sample. Fast measurement so sample heating not a problem.

Detectors
Multiple dynodes each about 90 V more positive of the previous one.
106 amplification factor
Iph = kP(hυ) + idark

Detectors
Components of array detectors. Individual array elements.