Chapter 12 Bioenergy - data.daff.gov.audata.daff.gov.au/brs/data/warehouse/pe_aera_d9aae... ·...
26
AUSTRALIAN ENERGY RESOURCE ASSESSMENT 309 Chapter 12 Bioenergy 12.1.1 World bioenergy resources and market • Current global bioenergy resources used for generating electricity and heat are dominated by forestry and agriculture residues and organic waste streams. A small proportion of sugar, grain and vegetable oil crops are used for biofuel production. • Bioenergy represents around 10 per cent of the world’s primary energy consumption. Around 81 per cent of world bioenergy consumption occurs in non-OECD countries, where it is mostly used for direct burning. • In 2007, the global share of bioenergy in total electricity generation was only 1.3 per cent. However, world electricity generation from bioenergy resources is projected by the IEA in its reference case to increase by 5 per cent per year to 2030 and its share of bioenergy generation is projected to reach 2.4 per cent in 2030. • Biofuels currently represent 1.3 per cent of global use of transport fuels. By 2030, the share of biofuels in total transport fuels is projected by the IEA to increase to 4.0 per cent. 12.1.2 Australia’s bioenergy resources • Currently Australia’s bioenergy use for generating heat and electricity is sourced mainly from bagasse (sugar cane residue), wood waste, and capture of gas from landfill and sewage facilities (figure 12.1). • Biofuels for transport represent a small proportion of Australia’s bioenergy. Ethanol is produced from sugar by-products, waste starch and grain. Biodiesel is produced from used cooking oils, tallow from abattoirs and oilseeds. • There is potential to expand Australia’s bioenergy sector with increased utilisation of wood residues from plantations and forests, waste streams and non-edible biomass. 12.1.3 Key factors in utilising Australia’s bioenergy resources • The proportion of biomass potentially available for bioenergy is dependent on a wide range of factors such as feedstock prices, seasonal availability and the relative value of biomass for the production of other commodities. • A key consideration in the expansion of the bioenergy industry is to ensure sustainable use of resources to avoid any potential negative environmental and social impacts. • The commercialisation of second generation technologies will open up a range of new feedstocks from non-edible biomass (e.g. woody parts of plants) for biofuels and electricity generation. These second generation feedstocks can be produced on less fertile agricultural lands and can potentially provide environmental benefits. Some second generation feedstocks, such as algae, can be grown with saline or waste water rather than utilising freshwater resources. 12.1 Summary KEY MESSAGES • Bioenergy is a form of renewable energy derived from biomass (organic materials) to generate electricity and heat and to produce liquid fuels for transport. • The potential bioenergy resources in Australia are large and diverse. Unused biomass residues and wastes are a significant under-exploited resource. • Bioenergy offers the potential for considerable environmental benefits. At the same time, good management of the resource is needed to ensure that problems associated with use of land and water resources are avoided. • Commercialisation of second generation technologies will result in a greater availability of non- edible biomass, reducing the risk of adverse environmental and social impacts. • Australia’s bioenergy use is projected to increase by 60 per cent from 2007–08 to 2029–30.
Transcript of Chapter 12 Bioenergy - data.daff.gov.audata.daff.gov.au/brs/data/warehouse/pe_aera_d9aae... ·...

AUSTRALIAN ENERGY RESOURCE ASSESSMENT
309
Chapter 12Bioenergy
12.1.1 World bioenergy resources and market • Currentglobalbioenergyresourcesusedfor
generating electricity and heat are dominated by forestryandagricultureresiduesandorganicwastestreams.Asmallproportionofsugar,grainandvegetableoilcropsareusedforbiofuelproduction.
• Bioenergyrepresentsaround10percentoftheworld’sprimaryenergyconsumption.Around81percentofworldbioenergyconsumptionoccurs innon-OECDcountries,whereitismostlyused fordirectburning.
• In2007,theglobalshareofbioenergyintotalelectricitygenerationwasonly1.3percent.However,worldelectricitygenerationfrombioenergyresourcesisprojectedbytheIEAinitsreferencecasetoincreaseby5percentperyearto2030anditsshareofbioenergygenerationisprojectedtoreach2.4percentin2030.
• Biofuelscurrentlyrepresent1.3percentofglobaluseoftransportfuels.By2030,theshareofbiofuelsintotaltransportfuelsisprojectedbytheIEAtoincreaseto4.0percent.
12.1.2Australia’sbioenergyresources• CurrentlyAustralia’sbioenergyuseforgenerating
heatandelectricityissourcedmainlyfrombagasse(sugarcaneresidue),woodwaste,andcaptureofgasfromlandfillandsewagefacilities(figure12.1).
• BiofuelsfortransportrepresentasmallproportionofAustralia’sbioenergy.Ethanolisproducedfromsugarby-products,wastestarchandgrain.Biodieselisproducedfromusedcookingoils,tallowfromabattoirsandoilseeds.
• ThereispotentialtoexpandAustralia’sbioenergysectorwithincreasedutilisationofwoodresiduesfromplantationsandforests,wastestreamsandnon-edible biomass.
12.1.3KeyfactorsinutilisingAustralia’sbioenergy resources• Theproportionofbiomasspotentiallyavailable
forbioenergyisdependentonawiderangeoffactorssuchasfeedstockprices,seasonalavailabilityandtherelativevalueofbiomassfortheproductionofothercommodities.
• Akeyconsiderationintheexpansionofthebioenergy industry is to ensure sustainable use ofresourcestoavoidanypotentialnegativeenvironmental and social impacts.
• Thecommercialisationofsecondgenerationtechnologieswillopenuparangeofnewfeedstocksfromnon-ediblebiomass(e.g.woodypartsofplants)forbiofuelsandelectricitygeneration.Thesesecondgenerationfeedstockscanbeproducedonlessfertileagriculturallands and can potentially provide environmental benefits.Somesecondgenerationfeedstocks,suchasalgae,canbegrownwithsalineorwastewaterratherthanutilisingfreshwaterresources.
12.1Summary
K e y m e s s a g e s
• Bioenergyisaformofrenewableenergyderivedfrombiomass(organicmaterials)togenerateelectricityandheatandtoproduceliquidfuelsfortransport.
• ThepotentialbioenergyresourcesinAustraliaarelargeanddiverse.Unusedbiomassresiduesandwastesareasignificantunder-exploitedresource.
• Bioenergyoffersthepotentialforconsiderableenvironmentalbenefits.Atthesametime,goodmanagementoftheresourceisneededtoensurethatproblemsassociatedwithuseoflandandwaterresourcesareavoided.
• Commercialisationofsecondgenerationtechnologieswillresultinagreateravailabilityofnon-ediblebiomass,reducingtheriskofadverseenvironmentalandsocialimpacts.
• Australia’sbioenergyuseisprojectedtoincreaseby60percentfrom2007–08to2029–30.

AUSTRALIAN ENERGY RESOURCE ASSESSMENT
310
12.2Backgroundinformationandworldmarket
12.2.1DefinitionsBioenergydenotestheuseoforganicmaterial(biomass)asasourceofenergyforpowergenerationand direct source heat applications in all energy sectorsincludingdomestic,commercialandindustrialpurposesaswellastheproductionofliquidfuels fortransport.
Bioenergyisaformofrenewableenergy.Biomassreleasescarbondioxide(CO
2)andsmallamountsof
othergreenhousegaseswhenitisconvertedintoanotherformofenergy.HoweverCO
2 is absorbed
duringtheregrowthoftherestoredvegetationthrough photosynthesis process.
Biomass is vegetable and animal derived organic materials,whicharegrown,collectedorharvested forenergy.Examplesincludewoodwaste,bagasseandanimalfats.
A conventional combustion process converts solid biomass through direct burning to release energy intheformofheatwhichcanbeusedtogenerate
12.1.4Australia’sbioenergymarket• Bioenergyaccountedforonly4percentof
Australia’sprimaryenergyconsumptionin
2007–08,butitrepresented78percentof
Australia’srenewableenergyuse.
• ThemajorityofAustralia’sbioenergyuseis
sourcedfrombagasseandwoodwaste,which
represents92percentofbioenergyusefordirect
heatandelectricitygeneration.Biogasrepresents
6percentofbioenergyuseandtheremaining2
percentisbiofuelsfortransportfuel.
• ABARE’slatestAustralianenergyprojectsinclude
theRenewableEnergyTarget(RET),a5percent
emissions reduction target and other government
policies.BioenergyuseinAustraliaisprojected
toincreaseby2.2percentperyearto340
petajoules(PJ)in2029–30(figure12.2).
• Electricitygenerationfrombioenergyisprojected
toincreasefrom2terawatthours(TWh)in2007–
08to3TWhby2029–30growingatanaverage
rateof2.3percentperyear(figure12.3).
Figure 12.1 LanduseandbioenergyfacilitiesinAustraliaNote: Areasdepictedasunderirrigationareexaggeratedforpresentation
source: GeoscienceAustraliaandBureauofRuralSciences

CHAPTER 12: BIOENERGY
AUSTRALIAN ENERGY RESOURCE ASSESSMENT
311
generate electricity and heat include agricultural and forestresidues,andmunicipalwastesandresidues.Biofuelsareproducedfromwasteproducts,grain(sorghum) and oil-bearing crops. Australian bioenergy production is mainly consumed domestically.
Thereisarangeoftechnologiescurrentlyavailableforconvertingbiomassintoenergyforelectricity andheatgenerationand/ortransportbiofuels. Thetechnologiesarebasedoneitherthermalorchemical conversion processes or a combination.
Thefueltype(inparticulartheheatingvalueandmoisture) and the conversion technology have an effectonenergyconversionefficiency.Theenergyconversionefficiencyforwoodwasteinadirectcombustionfacilityisabout35percent,comparedtobetween70and85percentefficiencyinacombinedheatandpowerfacility.
electricity and heat generationInAustralia,biomasselectricitygenerationispredominantlyfrombagasse(sugarcaneresidues) bysteamturbine,withsomecogenerationinstallation.Severalwoodwastebioenergyfacilitiesuse steam turbines and fluidised bed combustion technologies.Thereisminorelectricitygenerationfromco-firingwithcoal,andfacilitiesusingurbanwaste.
Biogasfromlandfillandsewagefacilitiesarelocatedin urban centres and generate electricity bymeansofreciprocatingengineorgasturbine.Somefacilitieshavecogenerationinstallations.
Transport biofuelsAsmallamountofbiofuelsisusedinthetransportsector.InAustralia,firstgenerationbiofuelsconsistofethanolproducedfromC-molassesandwheatstarchby-productsandgrain(mainlysorghum),andbiodieselpredominantlyproducedfromtallow(animalfats)andusedcookingoil.
electricityandheat.Chemicalconversionprocessesbreaksdownthebiomassintofuels,intheformofbiogasorliquidbiofuels,whicharethenusedforelectricity generation and transport.
BiogasiscomposedprincipallyofmethaneandCO
2producedbyanaerobicdigestionofbiomass.
Itiscurrentlycapturedfromlandfillsites,sewagetreatmentplants,livestockfeedlotsandagriculturalwastes.
Biofuelsareliquidfuels,producedbychemicalconversion processes that result in the production ofethanolandbiodiesel.Biofuelscanbebroadlygrouped according to the conversion processes:
• First generation biofuels are based on fermentationanddistillationofethanolfromsugar and starch crops or chemical conversion ofvegetableoilsandanimalfatstoproducebiodiesel. First generation technologies are proven and are currently used at a commercial scale.
• second generation biofuels use biochemical or thermochemical processes to convert lignocellulosicmaterial(non-ediblefibrousorwoodyportionsofplants)andalgaetobiofuels.Secondgenerationtechnologiesandbiomassfeedstocksareintheresearch,developmentanddemonstration(RD&D)stage.
• Third generation biofuels are in research anddevelopment(R&D)andcompriseintegratedbiorefineriesforproducingbiofuels,electricity generation and bioproducts (such as petrochemical replacements).
12.2.2BioenergysupplychainFigure12.4providesaconceptualrepresentationofAustralia’scurrentbioenergyindustry.Currently,thereisawiderangeofbioenergyresourcespotentiallyavailableforbioenergyutilisation.Biomassusedto
350
100
150
200
250
300
0
50
0
0.6
1.3
1.9
2.5
3.1
3.8
4.4
5.0
%PJ
1999-00
2000-01
2001-02
2002-03
2003-04
2004-05
2005-06
2006-07
2007-08
2029-30
Year
AERA 12.2
Bioenergyconsumption (PJ)
Share oftotal (%)
Figure 12.2 Projectedprimaryconsumptionofbioenergyin Australia
source: ABARE2009a;ABARE2010
0
1
2
3 1.0
0.5
0
AERA 12.3
Bioenergy electricitygeneration (TWh)
Share oftotal (%)
1999-00
2000-01
2001-02
2002-03
2003-04
2004-05
2005-06
2006-07
2007-08
2029-30
Year
TWh
%
Figure 12.3 Projectedelectricitygenerationfrombioenergy in Australia
source: ABARE2009a;ABARE2010

AUSTRALIAN ENERGY RESOURCE ASSESSMENT
312
ResourcesGlobalbioenergyresourcesaredifficulttoquantifyduetotheresourcesbeingcommittedtofood,animalfeedandmaterialforconstruction.Theavailabilityofbiomassforenergyisalsoinfluencedbypopulationgrowth,diet,agriculturalintensity,environmentalimpacts,climatechange,waterandlandavailability(IEABioenergy2008).
Currentbioenergyresourcesconsistofresiduesfromforestryandagriculture,variousorganicwastestreamsanddedicatedbiomassproductionfrompastureland,woodplantationsandsugarcane.
12.2.3WorldbioenergymarketAround10percentoftheworld’sprimaryenergyconsumptioncomesfrombioenergy(table12.1). Theshareofbioenergyinprimaryenergyconsumptionishigherinnon-OECDcountriesthaninOECDcountries.InAustralia,thebioenergyshareiscomparabletotheOECDaverage,ataround4percent.Themajorityoftheworld’sbioenergyisuseddirectlyforheatproductionthroughtheburningofsolidbiomass;only4percentisusedforelectricitygenerationandanother2.5percentisintheformofbiofuelsusedinthetransport sector.
End Use MarketProcessing, Transport,
Storage
Industry
Commercial
Residential
Development andProduction
Resourcepotential
Developmentdecision
Resources
Biogasprojects
Biomassprojects
AERA 12.4
Biofuelsprojects TransportStorage
DirectBurning
Electricityand Heat
Generation
ExportProcessing
Processing(biofuels)
Figure 12.4 Australia’sbioenergysupplychainsource: ABAREandGeoscienceAustralia
Table 12.1 Keybioenergystatistics
unit australia 2007–08
OeCD 2008
World 2007
Primary energy consumption PJ 226 9317 48980
Shareoftotal % 3.9 4.1 9.7
Averageannualgrowth,since2000 % 0.3 3.0 1.9
electricity generation
Electricity output TWh 2.2 214 255
Shareoftotal % 0.9 2.0 1.3
Averageannualgrowth,since2000 % 8.7 4.8 6.0
Electricity capacity GW 0.87 1.6 na
Transport PJ 4.9 987 1207
Shareoftotal % 0.4 1.9 1.3
Averageannualgrowth,since2000 % - 29.9 22.9
source: IEA2009a;ABARE2009a

CHAPTER 12: BIOENERGY
AUSTRALIAN ENERGY RESOURCE ASSESSMENT
313
Unusedresiduesandwasteareasignificantunder-exploitedresource.
Atpresent,themainbiomassfeedstocksforelectricityandheatgenerationareforestryandagriculturalresiduesandmunicipalwasteincogenerationandco-firingpowerplants.In2007, fuelwooddominates(67percent)theshareofbiomasssourcesinthebioenergymix(figure12.5).Fuelwoodisusedinresidentialapplicationsininefficientstovesfordomesticheatingandcooking,whichisalsoconsideredamajorhealthissueindevelopingcountries(IEABioenergy2009a).Thistraditionaluseisexpectedtogrowwithincreasingpopulation,howeverthereisscopetoimproveefficiencyandenvironmentalperformance.
ThemaingrowthmarketsforpowergenerationfrombioenergyaretheEuropeanUnion,NorthAmerica,CentralandEasternEuropeandSoutheastAsia(IEABioenergy2007).Chinacontinuestoincreasepowergenerationfromindustry-scalebiogas(mainlylivestockfarms)andstrawfromagriculturalresidues.Thesugarindustryinmanydevelopingcountriescontinuestobuildbagasse-fuelledpowerplants(REN212009).
Asmallshareofsugar,grainandvegetableoilcropsisusedfortheproductionofbiofuels.ThereisincreasinginterestintransportbiofuelsinEurope,Brazil,NorthAmerica,Japan,ChinaandIndia(IEABioenergy2007).Thereispotentialtoexpandtheuseofconventionalcropsforenergy;howevercarefulconsiderationoflandavailabilityandfooddemandisrequired.
Thereisamaturecommercialmarketforfirstgenerationbiofuels.Biofuelsfromcommerciallyavailable technology are more prospective in regionswhereenergycropproductionisfeasible:forexample,sugarcaneinsubtropicalareasofSouthAmericaandsub-SaharanAfrica,andsugarbeetinmoretemperateregionssuchastheUnitedStates,ArgentinaandEurope.Inthelongerterm,lignocellulosic crops could provide bioenergy resourcesforsecondgenerationbiofuelswhichareconsideredmoresustainable,providelanduseopportunitiesandwillreducethecompetitionwithfoodcrops.
Primary energy consumptionWorldprimaryconsumptionofbioenergywas48980PJin2007(table12.1).From2000to2007worldbioenergyuseincreasedatanaveragerateof1.9percentperyear.OECDcountriesaccountedfor19percent(9317PJ)ofworldbioenergyconsumption;howevertheaveragerateofgrowthinconsumptionwas3percentperyearfrom2000to2008,fasterthantheworldaverage.
In2007,Chinawasthelargestuserofbioenergy,consuming8145PJ,followedbyIndia(6771PJ)andNigeria(3582PJ)(figure12.6).Themajorityof
Animalby-products
3%
Agriculturalby-products
4%
Energycrops3%
Charcoal7%
Forest residues1%
Wood industryresidues 5%
Agriculture10%
Recoveredwood 6%
Black liquor 1%
AERA 12.5
Municipal solidwaste andlandfill gas
3%
Fuel wood67%
Figure 12.5 Shareofbiomasssourcesintheworldprimarybioenergymixin2007
source: IEABioenergy2009a
Australia
Indonesia
United States
China
India
Nigeria
Brazil
Pakistan
Vietnam
Germany
Ethiopia
Australia
Indonesia
United States
China
India
Nigeria
Brazil
Pakistan
Vietnam
Germany
100
0 2000 4000 6000 8000
PJ
0 20 40 60 80%
AERA 12.6
a) Bioenergy use
Ethiopia
9000
b) Share in total primary energy consumption
Figure 12.6 Primaryconsumptionofbioenergy, bycountry,2007
source: IEA2009a

AUSTRALIAN ENERGY RESOURCE ASSESSMENT
314
Whilebioenergyuseishigherinnon-OECDcountries,itisofconsiderablymoresignificanceforelectricitygenerationinOECDcountries.Bioenergyforelectricitygenerationrepresents17percentoftotalbioenergyconsumptioninOECDcountries,comparedtoonly 1percentinnon-OECDcountries(IEA2009a).
Worldwideprimarysolidbiomassisthemajorbioenergyfuelusedforelectricitygeneration.In2007,electricitygeneratedfromsolidbiomassrepresented62percentofbioenergyelectricity,whilebiogasrepresented11percentandwasterepresentedtheremaining27percentofelectricityfrombioenergy.
Transport biofuelsTheUnitedStatesistheworld’slargestconsumerofbiofuels,using619PJin2007(figure12.8).However,biofuelsrepresentonly2.3percentoftotaltransportfuelsuseintheUnitedStates.GermanyandBrazilfollowtheUnitedStatesaslargebiofuelsusers.BiofuelsrepresentalargershareoftotaltransportfuelsuseinGermanyandBrazil,7.2percentand6.0percent,respectively.
TradeTheincreaseindemandforbiomassfeedstock(e.g.woodchips,vegetableoilsandagriculturalresidues)
bioenergyuseinChina,IndiaandNigeriaissolidbiomassusedintheresidentialsector.BioenergyrepresentedarelativelysmallproportionofChina’stotalprimaryenergyconsumption,withashareof10percent,whileNigeria’sbioenergyuserepresented80percentofitstotalprimaryenergyconsumptionandEthiopia’sbioenergyuserepresented90percentofitsenergyconsumption(figure12.6).
electricity generationAsmallproportionoftheworld’selectricitygenerationissourcedfrombioenergy.In2007,theglobalshareofbioenergyintotalelectricitygenerationwasonly1.3percent(table12.1).Despiteitssmallshare,electricitygeneratedfrombioenergyincreasedatanaveragerateof6percentperyearfrom2000to2007,toreach255TWh.
Insomecountries,theshareofbioenergyintotalelectricitygenerationissignificantlyhigherthantheworldaverage.Finlandhadabioenergyshareofelectricitygenerationofmorethan12percentin2007(figure12.7).TheUnitedStatesisthelargestcontributortototalworldelectricitygenerationfrombioenergy,followedbyGermanyandJapan.
Australia
United States
Germany
Brazil
Sweden
France
Australia
United States
Germany
Sweden
Canada
France
0 2 4 6 8 10 12%
0 10 20 30 40 50TWh
AERA 12.7
b) Share in total electricity generation
Japan
United Kingdom
Finland
Canada
Italy
Japan
Brazil
United Kingdom
Finland
Italy
60 70
14
80
a) Electricity generation from bioenergy
Figure 12.7 Electricitygenerationfrombioenergy, bycountry,2007
source: IEA2009a
Australia
United States
Germany
Brazil
France
Canada
Spain
Sweden
China
Netherlands
United Kingdom
Australia
United States
Germany
Brazil
France
Canada
Spain
Sweden
China
Netherlands
United Kingdom
700
PJ
%
600500400300200100
0 1 2 3 4 5 6 7 8
0
a) Biofuels use
b) Share in total transport fuels use
AERA 12.8
Figure 12.8 Biofuelsusefortransport,bycountry,2007source: IEA2009a

CHAPTER 12: BIOENERGY
AUSTRALIAN ENERGY RESOURCE ASSESSMENT
315
oilseedcrops,aswellasutilisingthelargevolumesofunusedresiduesandwastes.Lignocellulosiccropsareexpectedtocontributeinthemedium-tolong-term.Algaecouldmakeasignificantcontributioninthelongerterm(IEABioenergy2009b).
Electricity and heat generationTheIEAprojectsworldelectricitygenerationfrombioenergytoincreaseto839TWhby2030,growingatanaveragerateof5.3percentperyear(table12.2).Theshareofbioenergyinelectricitygenerationisnotprojectedtoincreasesignificantly,reachingonly2.4percentin2030,from1.3percentcurrently.Electricitygenerationfrombioenergyisprojectedtoincreaseatafasterrateinnon-OECDcountriesthaninOECDcountries,althoughfromasmaller base.
ThebiggestincreasesinelectricitygenerationfrombioenergyareprojectedtooccurintheUnitedStates,EuropeandChina.Thecostsofpowergenerationfromrenewables,includingbioenergy,areexpected tofallovertimeasaresultofincreaseddeployment.
Transport biofuelsWorldwideuseofbiofuelsisprojectedtoincreaseatanaveragerateof6.9percentperyearto5568PJby2030(table12.3).Innon-OECDcountries,biofuelsuseisprojectedtoincreaseatanaveragerateof11.2percentperyear,whereasitisprojectedtoincrease
andbioenergycommodities(e.g.ethanol,biodieselandwoodpellets)hasseentherapidgrowthininternationaltrade(IEABioenergy2009b).Themainbiomassfeedstocksandbioenergycommoditiestraded and the trade routes include:
• ethanolfromBraziltoJapan,UnitedStatesandwesternEurope;
• woodpelletsfromCanada,UnitedStatesandeasternEuropetowesternEurope;and
• palmoilandagriculturalresiduesfromBrazilandSoutheastAsiatowesternEurope.
Inaddition,thereisasubstantialamountoftradewithinEurope.
World market outlook for bioenergy to 2030BioenergyuseisprojectedbytheIEAtoincreasemoderatelyto2030,withtransportbiofuelsgrowingataslightlyfasterratethanelectricitygenerationfrombioenergy.Amongnon-transportuses,anincreasingproportionofbioenergyisprojectedtobedevoted to electricity generation rather than direct burningofbiomass,inlinewithgrowingelectricitydemand,particularlyinnon-OECDcountries.
Globaldemandforbioenergyresourcesisexpectedtoincreasewiththeprojectedgrowthinbioenergyuse.Intheshort-term,demandforbioenergyresourcesarelikelytobemetbysugar,starchand
Table 12.2 IEAreferencecaseprojectionsforworldbioenergyelectricitygeneration
unit 2007 2030
OeCD TWh 217 492
Shareoftotal % 2.0 3.7
Averageannualgrowth,2007–2030 % - 3.6
Non-OeCD TWh 41 347
Shareoftotal % 0.5 1.6
Averageannualgrowth,2007–2030 % - 9.7
World TWh 259 839
Shareoftotal % 1.3 2.4
Averageannualgrowth,2007–2030 % - 5.2
source: IEA2009b
Table 12.3 IEAreferencecaseprojectionsfortransportbiofuelsconsumption
unit 2007 2030
OeCD PJ 963 3056
Shareoftotal % 1.9 5.8
Averageannualgrowth,2007–2030 % - 5.1
Non-OeCD PJ 461 2512
Shareoftotal % 1.0 2.9
Averageannualgrowth,2007–2030 % - 7.6
World PJ 1424 5568
Shareoftotal % 1.5 4.0
Averageannualgrowth,2007–2030 % - 6.1
source: IEA2009b

AUSTRALIAN ENERGY RESOURCE ASSESSMENT
316
12.3Australia’sbioenergyresources and market
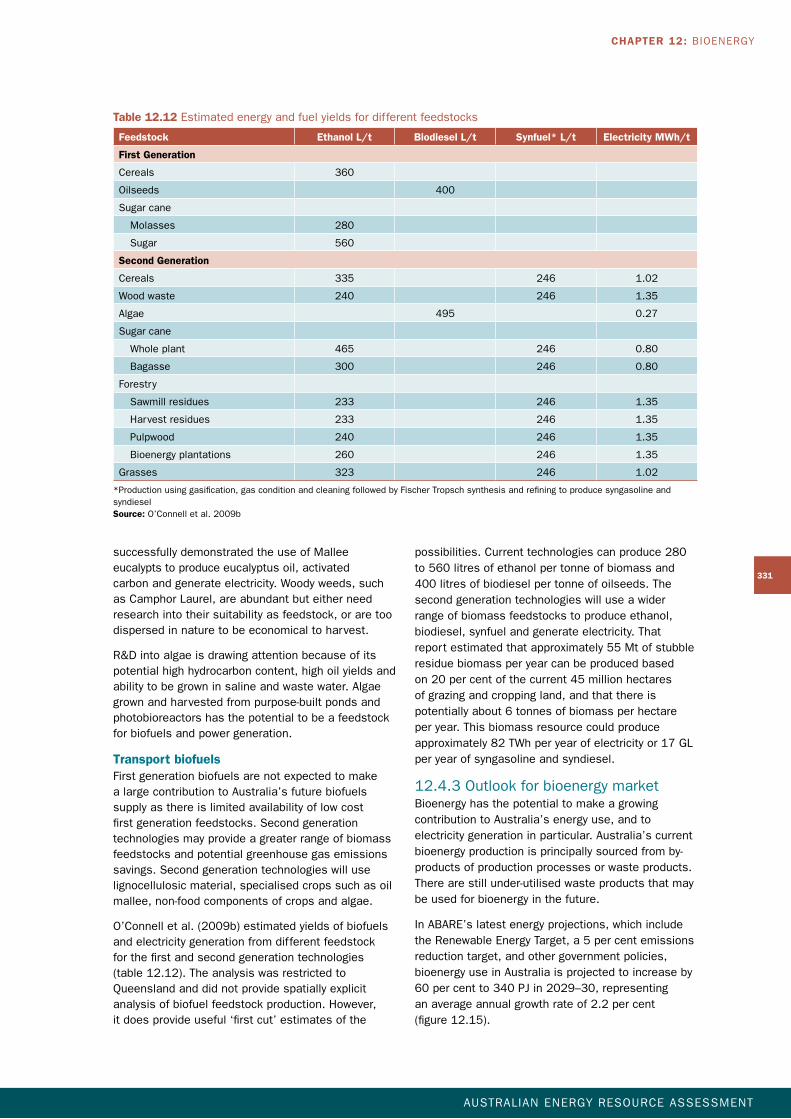
12.3.1BioenergyresourcesBioenergyresourcescurrentlyused,potentialfutureresources and the bioenergy outputs are summarised intable12.4.Thereisarangeofbioenergyresources(feedstocks)availableformultipleconversiontechnologies to generate electricity and heat and producebiofuels.Bioenergyresourcesaredifficultto estimate due to their multiple and competing uses.Thereareproductionstatisticsforcurrentcommoditiessuchasgrain,sugar,pulpwoodandsawlogs;howeverthesecommoditiesarecurrentlylargelycommittedtofood,animalfeedandmaterialsmarkets.Theycouldbeswitchedtothebioenergymarketincertainconditions,butthismaynotbethehighestorderuseforthem.
Australia’spotentialbioenergyresourcesarelarge.Thereareunder-utilisedresourcesincropresidues,
atarateof5percentperyearinOECDcountries.However,theshareofbiofuelsintotaltransportfueluseisprojectedtoremainatlessthan3percentinnon-OECDcountries,whileinOECDcountriesitisprojectedtoincreasetoalmost6percent.
Biofuelsuseisnotexpectedtoincreasesignificantlyintheshortterm.Thefallinoilpricesattheendof2008affectedtheprofitabilityofbiofuelsproductionandledtothecancellingofmanyplannedbiofuelsprojectsaroundtheworld.Manycountrieshavescaledbacktheirbiofuelspoliciesasaresultofconcernsovertheimpactofbiofuelsonfoodprices,landandwaterresourcesandbiodiversity,furtheraffectingtheprofitabilityofbiofuelsproduction.
Biofuelsproductionanduseisprojectedtorecoverinthelongerterm,however,aidedbysecondgenerationproductiontechnologies.Secondgenerationbiofuelsareprojectedtorepresentalmost25percentoftheincreaseintotalbiofuelsproductionovertheperiodto2030(IEA2009b).
Table 12.4 Currentandfuturebioenergyresources
Biomass groups Current resources Bioenergy Future resources Bioenergy
Agricultural related wastesandby-products
Livestockwastes:•manure•abattoirwastessolidsBy-products:•wheatstarch•usedcookingoil
P T Cropandfoodresiduesfromharvesting and processing:•largescale:ricehusks,cottonginning,andcerealstraw
•smallscale:maizecobs,coconut husks and nut shells
P
Sugarcane Bagasse,fibrousresiduesofsugar cane milling process SugarandC-molasses
P T Trash,leavesandtopsfromharvesting
P
Energy crops Highyield,shortrotationcropsgrownspecifically:•sugarandstarchcrops•oilbearingcrops–sunflower,canola,junceaandsoyabeans
T Woody crops (oil mallee)GMcropsTreecropsWoodyweeds(e.g.CamphorLaurel)Newoilseed(Pongamia)andsugar (agave) cropsAlgae (micro and macro)
P T
Forest residues Woodfromplantationforests P Woodfromplantationforestsandnativeforestryoperations
P T
Wood related waste
Sawmillresidues:•woodchipsandsawdustPulp mill residues:•blackliquorandwetwastes
P
Urbansolidwaste P Foodrelatedwastes,gardenorganics,paperandcardboardmaterial and urban timber
P
Landfillgas Methaneemittedfromlandfillsmainlymunicipalsolidwastes andindustrialwastes
P
Sewagegas Methaneemittedfromthesolidorganiccomponentsofsewage
P
Note: P=electricityandheatgeneration;T=transportbiofuelproduction source:BattenandO’Connell2007;CleanEnergyCouncil2008

CHAPTER 12: BIOENERGY
AUSTRALIAN ENERGY RESOURCE ASSESSMENT
317
Theproportionofbiomasspotentiallyavailable willdependonthevalueofbiomassrelativetocompetinguses,impactoftheirremoval(retentionofbiomassinsitureturnsnutrientstosoil,improvessoilstructureandmoistureretention),andglobal oilprices.Therighteconomicconditionsmayresult insomeofthebiomasspotentiallybeingused forbioenergyproduction.Dependingonthepricepoint,biomassmaybedivertedtobiofuelsorelectricitygeneration–sawmillresiduesotherwisesoldforgardenproducts,forexample,orpulpwoodchippedandexportedorusedforpaperproductionmaybedivertedtobioenergyifitisahighervalueproduct.
electricity and heat generationCurrentbioenergyresourcesusedforgeneratingelectricityandheatarepredominantlyfromagriculturalwastesandby-products,woodwaste,landfillandsewagefacilities(figure12.9).TheCleanEnergyCouncil(2008)identifiedsignificantpotentialforgrowthinbioenergyproductionfromwastestreams,suchaslandfillandsewagegasandurbanwaste.
plantationandforestresiduesandwastestreams.Thereisasignificantexpansionintoanewrangeofnon-ediblebiomassfeedstockswiththedevelopmentofsecondgenerationtechnologies.Potentialfeedstocksofthefutureincludemodifyingexistingcrops,growingofnewtreecropsandalgae.
Therearemanyfactorstobetakenintoaccountforeachbioenergyresource,suchasmoisturecontent,resourcelocationanddistribution,andtypeofconversionprocess.Differentsourcesofbiomasshaveverydifferentproductionsystemsandthereforecaninvolveavarietyofsustainabilityissues.Theserangefromverypositivebenefits(e.g.useofwastematerial,orgrowingwoodybiomassondegradedagricultural land) through to large scale diversion ofhighinputagriculturalfoodcropsforbiofuels(O’Connelletal.2009a).Thereisalsoarangeofpotentialimpactsontheresourcesincludingdrought,flood,fire,climatechangeandenergyprices.Futurebiomassfeedstocksfromagriculturalproductionaredependentonwhetherproductionareasexpandorreduce or yields increase.
Figure 12.9 DistributionofbioenergyelectricityandheatgenerationfacilitiesNote: Areasdepictedasunderirrigationareexaggeratedforpresentation
source: GeoscienceAustraliaandBureauofRuralSciences

AUSTRALIAN ENERGY RESOURCE ASSESSMENT
318
feedstocktoincludesugarcanetrash,topsandleaves.
Otheragriculturalwastestreams,includingmanurefromlivestockraisedoryardedinconcentratedareas,aresuitableforgeneratingbioenergy.Wastematerial can be used to produce stationary energy andassistinreducingenvironmentalproblemsfromwastedisposal,methaneemissionsandpollutionofwatersupplies.
Wood waste and forest residues are only used in afewbioenergyplantsinAustraliaforgeneratingelectricity.Forthepurposesofresourceassessment,itisassumedthatnativeforestwoodwastewillremainconstant;thepotentialfromplantationsmayincreaseinlinewithplantationexpansion.Woodrelatedwasteforenergygeneration,whilehavingeconomicbenefits,alsohastobemanagedintermsofenvironmentalconsiderations.InAustralia,governmentsatalllevels,haveestablishedregulatorymechanisms,includingRegionalForestAgreements,aswellasotherspecificprovisionsundertheRenewableEnergyTargetconcerningtheeligibilityforforestwoodwasteforbioenergyuse
agricultural related wastes in total are a very largeresource.However,theresourcesarewidelydispersedandcanhavearangeofalternativeusesincludingcompostingforgardenproductmanufactureandstockfeedforanimals.Currently,thebulkofbiomassresourcesarenotcollectedasafeedstockforbioenergy.
Thesugarcaneindustryisoneoffewindustriesselfsufficientinenergy,throughthecombustionofbagasseincogenerationplants.Thesugarmill directly consumes the heat and electricity generated and any surplus steam is used to generate electricity andfedintothepowergrid.TheindustryislocatedmainlyincoastalQueensland,withafewmillsinnorthernNewSouthWales.Thetotalannualsugarcanecropisabout35.5milliontonnes(Mt),ofwhich14percentiscanefibre,resultinginatotalavailableenergyofabove90PJ(CleanEnergyCouncil2008).Currently,theenergygenerationisdependentonthecrushingperiodsandtheavailabilityofbagasseresources.Thereispotentialtoincreaseelectricitygenerationefficiencywithintegratedgasificationcombinedcycletechnologyandexpandthebiomass
Figure 12.10 DistributionofbiofuelplantsNote: Areasdepictedasunderirrigationareexaggeratedforpresentation
source: GeoscienceAustraliaandBureauofRuralSciences

CHAPTER 12: BIOENERGY
AUSTRALIAN ENERGY RESOURCE ASSESSMENT
319
Transport biofuelsAsatlate2009,therearethreemajorethanolplantsandthreemajorbiodieselplantsinoperation,withatotalproductioncapacityofabout330millionlitres(ML)and175ML,respectively(figure12.10).EthanolproductionisfromC-molassesfromsugarprocessing,grain(mainlysorghum)andstarchfromflourmilling.Biodieselproductionisfromtallowandusedcookingoil.Biodieselproductionisconstrainedbyalimitedavailabilityoflowcostfeedstocks,whichareby-productsorwastestreams.
12.3.2Bioenergymarket
Primary energy consumptionBioenergyaccountedfor78percentofAustralia’srenewableenergyusebutonly4percentofAustralia’sprimaryenergyconsumptionin2007–08.Overthedecadefrom1999–2000to2007–08,bioenergyuseincreasedatanaveragerateofonly0.3percentperyear.InAustralia,productionandconsumptionofbioenergyareaboutequal,becausethereiscurrentlyonlyverysmalltradeofbioenergy.Inmid2009Australia’slargestexporterofwoodpelletssecuredtwothree-yearcontracts,totalling$130milliontosupplyEurope.Thewoodpelletswillbeusedinco-firingplantsandhomeheatingmarkets.
ThemajorityofAustralia’sbioenergyisfromwoodandwoodwasteandbagasse.Australia’suseofwoodandwoodwaste,predominatelyfordirectheat
inordertomanagethesustainableuseoftheseproducts.TheseregulatoryframeworksplacesomelimitationsontheuseofwoodwasteinAustraliaforelectricity generation.
Theuseoflandfill gas (mainly methane) to generate electricityisarelativelymaturetechnology,whichinvolvesinstallinganetworkofperforatedpipesintoanexistinglandfillandcapturingthegasgeneratedfromwastedecomposition.Thecapturedgasisused to generate electricity using reciprocating gas engines.Mostfacilitiesarecentrednearthemajorurban centres and used locally.
Bioreactorlandfilltechnologyacceleratestherateofwastedecompositionmaximisinggasproductionbyrecirculatingwaterthroughaspeciallydesignedlandfill.Thistechnologyisbeingusedatthe WoodlawnBioreactor,adisusedopencutmineinNewSouthWales.Thesiteaccepts300000tonnesofsortedresidualwasteperyearandwillultimatelysupportupto25Megawatts(MW)ofgenerationcapacity.
sewage gas can be collected at treatment plants to generateelectricityandheat.Organicwasteisfedinto an anaerobic digester to produce a methane-rich biogas then combusted in customised gas engines or gasturbines.Thermalenergyproducedbytheengineduring combustion is recovered and used to heat the anaerobic digestion process.
Wood, woodwasteLandfill gas
Bagasse
240
220
200
180
160
140
120
100
0
20
40
60
80
PJ
2007-081960-61 1966-67 1972-73 1978-79 1984-85 1990-91 1996-97 2002-03
Year
AERA 12.11
Biofuels
Figure 12.11 Australia’sprimaryconsumptionofbioenergysource: ABARE2009a

AUSTRALIAN ENERGY RESOURCE ASSESSMENT
320
predominantlyforheating.Therearealsosmallamountsofbioenergyusedinthetransportandcommercial and services sectors.
Electricity generationIn2007–08,woodandwoodwasteandlandfillandsewagebiogasfuelinputstopublicelectricitygeneration(excludingcogeneration)were19.7PJ,whichgenerated2.2TWhofelectricity.Inaddition,112PJofbagassewereusedasfuelwithinthefood,beveragesandtextilessector,themajorityofwhichisusedinsugarrefineriesincogenerationplants.
Thecontributionofwood,woodwasteandbiogastoAustralia’selectricitygenerationhasincreasedoverthepasttwodecades.From1989–90to2007–08bioenergyelectricitygenerationgrewatanaveragerateof6percentperyear.Theshareofbioenergyintotalelectricitygenerationincreasedmodestlyfrom0.5percentto0.8percentoverthatperiod(figure12.13).
application,hasdeclinedovertime.Inthe1960swooduserepresentedbetween70and85percentoftotalbioenergyuse,butasbagasseuseexpanded,thissharedeclinedto55–65percentinthe1970sandremainedrelativelyconstantinthe1980sand1990s.
In2007–08,bagasseandwoodrepresented50percentand42percentofbioenergyuse,respectively.Landfillandsewagegasrepresented6percentoftotalbioenergyuseandliquidbiofuelscomprisedtheremaining2percent(figure12.11).
Bioenergy use, by industryAround58percentofAustralia’sbioenergyisused inthefoodandbeveragessector,specificallywithinthesugarindustry,whichusesbagassefromitssugar production to generate electricity and heat. Theresidentialsectoristhesecondlargestbioenergyuser,accountingfor29percentofbioenergyuse(figure12.12).Thisisintheformofwoodused
Food,beverages,
textiles57.6%
Residential29.1%
Wood, paperand printing
9.3%
Other industry1.1%
Roadtransport
1.4%
AERA 12.12
Commercialand services
0.4%
Non-ferrousmetals1.2%
Figure 12.12 Australianbioenergyuse,byindustry,2007–08
source: ABARE2009a
0
0.5
1.0
1.5
2.0
2.5
TWh
0
0.2
0.4
0.6
0.8
1.0
%
Year
Electricitygeneration (TWh)
AERA 12.13
1989-90 1992-93 1995-96 1998-99 2001-02 2004-05 2007-08
Share of total electricitygeneration (%)
Table 12.5 Capacityofelectricitygenerationfrombioenergy(MW),2009
Biogas Bagasse Wood waste
Other bioenergyb
Total bioenergy
NewSouthWalesa 73 81 42 3 199
Victoria 80 0 0 34 114
Queensland 19 377 15 4 415
SouthAustralia 22 0 10 0 32
Western Australia 27 6 6 63 102
Tasmania 4 0 0 0 4
NorthernTerritory 1 0 0 0 1
australia 226 464 73 104 867
Shareoftotalrenewableelectricitycapacity(%) 2.2 4.4 0.7 1.0 8.3
a IncludestheACT.bUnspecifiedbiomassandbiodiesel source:GeoscienceAustralia2009
Figure 12.13 Australianelectricitygenerationfrombioenergy
source: ABARE
CHAPTER 12: BIOENERGY
AUSTRALIAN ENERGY RESOURCE ASSESSMENT
321
Incontrast,biogas-fuelledplantsatlandfillandsewagefacilitiesarecentrednearmajorurbancentresacrossallstatesandterritories.Thesesitescompriseatotalinstalledcapacityof226MW.Woodwastefacilitiesrepresent0.7percentofrenewableenergycapacityandhaveatotalcapacityof73MW(table12.5).
Transport biofuelsBiofuelscomprisedabout0.5percentofAustralia’stransportfuelsupplyin2007–08.Australianbiofuelsproductiondecreasedbyabout40percentfrom2002–03to2004–05to1.3PJ.However,from2004–05to2007–08biofuelsproductionincreasedalmostfourfoldto4.9PJ(figure12.14).
In2007–08,Australia’sethanolproductionisestimatedat149MLandbiodieselproductionat50ML.EthanolproductionhasincreasedasaresultofthenewDalbyplantinQueenslandandasmallexpansionattheManildraplantinNewSouthWales.In2008–09ethanolproductionincreasedto209ML.Biodieselproductionfellslightlyfrom2006–07to2007–08,duetothreeplantstemporarilyhaltingproductionin2007and2008(table12.6).In2008–09,biodieselisestimatedtohaveincreasedtoabout85ML.
Therearecurrentlythreemajorethanolplantsinoperation.ThelargestoperatorisManildraGroupinNewSouthWaleswithtotalproductioncapacityof 180ML.Threemajorbiodieselplantsareinproductionwithatotalproductioncapacityof175ML.ThetotaloperatingbiofuelsproductioncapacityinAustraliaisaround600MLayear(table12.7).
Thetotalcapacityofelectricitygenerationfrombioenergyrepresented1.6percentofallelectricitygenerationcapacityin2008.Bagasse-fuelledelectricitygenerationfacilitiesrepresent54percentoftotalbioenergycapacity,at464MW.ThesefacilitiesarelocatedpredominantlyinQueenslandwheresugarproductionplantsarelocated(table12.5).
0
0.5
1.0
1.5
2.0
2.5
3.0
3.5
4.0
4.5
5.0PJ
2007-082006-072005-062004-052003-042002-03
YearAERA 12.14
Table 12.6 BiofuelsproductioninAustralia
2005–06 2006–07 2007–08 2008–09
mL mL mL mL
Biodiesel 21 54 50 85
Ethanol 42 84 149 209
Total 63 138 199 294
source: DepartmentofResources,EnergyandTourism
Figure 12.14 Australianbiofuelsproductionsource: ABARE2009a
Table 12.7 LiquidbiofuelsproductionfacilitiesinAustralia,2009
Location Capacity mL/yr
Feedstocks
Fuel ethanol
ManildraGroup,Nowra,NSW 180 Wastewheatstarch,somelowgradegrain
CSRDistilleries,Sarina,Qld 60 C-molasses
DalbyBiorefinery,Dalby,Qld 90 Sorghum
Total 330
Biodiesel
BiodieselIndustriesAustralia,Maitland,NSW 15 Usedcookingoil,vegetableoil
BiodieselProducersLimited,Wodonga,Vic 60 Tallow,usedcookingoil
SmorgonFuels,Melbourne,Vic 100 Drylandjuncea(oilseedcrop),tallow,usedcookingoil,vegetable oil
Various small producers 5 Usedcookingoil,tallow,industrialwaste,oilseeds
Total 180
Biodiesel plants with limited production
AustralianRenewableFuels,Adelaide,SA 45 Tallow
AustralianRenewableFuels,Picton,WA 45 Tallow
Total 90
Biodiesel plants not in production
Eco-TechBiodiesel,Narangba,Qld 30 Tallow,usedcookingoil
source: DepartmentofResources,EnergyandTourism

AUSTRALIAN ENERGY RESOURCE ASSESSMENT
322
willdependonthecostofresources(bothbioenergyandalternatives),conversiontechnologiesandrelevantgovernmentpolicies,particularlythose thataffectboththeavailabilityofresourcesand their price.
Costfactorsaside,thegrowthofthebioenergyindustrywillbeinfluencedbythecommercialisationofsecondgenerationtechnologies,whichwillalsoincreasetherangeofbioenergyresourceoptionsandreducecompetitionforresourcesbetweenbioenergyfeedstocksandagricultural/forestrycommodities.Developmentofeffectiveharvestingandprocessingmethodsandimprovedtransportationandstoragewillalsobeimportantfactorsinachievingefficienciesinbioenergy production.
Availabilityofbiomasswillbecentraltotheexpansionofthebioenergysector.Theavailabilityofbiomassisinfluenced by:
• diversionofcurrentbiomassproductionandwasteandresiduesstreams.Biomassresiduesfromforestry,agriculturalharvestandprocessing,andwastestreams,suchaslandfillandsewagegas,offeralargeunder-utilisedenergyresource,whichcanalsoassistinwastedisposalissues;
• changeinharvestingregimesforcropsorforests(e.g.stubblefromagriculturallandsandthinningsfromforests);and
• newproductionsystemswhichmayincludelandusechange,inturninfluencedbyavailableland,croporforesttypesandproductivity.Theamountoflandavailableforbiomassdependsontheamountoflandusedforagriculturalandforestryproducts and that devoted to nature reserves. Thedemandforfood,whichisafunctionofpopulationanddiet,hasadirectimpactonland
Recent bioenergy projectsEleven bioenergy electricity projects have been commissionedinAustraliasince2001,withacombinedcapacityof240.2MW(table12.8).Bagasse-fuelledbioenergyplantsaccountedfor mostofthecommissionedcapacity.Australia’slargestrecentlycommissionedbioenergyplantisCSRSugarMillsinQueenslandwithacapacityof63MW.
Australia’sfirstgraintoethanolplantatDalby,QueenslandcommencedoperationinDecember2008.Theplantprocesses220000tonnesofdrygrain(sorghum)asitsfeedstockwithacapacityof 90MLofethanolperyear.
12.4Outlookto2030forAustralia’sresourcesandmarketThereissignificantpotentialtoexpandtheuseofbiomassforelectricity,heatandtransportbiofuelsproduction.Thereisadiversityofbioenergyresources and conversion technologies that can provide greenhouse gas emissions savings and reducewastedisposalissues.Theremaybeopportunitiesforthebioenergysectortosupportagricultural industries and rural communities through growingcomplementaryenergycropsand indevelopingregionalenergyfacilities.
12.4.1KeyfactorsinfluencingtheoutlookThefuturegrowthofAustralia’sbioenergyindustrywilldependonitscompetitivenessagainstotherenergysources,thecommercialisationofefficientconversiontechnologiesandavailabilityofbioenergyresources.
Thecostcompetitivenessofbioenergywithalternativeelectricitygenerationandtransportfuels
Table 12.8 Bioenergyprojectsrecentlydeveloped,asatSeptember2009
Project Company state Type start up Capacity (mW)
electricity and heat generation
Tumut Visy Paper NSW Woodwaste 2001 17.0
RockyPoint NationalPowerandBabcockandBrownJointVenture
QLD Bagasse 2001 30.0
Stapylton GreenPacificEnergy QLD Woodwaste 2003 5.0
SouthCardup LandfillManagementServicesLtd WA Landfillmethane 2005 6.0
Werribee (AGL) AGL VIC Sewagemethane 2005 7.8
Pioneer 2 CSRSugarMills QLD Bagasse 2005 63.0
Woodlawn WoodlawnBioreactorEnergyPtyLtd NSW Landfillmethane 2006 25.6
CarrumDowns1&2 MelbourneWater VIC Sewagemethane 2007 17.0
EasternCreek2 LMSGenerationPtyLtd NSW Landfillmethane 2008 8.8
Condong SunshineElectricity NSW Bagasse 2008 30.0
Broadwater SunshineElectricity NSW Bagasse 2008 30.0
Transport biofuels
Dalby DalbyBiorefineryLtd QLD Ethanol 2008 90.0
source: GeoscienceAustralia;ABARE

CHAPTER 12: BIOENERGY
AUSTRALIAN ENERGY RESOURCE ASSESSMENT
323
Electricity and heat generationElectricity and heat generation through biomass
combustionisamature,efficientandreliable
technology.Incaseswherelowcostfeedstocksare
availableforco-firingschemes,electricityandheat
productionfrombioenergyiscostcompetitivewith
fossilfuels(IEABioenergy2007).
Anassessmentoftheelectricitygenerationcosts
frombiomasswasundertakenbyIEABioenergy
(2007),whichprovidesacomparisonforthree
biomasstypes.Itshouldbenotedthattheactual
costsmaynotbedirectlyapplicabletoAustralia.In
theshortterm(about5years)thecostsofgenerating
electricityrangefrom�0.03–0.15(US$0.04–0.21)/kilowatthour(kWh)(in2007dollars),depending
onthebiomassfeedstock,technologyandscale
ofgenerationplant(table12.9).Inthelongerterm
(morethan20years)biomasselectricitycostsare
expectedtodeclineto�0.02–0.08(US$0.03–0.11)/kWh(in2007dollars)withadvancesintechnologies.
Themainvariabilityincostswillarisefromthecostof
biomass supply.
Arelativelylowcapitalcostoptionforimproving
systemefficiencyandreducingcarbonemissionsis
retrofittingofco-firingboilerswithbiomassdelivery
systems.Totalcostsvarydependingonthetype
andconditionoftheboilerbeingmodifiedandthe
biomassdeliverysystem,withseparatefeedsystems
costinguptofourtimesasmuchasablended
deliverysystem(Grabowski2004).IntheUnited
States,theannualfuelcostsareoftenlowerinco-
firingplantsthaninplantsburningpurecoal.These
annual savings can result in payback periods on
initialinvestmentoflessthan10yearsandreduce
productioncostsbetween$US0.02–0.22/kWh.In
addition,theuseofbiomassasasupplementary
fuelincoal-firedplantsreducessulphurdioxideand
nitrogenoxidesemissions(EESI2009a).
useandavailabilitytogrowprimarybiomassresourcesforbioenergy.Theamountofbiomassproducedisafunctionofthequalityoftheland,theclimate,wateravailabilityandmanagementpractices.
Therearepotentialrisksintheexpansionofbiomass production into areas that provide valuable ecosystems that support high biodiversity and may result in nutrient pollution.
Cost competitivenessBioenergyproductioncostsareafunctionofbiomassfeedstock,labour,transportation,capitalandoperating costs.
Thecostoffeedstocksdependsonwhetheritisaprimary biomass (energy crop) or residue biomass fromanagricultural,forestryorurbanactivity.Costvariationsareduetoinputandharvestcostsfromproductionsystems.Solidbiomasscanbebulky,difficulttohandleandtransport,andmaydecayovertime.Onsitepre-processingofmaterials,suchaschipsorwoodpellets,mayincreasethelabourandprocessingcosts,butreducetransportandstoragecosts.
Bioenergybecomesacompetitivealternativeinsituationswherecheapor‘negative-cost’residues orwastesareavailableandusedonsite(IEABioenergy2007).Themosteconomicalbioenergyproductionmodelistheproductionofenergyatthebiomasslocationsuchasatlandfillandsewagesites,papermills,sawmillsorsugarmills. InAustralia,alargeproportionofbioenergyproduction occurs in small to medium cogeneration plantsbuiltatsugarmillsandotherfoodprocessingplantsthathaveaccesstosignificantlowcostbiomasswastestreams.
Largescalebioenergyproductionrequiresfurtherdevelopment in conversion technologies and biomass productiontobecompetitivewithfossilfuels(IEABioenergy2007).
Table 12.9 Electricitygenerationcostsforthreebioenergyresources
Biomasselectricity generation
short term Longer term
Organicwaste•municipalsolidwaste
Less than �0.03–0.05(US$0.04–0.07)/kWhForstate-of-the-artincinerationand co-combustion technology
SimilarrangeImprovementsinefficiencyandenvironmentalperformance
Residues•forests•agriculture
�0.04–0.12(US$0.05–0.16)/kWhLowercostincombinedheatandpoweroperationsMajorvariableisbiomasssupplycosts
�0.02–0.08(US$0.03–0.11)/kWhMajorvariableisbiomasssupplycosts
Energy crops•oilseeds•sugar/starch•shortrotationcroppingtrees
�0.05–0.15(US$0.07–0.21)/kWhHighcostsforsmallscaleplants, lowercostsforlargescale(over100MW)state-of-the-artcombustion
�0.03–0.08(US$0.04–0.11)/kWhLowcostsduetoadvancedco-firingschemesandintegrationgasificationusingcombinedcycletechnologyover100MW
Note: Costsin2007dollarssource: IEABioenergy2007

AUSTRALIAN ENERGY RESOURCE ASSESSMENT
324
intechniques,up-scalingofproductionfacilities andlowerfeedstockcostusingbiomassresidues(table12.10).
Technology developments – more efficient, using a greater range of non-edible biomass resourcesThereisarangeoftechnologiescurrentlyavailableandindevelopmentforconvertingbiomassintoenergy(box12.1).Energyisreleasedeitherintheformofheatorisconvertedintoanotherenergyformsuchasliquidbiofuelsorbiogas.
Electricity and heat generationElectricityandheataregeneratedbycombustion,cogenerationandgasificationofbiomassandfrommethanegascapturedfromlandfillandsewagefacilities.Theburningofsolidbiomassisthedominantmethodofenergyconversionforelectricityandheatproduction.Increasedefficiencycanbegainedthroughfluidisedbedcombustionandco-firingofbiomass(e.g.woodresidue)withcoal.Thereispotential to increase bioenergy production through utilisationofunder-exploitedbiomassresiduesandwastesfromforestryandwoodprocessingfacilities.Theseresidueandwasteresources,ifusedmoreeffectively,canassistinthereductionofgreenhousegas emissions.
Transport biofuelsFirstgenerationbiofuelsaremainlyproducedfromsugarandstarchby-products,grainoilcrops,usedcookingoiloranimalfat(box12.2).GiventhelimitedsupplyofthesefeedstocksinAustralia,firstgenerationbiofuelswillnotbeabletosupplyalargeproportionoftransportfuelneedsuntilsecondgeneration technologies become commercially viable.
SecondgenerationbiofuelsarethesubjectofactiveRD&D(box12.2).Theyareproducedfromlignocellulosicfeedstockssuchascropandforestresiduesandwoodprocessingwastes,whichdo notcompetedirectlywithfoodcrops.InAustralia,secondgenerationbiofuelsshowpromiseformaking agreatercontributiontotransportfuelsupply,butthisisdependentonsustainableproductionofbiomassatacompetitivecost(Wild2009).
Thefarmingofalgaetoproducebiofuelsisanareaofactiveresearchworldwide.Algaecultivationisnotnewtechnology–ithasbeenusedtoproducefoodsupplementssuchasbeta-carotene,andspirulina.Bothmicroalgaeandmacroalgae(e.g.seaweed)arebeinginvestigatedasfeedstocksforbiofuels.Algaecanbegrownonnon-arableland,insalineandwastewaterandhasahighoilyield.MicroalgaecanfixCO
2
fromtheatmosphere,powerplantsandindustrialprocessesandsolublecarbonate,howeveronlyasmallnumberofmicroalgaearetoleranttohighlevelsofsulphuroxidesandnitricoxidespresentinfluegases.Therearechallengeslimitingthecommercial
Transport biofuelsThemaincomponentofbiofuelsproductioncostsisthecostoffeedstock,whichvariesconsiderablyaccordingtothetypeoffeedstockused.Lowcostbiofuelscanbeproducedfromcropsgrowninthemostsuitableclimatezonesandusingcommerciallyavailabletechnologies,suchasethanolfromsugarcanegrownintropicalregions.BiofuelproductioncostsarelowinBrazil,forexample,largelybecauseoftheavailabilityoflowcostsugarcane.SugarcaneethanolinBrazilhasalowercostthanpetrol(WorldwatchInstitute2006).Ethanolproductioncostsvarysignificantlysubjecttothelocationandthefeedstockused.SugarcaneethanolproducedinBrazilcostsaboutUS$0.20perlitre,whereasintheUnitedKingdomcostswereaboutUS$0.81perlitre(IEA2006b).
TheproductioncostoffirstgenerationbiofuelsinAustralia is highly variable due to variations in the costoffeedstock.EthanolfromstarchwasteandC-molassesandbiodieselfromusedcookingoilcanbeproducedatacostlessthanA$0.45perlitre,in2007dollars(comparativecostofoilatUS$40perbarrel).Ethanolfromsugarandgrainandbiodieselfromtallowandoilseedcrops(canola)canbeproducedfromlessthanA$0.80perlitre,in2007dollars(comparativecostofoilatUS$80perbarrel)(O’Connelletal.2007).
InAustralia,expansionandconstructionoffirstgenerationbiofuelfacilitieswereplannedin2007asaresultofgovernmentsubsidiesandhighoilprices.However,manyoftheseplanswerepostponeddue tohighfeedstockpricesandfallingcrudeoilprices attheendof2008.Uncertaintyaboutfuturechangesinoilandfeedstockpricescontinuestorestrictinvestmentinnewcapacity.
Thedevelopmentofsecondgenerationbiofuelsfromlignocellulosicbiomasswillnotonlyincreasetherangeoflowcostfeedstocksbutwillincreaseconversionefficienciesandlowerproductioncosts(IEABioenergy2007).
ThecostofsecondgenerationlignocellulosicbiofuelproductionisestimatedtobelessthanUS$1.00perlitre.CostisexpectedtodecreasetobetweenUS$0.55andUS$0.70perlitreinthelong-termdepending on the technologies and improvements
Table 12.10 Productioncostsforsecondgenerationbiofuels
second generation technologies
Production cost Us$/litre gasoline equivalent
2010 2030
Biochemicalethanol 0.80–0.90 0.55–0.65
BiomasstoLiquids (BTL)diesel
1.00–1.20 0.60–0.70
source: IEABioenergy2008

CHAPTER 12: BIOENERGY
AUSTRALIAN ENERGY RESOURCE ASSESSMENT
325
BOx 12.1 BIOENERGyTECHNOLOGIESFORELECTRICITyANDHEATGENERATION
Thermalconversionusesheatasthedominantmechanism to convert biomass to energy. Combustionisthesimplestmethodbywhichbiomasscanbeusedforenergyandhasbeenusedformillenniatoprovideheat.Conventionalcombustion technologies involve biomass being burnt inthepresenceofairinaboilertogenerateheattoproducehotair,hotwaterorsteam,whichisusedina steam turbine to generation electricity.
Combustion technologiesThethreemainbiomasscombustionconversiontechnologiesaregrateboilers,fluidisedbedcombustion(gasification)andco-firinginutilityboilers.
Grate boiler technology is the oldest combustion principleandwasthemostcommondesignofsmall-sizeboilers.Itremainspopularforrelativelysmallboilers(lessthan5MW)incountriesusingfuelssuchaswoodpellets,strawandmunicipalsolidwaste (IEA2008).
Fluidisedbedcombustionusesupwardblowingjetsofairtosuspendsolidfuelsduringthecombustionprocessforincreasedefficiency.Theprocesscontrolsthesupplyofoxygenand/orsteam.Thebiomassisdevolatilised and combusted to produce a biogas thatcanbeburntforheatorusedinagasturbineforelectricity generation.
Therearetwomaintechnologies,bubblingfluidisedbed(BFB)andcirculatingfluidisedbed(CFB)technologies.BFBcombustionoffersbettertemperaturecontrolandismoresuitablefornon-homogeneousbiomass.CFBcombustionusespulverisedfuelthatdoesnotrequireahightemperatureflameandallowsbettercontrolofthefurnacetemperature.
Co-firingreferstothesimultaneouscombustionofabiomassfeedstockandabasefuel(e.g.coal)toproduceenergy.Themostcommonbiomassincludelowvaluewood,cropresiduesandmunicipalwaste.Mostbiomassfeedstockmustundergoprocessingbeforeitcanbeutilisedforco-firing(EESI2009a).Processedsolidbiomassisaddedtotheco-firedboilersalongwiththefossilfuel.IthelpsreducerelianceonafiniteresourceandcanmakeasignificantcontributiontoCO2
emission reductions (MassachusettsTechnologyCollaborative2009;IEA2006a).
Biomassco-firinginmodern,largescalecoal powerplantsisefficientandcanbecosteffective.Thetechniquehasbeensuccessfullydemonstratedinmorethan150installationsworldwide.AboutahundredoftheseareoperatinginEurope,around 40intheUnitedStatesandafewinAustralia. Anumberoffuelssuchascropresidues,energycropsandwoodybiomasshavebeenco-fired. Theproportionofbiomassinthefuelmixhas rangedbetween0.5and10percentinenergy terms(IEA2008).
Forco-firingofupto10percentofbiomassmixedwithcoalorfedthroughthecoalfeedingsystem,onlyminor changes in the handling equipment are needed. Forbiomassexceeding10percentorifbiomassandcoalareburnedseparately,changesinmills,burnersand dryers are needed.
Thedevelopmentofbiomassfuelpreparationanddryingtechnologiessuchastorrefaction(thermochemicaltreatmentthatlowersthemoisturecontent and increases the energy content) and pelletisingofbiomass,increasetheefficiencyofplants.Inaddition,thebiomassisverycompact,stableandeasiertotransport,storeandhandle.
Wood pellets are rapidly becoming an important sourceoffuelforco-firedplants.WoodpelletsorDensifiedBiomassFuel(DBF)aremanufacturedfromlowvaluetreesandfromsawdustandotherpulpwaste.WoodpelletsareincreasinglyusedasarenewablefuelforpowergenerationincountriessuchasJapan,Canada,SouthAfricaandparticularlyinEurope.MuchofthenewgenerationcapacityinEuropeisbasedondedicatedpellet-fuelledcombinedheatandpowerplants.Europeanproductionhasbeenbasedonbothscarcesawmillwasteand,increasingly,imports.InAustralia,woodpelletuseremains limited but supply to the domestic market andexportmarketisexpectedtoincrease.
Cogeneration technologyInthemostefficientelectricitygenerationplantaround30percentoftheenergyinthebiomassisconvertedintoelectricity;therestislostintotheairandwater.Cogenerationorcombinedheatandpower(CHP)plantshavegreaterconversionefficienciesasthey produce both electricity and process heat.
Thereisanumberofdifferenttypesofcogenerationtechnology.Formanyyears,allcogenerationinstallationswerebasedontheuseofconventionalboilers,withsteamturbinesforelectricitygeneration.Gas turbine technology has largely superseded steamturbinetechnologyformediumsizeinstallation(Saddleretal.2004).Bagasse,sludgegasfromsewagetreatmentplantsandmethanefromlandfillsitesareusedasfuelincogenerationplants.Whereacogenerationplantispoweredbywastegases,fugitivegasesarecapturedandutilisedtodrivegasturbineswhichinturngenerateelectricity.InAustralia,sugarmillsruncogenerationplantswhicharefuelledbybagasseleftoveraftercrushingthesugar cane.
Trigeneration technologyTrigenerationtechnologyprovidescoolinginadditiontoheatandelectricitygeneration.Theprocess wasteheatcanbeusefullyappliedforheatinginwinterand,viaanabsorptionchiller/refrigation,
AUSTRALIAN ENERGY RESOURCE ASSESSMENT
326
forcoolinginsummer.Refrigerationandair-conditioning normally require a compressor driven by electricity.Theabsorptionchillerusesaheatsourcetoprovideenergytodrivethecoolingsystem.Thecombinationoftechnologiestoconvertwasteheatinto cooling can reduce peak summer electricity consumptionandgreenhousegasemissionsfromair-conditioningbyabout25percent.
A small scale trigeneration option is an Organic RankineCycle(ORC)enginewhichusesanorganicfluidwithalowboilingpoint,ratherthansteam andhencelowercostinvolvedingatheringheat. Abiomass-firedORCtrigenerationsystemisable to generate electricity and provide heating and cooling demands.
Gasification and pyrolysis technologies (thermochemical processes)Theuseofgasificationismoreefficientforenergyrecoveryintermsofelectricitygenerationthantraditionalcombustion.Ingasification,solidbiomassisheatedtohightemperatures(800–1000°C)inagasifierandconvertedtoasyngasprimarilycomposedofhydrogen,carbonmonoxide,carbondioxide,watervapourandmethane.Thereareloweramountsofsodiumoxides,nitrousoxidesanddioxinsemissions than in a traditional combustion process.
Thesyngascanbeusedincombustionengines(10kWto10MW)withefficiencyof30to50percentingasturbinesorcombinedcycles(IEA2007a).Biomassintegratedgasification/gasturbines(BIG/GT)arebeingdeveloped.Tareliminationisoneoftheareasofresearch,whichisexpectedtobeovercome
inthemediumterm.Thefirstintegratedgasificationcombinedcycle(IGCC)plantrunningon100percentbiomass(straw)hasbeensuccessfullyoperatedinSweden.
Pyrolysisisthermaldegradationofbiomasstoproducebio-oil,syngasandcharcoalatmediumtemperatures(350–800°C)intheabsenceofair.Pyrolysisencounterstechnicaldifficultieswhichhaveprevented its implementation on a commercial-scale. Theseincludeeffectiveheattransferbetweentheheat carrier and biomass particles or the quenching ofvapourstostopfurtherreactionsthatresultin bio-oil quality variations.
Anaerobic digestion technologyAnaerobicdigestionisatechniqueusedfor producingbiogaswhichisusedcommerciallyworldwide,especiallyforwasteeffluentssuchaswastewater,sewagesludgeandmunicipalsolidwaste.Anaerobicbacteriadigestorganicmaterial intheabsenceofoxygenandproducebiogas.Anaerobic processes can be managed in a digester orairtighttankorcoveredlagoon.Thereisincreasinguseofthistechnologyinsmallscale,offgridapplicationsatthedomesticandfarm-scale.
Inmodernlandfillsites,methaneproductionrangesbetween50and100kgpertonofmunicipalsolidwaste(MSW).Ingeneral,some50percentofbiogascanberecoveredandusedforpowerandheatgeneration.Afterpurificationandupgrading,biogascanbeusedinheatplantsandstationaryengines,fedintothenaturalgasgridorusedasatransportfuel(compressednaturalgas)(IEA2007b).
developmentofalgaebiofuelssuchasalgaespeciesthatbalancesrequirementsofbiofuelproduction,equipmentandstructuresneededtogrowlargequantitiesofalgaeandthenegativeenergybalanceafteraccountingforwaterpumping,harvestingandextraction.
Researchisbeingundertakenintoproductionsystems such as open ponds and closed loop systems,algalstrainsandfertilisationwithnutrientsandCO
2.Openpondsystems(e.g.sewageponds)
requireanalgaestrainthatisresilienttowideswingsintemperatureandpH,andcompetitionfrominvasivealgaeandbacteria.Inaclosedsystem(notexposedtoopenair)alsoreferredtoasaphotobioreactor,nutrient-ladenwaterispumpedthroughplastictubesthatareexposedtosunlight.Photobioreactorshaveseveral advantages over open systems by reducing contaminationbyorganismsblowninbytheair,controlledconditions(pH,light,temperatureandCO
2)
andpreventingwaterevaporation.
InAustralia,thereisanumberofR&Dprojectsinvestigatingbiofueltechnologiesfrommicroalgae.
InVictoria,theUniversityofMelbourneisresearchingefficientseparation,processingandutilisationofalgalbiomass.AlgalFuelsConsortiumisdevelopingapilot-scalebiorefineryinSouthAustraliaforsustainablemicroalgalbiofuels.AjointprojectbetweenMurdochUniversity,WesternAustralia,andUniversityofAdelaide,SouthAustraliaisworkingonallstepsintheprocessofmicroalgalbiofuelsproduction,frommicroalgaeculture,harvestingofthealgaeandextractionofoilforbiofuelsproduction.ConstructioncommencedinJanuary2010onapilotplanttotestthewholeprocessonalargerscaleinKarratha,north-westWesternAustralia,andisexpectedtobeoperationalbyJuly2010.
ThirdgenerationtechnologiesareintheR&Dstage.Thetechnologyinvolvesthedevelopmentoflignocellulosicbiorefineriesthatproducelargevolumesoflowcostbiofuelandtheoverallprocessissupportedthroughtheproductionofbioenergyandhighvaluebioproducts.InternationallythereiscommercialandR&Dinterestindevelopingbio-basedproductsfrombiorefineries.DuPontandtheUniversityofTennesseeplantoconstructa

CHAPTER 12: BIOENERGY
AUSTRALIAN ENERGY RESOURCE ASSESSMENT
327
BOx 12.2 BIOFUELTECHNOLOGIESFORTRANSPORT
thesustainablemanagementofbiomassexploitationandtheavoidanceofpotentialnegativeenvironmentalimpactsofbioenergyfeedstocksproduction.
Theexpansionofthebioenergyindustrycanprovidegreenhouse gas savings and other environmental benefits,suchasimprovedbiodiversityaswellasopportunitiesforsocialandeconomicdevelopmentinruralcommunities.Thegreenhousegassavingsdependonthebiomassfeedstockcultivationmethod,changesinlanduse,thequantityoffossilfuelinputs and the technology used. Waste and residue biomassdoesnotrequiresignificantenergyinputandgenerallyhaslowergreenhouseemissionswhencompared to energy crops.
However,theexpansionofbioenergyproductioncreatessomechallenges,suchaspotentialcompetitionforlanduse,andbiomassuseforfoodandstockfeedandpotentialimpactsonbiodiversity.Asalreadynoted,theavailabilityofbiomassisalsoinfluencedbypopulationgrowth,diet,wateravailability,agriculturaldensityandtheenvironment(Hoogwijk2006).
Energy crops are dependent on land being available thatisnotbeingusedforforestryandagriculturalproducts,environmentalprotectionorurbanareas.Theamountofbiomassproduced(cropproductivity)isafunctionofthequalityoftheland,theclimate,waterresourcesandmanagementpractices.Increaseduseoffertilisersandpestcontrolto
pilot-scalebiorefineryinTennessee,UnitedStates(TheUniversityofTennessee2009).TheNationalRenewableEnergyLaboratoryintheUnitedStatesisinvolvedwithsixmajorbiorefinerydevelopmentprojectsthatarefocusedonintegratingtheproductionofbiomass-derivedfuelsandotherproductsinasinglefacility(NationalRenewableEnergyLaboratory2009).
CurrentlyinAustralia,onlyafewcompaniesarepursuingthelignocellulosicbiorefinerymodel. TheOilMalleeprojectsuccessfullyusesMalleeeucalyptsforproducingeucalyptusoil,activatedcarbonandbioenergyfrom1kWintegratedwoodprocessingdemonstrationplantinNarrogin,WesternAustralia(OilMalleeAssociation2009).TheMalleeeucalypts are planted as a complementary crop on landusedforgrowinggrain.There-sproutingabilityoftheMalleeeucalyptsallowforcoppicing(harvestingofbranches)everysecondyearindefinitelywithoutreplanting.Italsoprovidesanenvironmentalbenefitasthedeepmalleerootssoakupgroundwaterandassistinmitigatingdrylandsalinity(OilMalleeAssociation2009).
Biomass resources – reliable and environmentally sustainable supplyBiomassproductionisasignificantpotentialsourceofrenewableenergythatcanprovidegreenhousegasreductionbenefitswhenreplacingfossilfuels.However,akeyfactorinthegrowthofthebioenergysectoris
Conversiontechnologiesusearangeofbiochemicaland thermochemical processes to convert biomass intobiofuels.
First generation technologies use conventional processes,fermentationofsugarandstarchcropsforethanolproductionandtrans-esterificationofoilseedcrops,usedcookingoiloranimalfat(e.g.beeftallow)forbiodiesel.Thechemicalreaction(trans-esterification)involvesreactionofanoilyfeedstockwithanalcohol(methanolorethanol)andacatalysttoformesters(biodiesel)andglycerol.
Advancesinfirstgenerationbiofuelsarefocusedonfeedstocks,suchasGMcrops,newnon-edibleoilseedsandnewsugar(agave)crops.Theuseofnon-edibleoilseedplants,suchasJatropha,hasbeenexploredaspotentialfeedstockinthePhilippinesandIndia.Jatrophaproductionmaybeexpandedwithoutdirectlycompetingwithnaturalforestsorhigh-valueagriculturelandsusedforfoodproductionasitcangrownonlessfertileland(FAO2008).InAustralia,Jatrophaisbannedasitisaninvasiveplant.However,thereispotentialforusingother non-edible oilseed plants (e.g. Pongamia and Karanja).
second generation technologies use biochemical and thermochemical processes to convert lignocellulosicandalgaefeedstockstobiofuels.Biochemicalprocessesuseenzymesandmicro-organismstoconvertfeedstockstosugarpriortofermentationtoproduceethanol,butanolorpotentiallyotherfuels.Thermochemicalprocessesusespyrolysisandgasificationtechnologies.Pyrolysisprocessesproducebio-oil,syngasandbiochar.Thebio-oilisunstableandrequiresfurtherrefiningtoproducepetrol,biodieselandotherhighvaluechemicals.Gasificationmethodsproducesyngas,whichcanbefurtherprocessedusingFischer-Tropschsynthesistoproducesyndieselandaviationbiofuels.
InAustralia,R&Dintosecondgenerationtechnologiesandfeedstocksforbiofuelsisbeingundertaken(section12.4.3).CSIRO’sEnergyTransformedFlagshipisconductingresearchintothepotentialforasustainableandeconomicallyviablesecondgenerationbiofuelsindustry.Ithasa research program covering sustainable biomass production,thermochemicalconversion,enzymaticconversionandalgalfuels(CSIRO2009).

AUSTRALIAN ENERGY RESOURCE ASSESSMENT
328
alargeproportionofarablelandwouldhavetobedevotedtoenergycropsproduction.In2005,theEuropeanUnion(EU)used3percentofitstotalarablelandforbiofuelfeedstocksproducing4.9billionlitresofbiofuels,whichrepresentedaround1percentofliquidfuelsconsumptionintheEUtransportsector(EuropeanCommission2007;IEA2007b).
Firstgenerationbiofuelsfromenergycropsrequiresustainable agricultural practices to minimise environmentimpacts,theadoptionofcroprotationwithanenergycropdiversifiesthecropsgrown,whichcanimprovethelandfortraditionalcroppingandprovideahighvaluecrop(FAO2008).InAustralia,biofuelproductioniscurrentlytoolowtoaffecttheproductionofagriculturalcommodities.
Secondgenerationbiofuelswillbeproducedfromspecialisedenergycrops,suchastreecropsandalgae,aswellasfromresidueandthewastestreams.Theutilisationofresidueandwastematerialforbiofuelsrequiresnoadditionalland.Secondgenerationbiofuelfeedstocksmayalsobegrownonlessproductivelandsanddegradedagricultural land that do not compete directly withgrowingfood,stockfeedandfibrecrops(IEABioenergy2008).Somesecondgenerationfeedstocks,suchasalgaeandoilmallee,donotcompeteforfreshwaterresources.
Worldwide,investmentinsecondgenerationtechnologies is being undertaken to ensure these characteristics–environmentalandeconomicviabilityandavoidanceofcompetitionforproductivelandwithfoodandfibreproduction–areachievableandthereforethatthefutureproductionofbioenergycanproceedinasustainableway.
12.4.2OutlookforbioenergyresourcesThebioenergysupplychainiscomplexbecauseofitsinteractionwithothersupplychainssuchasagriculturalandforestry.Thereisscopetooptimisecurrentproductionsystemsforthebioenergymarketwithoutdivertingbiomassfromcurrentuses(e.g.plantationthinnings).Theproductionofsecondgenerationfeedstocksonlessproductiveorunder-utilisedlandscouldpotentiallyprovideeconomic,environmentalandsocialbenefits(O’Connelletal.2009a).Theuseofsuchlandmayprovideopportunitiesfor:farmerstodiversifyexistingsystems;thedevelopmentofindustriesinruralregions;andimprovementsinbiodiversity.Currently,secondgenerationbiofuelsarenotcommerciallycompetitiveinanycountry.ThetransitionfromfirsttosecondgenerationtechnologieswillrequiresignificantR&Dinvestmentwhich,inturn,willonlybeattractedbyanindustrywithasignificantandsustainablefuture.Theindustryneedstodemonstratethatthepotentialitoffersmeets these criteria.
improve crop yields may lead to increased pollution fromnutrientandbiocides/pesticides.
Residuesfromforestsandwoodprocessingandorganicwastestreamsarelargeuntappedresources,andeffectiveandsustainableuseoftheseresourcescanmakeacontributiontoenergysupplywhilereducingwastedisposalproblemsandavoidingthepotentialenvironmentalimpactsofdedicatedbioenergy crops.
Electricity and heat generation InAustralia,bioenergyforelectricityandheatgenerationisproducedpredominantlyfromby-productsofsugarproductionandwastestreams.Futureenergycropsmayincludetreecrops,woodyweedsandalgaeaswellasexpansionintocropandfoodresidues.Themainfactorsaretechnologycosts,reliablesupplyandconsistentqualityofbiomass.
Inurbanregions,capturingwastegasfromlandfillandsewagefacilitiesprovidesdualbenefitsofgenerating bioenergy and eliminating methane emissions.Thewastestreamsuppliestothesefacilitiesarerelativelyconstantandifwastegasesarenotcollectedandusedforbioenergyproduction,thegaswouldbeflaredorventedinto theatmosphere.Generationofelectricityandheatfrombiogaswillreduceemissionsandcanreplacetheuseoffossilfuelsasclean,costeffective,renewableenergy.
Similarly,conversionofanimalwastestobiogascan also provide energy and reduce environmental problemsassociatedwithanimalwastes.Theanaerobic digestion process can control manure odourandreduceharmfulwaterrun-off.
TheBerrybankpiggerynearBallarat,Victoriahasa0.225MWplantthathasbeengenerating3.5MWhofelectricityperdayfromanimalmanuresince1991.TheCleanEnergyCouncil(2008)estimatesthatabouthalfoftheexistingpigherdinAustraliaisatpiggeriesofsufficientscaletoalloweconomicimplementationofenergygenerationfromthewastestream,withalong-termpotentialfromthisindustryofabout200Gigawatt-hours(GWh)peryear.
Forestryandagriculturalresidueandwoodwastebioenergy plants rely on a constant supply and consistent gradeofbiomass.Woodwasteforelectricitygenerationispredominantlybyco-firedcoalplants.Forestresidues,woodprocesswastesandmunicipalsolidwasteshavethepotentialtobeusedaslignocellulosicfeedstockinsecond generation technologies.
Transport biofuelsFirstgenerationbiofuelsfromenergycropsareconstrainedbytheamountoflandavailableandthelimitedsupplyofsugarandstarchby-products,animalfatsandusedcookingoilfeedstocks.Forbiofuelstocontributesignificantlytotransportfuelconsumption,

CHAPTER 12: BIOENERGY
AUSTRALIAN ENERGY RESOURCE ASSESSMENT
329
Table 12.11 PotentialforstationarybioenergygenerationinAustralia
BiomassQuantity
Conversion technologieselectricity generation gWh/yr
2005–06 2010 2020 2050
agricultural related wastes
Poultry 94384000populationAD/RGE - 90 848
P - 207 207
Cattle(feedlots) 870025population AD/RGE;DC/ST - 112 442
Pigs 1801800population AD/RGE 1 22 205
Dairycows 1394000population AD/RGE - 22 89
Abattoirs 1285000t AD/RGE 337 1773
Nutshells - DC/T 1 1
Stubbleresiduesfromgrain and cotton crops
24000000t DC/ST;G/GT;P 47000
Bagasse(sugarcaneresidue)
5000000t DC/ST 1200 3000 4600
Sugarcanetrash,topsandleaves
4000000t DC/ST - 165 3200
energy crops
Algae - AD/RGE;P - -
Oil mallee - DC/ST;G/GT;P 112 484
Woody weeds
Camphorlaurel - DC/ST;G/GT;P 83 20
Forest residues
Nativeforest(public and private)
2200000tAD/RGE;DC/ST;briquettingandpelletising; G/GT;charcoalproduction;Co-firing
79 2442 4554Plantation (public and private)
3800000t
Sawmillandwoodchipresidues
2800000t
Pulp and paper mills wastes
Blackliquor - DC/ST 285 365 365
Woodwaste - DC/ST 60 85 85
Recycledpaperwetwastes - AD/RGE 2 8 8
Paperrecyclingwastes - DC/ST 12 48 48
Urban waste
Food and other organics 2890000tAD/RGE 13 126 565
DC/ST 16 141 189
Garden organics 2250000tP - 37 186
AD/RGE 29 84 275
Paper and cardboard 2310000tDC/ST - - 1548
P - 38 191
Wood/timber 1630000t DC/ST 45 295 1366
Landfillgas 9460000tSparkignitionengine; co-firing;flaring
772 1880 3420
Sewagegas 735454t AD/RGE;DC/ST 57 901 929
AD =anaerobicdigestion;RGE=reciprocatinggasengine;P=pyrolysis;DC=directcombustion;ST=steamturbine;G=gasification; GT=gasturbinesource: CleanEnergyCouncil2008

AUSTRALIAN ENERGY RESOURCE ASSESSMENT
330
environmentalproblemsfromwastedisposal,methaneemissionsandpollutionofwatersupplies.
TheCleanEnergyCouncilestimatedthatthelong-termpotentialforfeedlotcattleandpiggeriesareabout440GWhperyearand200GWhperyear,respectively.However,thereareuncertaintieswithmoisturecontentandsuitabilityforcombustionoranaerobicdigestion.Poultryfarmwasteisestimatedtohavealong-termpotentialintherangeof840GWhperyear.Thisestimatedoesnottakeintoaccountthat some operations may be too small to be viable orthatpoultrymanureisusedforfertiliser.
Inaddition,thereisalsothepotentialofsolidwastesfromabattoirs.TheCleanEnergyCouncilindicatedthatthereareapproximately0.77Mtto1.8Mtperyearofsolidwasteproducedfromabout150abattoirs.Ifby2020,30abattoirsimplementanaerobicdigestioncogenerationplants,these projects have the potential to produce about 340GWhperyear,withalong-termestimateof about1770GWhperyear.
Nativeforestwood waste is assumed to remain relativelyconstant:howeverthepotentialfromplantationwoodwasteshouldincreaseinlinewithplantationexpansion.Australiangovernments,atalllevels,haveestablishedregulatorymechanismsconcerningtheeligibilityforforestwoodwasteforelectricitygenerationinordertomanagethesustainableuseoftheseproducts.
Urban waste,includingfood,garden,urbantimber,paperandcardboardwastes,issteadilygrowingandhassignificantpotentialforenergygeneration.Thedecompositionofthesewastesinlandfillresultsinmethanegeneration,whichisnotappropriatelycapturedandutilised,particularlyinolderandsmallerlandfillsites.In2002–03approximately9.5Mtperyearoforganicurbanwastewassenttolandfill.Thepotentialelectricitygenerationfor9Mtofurbanwasteis103GWh,withalong-termestimateofabout4300GWh(CleanEnergyCouncil2008).
Thereispotentialforgrowthofbiogaspowergenerationfromlandfillsitesandsewagetreatmentplantsinurbanandruralcentresforlocaluse.Convertingbiogastoenergywouldprovidedualbenefitsofenergysupplyandreducedgreenhousegasemissions.Ifthesewastesarenotcollected andusedforbioenergyproduction,thegaswould be flared or vented into the atmosphere.
Thereisanumberofpotentialenergy crops that mayprovidefuelforfuturebioenergyaswellasprovidingenvironmentalbenefits.Theintegrationofcomplementaryenergycropsandwoodyperennialsintoexistingagriculturalsystemsmaybeabletoreduce dryland salinity and land erosion.
TheOilMalleeprojectinWesternAustralia
electricity and heat generationCurrentlyelectricityisgeneratedpredominantlyfrombagasseandlandfillandsewagesitesandtoalesserdegreewoodwaste,pulpandpapermillwaste.TheCleanEnergyCouncil(2008)identifiedsignificantpotentialforgrowthinbioenergyproductionfromwastestreams,suchaslandfillandsewagegasandurbanwaste.
Anappraisalofbioenergyresources,primarilywastestreams,forstationaryenergywasundertakenbytheCleanEnergyCouncilin2008toestimatethepotentialby2020andinthelong-term(2050). Theassessmentisbasedonbiomassquantitiespotentiallyavailablein2005–06.Thebiomassfeedstocksaregroupedintoagriculturalrelatedwastes,energycrops,woodyweeds,forestresidues,pulpandpapermillwastes,andurbanwastes(table12.11).
agricultural related wastes in total are a very large resourcebutcurrentlyarenotusedasfeedstocks.Theresourcesarewidelydispersedandcanhavearangeofalternativeusesincludingcompostingandfeedforanimals.
Thesugarcaneindustry,alreadyoneofthefewindustriesselfsufficientinenergythroughitsuseofbagasse-firedcogeneration,hasthepotentialtoincreaseelectricitygenerationefficiencywithintegratedgasificationcombinedcycletechnologyaswellasbiomassexpansiontoincludesugarcanetrash,topsandleaves.
Cropresiduesfromgrainandcottoncropsareapotentialresource.However,cropscanbesubjecttolargeannualvariationsofquantitiesproducedduetoenvironmentalandclimaticfactors.Anoptiontoreducethevariabilityofresourcesistoprocessawiderangeofbiomassmaterialsuchasresiduesfromgrain,rice,cottoncropsandleft-overplantmatterfromvegetablesandfruits.
Thepotentialestimatedstubbleresiduesthatcanbecollected,takingintoaccountthataproportionofthecropisleftonthelandformaintenanceofsoilhealth,isestimatedtobe24Mtperyear.However,thehighcostoftransportofahighlydispersedresourcemeansthattherewillbelittleornocontributionfromthissectorto2020.Forthissectorto contribute to energy production there needs to be furtherinvestigationofenergyconversionprocesses(e.g.gasificationandpyrolysis)andwaystoreducetransportcosts.Along-termestimateofpotentialenergyis47000GWhperyear(CleanEnergyCouncil2008).
Largescalelivestockfeedlots,piggeries,dairyandpoultryfarmswiththeirmixedwastestreamsofanimalbeddingandmanurearesuitableforgenerating bioenergy. Waste material can be used to produce stationary energy and assist in reducing
CHAPTER 12: BIOENERGY
AUSTRALIAN ENERGY RESOURCE ASSESSMENT
331
possibilities.Currenttechnologiescanproduce280to560litresofethanolpertonneofbiomassand400litresofbiodieselpertonneofoilseeds.Thesecondgenerationtechnologieswilluseawiderrangeofbiomassfeedstockstoproduceethanol,biodiesel,synfuelandgenerateelectricity.Thatreportestimatedthatapproximately55Mtofstubbleresidue biomass per year can be produced based on20percentofthecurrent45millionhectaresofgrazingandcroppingland,andthatthereispotentiallyabout6tonnesofbiomassperhectareperyear.Thisbiomassresourcecouldproduceapproximately82TWhperyearofelectricityor17GLperyearofsyngasolineandsyndiesel.
12.4.3OutlookforbioenergymarketBioenergyhasthepotentialtomakeagrowingcontributiontoAustralia’senergyuse,andtoelectricitygenerationinparticular.Australia’scurrentbioenergyproductionisprincipallysourcedfromby-productsofproductionprocessesorwasteproducts.Therearestillunder-utilisedwasteproductsthatmaybeusedforbioenergyinthefuture.
InABARE’slatestenergyprojections,whichinclude theRenewableEnergyTarget,a5percentemissionsreductiontarget,andothergovernmentpolicies,bioenergy use in Australia is projected to increase by 60percentto340PJin2029–30,representing anaverageannualgrowthrateof2.2percent (figure12.15).
successfullydemonstratedtheuseofMalleeeucalyptstoproduceeucalyptusoil,activatedcarbonandgenerateelectricity.Woodyweeds,suchasCamphorLaurel,areabundantbuteitherneedresearchintotheirsuitabilityasfeedstock,oraretoodispersed in nature to be economical to harvest.
R&Dintoalgaeisdrawingattentionbecauseofitspotentialhighhydrocarboncontent,highoilyieldsandabilitytobegrowninsalineandwastewater.Algaegrownandharvestedfrompurpose-builtpondsandphotobioreactorshasthepotentialtobeafeedstockforbiofuelsandpowergeneration.
Transport biofuelsFirstgenerationbiofuelsarenotexpectedtomakealargecontributiontoAustralia’sfuturebiofuelssupplyasthereislimitedavailabilityoflowcostfirstgenerationfeedstocks.Secondgenerationtechnologiesmayprovideagreaterrangeofbiomassfeedstocksandpotentialgreenhousegasemissionssavings.Secondgenerationtechnologieswilluselignocellulosicmaterial,specialisedcropssuchasoilmallee,non-foodcomponentsofcropsandalgae.
O’Connelletal.(2009b)estimatedyieldsofbiofuelsandelectricitygenerationfromdifferentfeedstockforthefirstandsecondgenerationtechnologies(table12.12).TheanalysiswasrestrictedtoQueenslandanddidnotprovidespatiallyexplicitanalysisofbiofuelfeedstockproduction.However,itdoesprovideuseful‘firstcut’estimatesofthe
Table 12.12 Estimatedenergyandfuelyieldsfordifferentfeedstocks
Feedstock ethanol L/t Biodiesel L/t synfuel* L/t electricity mWh/t
First generation
Cereals 360
Oilseeds 400
Sugarcane
Molasses 280
Sugar 560
second generation
Cereals 335 246 1.02
Woodwaste 240 246 1.35
Algae 495 0.27
Sugarcane
Whole plant 465 246 0.80
Bagasse 300 246 0.80
Forestry
Sawmillresidues 233 246 1.35
Harvest residues 233 246 1.35
Pulpwood 240 246 1.35
Bioenergyplantations 260 246 1.35
Grasses 323 246 1.02
*Production usinggasification,gasconditionandcleaningfollowedbyFischerTropschsynthesisandrefiningtoproducesyngasolineandsyndieselsource: O’Connelletal.2009b

AUSTRALIAN ENERGY RESOURCE ASSESSMENT
332
Electricity and heat generationThereareseveralproposedbioenergypowerplantsusingarangeofbiomassfeedstocks,suchasanimal,municipalandsawmillandpulpmillwoodwastesandforestryandplantationsresidues.Thereare research projects on methane capture systems fromuncoveredeffluenttreatmentlagoonsandenergygenerationfromintensiveanimalindustriessuchasdairyfarms,beefcattlefeedlotsandpiggeries.
InVictoria,thereisaproposaltousefire-affectedtreeresiduesfrombushfire-affectedareas. TreePowerAustraliahasundertakenafeasibilitystudyfora1MWbiomassfiredOrganicRankineCyclecogenerationpowerplantnearMarysville,Victoria.Thecompanyisconsideringatrigenerationoption,inwhichsome(orall)oftheheatoutputwoulddriveanabsorptionchillerprocessfor cooling outputs.
Transport biofuelsInAugust2009,theAustralianGovernmentannouncedA$15millionfundingforprojectsundertheSecondGenerationBiofuelsResearchandDevelopmentProgramtodemonstratethesustainabledevelopmentofthebiofuelsindustry. Theprojectsincluderesearchingbiofuelfrommicroalgae,developingapilot-scalebiorefineryforsustainablemicroalgalbiofuelsandvalueaddedproducts,investigatingtheproductionofbiofuelsfrommalleebiomassbypyrolysis,developingasugarcanebiomassinputsystemforbiofuelproduction andcommercialdemonstrationoflignocellulosics to stable bio-oil.
RuralIndustriesResearchandDevelopmentCorporation(RIRDC)hasaBioenergy,Bioproductsand Energy program to conduct research into
Australia’slargepotentialbioenergyresources,theRenewableEnergyTargetandthepotentialcommercialisationofsecondgenerationtechnologiesareallexpectedtodriveanincreaseinelectricitygenerationfrombioenergy.However,growthislikelytobeconstrainedtosomeextentbycompetitionforlandandwaterresourcesandlogisticalissuesassociatedwithhandling,transportandstorage.Somesecondgenerationfeedstockssuchasalgaeandsolidbiomasswastesmaysubstantiallyreducetheproblemsassociatedwithlanduseandwaterresources.
Electricitygenerationfrombioenergy(excludingcogeneration) is projected to increase at an average rateof2.3percentperyearfrom2TWhin2007–08to3TWhby2029–30(figure12.16).Morethan60percentoftheprojectedgrowthintheuseofbioenergyforelectricitygenerationisprojectedtooccur in Queensland.
Bioenergy project developmentsAsatOctober2009,therewerethreeprojectsunderdevelopmentinAustralia(table12.14).InTasmania,Gunns Ltd plans to develop a large cogeneration powerplantof200MWcapacityatitsBellBaypulpmill.WABiomassPtyLtdplanstoconstructandoperatea40MWpowerplantfuelledbyupto380000tonnesperyearofplantationwasteinWesternAustralia.NationalBiodieselLtdplansto construct a soybean processing and biodiesel productionfacilityatPortKembla,NewSouthWales.Thefacilitywillprocessoveramilliontonnesofsoybeanperyearintohighqualitysoybiodiesel®,soybeanmeal(animalfeed)andpharmaceuticalgrade vegetable glycerine.
Inaddition,thereisanumberofR&Dprojectsinvestigating bioenergy technologies and biomass potential across Australia.
350
100
150
200
250
300
0
50
0
0.6
1.3
1.9
2.5
3.1
3.8
4.4
5.0
%PJ
1999-00
2000-01
2001-02
2002-03
2003-04
2004-05
2005-06
2006-07
2007-08
2029-30
Year
AERA 12.2
Bioenergyconsumption (PJ)
Share oftotal (%)
0
1
2
3 1.0
0.5
0
AERA 12.3
Bioenergy electricitygeneration (TWh)
Share oftotal (%)
1999-00
2000-01
2001-02
2002-03
2003-04
2004-05
2005-06
2006-07
2007-08
2029-30
Year
TWh
%
Figure 12.15 Projectedprimaryconsumptionofbioenergy
source: ABARE2009a;ABARE2010
Figure 12.16 Projectedelectricitygenerationfrombioenergy
source: ABARE;ABARE2010

CHAPTER 12: BIOENERGY
AUSTRALIAN ENERGY RESOURCE ASSESSMENT
333
12.5ReferencesABARE(AustralianBureauofAgriculturalandResourceEconomics),2009a,Australianenergystatistics,Canberra,August
ABARE,2009b,Electricitygenerationmajordevelopmentprojects—October2009listing,Canberra,November
ABARE,2010,Australianenergyprojectionsto2029–30,ABAREresearchreport10.02,preparedfortheDepartmentofResources,EnergyandTourism,Canberra
BattenDandO’ConnellD,2007,BiofuelsinAustralia:Someeconomicandpolicyconsiderations,RIRDCPublicationNo07/177,RuralIndustriesResearchandDevelopmentCorporationandCSIRO,Canberra
CleanEnergyCouncil,2008,Australianbioenergyroadmapandbiomassresourceappraisal,<http://cleanenergycouncil.org.au/bioenergy/>
CSIRO,2009,NaturalResearchFlagshipsEnergyTransformed,<http://www.csiro.au/org/EnergyTransformedFlagship.html>
EESI(EnvironmentalandEnergyStudyInstitute),2009a,Issuebrief:Biomassco-firing:Atransitiontoalowcarbonfuture,March
EESI,2009b,IssueBrief:Reconsideringmunicipalsolidwasteasarenewableenergyfeedstock,July
EuropeanCommission,2007,BiofuelsintheEuropeanUnion:Anagriculturalperspective,EuropeanCommissionDirectorate-GeneralforAgricultureandRuralDevelopment,Brussels
FAO(FoodandAgricultureOrganizationoftheUnitedNations),2008,Biofuels:prospects,risksandopportunities,TheStateofFoodandAgriculture,Rome
GeoscienceAustralia,2009,RenewableEnergyGeneratorsinAustralia,onbehalfofDepartmentofEnvironment,Water,HeritageandtheArts<http://www.ga.gov.au/renewable>
GrabowskiP,2004,Biomassco-firing:ApresentationtotheDepartmentofEnergyandUnitedStatesDepartmentofAgricultureTechnicalAdvisoryCommittee,11March
HoogwijkM,2006,Globalbiomassavailability:Assumptionandconditions,IEABioenergyExCo58,4October
anddevelopsustainableandprofitablebioenergy
andbioproductsindustries.Researchhasbeen
completedonidentifyinganddevelopingAustralian
nativespeciesasbiofuelcropsandresearchis
inprogressinevaluatingbiodieselpotentialof
Australiannativeplants,Indianmustardseedand
biofuelproductionofgiantreedgrass.RIRDCis
compilingadetailedlistingofprojectscurrently
underwayinAustralia.
TheNationalCollaborativeResearchInfrastructure
Strategy(NCRIS),anAustralianandStategovernment
partnershipisenhancingAustralia’scapacityto
producebiofuelsderivedfromnon-foodbiomass.
NCRISinvolvesthedevelopmentoffiveintegrated
sitestoprovideresearcherswithaccesstoquality
facilities,technologicallyadvancedequipment,and
technicalexpertise.MacquarieUniversity,University
ofSydneyandUniversityofNewSouthWalesare
providingaccesstofacilitiesfortheconversionof
lignocellulosicandmicroalgaebiomasstobiofuels
(ethanolandbiodiesel).Twopilot-scalemanufacturing
facilitiesarealsobeingestablished:
• abiomassbiorefineryatQueenslandUniversity
ofTechnology,fortheconversionoflignocellulosic
biomasstoethanol,ligninandothercommodities
and;
• aphotobioreactorfacilityatSouthAustralian
ResearchandDevelopmentInstituteforthe
demonstrationofmicroalgaebiomassculture
forbiodieselproduction.
TheBiofuelsCooperativeResearchCentre,an
initiativeoftheBioEnergyResearchInstituteat
SouthernCrossUniversityisresearchingnon-food
cropsthatwillgrowwithareducedrelianceonwater,
suchasAustraliannativespecies,whichhavethe
advantageofadaptableformarginalgrowingareas.
Table 12.14 Bioenergydevelopmentprojects,asatOctober2009
Project Company Location status start up Capacity Capital expenditurea$million
BellBayPowerPlant
Gunns Ltd NorthofLaunceston,Tas
On hold due to uncertainty ofpulpmillconstruction
NA 200MW NA
WABiomassPowerPlant
WABiomassPty Ltd
Manjimup,southwestWA
Feasibility study under way
NA 40MW 110
SoybeanProcessing andBiodieselProduction Facility
NationalBiodieselLtd
PortKembla,NSW
Developmentapproval
NA Soybiodiesel®288MLper
year
240
Note: Onlyincludespowergenerationprojectsforwhichgenerationcapacityisproposedtoexceed30MWsource: ABARE2009b

AUSTRALIAN ENERGY RESOURCE ASSESSMENT
334
ofgreenhousegasmitigationandcarbonbiosequestrationopportunitiesfromrurallanduse,ReporttotheQueenslandstategovernment,June,<http://www.csiro.au/resources/carbon-and-rural-land-use-report.html>
O’ConnellD,BattenD,O’ConnorM,MayB,RaisonJ,KeatingB,BeerT,BraidA,HaritosV,BegleyC,PooleM,PoultonP,GrahamS,DunlopM,GrantT,CampbellPandLambD,2007,BiofuelsinAustralia–anoverviewofissuesandprospects,RuralIndustriesResearchandDevelopmentCorporationandCSIRO,Canberra
OilMalleeAssociation,2009,Theoilmalleeproject,Narroginbioenergyplant,accessedDecember2009,<http://oilmallee.org.au/index.html>
REN21,2009,RenewablesGlobalStatusReport:2009Update,Paris<http://www.ren21.net/pdf/RE_GSR_2009_Update.pdf>
SaddlerH,DiesendorfMandDennissR,2004,AcleanenergyfutureforAustralia,EnergyStrategiesfortheCleanEnergyFutureGroup,<http://www.enerstrat.com.au>
StucleyCR,SchuckSM,SimsRE,LarsenPL,TurveyNDandMarineBE,2004,BiomassenergyproductioninAustralia:Status,costsandopportunitiesformajortechnologies,RIRDCPublicationNo04/031,RuralIndustriesResearchandDevelopmentCorporation,BioenergyAustralia,Canberra
TheUniversityofTennessee,2009,OfficeofBioenergyPrograms,Biorefinerygroundbreaking,accessedDecember2009,<http://www.utbioenergy.org/TNBiofuelsInitiative/Biorefinery+Groundbreaking.htm>
WardenACandHaritosVS,2008,FuturebiofuelsforAustralia:Issuesandopportunitiesforconversionofsecondgenerationlignocellulosics,RIRDCPublicationNo8/117,RuralIndustriesResearchandDevelopmentCorporation,Canberra
WildA,2009,BiofuelsandcompetitioninAustralia,CSIRO,accessedOctober2009,<http://www.csiro.au/science/biofuels-and-competition.html>
WorldwatchInstitute,2006,Biofuelsfortransportation:Globalpotentialandimplicationsforenergyandagricultureinthe21stCentury,<http://www.worldwatch.org/publs/biofuels>
IEA(InternationalEnergyAgency),2006a,Energytechnologyperspectives2006,OECD/IEA,Paris
IEA,2006b,Renewableenergy:R&DprioritiesinsightsfromIEAtechnologyprogrammes2006,OECD/IEA,Paris
IEA,2007a,IEAenergytechnologyessentials:BiomassforpowergenerationandCHP,OECD/IEA,Paris,January
IEA,2007b,IEAenergytechnologyessentials:Biofuelsproduction,OECD/IEA,Paris,January
IEA,2008,Energytechnologyperspectives2008,OECD/IEA,Paris
IEA,2009a,Worldenergybalances2009,OECD/IEA,Paris
IEA,2009b,Worldenergyoutlook2009,OECD/IEA,Paris
IEABioenergy,2007,Potentialcontributionofbioenergytotheworld’sfutureenergydemand,OECD/IEA,Paris
IEABioenergy,2008,From1stto2ndgenerationbiofueltechnologies:AnoverviewofcurrentindustryandRD&Dactivities,OECD/IEA,Paris,November
IEABioenergy,2009a,Bioenergy–asustainableandreliableenergysource:Areviewofstatusandprospects,OECD/IEA,Paris
IEABioenergy,2009b,Bioenergy–asustainableandreliableenergysource:Mainreport,OECD/IEA,Paris,December
MassachusettsTechnologyCollaborative,2009,Bioenergytechnologies,<http://www.masstech.org/cleanenergy/biomass/technology.htm>
NationalRenewableEnergyLaboratory,2009,Biomassresearch:Whatisabiorefinery?<http://www.nrel.gov/biomass/biorefinery.html>
O’ConnellD,BraidA,RaisonJ,HandbergK,CowieA,RodriguezLandGeorgeB,2009a,Sustainableproductionofbioenergy;Areviewofglobalbioenergysustainabilityframeworksandassessmentsystems,RIRDCPublicationNo09/167,RuralIndustriesResearchandDevelopmentCorporationandCSIRO,Canberra,November
O’ConnellD,MayB,FarineD,RaisonJ,HerrA,O’ConnorM,CampbellPK,TaylorJ,DunlopM,PooleMandCrawfordD,2009b,Substitutionoffossilfuelswithproductionofbiofuelandbioenergyfromrenewableresources;InEadyS,BattagliaM,GrundyM,andKeatingB,(eds),Ananalysis