Identifying Crash Location from Chicago Traffic Crash Data ...

August 1, 2007 TRAFFIC ENGINEERING MANUAL
11-1
Chapter 11TRAFFIC CRASH SURVEILLANCE
TABLE OF CONTENTS Page
11-1.00 INTRODUCTION . . . . . . . . . . . . . . . . . . . . . . . . . . . . . . . . . . . . . . . . . . . . . . . . . . .11-31.01 Purpose1.02 Scope1.03 Transportation Information System (TIS)1.04 Chapter Organization
11-2.00 ACCIDENT REPORT FORMS . . . . . . . . . . . . . . . . . . . . . . . . . . . . . . . . . . . . . . . . .11-32.01 Responsibilities2.02 Accident Report Forms
11-3.00 ACCIDENT REPORT PROCESSING . . . . . . . . . . . . . . . . . . . . . . . . . . . . . . . . . . . .11-43.01 Department of Public Safety3.02 Department of Transportation
11-4.00 CRASH DATA REPORTS . . . . . . . . . . . . . . . . . . . . . . . . . . . . . . . . . . . . . . . . . . . . .11-54.01 T.I.S. Reports4.02 Data Requests4.03 Other Reports4.04 General Procedures and Services
11-5.00 HIGHWAY SAFETY IMPROVEMENT PROGRAM PROCESS . . . . . . . . . . . . . . . .11-115.01 Hazard Elimination Safety5.02 Safety Capacity
11-6.00 REFERENCES . . . . . . . . . . . . . . . . . . . . . . . . . . . . . . . . . . . . . . . . . . . . . . . . . . . . .11-11LIST OF FIGURES

August 1, 2007 TRAFFIC ENGINEERING MANUAL
11-2
Figure Description Page11.1 Traffic Accident Report (Police) . . . . . . . . . . . . . . . . . . . . . . . . . . . . . . . . . . . . . . . . . . . . . . .11-1311.1A Traffic Accident Report (Police) . . . . . . . . . . . . . . . . . . . . . . . . . . . . . . . . . . . . . . . . . . . . . . .11-1511.1B Traffic Accident Report (Police . . . . . . . . . . . . . . . . . . . . . . . . . . . . . . . . . . . . . . . . . . . . . . .11-1611.2 Minnesota Motor Vehicle Accident Report (Citizen) . . . . . . . . . . . . . . . . . . . . . . . . . . . . . . .11-1711.2A Minnesota Motor Vehicle Accident Report (Citizen) . . . . . . . . . . . . . . . . . . . . . . . . . . . . . . .11-1811.3 Typical Interchange Element Sketch . . . . . . . . . . . . . . . . . . . . . . . . . . . . . . . . . . . . . . . . . . .11-1911.4 Typical Collision Diagram . . . . . . . . . . . . . . . . . . . . . . . . . . . . . . . . . . . . . . . . . . . . . . . . . . .11-20

August 1, 2007 TRAFFIC ENGINEERING MANUAL
11-3
11-1.00 INTRODUCTION
11-1.01 Purpose
Crash records and their analysis are an essential element in any traffic safety program for several reasons. First,crash studies aid in locating high crash locations on the existing highway system. Second, crash experienceprovides an evaluation of design features. Third, effective planning is based, in part, on traffic volumes and crashrates. Last, an analysis of crash records may have a direct influence on the budgeting of improvements. The DistrictOffices are responsible for most crash analyses. The purpose of this chapter is to describe the existing dataavailable to the crash analyst, how it may be obtained, how it may be used, and how it may affect the HighwaySafety Improvement Program (H.S.I.P.).
11-1.02 Scope
This chapter describes the types of crash reports that are available to the crash analyst, presents guidelinesconcerning crash rate calculations, and discusses the crash analysis services available from the use of theTransportation Information System (T.I.S.). The use of crash analysis as it applies to the H.S.I.P. will be discussedlater in the chapter.
11-1.03 Transportation Information System
The T.I.S. is a computer system that is used to relate several types of transportation data. The Accident AnalysisSubsystem allows roadway files and crash files to be tied together. The Accident Subsystem details information oncrash type, time, date, injuries, and vehicles involved. The Intersection Subsystem includes data on traffic controldevices and intersection types. The Section Subsystem is used for analyzing crashes along portions of theroadways.
11-1.04 Chapter Organization
In this chapter the crash analysis process will be described. Crash reporting forms and processing procedures aredescribed; crash data reports are discussed; and crash analysis procedures using T.I.S. are outlined; and the H.S.I.P.procedures are discussed.
11-2.00 CRASH REPORT FORMS
11-2.01 Responsibilities
Subdivision 7 of Minnesota Statutes (M.S.) Section 169.09 requires the driver of a vehicle involved in an crash(resulting in injury, death, or property damage in excess of $1000) to file a written report of the crash (CitizenReport) with the Department of Public Safety (DPS) within 10 days of the crash occurrence. Subdivision 8 requiresthe law enforcement officer investigating an crash resulting in injury, death, or total property damage in excess of$1000 to submit a report (Police Report) to the DPS. This report is also due within 10 days of the crash occurrence.
11-2.02 Crash Report Forms
Figures 11.1, 11.1A and 11.1B are copies of the Police Traffic Accident Report form and its overlay sheets. Thisform is used by all law enforcement agencies when reporting a crash to DPS. These forms as well as the CitizenAccident Report form, shown in Figures 11.2 and 11.2A, are used for entering data.
CHAPTER 11 - TRAFFIC CRASH SURVEILLANCE

August 1, 2007 TRAFFIC ENGINEERING MANUAL
11-4
11-3.00 CRASH REPORT PROCESSING
11-3.01 Department of Public Safety (DPS)
1. Receipt of Accident/Crash Reports
Crash reports received by the DPS are channeled through the Drivers Compliance Section of the Drivers &Vehicles Services Division. Many law enforcement agencies also retain a copy of the police report form. Thestubs of the citizen reports containing insurance information are sent to the insurance companies forverification.
2. Receiving Line
All reports (Citizen and Police) received by the DPS are passed through the receiving line. It is at this stagewhere they are combined into files and numbered. Crashes are numbered using an eight- digit format basedon the Julian date. T.I.S. adds a decade number creating a nine-digit Crash number). These are the crashnumbers by which each crash is filed and stored by the DPS. All major participants of a crash that are notMinnesota licensed drivers (pedestrians, bicyclists, owners of damaged property, out-of-state drivers, etc.) arecataloged on an application of an Alpha mini-computer housed at the Bureau of Criminal Apprehension.
3. Code-Locating Units
Only qualified traffic crashes (death, injury, or $1000 total damage occurring on trafficways by motorizedvehicles) are entered on the Accident Records database. Individual crashes are coded and geographicallylocated in this process. Locations of crashes are pinpointed using the reference point system. Crashesoccurring at or near an interchange are additionally coded using interchange element numbers. A typicalinterchange element sketch is shown in Figure 11.3. Coders enter drivers license numbers and other pertinentcrash information, using the police report as their primary data source. All data is entered on the AccidentRecords database (an Alpha 6410 system) located at the Bureau of Criminal Apprehension. Every night, allrecords entered for the day are passed on to the Driver’s License, Motor Vehicle, and T.I.S. databases on theIntertech mainframe to verify driver licenses, motor vehicle plates and reference point coordinates forcorrectness. The driver records in the Driver License database are updated with the eight-digit crash referencenumber, crash date, crash severity codes, and alcohol use codes. After the data is verified, appropriateinformation is brought back and placed on the Accident Records database. An error edit of incorrect data isrun each morning. Department of Transportation personnel ensure that all crashes are included in the T.I.S.database by performing updates as needed.
4. Insurance Inspection
Insurance inspection is the means by which the DPS verifies a driver's insurance coverage. Data on ownerswho have not submitted a report with insurance information are entered on a tickler record of the DriverLicense database. Computer generated letters, that ask for a report and insurance information, are mailed toowners of motor vehicles. The owner has fifteen working days to respond. If no response is received, thecomputer then generates a notice of proposed motor vehicle license plate revocation. After ten working days,if still no response, the computer generates the revocation notice. The tickler record is deleted upon proof ofinsurance coverage given by the auto owner.
5. Electronic Imaging of Reports
All crash files, once processed, are sent to the Operations Support Unit of Driver & Vehicle Services (DVS)to be scanned and electronically imaged. Access to the imaged crash files is made available to governmentagencies for accident analysis.

October 31, 2009 TRAFFIC ENGINEERING MANUAL
11-5
11-3.02 Department of Transportation
The Department of Transportation (Mn/DOT) keeps a history of motor vehicle crash reports from 1984 to thepresent in the Office of Traffic, Safety, and Technology (OTST). In 1998, DPS switched crash report storage frommicrofilm to scanned computer files. Copies of crash reports are available to the Districts or local road authoritiesupon request. Caution must be exercised to maintain the confidential status of individual crash reports. Subdivision13 of M.S. 169.09 should be consulted concerning this requirement.
11-4.00 CRASH DATA REPORTS
There are a number of general crash summation reports produced for Department use. The T.I.S. database offers avariety of these to traffic engineering personnel. The crash files used by the T.I.S. allow access to the systemthrough a series of files. The user can gain access by date, location, or by individual crash number. Informationrequested and received may consist of crash details, vehicle characteristics, injury summaries or a combination ofthese. While it is not possible to explain all of the crash reports available, a brief summary of these crash reportsfollows
For more information please refer to the T.I.S. User's Manual.
11-4.01 Transportation Information System Reports
Crash listings are formatted in columns and rows of data. Code lists summarizing information on the listings canbe provided in the printout. The lists contain a start-date and end-date specifying the time period under study. Alist of elements printed for each crash on the listing is available in the T.I.S. User’s Manual.
1. List-Accident-By-Reference-Point
Prints a list of crashes for the roadway and time period specified. The crashes are subjected to selectioncriteria if only crashes of a like nature are desired.
2. Find-Accident-Clusters
Locates a "cluster" of crashes along a roadway. A cluster is a grouping of crashes that occurred within a givendistance of each other. The number of crashes, the time period, and the length of roadway are user-definedparameters.
3. Accident-Matrix-Summary
Produces general purpose summaries of crashes. Summaries can be broken down by one, two or three dataelements. The summary provides system, vehicle type, or driver type studies.
4. Compute-Accident-Rates
This command reports crash statistics for user-specified sections of roadway and user-specified time. Itcombines crash data and traffic volume to provide information on crash rates.
5. Intersection-Accident-Analysis Capabilities
The Intersection/Interchange (I/I) files contain records for various intersections and interchanges for whichcrash analysis information is available. The I/I file is a highly flexible tool in T.I.S. A great deal of flexibilityis provided in the software for performing many different types of analysis. As a result, a large number ofuser-specified parameters are available in the CREATE file and before the PRINT file function.
Three types of reports can be obtained from the I/I crash analysis software: showing data for a singleintersection, for a group of intersections, or for several groups of intersections.

October 31, 2009 TRAFFIC ENGINEERING MANUAL
11-6
6. Section-Accident-Analysis CapabilitiesThe section file contains information required to define sections of roadway for crash analysis reports. It ismaintained by individual construction districts for analysis purposes, and is currently available for TrunkHighways only. Its data elements include codes describing general geometric design and environment, speedlimit, route system, route number and reference points, construction district and categorization codes as wellas a verbal description.
7. List-Accidents-By-Accident-NumberIt lists crash records specified by crash number. It allows a user to print every data element in individual crashrecords.
8. Bridge-Accident-Analysis CapabilitiesThis aids user in analyzing crashes that occurred at various types of bridges. A great deal of flexibility isprovided for performing many different types of analyses.
11-4.02 Data Requests
Requests for crash information are received frequently by traffic personnel. Data requested may involve specificareas of study, from annual reports prepared by the traffic office for distribution, to site-specific information oncrash rates and numbers. Requests are received from individuals as well as various types of businesses that requirecrash data.
Any request, regardless of the source, for information concerning a specific location on the trunk highway systemshould be directed to the District Traffic Engineer in the appropriate District. General requests for statewide orsystem wide data should be referred to OTST.
Any request, regardless of source, seeking information NOT relating to the trunk highway system, should bedirected to the local road authority for processing. This guarantees the local government agency will have fullknowledge of all information being provided to the requester. If requested by the local agency, the district or OTSTmay assist them in completing the request.
When information is being requested as the result of a crash, personal injury, or property damage incident, theprocedure outlined in Section 12-6.02 shall be followed.
Crash information requests can be reported in tabular form or illustrated with Geographical Information Systems(G.I.S.) Maps.
11-4.03 Other Reports
1. Minnesota Motor Vehicle Crash FactsThis report is published annually by the Office of Traffic Safety within the DPS. It is a detailed examinationof motor vehicle crashes occurring on Minnesota roadways based on crash reports submitted by drivers andinvestigating police officers to the DPS. The report contains a discussion of apparent crash trends, andgraphical and tabular displays of crash data. Its purpose is to provide summary information about crashesoccurring in Minnesota.
2. Freeway Volume Accident Study
This report is prepared annually by DOT personnel located at the Regional Traffic Management Center(RTMC). It is a summary of data on the operating characteristics of freeways within the Twin CitiesMetropolitan Area. Comparisons are made each year to determine crash rate trends for specific freewaysections. These areas are also ranked in order of the highest crash rates to determine where problem areasexist. It is useful for the monitoring of existing systems, establishing traffic management priorities, andidentifying problem sections in the Twin Cities area.

October 31, 2009 TRAFFIC ENGINEERING MANUAL
11-7
11-4.04 General Procedures and Services
The Traffic Safety section of OTST serves as a direct contact with DPS regarding all available crash record data.Through this section, information is available upon request to the Districts and other agencies.
1. General Procedures
Considerable effort is maintained at all times to provide the traveling public a safe roadway system. Effortsto reduce crashes generally involve several steps: location selection, study of possible improvements to thatlocation, estimate of the benefit/cost of the improvement, selection and programming of locations to beimproved, and finally, a determination of the improvement upon completion of the project. District personnelperform the foot work, in addition to making funding decisions and designation.
The first step, location selection, is determined by crash experience. The number of crashes, severity ofcrashes, crash rate, crash cost, crash details, or a combination or these can be used to weight crash experience.The cost of the improvement project is then compared to the benefit to be derived from the improvement. Abenefit/cost ratio greater than one indicates that the proposed improvement does not cost more than the costof the crashes that may be eliminated by the improvement.
2. Crash Rates and Crash Severities
The crash rate can be determined using the T.I.S. database by roadway sections, at specific locations, or byusing the "clusters" command to determine areas with high crash counts. COMPUTE-ACCIDENT-RATESreports crash statistics for sections of roadway within a specified time period. Both the roadway section andtime period are user-specified. The program retrieves traffic volume and crash data, combining them toprovide crash rate information. Crash rates, severity rates and fatality rates are also provided. The user mustspecify the sections to be analyzed, using the ROUTES subcommand.
The crash rate (CR):
CRsection = 1,000,000 x CRASHADT x Length x Days
CRintersection = 1,000,000 x CRASHADT x Days
CRASH = Number of crashes for the sectionDays = Number of days for the studyADT = Average Daily TrafficLength = Length of Section
The severity rate (SR) applies a weight value to the severity of the crash:
SRsection = 1,000,000 x [5(K) + 4(A) + 3(B) + 2(C) + 1(PD)]ADT x Length x Days
K = Number of fatal crashesA = Number of incapacitating injury crashesB = Number of non-incapacitating injury crashesC = Number of possible injury crashesP = Number of property damage only crashesVM = Vehicle Miles

October 31, 2009 TRAFFIC ENGINEERING MANUAL
11-8
The inclusion of crash and severity rate calculations in T.I.S. provides the user with numerous ways to applythese rates: significance limits, ordering of sections within groups, and best/worst section searches, to namejust a few. More applications can be found in the T.I.S. User’s Manual. There are also several types of manualcalculations performed as described below.
3. Analytical Tools
There are several tools available to the crash analyst which aid in the evaluation of crash locations and thedetermination of appropriate improvements. These tools, described below, include: a) intersection collisiondiagrams, b) individual crash reports, c) crash reduction estimates, d) crash costs, e) before-after studies,f) crash differentials, and g) family of measures.
a. Intersection Collision Diagrams
One of the most basic tools in analyzing intersection crashes is the intersection collision diagram. Figure11.4 illustrates a typical collision diagram form. Crash data from summation reports and/or individual crashreports can be utilized in preparing a collision diagram. Preparation of a collision diagram will assist inidentifying the crash "pattern" in a graphic sense, thus providing an aid to locating the most commoncrashes and determining appropriate corrective measures. The same results can be obtained forinterchanges by preparing interchange collision diagrams. The study of collision diagrams consists oflooking for crashes with common circumstances. This is often aided by visiting the crash location to viewits physical characteristics or by analyzing a condition diagram of the site. A typical condition diagram isdrawn to scale and illustrates all physical characteristics of the location under study.
b. Individual Traffic Accident Reports
It is often valuable to analyze individual crash reports to obtain the best available "picture" of a crash orseries of crashes. As previously noted, copies of individual traffic crash reports are available from OTST.All information identifying persons and vehicles involved in crashes is obliterated prior to distribution asexplained in Section 11-3.02.
c. Estimating Crash Reduction
After analyzing the crash experience, the crash reduction from a proposed improvement can be estimated.These estimated reductions can be translated into a benefit-cost relationship for establishing priorities forsafety improvement projects.
d. Crash Costs
Comprehensive costs, as defined by the National Safety Council (NCS), include cost factors and ameasure of the value of lost quality of life that society is willing to pay to prevent deaths and injuriesassociated with motor vehicle crashes. For calculation simplicity, the DOT converted the comprehensivecosts as outlined in the Federal Highway Administration (FHWA) Technical Advisory T 7570.2 from costper injury into a cost per crash. For documentation of the procedure, contact the Traffic Safety Unit at 651-634-5100.
The following comprehensive costs per crash are only to be used when computing a benefit/cost analysis:
$ 560,000 per Fatal Crash (= 2 x Severity A Crash)$ 280,000 per Severity A Crash$ 61,000 per Severity B Crash$ 30,000 per Severity C Crash$ 4,400 per Property Damage Only Crash
October 31, 2009 TRAFFIC ENGINEERING MANUAL
11-9
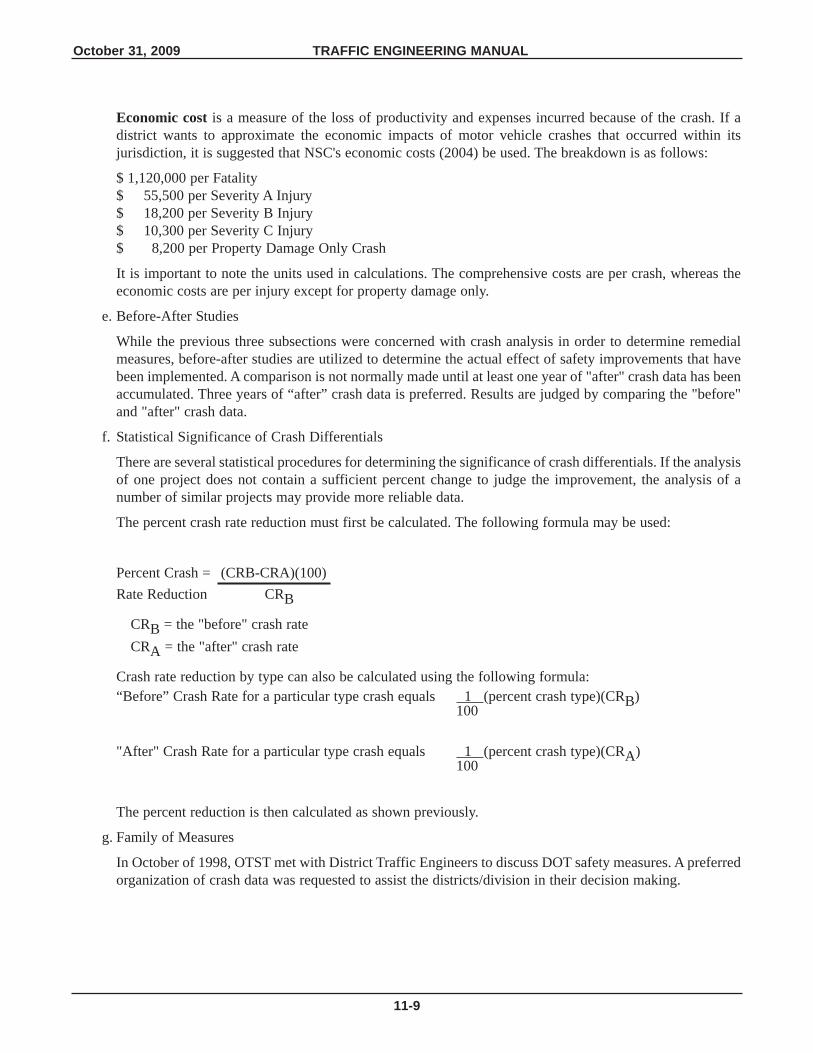
Economic cost is a measure of the loss of productivity and expenses incurred because of the crash. If adistrict wants to approximate the economic impacts of motor vehicle crashes that occurred within itsjurisdiction, it is suggested that NSC's economic costs (2004) be used. The breakdown is as follows:
$ 1,120,000 per Fatality$ 55,500 per Severity A Injury$ 18,200 per Severity B Injury$ 10,300 per Severity C Injury$ 8,200 per Property Damage Only Crash
It is important to note the units used in calculations. The comprehensive costs are per crash, whereas theeconomic costs are per injury except for property damage only.
e. Before-After Studies
While the previous three subsections were concerned with crash analysis in order to determine remedialmeasures, before-after studies are utilized to determine the actual effect of safety improvements that havebeen implemented. A comparison is not normally made until at least one year of "after" crash data has beenaccumulated. Three years of “after” crash data is preferred. Results are judged by comparing the "before"and "after" crash data.
f. Statistical Significance of Crash Differentials
There are several statistical procedures for determining the significance of crash differentials. If the analysisof one project does not contain a sufficient percent change to judge the improvement, the analysis of anumber of similar projects may provide more reliable data.
The percent crash rate reduction must first be calculated. The following formula may be used:
Percent Crash = (CRB-CRA)(100)Rate Reduction CRB
CRB = the "before" crash rateCRA = the "after" crash rate
Crash rate reduction by type can also be calculated using the following formula:“Before” Crash Rate for a particular type crash equals 1 (percent crash type)(CRB)
100
"After" Crash Rate for a particular type crash equals 1 (percent crash type)(CRA)100
The percent reduction is then calculated as shown previously.
g. Family of Measures
In October of 1998, OTST met with District Traffic Engineers to discuss DOT safety measures. A preferredorganization of crash data was requested to assist the districts/division in their decision making.

August 1, 2007 TRAFFIC ENGINEERING MANUAL
11-10
Crash Rates by Trunk Highway Section as follows:
1) 2-Lane by Rural and Urban categories by ADT (Average Daily Traffic) in 4 categories:
Less than 1,500 ADT1,500 - 5,000 ADT5,000 - 8,000 ADTGreater than 8,000 ADT
(A total of 8 numbers for this measure)
2) Freeways (includes Interstates and Trunk Highways) by Rural and Urban categories in 2 categories:
4 Lane6 Lane
(A total of 4 numbers for this measure)
3) 4 Lane Expressways by Rural and Urban categories
(A total of 2 numbers for this measure)
Rural will be defined as roadways with speed limits of 55 mph or greater.
Urban as roadways with speed limits of less than 55 mph.
Crash Rates by Roadway Intersection as follows:
1) Signalized Trunk Highway Intersections by High or Low Speed Limit (where High Speed is when anyleg has an approach speed limit of 45 mph or greater; and Low Speed is when no legs have an approachspeed limit of 45 mph or greater) in 2 categories:
Low Volume (ADT < 15,000)High Volume (ADT > 15,000)
2) Non-Signalized Trunk Highway Intersections in 2 categories:
All-Way StopThru/Stop
ADT = Total intersection Average Annual Daily Traffic (entering vehicles)
It was agreed to continue to use a 3-year roll-up of all data for these measures.

August 1, 2007 TRAFFIC ENGINEERING MANUAL
11-11
11-5.00 HIGHWAY SAFETY IMPROVEMENT PROGRAM
The purpose of the Highway Safety Improvement Program (H.S.I.P.) is to eliminate hazardous conditions and/orto increase intersection capacity. The projects consist of mainly intersection improvements (channelization,signals), widening turn lanes, guardrail, improving curves, and skid resistant surface treatments. This category hastwo sub-categories determined by funding eligibility.
11-5.01 Hazard Elimination Safety
Based on requirements of the Transportation Efficiency Act for the 21st Century (TEA 21) of 1991, Federal Fundsare available to all local agencies within the state of Minnesota. To participate in the Hazard Elimination Safety(HES) program, all interested local agencies within the Area Transportation Partnership (ATP) regions mustcomplete the necessary studies, computations and forms according to the established eligibility criteria. The ATPswould solicit these types of projects and prioritize them. These projects would then be included in the StateTransportation Investment Program (STIP). For a copy of the forms and instructions, contact yourDistrict/Division Traffic Engineer or visit the website
http://www.dot.state.mn.us/trafficeng/safety/hes/.
11-5.02 Safety Capacity
Safety Capacity (SC) projects are typically state funded. The project's potential to reduce crashes is reviewed butdoes not have a specific requirement for the Benefit/Cost Ratio.
11-6.00 REFERENCES1. Traffic Engineering Handbook, Institute of Traffic Engineers, 1992.
2. Transportation Information System User’s Manual, Department of Civil Engineering and EngineeringMechanics, Montana State University, 1991.
3. Minnesota Motor Vehicle Crash Facts, Office of Traffic Safety, Minnesota Department of Public Safety, 2004.
4. Freeway Volume - Crash Summary, Twin Cities Metropolitan Area, Minnesota Department of Transportation,1990.
ABBREVIATIONS
AADT -- Annual average daily trafficADT -- Average daily trafficCo. Rd. -- County RoadCS -- Control stationCSAH -- County State Aid HighwayDOT -- Department of TransportationDPS -- Department of Public SafetyI/I -- Intersection/InterchangeK -- FatalityMSAS -- Municipal State Aid StreetN -- Property damagePI -- Personal injuryRP -- Reference pointTH -- Trunk highwayTIS -- Transportation information systemtwp -- Township


August 1, 2007 TRAFFIC ENGINEERING MANUAL
11-13
Text Ref.: 11-2.02
FIGUREJuly 1,1992
TRAFFIC ACCIDENT REPORT(POLICE) 11.1

August 1, 2007 TRAFFIC ENGINEERING MANUAL
11-14
This page is intentionally left blank

August 1, 2007 TRAFFIC ENGINEERING MANUAL
11-15
FIGUREJuly 1,1992 TRAFFIC ACCIDENT REPORT (POLICE)
(OVERLAY - FRONT) 11.1A
Text Ref.: 11-2.02

August 1, 2007 TRAFFIC ENGINEERING MANUAL
11-16
FIGUREJuly 1,1992
TRAFFIC ACCIDENT REPORT (POLICE)(OVERLAY - BACK) 11.1B
Text Ref.: 11-2.02

August 1, 2007 TRAFFIC ENGINEERING MANUAL
11-17
FIGUREJuly 1,1992
MINNESOTA MOTOR VEHICLE CRASH REPORT(CITIZEN - FRONT) 11.2A
Text Ref.: 11-2.02
*SE
EC
OD
ES
ON
RE
VE
RS
ES
IDE
*
A
B
C
The information on this report is used to help build safer roads.Every driver in a crash involving $1,000 or more in property damage, or injury or death, this form and send it to within 10 days.MUST COMPLETE Driver and Vehicle Services
Failure to provide this information is a misdemeanor under Minnesota Statute 169.09, subdivision 7. See reverse side for address and for data privacy information.
MINNESOTA
MOTOR VEHICLE CRASH REPORT
DRIVER’S TRAFFIC CRASH REPORT
OWNER’S FULL NAME
DRIVER’S FULL NAME
DRIVER’S LICENSE NUMBER
LICENSE PLATE NUMBER
MODELMAKE
YEAR
ADDRESS CITY
STATE OF ISSUE PARTS OF VEHICLE DAMAGED
STATE OF ISSUE DATE OF BIRTH
STATE ZIP CODE
SEX
INJURYCODE*
M
Y
V
E
H
I
C
L
E
D
R
I
V
E
R
V
E
H
I
C
L
E
I
N
S
U
R
A
N
C
E
TYPE (CAR, PICKUP, VAN, SUV, MOTORCYCLE, TRUCK, ETC.) # OF OCCUPANTS
ESTIMATE REPAIR COST
GIVE FULL LIABILITY INSURANCE INFORMATION OR IT WILL BE ASSUMED YOU DID NOT HAVE INSURANCE
PLEASECOPYFROM
POLICY
NAME OF INSURANCE COMPANY (NOT AGENCY)
Automobile InsurancePOLICY NUMBER
Name of Policy Holder
Policy Period: from to
Address
MONTH DAY YEAR
IF MORE THAN TWO VEHICLES - FILL IN SECTION “C” ON SEPARATE FORM AND ATTACH
O
T
H
E
R
V
E
H
I
C
L
E
D
R
I
V
E
R
V
E
H
I
C
L
E
T
I
M
E
-
P
L
A
C
E
DATE OFCRASH
DAY OF WEEK TIME COUNTY NAME OF CITY OR TOWNSHIPMONTH DAY YEAR
CRASH OCCURRED(Choose only one box belowand proceed to the right)
AT INTERSECTION
NOT AT INTERSECTION
IN PARKING LOT
LOCATION OF CRASH:
ON:
LOCATION OF CRASH:
ON:(Street Name or Road Number)
DESCRIBE LOCATION:
AT:(Street Name or Road Number)(Street Name or Road Number)
DISTANCE DIRECTION
(Number)
MILES
FEET FROM:(Street Name or Road Number)
N
S
E
W
AM
PM
TOTAL # OFVEHICLESINVOLVED
CITY
TWP
YEAR COLOR
$
MONTH DAY YEAR
FULL NAME
DRIVER’S LICENSE NUMBER
LICENSE PLATE NUMBER
MODELMAKE
INJURYCODE*
TYPE (CAR, PICKUP, VAN, SUV, MOTORCYCLE, TRUCK, ETC.) # OF OCCUPANTSYEAR COLOR
OTHERDRIVER
TYPE CRASH
COLLISION WITH A(N)
1- MOTOR VEHICLE
2- PARKED MOTOR VEHICLE
3- ROADWAY EQUIPMENT - SNOWPLOW
4- ROADWAY EQUIPMENT - OTHER
5- TRAIN
6- PEDALCYCLE, BIKE, ETC.
7- PEDESTRIAN
8- DEER
9- OTHER ANIMAL
12- COLLISION WITH OTHER
TYPE OF NON-FIXED OBJECT
13- OTHER COLLISION TYPE
NON-COLLISION
51- OVERTURN/ROLLOVER
52- SUBMERSION
53- FIRE/EXPLOSION
54- JACKKNIFE
55- LOSS/SPILLAGE NON-HAZ MAT
56- LOSS/SPILLAGE HAZ MAT
64- NON-COLLISION OF OTHER TYPE
65- NON-COLLISION OF UNKNOWN TYPE
COLLISION WITH FIXED OBJECT
21- CONSTRUCTION EQUIPMENT
22- TRAFFIC SIGNAL
23- RR CROSSING DEVICE
24- LIGHT POLE
25- UTILITY POLE
26- SIGN STRUCTURE
27- MAILBOXES
28- OTHER POLES
29- HYDRANT30- TREE/SHRUBBERY31- BRIDGE PIERS32- MEDIAN SAFETY BARRIER
33- CRASH CUSHION
34- GUARDRAIL
35- FENCE (NON-MEDIAN BARRIER)
36- CULVERT/HEADWALL
37- EMBANKMENT/DITCH/CURB
38- BUILDING/WALL
39- ROCK OUTCROPS
40- PARKING METER
41- OTHER FIXED OBJECT
42- UNKNOWN FIXED OBJECT
LIGHT CONDITION
1- DAY LIGHT
2- BEFORE SUNRISE (DAWN)
3- AFTER SUNSET (DUSK)
4- DARK (STREET LIGHTS ON)
5- DARK (STREET LIGHTS OFF)
6- DARK (NO STREET LIGHTS)
7- DARK (UNKNOWN LIGHTING)
90- OTHER
WEATHER / ATMOSPHERE
3- RAIN4- SNOW1- CLEAR
2- CLOUDY
5- SLEET/HAIL/FREEZING RAIN
6- FOG/SMOG/SMOKE
7- BLOWING SAND/DUST/SNOW
8- SEVERE CROSSWINDS
90- OTHERROAD SURFACE
1- DRY
2- WET
5- ICE PACKED SNOW6- WATER (STANDING/MOVING) 7- MUDDY8- DEBRIS3- SNOW4-SLUSH 9- OILY90- OTHER
TRAFFIC CONTROL DEVICE1- TRAFFIC SIGNAL2- OVERHEAD FLASHERS3- STOP SIGN - ALL APPROACHES4- STOP SIGN - NOT ALL APPROACHES5- YIELD SIGN6- OFFICER/FLAG PERSON/SCHOOL
PATROL 7- SCHOOL BUS STOP ARM8- SCHOOL ZONE SIGN9- NO PASSING ZONE10- RR CROSSING GATE11- RR CROSSING -FLASHING LIGHTS
12- RR CROSSING - STOP SIGN
13- RR OVERHEAD FLASHERS
14- RR OVERHEAD FLASHERS/
GATE
15- RR SIGN ONLY (NO LIGHTS,
GATES OR STOP SIGN)
90- OTHER
98- NOT APPLICABLE
MANNER OF COLLISION1- REAR END2- SIDESWIPE - SAME DIRECTION
3- LEFT TURN4- RAN OFF ROAD - LEFT SIDE
5- RIGHT ANGLE (”T-BONE”)
6- RIGHT TURN
7- RAN OFF ROAD - RIGHT SIDE
8- HEAD ON
9- SIDE SWIPE
- OPPOSING DIRECTION
90- OTHER
WORK ZONE (CIRCLE CORRECT RESPONSE)
DID THE CRASH OCCUR IN A WORK ZONE?
IF YES, WERE WORKERS PRESENT?
YES NO
CONTINUEREPORT ONOTHER SIDE
WAS THERE A POLICEOFFICER AT THESCENE?
IF YES, WHAT DEPARTMENT (NAME OF CITY, COUNTY OR STATE PATROL)
YES NO
BY BICYCLIST
51- RIDING WITH TRAFFIC
52- RIDING AGAINST TRAFFIC
53- MAKING RIGHT TURN
54- MAKING LEFT TURN
55- MAKING U-TURN
56- RIDING ACROSS ROAD
57- SLOWING/STOPPING/
STARTING
90- OTHER
BY PEDESTRIAN31- CROSSING WITH SIGNAL
32- CROSSING AGAINST SIGNAL
33- DARTING INTO TRAFFIC
34- OTHER IMPROPER CROSSING
35- CROSSING IN A MARKED CROSSWALK
36- CROSSING (NO SIGNAL OR CROSSWALK)
37- FAIL TO YIELD RIGHT OF WAY TO TRAFFIC
38- INATTENTION/DISTRACTION
39- WALKING/RUNNING IN ROAD WITH
TRAFFIC
40- WALKING/RUNNING IN ROAD
AGAINST TRAFFIC
PARKED VEHICLES
21- PARKED LEGALLY
22- PARKED ILLEGALLY
23- VEHICLE STOPPED
OFF ROADWAY
ACTIONS / MANEUVERS PRIOR TO CRASH
BY VEHICLE
1- GOING STRAIGHT AHEAD
FOLLOWING ROADWAY
2- WRONG WAY INTO
OPPOSING TRAFFIC
3- RIGHT TURN ON RED
4- LEFT TURN ON RED
5- MAKING RIGHT TURN
6- MAKING LEFT TURN
7- MAKING U-TURN
8- STARTING FROM PARKED
POSITION
9- STARTING IN TRAFFIC
10- SLOWING IN TRAFFIC
11- STOPPED IN TRAFFIC
12- ENTERING PARKED POSITION
13- AVOID UNIT/OBJECT IN ROAD
14- CHANGING LANES
15- OVERTAKING/PASSING
16- MERGING
17- BACKING
18- STALLED ON ROADWAY
41- STANDING/LYING IN ROAD
42- EMERGING FROM BEHIND
PARKED VEHICLE
43- CHILD GETTING ON/OFF
SCHOOL BUS
44- PERSON GETTING ON/OFF
VEHICLE
45- PUSHING/WORKING ON VEHICLE
46- WORKING IN ROADWAY
47- PLAYING IN ROADWAY
48- NOT IN ROADWAY
DIRECTION OF TRAVEL PRIOR TO CRASH
1- NORTHBOUND
2- NORTH EASTBOUND
3- EASTBOUND
4- SOUTH EASTBOUND
5- SOUTHBOUND
6- SOUTH WESTBOUND
7- WESTBOUND
8- NORTH WESTBOUND
MY
VE
HIC
LE
OT
HE
RV
EH
ICL
EM
YV
EH
ICL
EO
TH
ER
VE
HIC
LE
8
7 3
65
1
4
2
N
S
EW
ENTER NUMBER FOR CORRECT RESPONSE IN EACH BOX BELOW
YES NO
SPEED LIMIT ENTER POSTED SPEED LIMIT ( NOT YOUR TRAVEL SPEED)
ADDRESS CITY STATE ZIP CODE
ADDRESS CITY STATE ZIP CODE
FULL NAMEOTHEROWNER
ADDRESS CITY STATE ZIP CODE
E-form available at www.mndriveinfo.org
PS 32001 - 09
CLASS
Please use BLACK ink and CAPITAL LETTERS
STATE OF ISSUE DATE OF BIRTH SEXCLASS
YEAR STATE OF ISSUE PARTS OF VEHICLE DAMAGED ESTIMATE REPAIR COST
$

August 1, 2007 TRAFFIC ENGINEERING MANUAL
11-18
FIGUREJuly 1,1992
MINNESOTA MOTOR VEHICLE CRASH REPORT(CITIZEN - BACK) 11.2B
Text Ref.: 11-2.02
As required by Minnesota Data Privacy Act you are hereby informed that the information requested on this form is collected pursuant toMinnesota Statute 169.09 Subdivision 13 to provide statistical data on traffic crashes. The time and place of the crash, names of parties involvedand insurance information may be disclosed to any person involved in the crash or to others persons as specified by law. This written reportcannot be used against you as evidence in any civil or criminal matter and your version of how the crash happened is confidential.
ESTIMATE COST OF REPAIR
$
SIGNATURE OF PERSON SUBMITTING REPORT IS REQUIRED
DATE OF REPORT
SIGN HERE X
DESCRIBE ACCIDENT IN SUFFICIENT DETAIL BELOW TO DISCLOSE CAUSES.
DIAGRAM WHAT HAPPENED:DESCRIBE WHAT HAPPENED:
DAMAGE TO PROPERTY OTHER THAN VEHICLES: (MAILBOX, FENCE, SIGNPOST, GUARDRAIL, ETC.)
DATE OF BIRTH (OR AGE) SEX
SEX
SEX
SEX
SEAT
SEAT
SEAT
SEAT
TYPE
TYPE
TYPE
TYPE
USE
USE
USE
USE
INJURY
INJURY
INJURY
INJURY
DRIVER >>>>>>>>>>>>>>>>>>PASSENGER NAME
PASSENGER NAME
PASSENGER NAME
CITY
CITY
CITY
STATE
STATE
STATE
AIR BAG
AIR BAG
AIR BAG
AIR BAG
EJECT
EJECT
EJECT
EJECT
MY VEHICLE: DRIVER AND PASSENGERS INFORMATION:
DATE OF BIRTH (OR AGE)
DATE OF BIRTH (OR AGE)
DATE OF BIRTH (OR AGE)
MAIL THIS REPORT TO:
DVS / CRASH RECORDS
445 MINNESOTA STREET, SUITE 181
ST. PAUL, MN 55101-5181
DESCRIBEPROPERTYDAMAGED:
OCCUPANT SEAT POSITION CODES
1- DRIVER
(INCLUDE MOTORCYCLE DRIVER)
2- FRONT CENTER
3- FRONT RIGHT
4- SECOND ROW SEAT LEFT
5- SECOND ROW SEAT CENTER
6- SECOND ROW SEAT RIGHT
7- THIRD ROW SEAT LEFT
8- THIRD ROW SEAT CENTER
9- THIRD ROW SEAT RIGHT
10- OUTSIDE OF VEHICLE
11- TRAILING UNIT
12- PICKUP TRUCK BED
13- TRUCK CAB SLEEPER SECTION
14- PASSENGER IN OTHER POSITION
(INCLUDE MOTORCYCLE PASSENGER)
15- PASSENGER IN UNKNOWN POSITION
16- FRONT LEFT (NON-DRIVER)
SEAT USE
RESTRAINT DEVICE USED
CODES
1- BELTS NOT USED
2- LAP BELT ONLY USED
3- SHOULDER BELT ONLY USED
4- LAP AND SHOULDER BELT USED
5- CHILD SEAT NOT USED
6- CHILD SEAT USED IMPROPERLY
7- CHILD SEAT USED PROPERLY
8- BOOSTER SEAT NOT USED
9- BOOSTER SEAT USED IMPROPERLY
10- BOOSTER SEAT USED PROPERLY
11- HELMET NOT USED
12- HELMET USED
EJECTION CODES
1- TRAPPED, EXTRICATED
(BY MECHANICAL MEANS)
2- TRAPPED, FREED BY
NON-MECHANICAL MEANS
3- PARTIALLY EJECTED
4- EJECTED
5- NOT EJECTED OR TRAPPED
EJECT
INJURY CODES
K- KILLED
A- INCAPACITATING INJURY
B- NON-INCAPACITATING INJURY
C- POSSIBLE INJURY
N- NO APPARENT INJURY
INJURYTYPE
SAFETY EQUIPMENT TYPE
CODES
1- NO SAFETY EQUIP IN PLACE
2- LAP BELT
3- SHOULDER BELT
4- LAP & SHOULDER BELT
5- CHILD SAFETY SEAT
6- CHILD BOOSTER SEAT
98- NOT APPLICABLE
(MOTORCYCLE,
SNOWMOBILE, ECT.)
AIR BAG
SAFETY EQUIPMENT USED
CODES
1- DEPLOYED-FRONT
2- DEPLOYED-SIDE
3- DEPLOYED-FRONT AND SIDE
4- NOT DEPLOYED-SWITCH ON
5- NOT DEPLOYED-SWITCH OFF
6- NOT DEPLOYED- UNKNOWN
IF SWITCH ON OR OFF
90- OTHER DEPLOYMENTS
98- NOT APPLICABLE
(MOTORCYCLE,
SNOWMOBILE, ECT.)
NAME OFPROPERTYOWNER:
ADDRESS
INDICATENORTHBY ARROW

August 1, 2007 TRAFFIC ENGINEERING MANUAL
11-19
Text Ref.: 11-3.01
FIGUREJuly 1, 2000 TYPICAL INTERCHANGE ELEMENT SKETCH 11.3

August 1, 2007 TRAFFIC ENGINEERING MANUAL
11-20
Text Ref.: 11-5.02
FIGUREJuly 1, 2000 TYPICAL COLLISION DIAGRAM 11.4