Chapter 11 Earthquakes · 2019-09-23 · 2. The string of small earthquakes adjacent to Haida Gwaii...
35
Chapter 11 Earthquakes Learning Objectives After carefully reading this chapter, completing the exercises within it, and answering the questions at the end, you should be able to: • Explain how the principle of elastic deformation applies to earthquakes. • Describe how the main shock and the immediate aftershocks define the rupture surface of an earthquake, and explain how stress transfer is related to aftershocks. • Explain the process of episodic tremor and slip. • Describe the relationship between earthquakes and plate tectonics, including where we should expect earthquakes to happen at different types of plate boundaries and at what depths. • Distinguish between earthquake magnitude and intensity, and explain some of the ways of estimating magnitude. • Explain the importance of collecting intensity data following an earthquake. • Describe how earthquakes lead to the destruction of buildings and other infrastructure, fires, slope failures, liquefaction, and tsunami. • Discuss the value of earthquake forecasting, and describe some of the steps that governments and individuals can take to minimize the impacts of large earthquakes. 362
Transcript of Chapter 11 Earthquakes · 2019-09-23 · 2. The string of small earthquakes adjacent to Haida Gwaii...

Chapter 11 Earthquakes
Learning Objectives
After carefully reading this chapter, completing the exercises within it, and answering the questions at the end,you should be able to:
• Explain how the principle of elastic deformation applies to earthquakes.
• Describe how the main shock and the immediate aftershocks define the rupture surface of anearthquake, and explain how stress transfer is related to aftershocks.
• Explain the process of episodic tremor and slip.
• Describe the relationship between earthquakes and plate tectonics, including where we shouldexpect earthquakes to happen at different types of plate boundaries and at what depths.
• Distinguish between earthquake magnitude and intensity, and explain some of the ways ofestimating magnitude.
• Explain the importance of collecting intensity data following an earthquake.
• Describe how earthquakes lead to the destruction of buildings and other infrastructure, fires, slopefailures, liquefaction, and tsunami.
• Discuss the value of earthquake forecasting, and describe some of the steps that governments andindividuals can take to minimize the impacts of large earthquakes.
362

Figure 11.0.1 A schoolroom in Courtenay damaged by the1946 Vancouver Island earthquake. If the earthquake hadnot happened on a Sunday, the casualties would have beenmuch greater.
Earthquakes scare people … a lot! That’s notsurprising because time and time againearthquakes have caused massive damage andmany injuries and deaths. Anyone who has livedthrough a strong earthquake cannot forget theexperience (Figure 11.0.1). But geoscientists andengineers are getting better at understandingearthquakes, minimizing the amount of damagethey cause, and reducing the number of peopleaffected. People living in western Canada don’tneed to be frightened by earthquakes, but they doneed to be prepared.
Media Attributions
Figure 11.0.1: “Courtenay B.C., Damage tointerior of Elementary School” by EarthquakesCanada. Permission to reproduce for public, non-commercial purposes.
363 Steven Earle

11.1 What is an Earthquake?
An earthquake is the shaking caused by the rupture (breaking) and subsequent displacement of rocks(one body of rock moving with respect to another) beneath Earth’s surface.
A body of rock that is under stress becomes deformed. When the rock can no longer withstand thedeformation, it breaks and the two sides slide past each other. Most earthquakes take place near plateboundaries—but not necessarily right on a boundary—and not necessarily even on a pre-existing fault.
The engineering principle of elastic deformation, which can be used to understand earthquakes,is illustrated in Figure 11.1.1. The stress applied to a rock—typically because of ongoing platemovement—results in strain or deformation of the rock (Figure 11.1.1b). Because most rock is strong(unlike loose sand, for example), it can withstand a significant amount of deformation without breaking.But every rock has a deformation limit and will rupture (break) once that limit is reached. At that point,in the case of rocks within the crust, the rock breaks and there is displacement along the rupture surface(Figure 11.1.1c). The magnitude of the earthquake depends on the extent of the area that breaks (the areaof the rupture surface) and the average amount of displacement (sliding).
Figure 11.1.1 Depiction of the concept of elastic deformation and rupture. The plate boundary is shown as a dashedred line. In b the two plates are moving as shown by the arrows, but they are locked against each along the plateboundary so they are both deforming and the rocks are stressed. In c there has been a rupture along the boundaryand the stress is released.
The concept of a rupture surface, which is critical to understanding earthquakes, is illustrated in Figure11.1.2. An earthquake does not happen at a point, it happens over an area within a plane, although notnecessarily a flat plane. Within the area of the rupture surface, the amount of displacement is variable(Figure 11.1.2), and, by definition, it decreases to zero at the edges of the rupture surface becausethe rock beyond that point isn’t displaced at all. The extent of a rupture surface and the amount of
364

displacement will depend on a number of factors, including the type and strength of the rock, and thedegree to which it was stressed beforehand.
Figure 11.1.2 A rupture surface (dark pink), on a steeply dipping fault plane (light pink). The diagram represents apart of the crust that may be up to tens or hundreds of kilometres long. The rupture surface is the part of the faultplane along which displacement occurred. In this example, the near side of the fault is moving to the left, and thelengths of the arrows within the rupture surface represent relative amounts of displacement.
Earthquake rupture doesn’t happen all at once; it starts at a single point and spreads rapidly from there.Depending on the extent of the rupture surface, the propagation of failures out from the point of initiationis typically completed within seconds to several tens of seconds (Figure 11.1.3). The initiation pointisn’t necessarily in the centre of the rupture surface; it may be close to one end, near the top, or near thebottom.
365 Chapter 11 Earthquakes

Figure 11.1.4 Distribution of the aftershocks of the 1989 M6.9 Loma Prieta earthquake (a: plan view, b: section alongthe fault, c: section across the fault.)
Figure 11.1.3 Propagation of failure on a rupture surface. In this case, the failure starts at the dark blue heavy arrowin the centre and propagates outward, reaching the left side first (green arrows) and the right side last (yellowarrows).
Figure 11.1.4 shows the distribution of immediate aftershocks associated with the 1989 Loma Prietaearthquake. Panel (b) is a section along the San Andreas Fault; this view is equivalent to what is shown inFigures 11.1.2 and 11.1.3. The area of red dots is the rupture surface; each red dot is a specific aftershockthat was recorded on a seismometer. The hexagon labelled “main earthquake” represents the first or mainshock. When that happened, the rock at that location broke and was displaced. That released the stresson that particular part of the fault, but it resulted in an increase of the stress on other nearby parts of thefault, and contributed to a cascade of smaller ruptures (aftershocks), in this case, over an area about 60kilometres long and 15 kilometres wide.
So, what exactly is an aftershock then? Anaftershock is an earthquake just like any other, butit is one that can be shown to have been triggeredby stress transfer from a preceding earthquake.Within a few tens of seconds of the main LomaPrieta earthquake, there were hundreds of smalleraftershocks; their distribution defines the area ofthe rupture surface.
Aftershocks can be of any magnitude. Most aresmaller than the earthquake that triggered them,but they can be bigger. The aftershocks shown inFigure 11.1.4 all happened within seconds orminutes of the main shock, but aftershocks can bedelayed for hours, days, weeks, or even years. Asalready noted, aftershocks are related to stresstransfer. For example, the main shock of theLoma Prieta earthquake triggered aftershocks inthe immediate area, which triggered more in the
11.1 What is an Earthquake? 366

surrounding area, eventually extending for 30 kilometres along the fault in each direction and for 15kilometres toward the surface. But the earthquake as a whole also changed the stress on adjacent parts ofthe San Andreas Fault. This effect, which has been modelled for numerous earthquakes and active faultsaround the world, is depicted in Figure 11.1.5. Stress was reduced in the area of the rupture (blue), butwas increased at either end of the rupture surface (red and yellow).
Figure 11.1.5 Depiction of stress changes related to an earthquake. Stress decreases in the area of therupture surface, but increases on adjacent parts of the fault.
Stress transfer isn’t necessarily restricted to the fault along which an earthquake happened. It will affectthe rocks in general around the site of the earthquake and may lead to increased stress on other faultsin the region. The effects of stress transfer don’t necessarily show up right away. Segments of faults aretypically in some state of stress, and the transfer of stress from another area is only rarely enough topush a fault segment beyond its limits to the point of rupture. The stress that is added by stress transferaccumulates along with the ongoing buildup of stress from plate motion and eventually leads to anotherearthquake.
Episodic Tremor and Slip
Episodic tremor and slip (ETS) is periodic slow sliding along part of a subduction boundary. It doesnot produce recognizable earthquakes, but does produce seismic tremor (rapid seismic vibrations on aseismometer). It was first discovered on the Vancouver Island part of the Cascadia subduction zone byGeological Survey of Canada geologists Herb Dragert and Garry Rogers.
1
The boundary between the subducting Juan de Fuca Plate and the North America Plate can be dividedinto three segments (Figure 11.1.6). The cold upper part of the Juan de Fuca Plate boundary is locked.The plates are stuck and don’t move, except with very large earthquakes that happen approximatelyevery 500 years (the last one was approximately M9 on January 26, 1700). The warm lower part of theboundary is sliding continuously because the warm rock is weaker. The central part of the boundary
1. Rogers, G. and Dragert, H., 2003, Episodic tremor and slip on the Cascadia subduction zone: the chatter of silent slip, Science, V. 300, p.
1942-1943.
367 Chapter 11 Earthquakes

isn’t cold enough to be stuck, but isn’t warm enough to slide continuously. Instead it slips episodically,approximately every 14 months for about 2 weeks, moving a few centimetres each time.
Figure 11.1.6 The boundary between the subducting Juan de Fuca Plate and the North America Plate is locked in theupper part, slides continuously in the lower part and slides episodically in the middle part.
You might be inclined to think that it’s a good thing that there is periodic slip on this part of the platebecause it releases some of the tension and reduces the risk of a large earthquake. In fact, the oppositeis likely the case. The movement along the ETS part of the plate boundary acts like a medium-sizedearthquake and leads to stress transfer to the adjacent locked part of the plate. Approximately every 14months, during the two-week ETS period, there is a transfer of stress to the shallow locked part of theCascadia subduction zone, and therefore an increased chance of a large earthquake.
Since 2003, ETS processes have also been observed on subduction zones in Mexico, New Zealandand Japan.
Media Attributions
• Figure 11.1.1, 11.1.2, 11.1.3, 11.1.6: © Steven Earle. CC BY.
• Figure 11.1.4: © Open University. CC BY-SA.
• Figure 11.1.5: © Steven Earle. CC BY. Based on data from 2010 Laguna Salada earthquakeby Stein and Toda.
11.1 What is an Earthquake? 368

11.2 Earthquakes and Plate Tectonics
The distribution of earthquakes across the globe is shown in Figure 11.2.1. It is relatively easy to see therelationships between earthquakes and the plate boundaries. Along divergent boundaries like the mid-Atlantic ridge and the East Pacific Rise, earthquakes are common, but restricted to a narrow zone closeto the ridge, and consistently at less than a 30 kilometre depth. Shallow earthquakes are also commonalong transform faults, such as the San Andreas Fault. Along subduction zones, as we saw in Chapter 10,earthquakes are very abundant, and they are increasingly deep on the landward side of the subductionzone.
Figure 11.2.1 General distribution of global earthquakes of magnitude 4 and greater from 2004 to 2011, colour codedby depth (red: 0 to 33 kilometres, orange 33 to 70 kilometres, green: 70 to 300 kilometres, blue: 300 to 700kilometres).
Earthquakes are also relatively common at a few intraplate locations. Some are related to the buildupof stress due to continental rifting or the transfer of stress from other regions, and some are not wellunderstood. Examples of intraplate earthquake regions include the Great Rift Valley area of Africa, theTibet region of China, and the Lake Baikal area of Russia.
Earthquakes at Divergent and Transform Boundaries
Figure 11.2.2 provides a closer look at magnitude (M) 4 and larger earthquakes in an area of divergentboundaries in the mid-Atlantic region near the equator. Here, as we saw in Chapter 10, the segments
369

of the mid-Atlantic ridge are offset by some long transform faults. Most of the earthquakes are locatedalong the transform faults, rather than along the spreading segments, although there are clusters ofearthquakes at some of the ridge-transform boundaries. Some earthquakes do occur on spreading ridges,but they tend to be small and infrequent because of the relatively high rock temperatures in the areaswhere spreading is taking place.
Figure 11.2.2 Distribution of earthquakes of M4 and greater in the area of the mid-Atlantic ridge near the equatorfrom 1990 to 1996. All are at a depth of 0 to 33 kilometres.
Earthquakes at Convergent Boundaries
The distribution and depths of earthquakes in the Caribbean and Central America area are shown inFigure 11.2.3. In this region, the Cocos Plate is subducting beneath the North America and CaribbeanPlates (ocean-continent convergence), and the South and North America Plates are subducting beneaththe Caribbean Plate (ocean-ocean convergence). In both cases, the earthquakes get deeper with distancefrom the trench. In Figure 11.2.3, the South America Plate is shown as being subducted beneath theCaribbean Plate in the area north of Colombia, but since there is almost no earthquake activity along thiszone, it is questionable whether subduction is actually taking place.
11.2 Earthquakes and Plate Tectonics 370

Figure 11.2.4 Distribution of earthquakes in the area of theKuril Islands, Russia (just north of Japan) (White dotsrepresent the April 2009 M6.9 earthquake. Red and yellowdots are from background seismicity over several yearsprior to 2009.)
Figure 11.2.3 Distribution of earthquakes of M4 and greater in the Central America region from 1990 to 1996 (red: 0to 33 kilometres, orange: 33 to 70 kilometres, green: 70 to 300 kilometres, blue: 300 to 700 kilometres) (Spreadingridges are heavy lines, subduction zones are toothed lines, and transform faults are light lines.)
There are also various divergent and transform boundaries in the area shown in Figure 11.2.3, and aswe’ve seen in the mid-Atlantic area, most of these earthquakes occur along the transform faults.
The distribution of earthquakes with depth inthe Kuril Islands of Russia in the northwestPacific is shown in Figure 11.2.4. This is anocean-ocean convergent boundary. The small redand yellow dots show background seismicity overa number of years, while the larger white dots areindividual shocks associated with a M6.9earthquake in April 2009. The relatively largeearthquake took place on the upper part of theplate boundary between 60 kilometres and 140kilometres inland from the trench. As we saw forthe Cascadia subduction zone, this is where largesubduction earthquakes are expected to occur.
In fact, all of the very large earthquakes — M9or higher — take place at subduction boundariesbecause there is the potential for a greater widthof rupture zone on a gently dipping boundary thanon a steep transform boundary. The largestearthquakes on transform boundaries are in theorder of M8.
The background seismicity at this convergent boundary, and on other similar ones, is predominantlynear the upper side of the subducting plate. The frequency of earthquakes is greatest near the surfaceand especially around the area where large subduction quakes happen, but it extends to at least a 400kilometre depth. There is also significant seismic activity in the overriding North America Plate, again
371 Chapter 11 Earthquakes

Figure 11.2.5 Distribution of earthquakes in the areawhere the India Plate is converging with the Asia Plate(data from 1990 to 1996, red: 0 to 33 kilometres, orange:33 to 70 kilometres, green: 70 to 300 kilometres).(Spreading ridges are heavy lines, subduction zones aretoothed lines, and transform faults are light lines. Thedouble line along the northern edge of the India Plateindicates convergence, but not subduction. Plate motionsare shown in millimetres per year).
most commonly near the region of large quakes, but also extending for a few hundred kilometres awayfrom the plate boundary.
The distribution of earthquakes in the area ofthe India-Eurasia plate boundary is shown inFigure 11.2.5. This is a continent-continentconvergent boundary, and it is generally assumedthat although the India Plate continues to movenorth toward the Asia Plate, there is no actualsubduction taking place. There are transformfaults on either side of the India Plate in this area.
The entire northern India and southern Asiaregion is very seismically active. Earthquakes arecommon in northern India, Nepal, Bhutan,Bangladesh and adjacent parts of China, andthroughout Pakistan and Afghanistan. Many ofthe earthquakes are related to the transform faultson either side of the India Plate, and most of theothers are related to the significant tectonicsqueezing caused by the continued convergenceof the India and Asia Plates. That squeezing hascaused the Asia Plate to be thrust over top of theIndia Plate, building the Himalayas and the TibetPlateau to enormous heights. Most of theearthquakes of Figure 11.2.5 are related to thethrust faults shown in Figure 11.2.6 (and tohundreds of other similar ones that cannot beshown at this scale). The southernmost thrustfault in Figure 11.2.6 is equivalent to the Main Boundary Fault in Figure 11.2.5.
11.2 Earthquakes and Plate Tectonics 372

Figure 11.2.6 Schematic diagram of the India-Asia convergent boundary, showing examples of the types of faultsalong which earthquakes are focused. The devastating Nepal earthquake of May 2015 took place along one of thesethrust faults.
There is a very significant concentration of both shallow and deep (greater than 70 kilometres)earthquakes in the northwestern part of Figure 11.2.5. This is northern Afghanistan, and at depths ofmore than 70 kilometres, many of these earthquakes are within the mantle as opposed to the crust. Itis interpreted that these deep earthquakes are caused by northwestward subduction of part of the IndiaPlate beneath the Asia Plate in this area.
Exercise 11.1 Earthquakes in British Columbia
373 Chapter 11 Earthquakes

Figure 11.2.7 [Image Description]
This map shows the incidence and magnitude ofearthquakes in British Columbia over a one-monthperiod in March and April 2015.
1. What is the likely origin of theearthquakes between the Juan de Fuca(JDF) and Explorer Plates?
2. The string of small earthquakes adjacentto Haida Gwaii (H.G.) coincides closelywith the rupture surface of the 2012M7.8 earthquake in that area. Howmight these earthquakes be related tothat one?
3. Most of the earthquakes aroundVancouver Island (V.I.) are relativelyshallow. What is their likely origin?
4. Some of the earthquakes in B.C. areinterpreted as being caused by naturalgas extraction (including fracking). Which of the earthquakes here could fall into this category?
See Appendix 3 for Exercise 11.1 answers.
Image descriptions
Figure 11.2.7 image description: The incidence and magnitude of earthquakes in British Columbia overa one-month period in March and April 2015: There were a few dozen smaller earthquakes spread outaround Vancouver Island and the sunshine coast with a magnitude of 2. Farther west along the ExplorerPlate, which is between the North American plate, the Juan de Fuca Plate, and the Pacific Plate, therewere quite a few earthquakes with a magnitude of 3 and at least one earthquake with a magnitude of4. Between the North American Plate and the Pacific Plate off the south-west coast of Haida Gwaii,there was a large cluster of earthquakes with magnitudes of 2. Along the Alaskan panhandle, there wasa collection of 2- and 3-magnitude earthquakes. In addition, there were two 3-magnitude earthquakeswest of Fort St. John in northern British Columbia and one or two 2-magnitude earthquakes. In total,this map shows one hundred and forty-nine earthquakes with a magnitude less than 2, ninety-sevenearthquakes with a magnitude of 2, thirty-nine earthquakes with a magnitude of 3, and two earthquakeswith a magnitude of 4 [Return to Figure 11.2.7]
Media Attributions
• Figure 11.2.1: Global Earthquakes © Dale Sawyer, Rice University. Used with permission.
• Figure 11.2.2: Earthquakes Around the Mid-Atlantic Ridge © Steven Earle after DaleSawyer, Rice University.
• Figure 11.2.3: Earthquakes Around the Central-American Region © Steven Earle after DaleSawyer, Rice University.
• Figure 11.2.4: Earthquakes Around the Kuril Islands. © Steven Earle after Gavin Hayes,
11.2 Earthquakes and Plate Tectonics 374

from data from the USGS [PDF].
• Figure 11.2.5: Earthquakes Around the India Plate © Steven Earle after Dale Sawyer, RiceUniversity.
• Figure 11.2.6: India-Asia Convergent Boundary © Steven Earle based on D. Vouichard, froma United Nations University document.
375 Chapter 11 Earthquakes

11.3 Measuring Earthquakes
There are two main ways to measure earthquakes. The first of these is an estimate of the energy released,and the value is referred to as magnitude. This is the number that is typically used by the press whena big earthquake happens. It is often referred to as “Richter magnitude,” but that is a misnomer, and itshould be just “magnitude.” There are many ways to measure magnitude—including Charles Richter’smethod developed in 1935—but they are all ways to estimate the same number, which is proportional tothe amount of energy released.
The other way of assessing the impact of an earthquake is to assess what people felt and how muchdamage was done. This is known as intensity. Intensity values are assigned to locations, rather thanto the earthquake itself, and therefore intensity can vary widely, depending on the proximity to theearthquake and the types of materials underneath and the local conditions.
Earthquake Magnitude
Before we look more closely at magnitude we need to review what we know about body waves, andlook at surface waves. Body waves are of two types, P waves, or primary or compression waves (likethe compression of the coils of a spring), and S waves, or secondary or shear waves (like the flick of arope). An example of P and S seismic wave records is shown in Figure 11.3.1. The critical parametersfor the measurement of magnitude are labelled, including the time interval between the arrival of the P-and S-waves—which is used to determine the distance from the earthquake to the seismic station, andthe amplitude of the S-waves—which is used to estimate the magnitude of the earthquake.
Figure 11.3.1 P-waves and S-waves from a small (M4) earthquake that took place near Vancouver Island in 1997.[Image Description]
When body waves (P or S) reach Earth’s surface, some of their energy is transformed into surface waves,of which there are two main types, as illustrated in Figure 11.3.2. Rayleigh waves are characterizedby vertical motion of the ground surface, like waves on water, while Love waves are characterized by
376
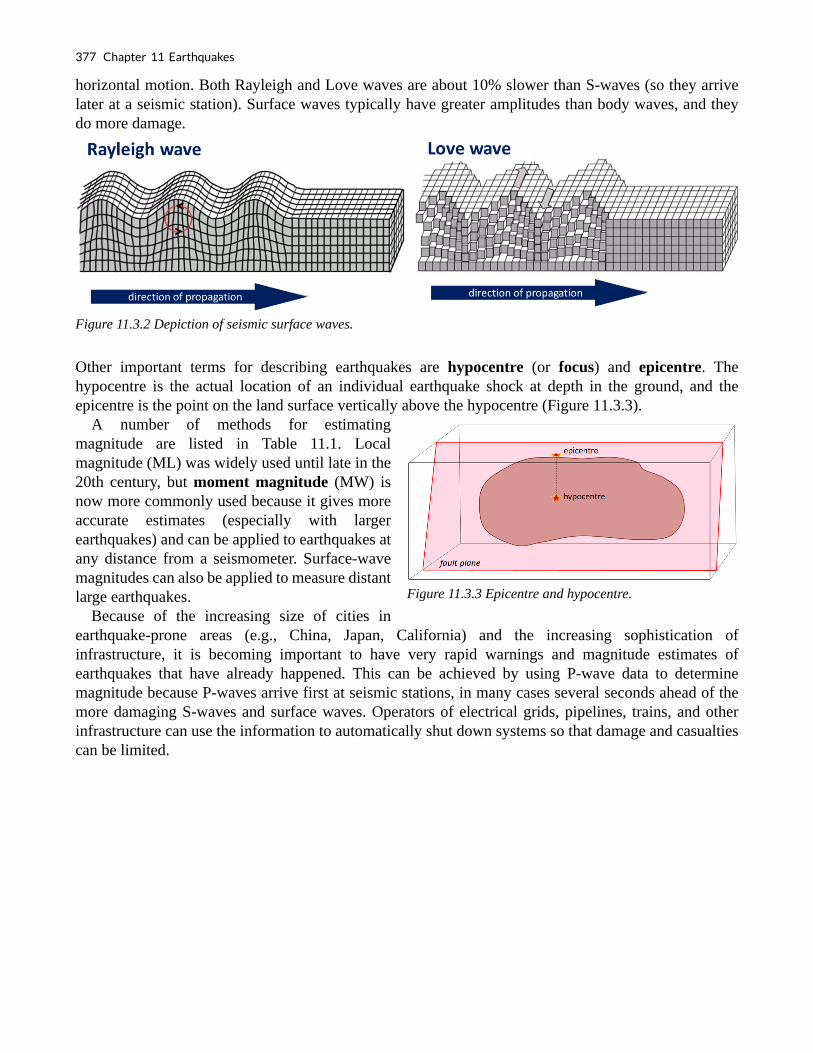
Figure 11.3.3 Epicentre and hypocentre.
horizontal motion. Both Rayleigh and Love waves are about 10% slower than S-waves (so they arrivelater at a seismic station). Surface waves typically have greater amplitudes than body waves, and theydo more damage.
Figure 11.3.2 Depiction of seismic surface waves.
Other important terms for describing earthquakes are hypocentre (or focus) and epicentre. Thehypocentre is the actual location of an individual earthquake shock at depth in the ground, and theepicentre is the point on the land surface vertically above the hypocentre (Figure 11.3.3).
A number of methods for estimatingmagnitude are listed in Table 11.1. Localmagnitude (ML) was widely used until late in the20th century, but moment magnitude (MW) isnow more commonly used because it gives moreaccurate estimates (especially with largerearthquakes) and can be applied to earthquakes atany distance from a seismometer. Surface-wavemagnitudes can also be applied to measure distantlarge earthquakes.
Because of the increasing size of cities inearthquake-prone areas (e.g., China, Japan, California) and the increasing sophistication ofinfrastructure, it is becoming important to have very rapid warnings and magnitude estimates ofearthquakes that have already happened. This can be achieved by using P-wave data to determinemagnitude because P-waves arrive first at seismic stations, in many cases several seconds ahead of themore damaging S-waves and surface waves. Operators of electrical grids, pipelines, trains, and otherinfrastructure can use the information to automatically shut down systems so that damage and casualtiescan be limited.
377 Chapter 11 Earthquakes

Table 11.1 A summary of some of the different methods for estimating earthquake magnitude.1
[Skip Table]
Type MRange
Dist.Range Comments
Local orRichter(ML)
2 to 6 0 to 400kilometres
The original magnitude relationship defined in 1935 by Richter andGutenberg. It is based on the maximum amplitude of S-waves recorded on aWood‑Anderson torsion seismograph. ML values can be calculated using datafrom modern instruments. L stands for local because it only applies toearthquakes relatively close to the seismic station.
Moment(MW)
Greaterthan3.5
All
Based on the seismic moment of the earthquake, which is equal to the averageamount of displacement on the fault times the fault area that slipped. It canalso be estimated from seismic data if the seismometer is tuned to detectlong-period body waves.
Surfacewave(MS)
5 to 8 20 to 180° A magnitude for distant earthquakes based on the amplitude of surface wavesmeasured at a period near 20 seconds.
P-wave 2 to 8 Local
Based on the amplitude of P-waves. This technique is being increasingly usedto provide very rapid magnitude estimates so that early warnings can be sentto utility and transportation operators to shut down equipment before the larger(but slower) S-waves and surface waves arrive.
Exercise 11.2 Moment magnitude estimates from earthquake parameters
Use this moment magnitude calculation tool to estimate the moment magnitude based on the approximatelength, width, and displacement values provided in the following table:
Table 11.2 Calculate Moment Magnitude Based on Length, Width, and Displacement Values
[Skip Table]
Length(kilometres)
Width(kilometres)
Displacement(metres) Earthquake MW?
60 15 4 The 1946 Vancouver Island earthquake
0.4 0.2 .5 The small Vancouver Island earthquake shown inFigure 11.3.1
20 8 4 The 2001 Nisqually earthquake described inExercise 11.3
1,100 120 10 The 2004 Indian Ocean earthquake
30 11 4 The 2010 Haiti earthquake
1. Table 11.1 by Steven Earle.
11.3 Measuring Earthquakes 378

The largest recorded earthquake had a magnitude of 9.5. Could there be a 10? You can answer that questionusing this tool. See what numbers are needed to make MW = 10. Are they reasonable?
See Appendix 3 for Exercise 11.2 answers.
The magnitude scale is logarithmic; in fact, the amount of energy released by an earthquake of M4 is32 times higher than that released by one of M3, and this ratio applies to all intervals in the scale. If weassign an arbitrary energy level of 1 unit to a M1 earthquake the energy for quakes up to M8 will be asshown on the following table:
Table 11.3 The energy of an earthquake increases by32 times at each magnitude level.
Magnitude Energy
1 1
2 32
3 1,024
4 32,768
5 1,048,576
6 33,554,432
7 1,073,741,824
8 34,359,738,368
In any given year, when there is a large earthquake on Earth (M8 or M9), the amount of energy releasedby that one event will likely exceed the energy released by all smaller earthquake events combined.
Earthquake Intensity
The intensity of earthquake shaking at any location is determined not only by the magnitude of theearthquake and its distance, but also by the type of underlying rock or unconsolidated materials. Ifbuildings are present, the size and type of buildings (and their inherent natural vibrations) are alsoimportant.
Intensity scales were first used in the late 19th century, and then adapted in the early 20th centuryby Giuseppe Mercalli and modified later by others to form what we know call the modified Mercalliintensity scale (Table 11.4). Intensity estimates are important because they allow us to characterize partsof any region into areas that are especially prone to strong shaking versus those that are not. The keyfactor in this regard is the nature of the underlying geological materials, and the weaker those are,the more likely it is that there will be strong shaking. Areas underlain by strong solid bedrock tend toexperience much less shaking than those underlain by unconsolidated river or lake sediments.
379 Chapter 11 Earthquakes
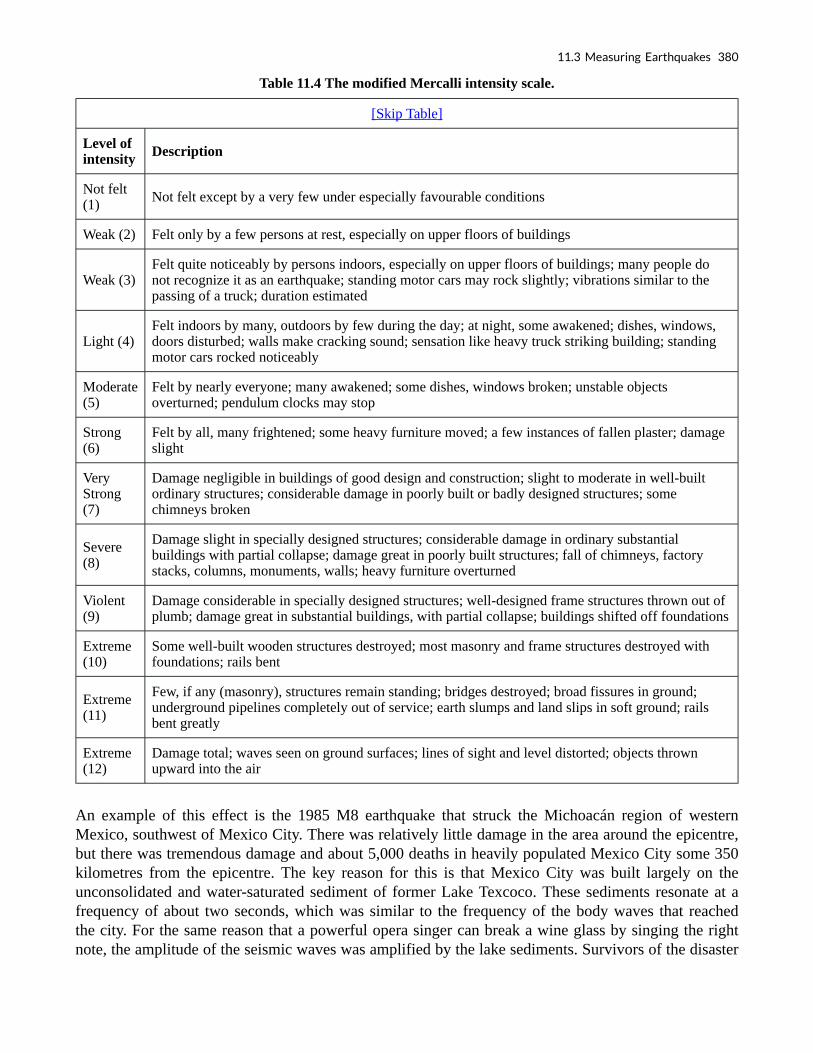
Table 11.4 The modified Mercalli intensity scale.
[Skip Table]
Level ofintensity Description
Not felt(1) Not felt except by a very few under especially favourable conditions
Weak (2) Felt only by a few persons at rest, especially on upper floors of buildings
Weak (3)Felt quite noticeably by persons indoors, especially on upper floors of buildings; many people donot recognize it as an earthquake; standing motor cars may rock slightly; vibrations similar to thepassing of a truck; duration estimated
Light (4)Felt indoors by many, outdoors by few during the day; at night, some awakened; dishes, windows,doors disturbed; walls make cracking sound; sensation like heavy truck striking building; standingmotor cars rocked noticeably
Moderate(5)
Felt by nearly everyone; many awakened; some dishes, windows broken; unstable objectsoverturned; pendulum clocks may stop
Strong(6)
Felt by all, many frightened; some heavy furniture moved; a few instances of fallen plaster; damageslight
VeryStrong(7)
Damage negligible in buildings of good design and construction; slight to moderate in well-builtordinary structures; considerable damage in poorly built or badly designed structures; somechimneys broken
Severe(8)
Damage slight in specially designed structures; considerable damage in ordinary substantialbuildings with partial collapse; damage great in poorly built structures; fall of chimneys, factorystacks, columns, monuments, walls; heavy furniture overturned
Violent(9)
Damage considerable in specially designed structures; well-designed frame structures thrown out ofplumb; damage great in substantial buildings, with partial collapse; buildings shifted off foundations
Extreme(10)
Some well-built wooden structures destroyed; most masonry and frame structures destroyed withfoundations; rails bent
Extreme(11)
Few, if any (masonry), structures remain standing; bridges destroyed; broad fissures in ground;underground pipelines completely out of service; earth slumps and land slips in soft ground; railsbent greatly
Extreme(12)
Damage total; waves seen on ground surfaces; lines of sight and level distorted; objects thrownupward into the air
An example of this effect is the 1985 M8 earthquake that struck the Michoacán region of westernMexico, southwest of Mexico City. There was relatively little damage in the area around the epicentre,but there was tremendous damage and about 5,000 deaths in heavily populated Mexico City some 350kilometres from the epicentre. The key reason for this is that Mexico City was built largely on theunconsolidated and water-saturated sediment of former Lake Texcoco. These sediments resonate at afrequency of about two seconds, which was similar to the frequency of the body waves that reachedthe city. For the same reason that a powerful opera singer can break a wine glass by singing the rightnote, the amplitude of the seismic waves was amplified by the lake sediments. Survivors of the disaster
11.3 Measuring Earthquakes 380

recounted that the ground in some areas moved up and down by about 20 centimetres every two secondsfor over two minutes. Damage was greatest to buildings between 5 and 15 storeys tall, because they alsoresonated at around two seconds, which amplified the shaking.
Exercise 11.3 Estimating intensity from personal observations
The following observations were made by residents of the Nanaimo area during the M6.8 Nisqually earthquakenear Olympia, Washington in 2001. Estimate the Mercalli intensities using Table 11.4.
Table 11.5
[Skip Table]
BuildingType Floor Shaking
FeltHow long it lasted(in seconds) Description of Motion Intensity?
House 1 no 10 Heard a large rumble lasting not even 10seconds, mirror swayed
House 2 moderate 60 Candles, pictures and CDs on bookshelf moved,towels fell off racks
House 1 no Pots hanging over stove moved and crashedtogether
House 1 weak Rolling feeling with a sudden stop, picture felloff mantle, chair moved
Apartment 1 weak 10 Sounded like a big truck then everything shookfor a short period
House 1 moderate 20-30 Teacups rattled but didn’t fall off
Institution 2 moderate 15 Creaking sounds, swaying movement ofshelving
House 1 moderate 15-30 Bed banging against the wall with me in it, dogbarking aggressively
See Appendix 3 for Exercise 11.3 answers.
381 Chapter 11 Earthquakes

Figure 11.3.4 Intensity map for the 1946 M7.3 VancouverIsland earthquake. [Long Decsription]
An intensity map for the 1946 M7.3 VancouverIsland earthquake is shown in Figure 11.3.4. Theintensity was greatest in the central island regionwhere, in some communities, chimneys weredamaged on more than 75% of buildings, someroads were made impassable, and a major rockslide occurred. The earthquake was felt as farnorth as Prince Rupert, as far south as PortlandOregon, and as far east as the Rockies.
Image Descriptions
Figure 11.3.1 image description: P-waves andS-waves from a small (M4) earthquake nearVancouver Island in 1997. The P-wave arrived in0.7 seconds with an amplitude ranging fromnegative 0.7 millimetres per second to 1.1millimetres per second and lasting until thearrival of the S-wave. The S-wave arrived at 8.7seconds, with a minimum amplitude of negative2.8 millimetres per second and a maximumamplitude of 2.7 millimetres per second. The S-wave’s net amplitude gradually decreased over the next 5seconds. [Return to Figure 11.3.1]
Figure 11.3.4 image description: The graduated intensity of the 1945 M7.3 Vancouver Islandearthquake based on the modified Mercalli intensity scale. The area surrounding the epicentre of theearthquake which included central Vancouver Island ranged between a very strong (7) and severe (8)intensity. The next ring included the northern and southern parts of Vancouver Island, as well as a part ofthe main land coast including Vancouver and much of the Sunshine coast a strong (6) intensity. The nextring, which reached experienced a moderate (5) intensity, included Seattle and much of the BC interior.The outermost ring ranged between not felt (1) and light (4) intensity. It was felt as far north as PrinceRupert and the southern tip of Haida Gwaii, south eastern BC, and as far south as north western Oregon.[Return to Figure 11.3.4]
Media Attributions
• Figure 11.3.1: © Steven Earle. CC BY.
• Figure 11.3.2 (left): “Rayleigh Wave.” Adapted by Steven Earle. Public domain.
• Figure 11.3.2 (right): “Love Wave” © Nicoguaro. Adapted by Steven Earle. CC BY.
• Figure 11.3.3: © Steven Earle. CC BY.
• Figure 11.3.4: “Vancouver Island, British Columbia June 23, 1946 – Magnitude 7.3,” ©National Resources Canada. Used under the terms allowing for non-commercialreproduction. This reproduction is a copy of an official work that is published by theGovernment of Canada. This reproduction has not been produced in affiliation with, or withthe endorsement of the Government of Canada.
11.3 Measuring Earthquakes 382

Text Attributions
• Table 11.4: The modified Mercalli intensity scale © Wikipedia. Adapted by Steven Earle. CCBY-SA.
383 Chapter 11 Earthquakes

Figure 11.4.1 A part of the Cypress Freeway in OaklandCalifornia that collapsed during the 1989 Loma Prietaearthquake.
11.4 The Impacts of Earthquakes
Some of the common impacts of earthquakes include structural damage to buildings, fires, damage tobridges, highways, pipelines and electrical transmission lines, initiation of slope failures, liquefaction,and tsunami. The types of impacts depend to a large degree on where the earthquake is located: whetherit is predominantly urban or rural, densely or sparsely populated, highly developed or underdeveloped,and of course on the ability of the infrastructure to withstand shaking.
As we’ve seen from the example of the 1985 Mexico earthquake, the geological foundations on whichstructures are built can have a significant impact on earthquake shaking. When an earthquake happens,the seismic waves produced have a wide range of frequencies. The energy of the higher frequency wavestends to be absorbed by solid rock, while the lower frequency waves (with periods slower than onesecond) pass through the solid rock without being absorbed, but are eventually absorbed and amplifiedby soft sediments. It is therefore very common to see much worse earthquake damage in areas underlainby soft sediments than in areas of solid rock. A good example of this is in the Oakland area near SanFrancisco, where parts of a two-layer highway built on soft sediments collapsed during the 1989 LomaPrieta earthquake (Figure 11.4.1).
Building damage is also greatest in areas ofsoft sediments, and multi-storey buildings tend tobe more seriously damaged than smaller ones.Buildings can be designed to withstand mostearthquakes, and this practice is increasinglyapplied in earthquake-prone regions. Turkey isone such region, and even though Turkey had arelatively strong building code in the 1990s,adherence to the code was poor, as builders didwhatever they could to save costs, includingusing inappropriate materials in concrete andreducing the amount of steel reinforcing. Theresult was that there were over 17,000 deaths inthe 1999 M7.6 Izmit earthquake (Figure 11.4.2).After two devastating earthquakes that year,Turkish authorities strengthened the buildingcode further, but the new code has been applied only in a few regions, and enforcement of the code is stillweak, as revealed by the amount of damage from a M7.1 earthquake in eastern Turkey in 2011.
384

Figure 11.4.2 Buildings damaged by the 1999 earthquake in the Izmit area, Turkey.
Fires are commonly associated with earthquakes because fuel pipelines rupture and electrical lines aredamaged when the ground shakes (Figure 11.4.3). Most of the damage in the great 1906 San Franciscoearthquake was caused by massive fires in the downtown area of the city (Figure 11.4.4). Some 25,000buildings were destroyed by those fires, which were fuelled by broken gas pipes. Fighting the fires wasdifficult because water mains had also ruptured. The risk of fires can be reduced through P-wave earlywarning systems if utility operators can reduce pipeline pressure and close electrical circuits.
Figure 11.4.3 Some of the effects of the 2011 Tohoku earthquake in the Sendai area of Japan. An oil refinery is on fire,and a vast area has been flooded by a tsunami.
385 Chapter 11 Earthquakes
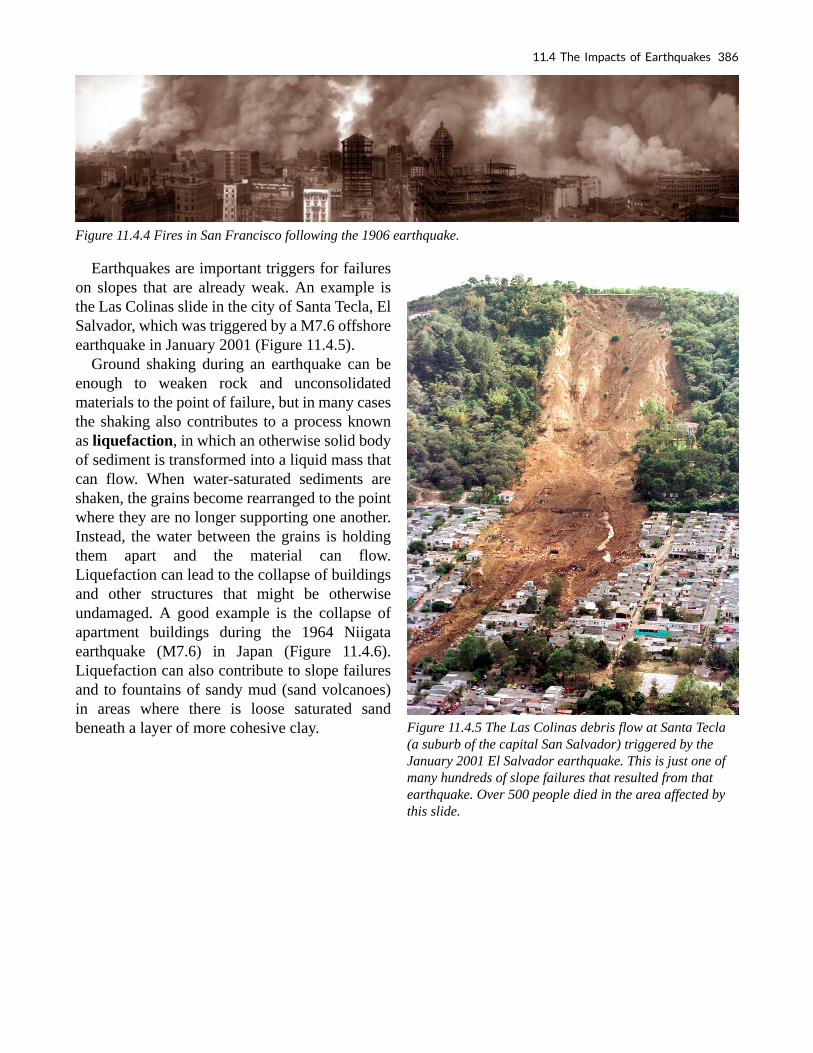
Figure 11.4.5 The Las Colinas debris flow at Santa Tecla(a suburb of the capital San Salvador) triggered by theJanuary 2001 El Salvador earthquake. This is just one ofmany hundreds of slope failures that resulted from thatearthquake. Over 500 people died in the area affected bythis slide.
Figure 11.4.4 Fires in San Francisco following the 1906 earthquake.
Earthquakes are important triggers for failureson slopes that are already weak. An example isthe Las Colinas slide in the city of Santa Tecla, ElSalvador, which was triggered by a M7.6 offshoreearthquake in January 2001 (Figure 11.4.5).
Ground shaking during an earthquake can beenough to weaken rock and unconsolidatedmaterials to the point of failure, but in many casesthe shaking also contributes to a process knownas liquefaction, in which an otherwise solid bodyof sediment is transformed into a liquid mass thatcan flow. When water-saturated sediments areshaken, the grains become rearranged to the pointwhere they are no longer supporting one another.Instead, the water between the grains is holdingthem apart and the material can flow.Liquefaction can lead to the collapse of buildingsand other structures that might be otherwiseundamaged. A good example is the collapse ofapartment buildings during the 1964 Niigataearthquake (M7.6) in Japan (Figure 11.4.6).Liquefaction can also contribute to slope failuresand to fountains of sandy mud (sand volcanoes)in areas where there is loose saturated sandbeneath a layer of more cohesive clay.
11.4 The Impacts of Earthquakes 386

Figure 11.4.6 Collapsed apartment buildings in the Niigata area of Japan. The materialbeneath the buildings was liquefied to varying degrees by the 1964 earthquake.
Parts of the Fraser River delta are prone to liquefaction-related damage because the region ischaracterized by a 2 metre to 3 metre thick layer of fluvial silt and clay over top of at least 10 metresof water-saturated fluvial sand (Figure 11.4.7). Under these conditions, it can be expected that seismicshaking will be amplified and that the sandy sediments will liquefy. This could lead to subsidence andtilting of buildings, and to failure and sliding of the silt and clay layer. Current building-code regulationsin the Fraser delta area require that measures be taken to strengthen the ground underneath multi-storeybuildings prior to construction.
387 Chapter 11 Earthquakes

Figure 11.4.8
Figure 11.4.7 Recent unconsolidated sedimentary layers in the Fraser River delta area (top) and the potentialconsequences in the event of a damaging earthquake.
Exercise 11.4 Creating liquefaction and discovering the harmonic frequency
There are a few ways that you can demonstrate the process of liquefaction for yourself. The simplest is to goto a sandy beach (lake, ocean, or river) and find a place near the water’s edge where the sand is wet. This isbest done with your shoes off, so let’s hope it’s not too cold! While standing in one place on a wet part of thebeach, start moving your feet up and down at a frequency of about once per second. Within a few seconds thepreviously firm sand will start to lose strength, and you’ll gradually sink in up to your ankles.
If you can’t get to a beach, or if the weather isn’tcooperating, put some sand (sandbox sand will do)into a small container, saturate it with water, and thenpour the excess water off. You can shake it gently toget the water to separate and then pour the excesswater away, and you may have to do that more thanonce. Place a small rock on the surface of the sand; itshould sit there for hours without sinking in. Now,holding the container in one hand gently thump theside or the bottom with your other hand, about twicea second. The rock should gradually sink in as thesand around it becomes liquefied.
11.4 The Impacts of Earthquakes 388

Figure 11.4.9 Elastic deformation and rebound ofoverriding plate at a subduction setting (B). The release ofthe locked zone during an earthquake (C) results in bothuplift and subsidence on the sea floor, and this istransmitted to the water overhead, resulting in a tsunami.
As you were moving your feet up and down or thumping the pot, it’s likely that you soon discovered themost effective rate for getting the sand to liquefy; this would have been close to the natural harmonic frequencyfor that body of material. Stepping up and down as fast as you can (several times per second) on the wet beachwould not have been effective, nor would you have achieved much by stepping once every several seconds.The body of sand vibrates most readily in response to shaking that is close to its natural harmonic frequency,and liquefaction is also most likely to occur at that frequency.
See Appendix 3 for Exercise 11.4 answers.
Earthquakes that take place beneath the ocean have the potential to generate tsunami. (Tsunami isthe Japanese word for harbour wave. It is the same in both singular and plural.) The most likelysituation for a significant tsunami is a large (M7 or greater) subduction-related earthquake. As shownin Figure 11.4.9, during the time between earthquakes the overriding plate becomes distorted by elasticdeformation; it is squeezed laterally (Figure 11.4.9B) and pushed up.
When an earthquake happens (Figure 11.4.9C),the plate rebounds and there is both uplift andsubsidence on the sea floor, in some cases by asmuch as several metres vertically over an area ofthousands of square kilometres. This verticalmotion is transmitted through the water columnwhere it generates a series of waves that thenspread across the ocean.
Subduction earthquakes with magnitude lessthan 7 do not typically generate significanttsunami because the amount of verticaldisplacement of the sea floor is minimal. Sea-floor transform earthquakes, even large ones (M7to M8), don’t typically generate tsunami either,because the motion is mostly side to side, notvertical.
Tsunami waves travel at velocities of severalhundred kilometres per hour and easily make it tothe far side of an ocean in about the same time asa passenger jet. The simulated one shown inFigure 11.4.10 is similar to that created by the1700 Cascadia earthquake off the coast of BritishColumbia, Washington, and Oregon, which wasrecorded in Japan nine hours later.
389 Chapter 11 Earthquakes
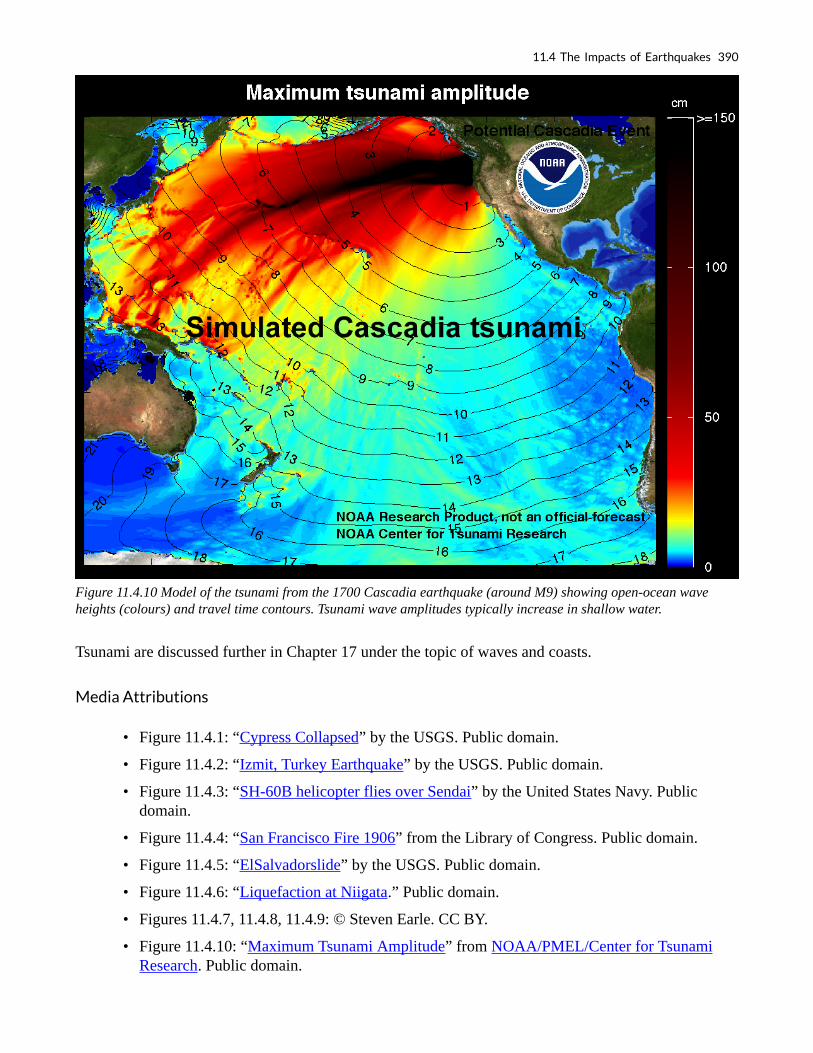
Figure 11.4.10 Model of the tsunami from the 1700 Cascadia earthquake (around M9) showing open-ocean waveheights (colours) and travel time contours. Tsunami wave amplitudes typically increase in shallow water.
Tsunami are discussed further in Chapter 17 under the topic of waves and coasts.
Media Attributions
• Figure 11.4.1: “Cypress Collapsed” by the USGS. Public domain.
• Figure 11.4.2: “Izmit, Turkey Earthquake” by the USGS. Public domain.
• Figure 11.4.3: “SH-60B helicopter flies over Sendai” by the United States Navy. Publicdomain.
• Figure 11.4.4: “San Francisco Fire 1906” from the Library of Congress. Public domain.
• Figure 11.4.5: “ElSalvadorslide” by the USGS. Public domain.
• Figure 11.4.6: “Liquefaction at Niigata.” Public domain.
• Figures 11.4.7, 11.4.8, 11.4.9: © Steven Earle. CC BY.
• Figure 11.4.10: “Maximum Tsunami Amplitude” from NOAA/PMEL/Center for TsunamiResearch. Public domain.
11.4 The Impacts of Earthquakes 390

11.5 Forecasting Earthquakes and Minimizing Damage and Casualties
It has long been a dream of seismologists, geologists, and public safety officials, to be able to accuratelypredict the location, magnitude, and timing of earthquakes on time scales that would be useful forminimizing danger to the public and damage to infrastructure (e.g., weeks, days, hours). Many differentavenues of prediction have been explored, such as using observations of warning foreshocks, changesin magnetic fields, seismic tremor, changing groundwater levels, strange animal behaviour, observedperiodicity, stress transfer considerations, and others. So far, none of the research into earthquakeprediction has provided a reliable method. Although there are some reports of successful earthquakepredictions, they are rare, and many are surrounded by doubtful circumstances.
The problem with earthquake predictions, as with any other type of prediction, is that they have tobe accurate most of the time, not just some of the time. We have come to rely on weather predictionsbecause they are generally (and increasingly) accurate. But if we try to predict earthquakes and are onlyaccurate 10% of the time (and even that isn’t possible with the current state of knowledge), the publicwill lose faith in the process very quickly, and then will ignore all of the predictions. Efforts are currentlyfocused on forecasting earthquake probabilities, rather than predicting their occurrence.
There was great hope for earthquake predictions late in the 1980s when attention was focused onpart of the San Andreas Fault at Parkfield, about 200 kilometres south of San Francisco. Between 1881and 1965 there were five earthquakes at Parkfield, most spaced at approximately 20-year intervals, allconfined to the same 20 kilometre-long segment of the fault, and all very close to M6 (Figure 11.5.1).Both the 1934 and 1966 earthquakes were preceded by small foreshocks exactly 17 minutes before themain quake.
Figure 11.5.1 Earthquakes on the Parkfield segment of the San Andreas Fault between 1881 and 2004.
The U.S. Geological Survey recognized this as an excellent opportunity to understand earthquakes andearthquake prediction, so they armed the Parkfield area with a huge array of geophysical instruments andwaited for the next quake, which was expected to happen around 1987. Nothing happened! The “1987Parkfield earthquake” finally struck in September 2004. Fortunately all of the equipment was still there,
391

Figure 11.5.2 Probabilities of a M6.7 or larger earthquakeover the period 2014 to 2043 on various faults in the SanFrancisco Bay region of California.
but it was no help from the perspective of earthquake prediction. There were no significant precursorsto the 2004 Parkfield earthquake in any of the parameters measured, including seismicity, harmonictremor, strain (rock deformation), magnetic field, the conductivity of the rock, or creep, and there wasno foreshock. In other words, even though every available technique was used to monitor it, the 2004earthquake came as a complete surprise, with no warning whatsoever.
The hope for earthquake prediction is not dead,but it was hit hard by the Parkfield experiment.The current focus in earthquake-prone regions isto provide forecasts of the probability of anearthquake of a certain magnitude within acertain time period—typically a number ofdecades—while officials focus on ensuring thatthe population is educated about earthquake risksand that buildings and other infrastructure are assafe as can be. An example of this approach forthe San Francisco Bay region of California isshown in Figure 11.5.2. Based on a wide range ofinformation, including past earthquake history,accumulated stress from plate movement, andknown stress transfer, seismologists andgeologists have predicted the likelihood of aM6.7 or greater earthquake on each of eightmajor faults that cut through the region. Thegreatest probabilities are on the Hayward, RogersCreek, Calaveras, and San Andreas Faults. Asshown in Figure 11.5.2, there is a 72% chancethat a major and damaging earthquake will takeplace somewhere in the region prior to 2043.
As we’ve discussed already, it’s not sufficientto have strong building codes, they have to beenforced. Building code compliance is quiterobust in most developed countries, but is sadlyinadequate in many developing countries.
It’s also not enough just to focus on newbuildings; we have to make sure that existing buildings—especially schools and hospitals—and otherstructures such as bridges and dams, are as safe as they can be. An example of how this is applied toschools in B.C. is described in Exercise 11.5.
Making the Seismic Upgrade in B.C.’s Schools
British Columbia is in the middle of a multi-billion-dollar program to make schools safer for students.The program is focused on older schools, because, according to the government, those built since 1992already comply with modern seismic codes. Some schools would require too much work to makeupgrading economically feasible and they are slowly being replaced. Where upgrading is feasible, theschool is assessed carefully before any upgrade work is initiated.
11.5 Forecasting Earthquakes and Minimizing Damage and Casualties 392

An example is Sangster Elementary in Colwood on southern Vancouver Island. The school wasoriginally built in 1957, with a major addition in 1973. Ironically, the newer part of the school, builtof concrete blocks, required strengthening with the addition of a steel framework, while the 1957 part,which is a wood-frame building, did not require seismic upgrading. The work was completed in 2014.
Figure 11.5.3 Sangster Elementary image from Google Maps – street view.
As of July 2019, upgrades had been completed at 168 B.C. schools, 17 were underway, and an additional26 were ready to proceed, with funding identified. Another 274 schools were listed as needing upgrades.
1
Exercise 11.5 Is your local school on the seismic upgrade list?
Here is The B.C. Ministry of Education’s list of schools in the seismic mitigation program as of July 2019:Progress Report: Seismic Mitigation Program (BC Schools).
If you live in B.C., you can check to see if any of the schools in your area are on the list. If so, you might beable to find out, either from the school or on the Internet, what type of work has been done or is planned.
The seismic mitigation program has a strong focus on the Lower Mainland and Vancouver Island. Why doyou think that is the case, and is it reasonable?
See Appendix 3 for Exercise 11.5 answers.
The final part of earthquake preparedness involves the formulation of public emergency plans, includingescape routes, medical facilities, shelters, and food and water supplies. It also includes personalplanning, such as emergency supplies (food, water, shelter, and warmth), escape routes from houses andoffices, and communication strategies (with a focus on ones that don’t involve the cellular network).
Media Attributions
• Figure 11.5.1: © Steven Earle. CC BY.
• Figure 11.5.2: “San Francisco Bay region Earthquake Probability [PDF]” by USGS. Publicdomain.
1. "Seismic Mitigation Program Progress Report, July 2019." Accessed July 21, 2019 from https://www2.gov.bc.ca/gov/content/education-
training/k-12/administration/capital/seismic-mitigation
393 Chapter 11 Earthquakes

• Figure 11.5.3: Sangster Elementary school. © 2018 Google Maps. Street View. See Google’spermissions for non-commercial use.
11.5 Forecasting Earthquakes and Minimizing Damage and Casualties 394

Summary
The topics covered in this chapter can be summarized as follows:
Section Summary
11.1 What is anEarthquake?
An earthquake is the shaking that results when a body of rock that has been deformedbreaks and the two sides quickly slide past each other. The rupture is initiated at a point butquickly spreads across an area of a fault, via a series of aftershocks initiated by stresstransfer. Episodic tremor and slip is a periodic slow movement, accompanied by harmonictremors, along the middle part of a subduction zone boundary.
11.2 Earthquakesand PlateTectonics
Most earthquakes take place at or near plate boundaries, especially at transform boundaries(where most quakes are at less than a 30 kilometre depth) and at convergent boundaries(where they can be at well over a 100 kilometre depth). The largest earthquakes happen atsubduction zones, typically in the upper section where the rock is relatively cool.
11.3 MeasuringEarthquakes
Magnitude is a measure of the amount of energy released by an earthquake, and it isproportional to the area of the rupture surface and to the amount of displacement. Althoughany earthquake has only one magnitude value, it can be estimated in various ways, mostlyinvolving seismic data. Intensity is a measure of the amount of shaking experienced anddamage done at a particular location around the earthquake. Intensity will vary dependingon the distance to the epicentre, the depth of the earthquake, and the geological nature ofthe material below surface.
11.4 The Impactsof Earthquakes
Damage to buildings is the most serious consequence of most large earthquakes. Theamount of damage is related to the type and size of buildings, how they are constructed,and the nature of the material on which they are built. Other important consequences arefires, damage to bridges and highways, slope failures, liquefaction, and tsunami. Tsunami,which are almost all related to large subduction earthquakes, can be devastating.
11.5 ForecastingEarthquakes andMinimizingDamage andCasualties
There is no reliable technology for predicting earthquakes, but the probability of onehappening within a certain time period can be forecast. We can minimize earthquakeimpacts by ensuring that citizens are aware of the risk, that building codes are enforced,that existing buildings like schools and hospitals are seismically sound, and that both publicand personal emergency plans are in place.
Questions for Review
1. Define the term earthquake.
2. How does elastic rebound theory help to explain how earthquakes happen?
3. What is a rupture surface, and how does the area of a rupture surface relate to earthquakemagnitude?
395

Figure A
4. What is an aftershock and what is the relationship between aftershocks and stress transfer?
5. Episodic slip on the middle part of the Cascadia subduction zone is thought to result in anincrease in the stress on the upper part where large earthquakes take place. Why?
6. Explain the difference between magnitude and intensity as expressions of the size of anearthquake.
7. How much more energy is released by an M7.3 earthquake compared with an M5.3 earthquake?
8. Figure A shows a map of earthquake locations with the depths coded according the colour schemeused in Figure 11.2.5. What type of plate boundary is this?
9. Draw a line on the map to showapproximately where the plate boundary issituated.
10. In which directions are the plates moving, andwhere in the world might this be?
11. Earthquakes are relatively common along themid-ocean ridges. At what type of plateboundary do most such quakes occur?
12. The northward motion of the Pacific Platerelative to the North America Plate takesplace along two major transform faults. Whatare they called?
13. Why is earthquake damage likely to be more severe for buildings built on unconsolidatedsediments as opposed to solid rock?
14. Why are fires common during earthquakes?
15. What type of earthquake is likely to lead to a tsunami?
16. What did we learn about earthquake prediction from the 2004 Parkfield earthquake?
17. What are some of the things we should know about an area in order to help minimize the impactsof an earthquake?
18. What is the difference between earthquake prediction and forecasting?
Answers to Review Questions can be found in Appendix 2.
Media Attributions
• Figure A: © Steven Earle. CC BY.
Summary 396


![HAIDA LAND USE VISION - Council of the Haida Nation · Haida Gwaii Yah’guudang — respecting Haida Gwaii HAIDA GWAII YAH’GUUDANG [ respecting Haida Gwaii ] HAIDA LAND USE VISION](https://static.fdocuments.net/doc/165x107/5ae04c117f8b9a5a668d5ef6/haida-land-use-vision-council-of-the-haida-gwaii-yahguudang-respecting.jpg)