Chapter 10 Business Analytics
33
1 IS 310 – Business Statistics IS 310 – Business Statistics IS 310 Business Statisti cs CSU Long Beach
-
Upload
rkpatham1718 -
Category
Documents
-
view
50 -
download
3
description
Business analytics
Transcript of Chapter 10 Business Analytics
1 1 Slide
Slide
IS 310 – Business StatisticsIS 310 – Business Statistics
IS 310
Business Statistic
sCSU
Long Beach
2 2 Slide
Slide
IS 310 – Business StatisticsIS 310 – Business Statistics
Inferences on Two PopulationsInferences on Two Populations
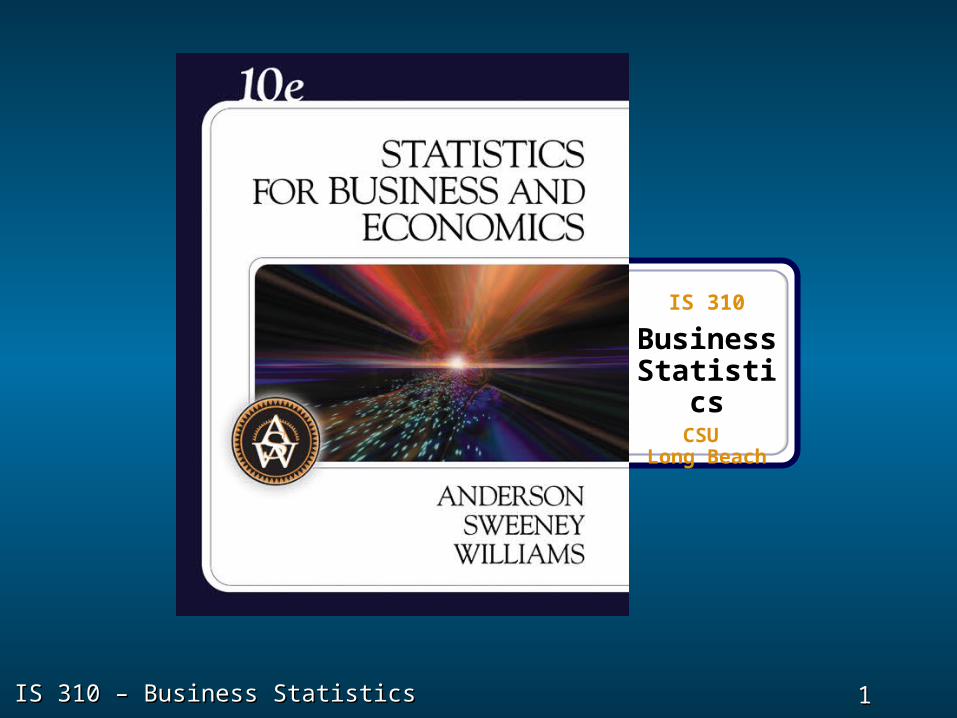
In the past, we dealt with one population mean In the past, we dealt with one population mean and one population proportion. However, and one population proportion. However, there are situations where two populations are there are situations where two populations are involved dealing with two means. involved dealing with two means.
Examples are the following:Examples are the following:
O We want to compare the mean salaries of male and O We want to compare the mean salaries of male and female graduates (two populations and two means).female graduates (two populations and two means).
O We want to compare the mean miles per gallon(MPG) of O We want to compare the mean miles per gallon(MPG) of two comparable automobile makes (two populations two comparable automobile makes (two populations and two means)and two means)
3 3 Slide
Slide
IS 310 – Business StatisticsIS 310 – Business Statistics
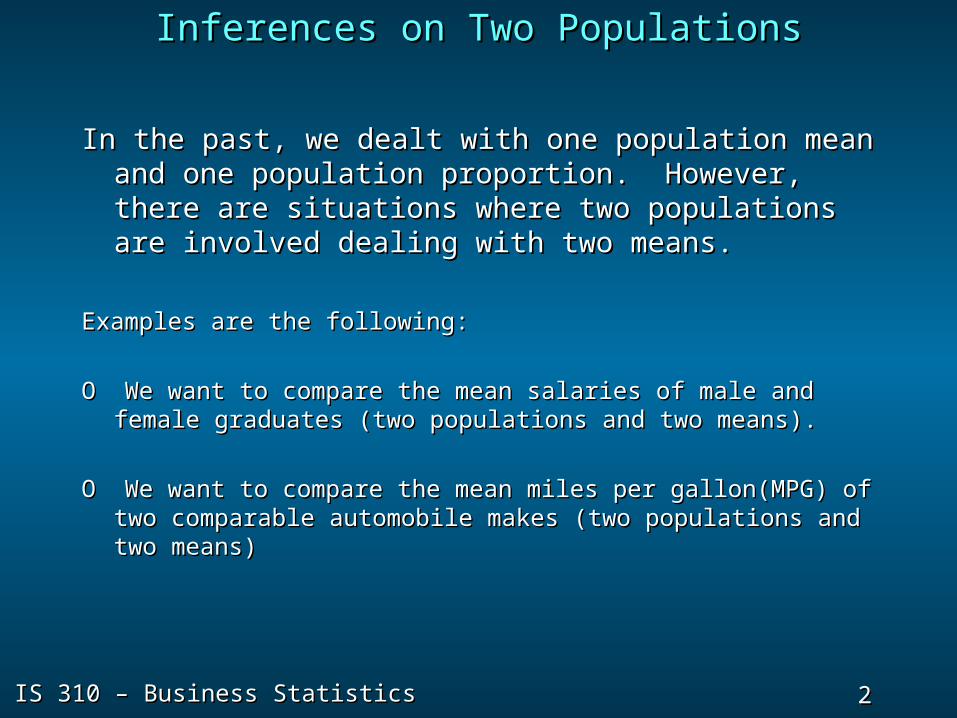
Statistical Inferences About MeansStatistical Inferences About Meansand Proportions with Two Populationsand Proportions with Two Populations
Inferences About the Difference BetweenInferences About the Difference Between
Two Population Means: Two Population Means: 11 and and 22 Known Known Inferences About the Difference BetweenInferences About the Difference Between
Two Population Means: Two Population Means: 11 and and 22 Unknown Unknown
4 4 Slide
Slide
IS 310 – Business StatisticsIS 310 – Business Statistics
Inferences About the Difference BetweenInferences About the Difference BetweenTwo Population Means: Two Population Means: 1 1 and and 2 2 Known Known
Interval Estimation of Interval Estimation of 11 – – 22
Hypothesis Tests About Hypothesis Tests About 11 – – 22
5 5 Slide
Slide
IS 310 – Business StatisticsIS 310 – Business Statistics
Estimating the Difference BetweenEstimating the Difference BetweenTwo Population MeansTwo Population Means
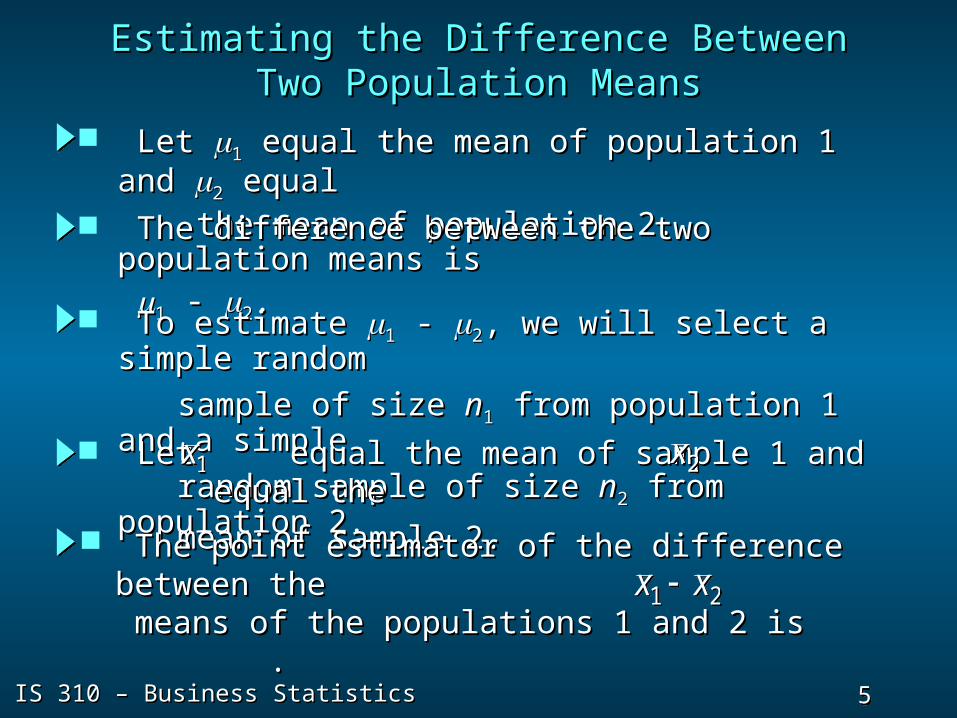
Let Let 11 equal the mean of population 1 and equal the mean of population 1 and 22 equalequal
the mean of population 2.the mean of population 2. The difference between the two population The difference between the two population means ismeans is 11 - - 22.. To estimate To estimate 11 - - 22, we will select a simple , we will select a simple randomrandom
sample of size sample of size nn11 from population 1 and a from population 1 and a simplesimple
random sample of size random sample of size nn22 from population 2. from population 2. Let equal the mean of sample 1 and Let equal the mean of sample 1 and
equal theequal the
mean of sample 2.mean of sample 2.
x1x1 x2x2
The point estimator of the difference between The point estimator of the difference between thethe
means of the populations 1 and 2 is .means of the populations 1 and 2 is .x x1 2x x1 2
6 6 Slide
Slide
IS 310 – Business StatisticsIS 310 – Business Statistics
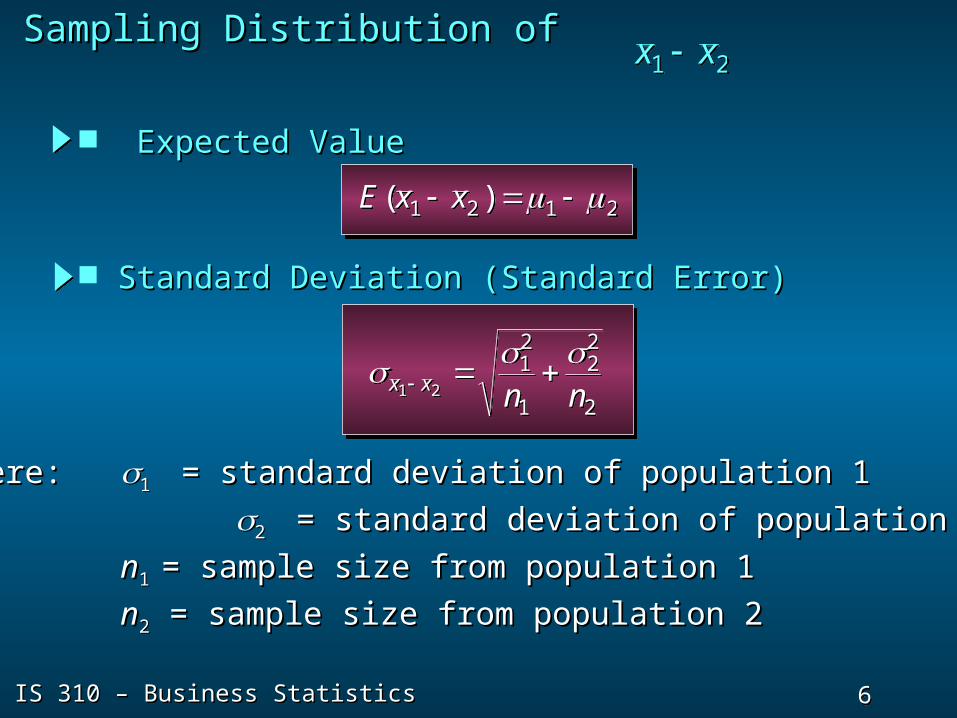
Expected ValueExpected Value
Sampling Distribution of Sampling Distribution of x x1 2x x1 2
E x x( )1 2 1 2 E x x( )1 2 1 2
Standard Deviation (Standard Error)Standard Deviation (Standard Error)
x x n n1 2
12
1
22
2
x x n n1 2
12
1
22
2
where: where: 1 1 = standard deviation of population 1 = standard deviation of population 1
2 2 = standard deviation of population 2 = standard deviation of population 2
nn1 1 = sample size from population 1= sample size from population 1
nn22 = sample size from population 2 = sample size from population 2
7 7 Slide
Slide
IS 310 – Business StatisticsIS 310 – Business Statistics
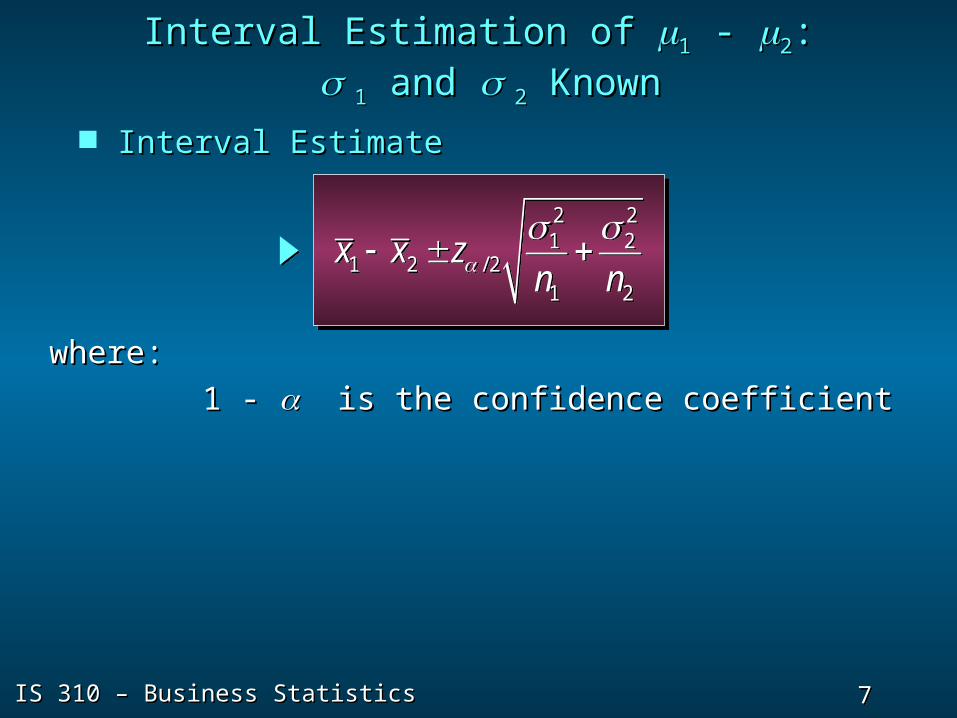
Interval EstimateInterval Estimate
Interval Estimation of Interval Estimation of 11 - - 22:: 1 1 and and 2 2 Known Known
2 21 2
1 2 / 21 2
x x zn n
2 21 2
1 2 / 21 2
x x zn n
where:where:
1 - 1 - is the confidence coefficient is the confidence coefficient
8 8 Slide
Slide
IS 310 – Business StatisticsIS 310 – Business Statistics
Interval Estimation of Interval Estimation of 11 - - 22:: 1 1 and and 2 2 Known Known
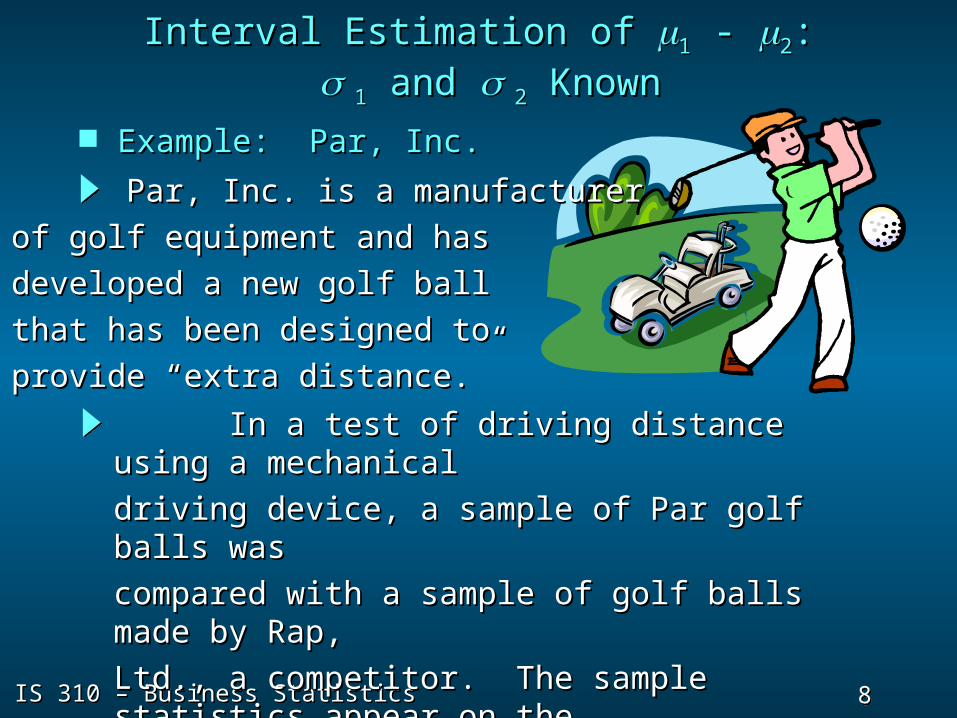
In a test of driving distance using a In a test of driving distance using a mechanicalmechanical
driving device, a sample of Par golf balls wasdriving device, a sample of Par golf balls was
compared with a sample of golf balls made by compared with a sample of golf balls made by Rap,Rap,
Ltd., a competitor. The sample statistics appear Ltd., a competitor. The sample statistics appear on theon the
next slide.next slide.
Par, Inc. is a manufacturerPar, Inc. is a manufacturer
of golf equipment and hasof golf equipment and has
developed a new golf balldeveloped a new golf ball
that has been designed tothat has been designed to
provide “extra distance.”provide “extra distance.”
Example: Par, Inc.Example: Par, Inc.

9 9 Slide
Slide
IS 310 – Business StatisticsIS 310 – Business Statistics
Example: Par, Inc.Example: Par, Inc.
Interval Estimation of Interval Estimation of 11 - - 22:: 1 1 and and 2 2 Known Known
Sample SizeSample Size
Sample MeanSample Mean
Sample #1Sample #1Par, Inc.Par, Inc.
Sample #2Sample #2Rap, Ltd.Rap, Ltd.
120 balls120 balls 80 balls80 balls
275 yards 258 yards275 yards 258 yards
Based on data from previous driving distanceBased on data from previous driving distancetests, the two population standard deviations aretests, the two population standard deviations areknown with known with 1 1 = 15 yards and = 15 yards and 2 2 = 20 yards. = 20 yards.
10 10 Slide
Slide
IS 310 – Business StatisticsIS 310 – Business Statistics
Interval Estimation of Interval Estimation of 11 - - 22:: 1 1 and and 2 2 Known Known
Example: Par, Inc.Example: Par, Inc.
Let us develop a 95% confidence interval Let us develop a 95% confidence interval estimateestimate
of the difference between the mean driving of the difference between the mean driving distances ofdistances of
the two brands of golf ball.the two brands of golf ball.
11 11 Slide
Slide
IS 310 – Business StatisticsIS 310 – Business Statistics
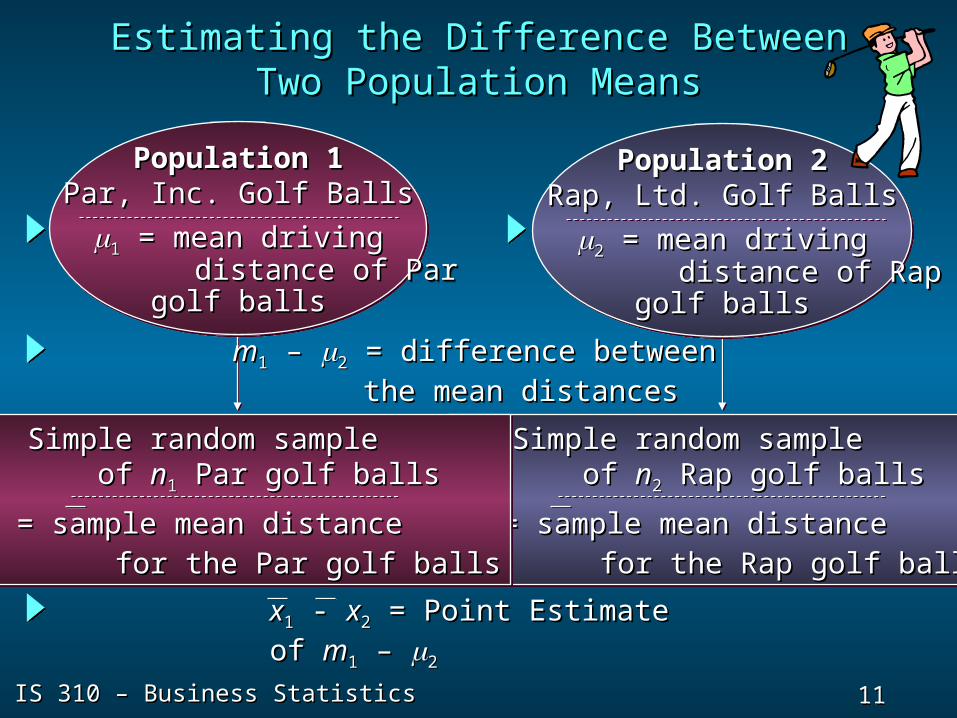
Estimating the Difference BetweenEstimating the Difference BetweenTwo Population MeansTwo Population Means
mm11 – – 22 = difference between= difference between the mean distancesthe mean distances
xx11 - - xx22 = Point Estimate of = Point Estimate of mm11 – – 22
Population 1Population 1Par, Inc. Golf BallsPar, Inc. Golf Balls
11 = mean driving = mean driving distance of Pardistance of Par
golf ballsgolf balls
Population 1Population 1Par, Inc. Golf BallsPar, Inc. Golf Balls
11 = mean driving = mean driving distance of Pardistance of Par
golf ballsgolf balls
Population 2Population 2Rap, Ltd. Golf BallsRap, Ltd. Golf Balls
22 = mean driving = mean driving distance of Rapdistance of Rap
golf ballsgolf balls
Population 2Population 2Rap, Ltd. Golf BallsRap, Ltd. Golf Balls
22 = mean driving = mean driving distance of Rapdistance of Rap
golf ballsgolf balls
Simple random sampleSimple random sample of of nn22 Rap golf balls Rap golf balls
xx22 = sample mean distance = sample mean distance for the Rap golf ballsfor the Rap golf balls
Simple random sampleSimple random sample of of nn22 Rap golf balls Rap golf balls
xx22 = sample mean distance = sample mean distance for the Rap golf ballsfor the Rap golf balls
Simple random sampleSimple random sample of of nn11 Par golf balls Par golf balls
xx11 = sample mean distance = sample mean distance for the Par golf ballsfor the Par golf balls
Simple random sampleSimple random sample of of nn11 Par golf balls Par golf balls
xx11 = sample mean distance = sample mean distance for the Par golf ballsfor the Par golf balls

12 12 Slide
Slide
IS 310 – Business StatisticsIS 310 – Business Statistics
Point Estimate of Point Estimate of 11 - - 22
Point estimate of Point estimate of 11 2 2 ==x x1 2x x1 2
where:where:
11 = mean distance for the population = mean distance for the population of Par, Inc. golf ballsof Par, Inc. golf balls
22 = mean distance for the population = mean distance for the population of Rap, Ltd. golf ballsof Rap, Ltd. golf balls
= 275 = 275 258 258
= 17 yards= 17 yards

13 13 Slide
Slide
IS 310 – Business StatisticsIS 310 – Business Statistics
x x zn n1 2 2
12
1
22
2
2 2
17 1 9615120
2080
/ .( ) ( )
x x zn n1 2 2
12
1
22
2
2 2
17 1 9615120
2080
/ .( ) ( )
Interval Estimation of Interval Estimation of 11 - - 22::11 and and 22 Known Known
We are 95% confident that the difference betweenWe are 95% confident that the difference betweenthe mean driving distances of Par, Inc. balls and Rap,the mean driving distances of Par, Inc. balls and Rap,Ltd. balls is 11.86 to 22.14 yards.Ltd. balls is 11.86 to 22.14 yards.
17 17 ++ 5.14 or 11.86 yards to 22.14 yards 5.14 or 11.86 yards to 22.14 yards
14 14 Slide
Slide
IS 310 – Business StatisticsIS 310 – Business Statistics
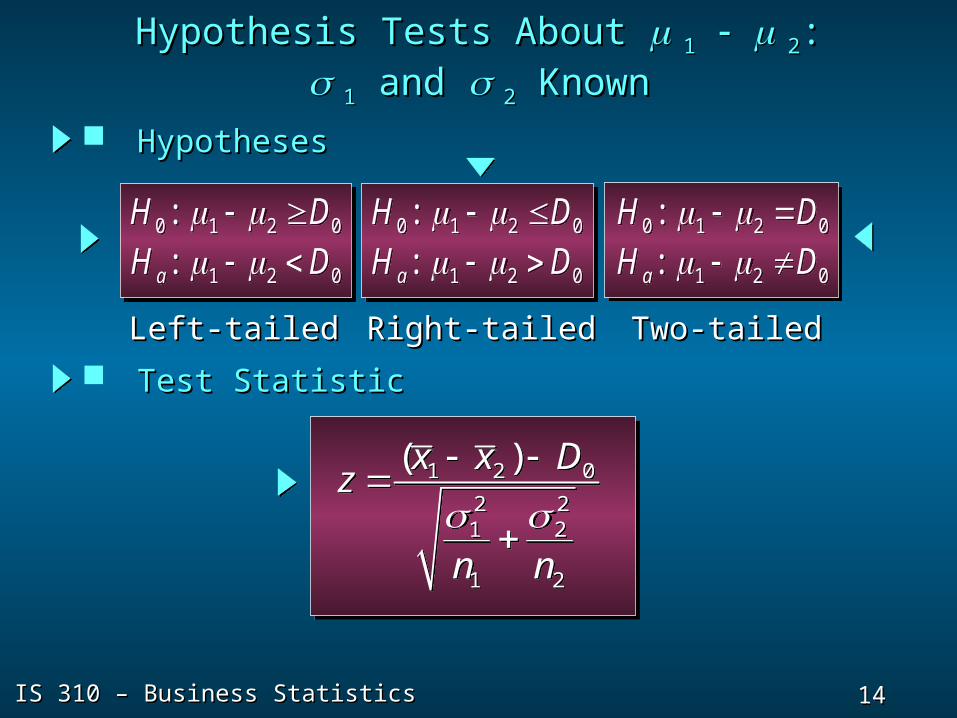
Hypothesis Tests About Hypothesis Tests About 1 1 2 2:: 1 1 and and 2 2 Known Known
HypothesesHypotheses
1 2 0
2 21 2
1 2
( )x x Dz
n n
1 2 0
2 21 2
1 2
( )x x Dz
n n
1 2 0: aH D 1 2 0: aH D 0 1 2 0: H D 0 1 2 0: H D 0 1 2 0: H D 0 1 2 0: H D
1 2 0: aH D 1 2 0: aH D 0 1 2 0: H D 0 1 2 0: H D 1 2 0: aH D 1 2 0: aH D
Left-tailedLeft-tailed Right-tailedRight-tailed Two-tailedTwo-tailed
Test StatisticTest Statistic
15 15 Slide
Slide
IS 310 – Business StatisticsIS 310 – Business Statistics
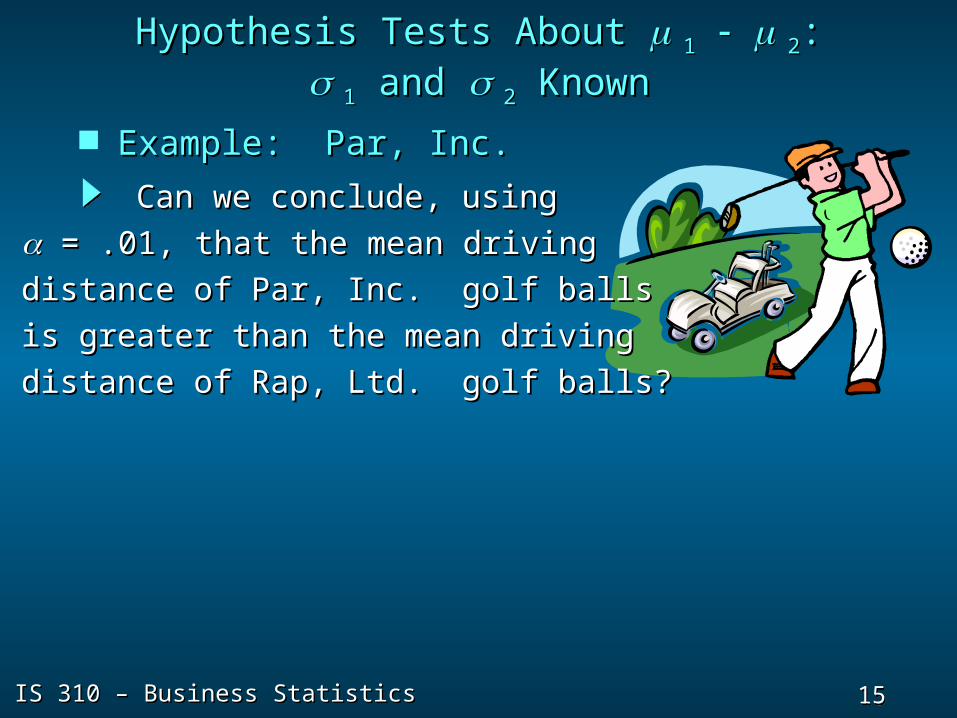
Example: Par, Inc.Example: Par, Inc.
Hypothesis Tests About Hypothesis Tests About 1 1 2 2:: 1 1 and and 2 2 Known Known
Can we conclude, usingCan we conclude, using
= .01, that the mean driving= .01, that the mean driving
distance of Par, Inc. golf ballsdistance of Par, Inc. golf balls
is greater than the mean drivingis greater than the mean driving
distance of Rap, Ltd. golf balls?distance of Rap, Ltd. golf balls?
16 16 Slide
Slide
IS 310 – Business StatisticsIS 310 – Business Statistics
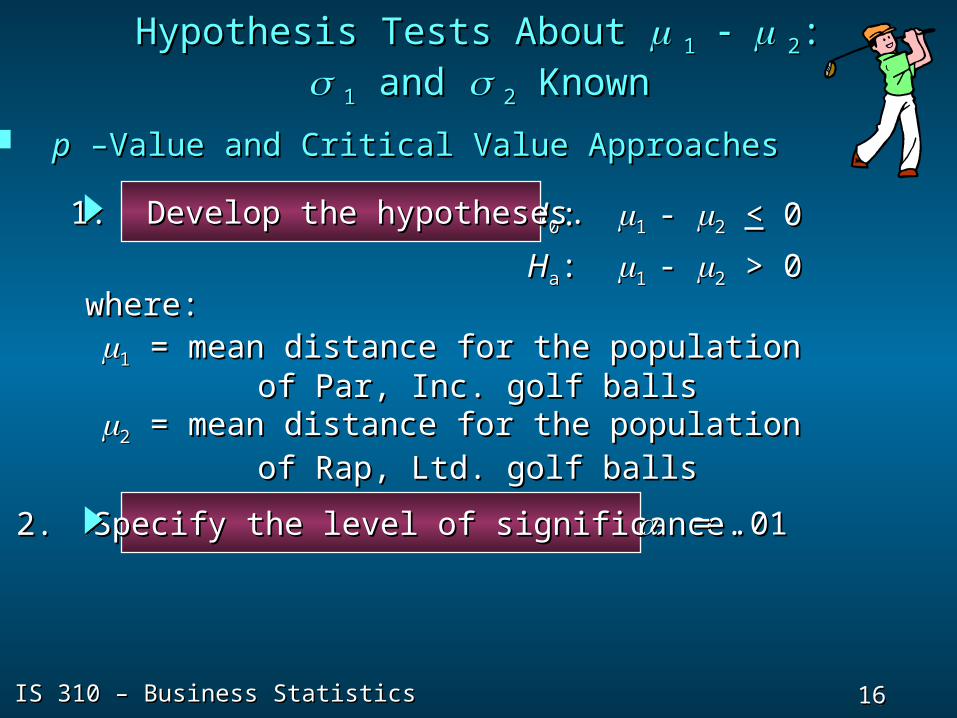
HH00: : 1 1 - - 22 << 0 0
HHaa: : 1 1 - - 22 > 0 > 0where: where: 11 = mean distance for the population = mean distance for the population of Par, Inc. golf ballsof Par, Inc. golf balls22 = mean distance for the population = mean distance for the population of Rap, Ltd. golf ballsof Rap, Ltd. golf balls
1. Develop the hypotheses.1. Develop the hypotheses.
pp –Value and Critical Value Approaches –Value and Critical Value Approaches
Hypothesis Tests About Hypothesis Tests About 1 1 2 2:: 1 1 and and 2 2 Known Known
2. Specify the level of significance.2. Specify the level of significance. = .01= .01

17 17 Slide
Slide
IS 310 – Business StatisticsIS 310 – Business Statistics
3. Compute the value of the test statistic.3. Compute the value of the test statistic.
Hypothesis Tests About Hypothesis Tests About 1 1 2 2:: 1 1 and and 2 2 Known Known
pp –Value and Critical Value Approaches –Value and Critical Value Approaches
1 2 0
2 21 2
1 2
( )x x Dz
n n
1 2 0
2 21 2
1 2
( )x x Dz
n n
2 2
(235 218) 0 17 6.49
2.62(15) (20)120 80
z
2 2
(235 218) 0 17 6.49
2.62(15) (20)120 80
z
18 18 Slide
Slide
IS 310 – Business StatisticsIS 310 – Business Statistics
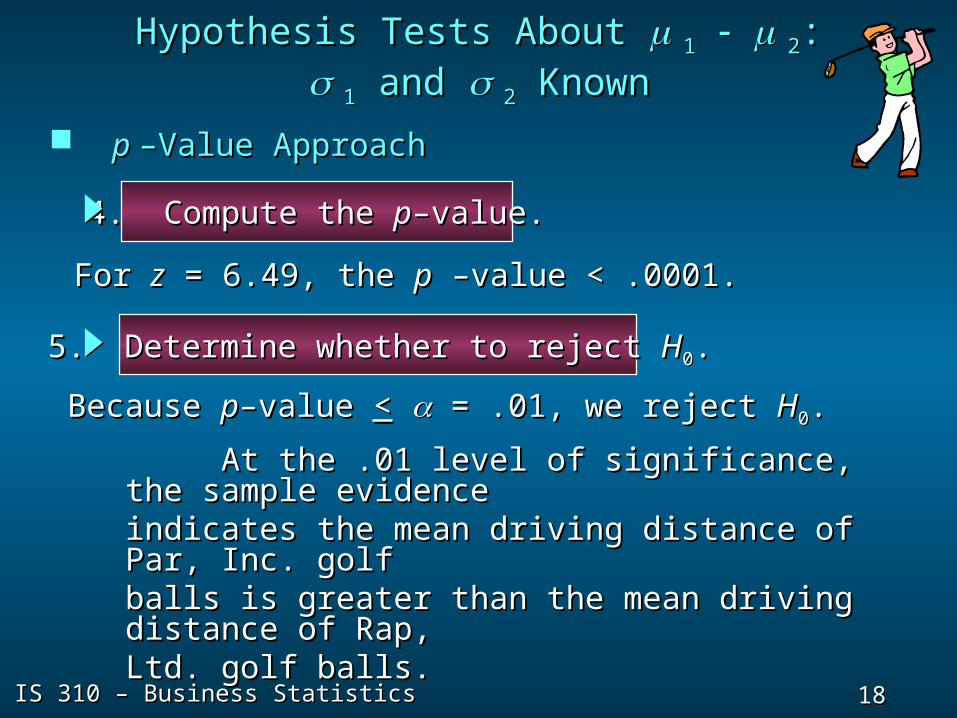
p p –Value Approach–Value Approach
4. Compute the 4. Compute the pp–value.–value.
For For zz = 6.49, the = 6.49, the pp –value < .0001. –value < .0001.
Hypothesis Tests About Hypothesis Tests About 1 1 2 2:: 1 1 and and 2 2 Known Known
5. Determine whether to reject 5. Determine whether to reject HH00..
Because Because pp–value –value << = .01, we reject = .01, we reject HH00..
At the .01 level of significance, the sample At the .01 level of significance, the sample evidenceevidenceindicates the mean driving distance of Par, Inc. indicates the mean driving distance of Par, Inc. golfgolfballs is greater than the mean driving distance balls is greater than the mean driving distance of Rap,of Rap,Ltd. golf balls.Ltd. golf balls.

19 19 Slide
Slide
IS 310 – Business StatisticsIS 310 – Business Statistics
Hypothesis Tests About Hypothesis Tests About 1 1 2 2:: 1 1 and and 2 2 Known Known
5. Determine whether to reject 5. Determine whether to reject HH00..
Because Because zz = 6.49 = 6.49 >> 2.33, we reject 2.33, we reject HH00..
Critical Value ApproachCritical Value Approach
For For = .01, = .01, zz.01.01 = 2.33 = 2.33
4. Determine the critical value and rejection rule.4. Determine the critical value and rejection rule.
Reject Reject HH00 if if zz >> 2.33 2.33
The sample evidence indicates the mean The sample evidence indicates the mean drivingdrivingdistance of Par, Inc. golf balls is greater than distance of Par, Inc. golf balls is greater than the meanthe meandriving distance of Rap, Ltd. golf balls.driving distance of Rap, Ltd. golf balls.

20 20 Slide
Slide
IS 310 – Business StatisticsIS 310 – Business Statistics
Sample ProblemSample Problem
Problem # 7 (10-Page 401; 11-Page 414)Problem # 7 (10-Page 401; 11-Page 414)
a. H : µ = µ H : µ > µa. H : µ = µ H : µ > µ
0 1 2 a 1 20 1 2 a 1 2
b.b. Point reduction in the mean duration of games during 2003 = 172 – 166Point reduction in the mean duration of games during 2003 = 172 – 166
= 6 = 6 minutesminutes
_ _ 2 2_ _ 2 2
c. Test-statistic, z = [( x - x ) – 0] /√ [ (c. Test-statistic, z = [( x - x ) – 0] /√ [ (σσ / n ) + ( / n ) + (σσ / n )] / n )]
1 2 1 1 2 21 2 1 1 2 2
=(172 – 166)/√[ (144/60 + 144/50)]=(172 – 166)/√[ (144/60 + 144/50)]
= 6/2.3 = 2.61= 6/2.3 = 2.61
Critical z at = 1.645 Reject HCritical z at = 1.645 Reject H
0.05 00.05 0
Statistical test supports that the mean duration of games in 2003 is less Statistical test supports that the mean duration of games in 2003 is less than that in 2002.than that in 2002.
p-value = 1 – 0.9955 = 0.0045p-value = 1 – 0.9955 = 0.0045

21 21 Slide
Slide
IS 310 – Business StatisticsIS 310 – Business Statistics
Inferences About the Difference BetweenInferences About the Difference BetweenTwo Population Means: Two Population Means: 1 1 and and 2 2
UnknownUnknown
Interval Estimation of Interval Estimation of 11 – – 22
Hypothesis Tests About Hypothesis Tests About 11 – – 22
22 22 Slide
Slide
IS 310 – Business StatisticsIS 310 – Business Statistics
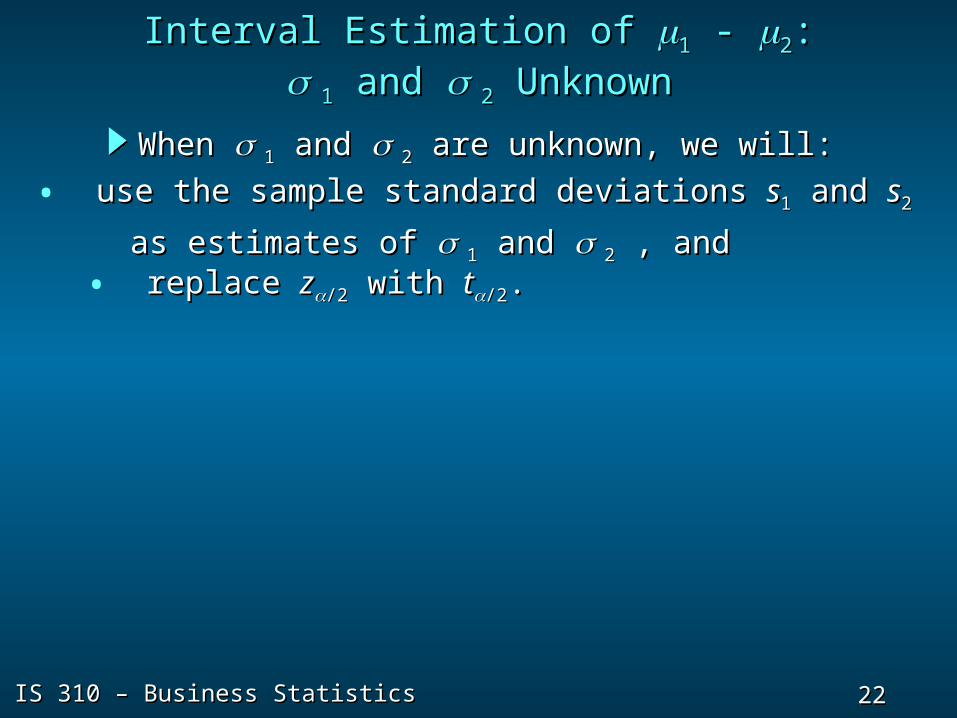
Interval Estimation of Interval Estimation of 11 - - 22:: 1 1 and and 2 2 Unknown Unknown
When When 1 1 and and 2 2 are unknown, we will: are unknown, we will:
• replace replace zz/2/2 with with tt/2/2. .
• use the sample standard deviations use the sample standard deviations ss11 and and ss22
as estimates of as estimates of 1 1 and and 2 2 , and , and

23 23 Slide
Slide
IS 310 – Business StatisticsIS 310 – Business Statistics
Interval Estimation of µ - µInterval Estimation of µ - µ 1 2 1 2
(Unknown and )(Unknown and ) 1 21 2
Interval estimateInterval estimate _ _ 2 2_ _ 2 2 (x - x ) ± t √ (s /n + s /n )(x - x ) ± t √ (s /n + s /n ) 1 2 1 2 /2 1 1 2 2/2 1 1 2 2
Degree of freedom = n + n - 2Degree of freedom = n + n - 2 1 21 2

24 24 Slide
Slide
IS 310 – Business StatisticsIS 310 – Business Statistics
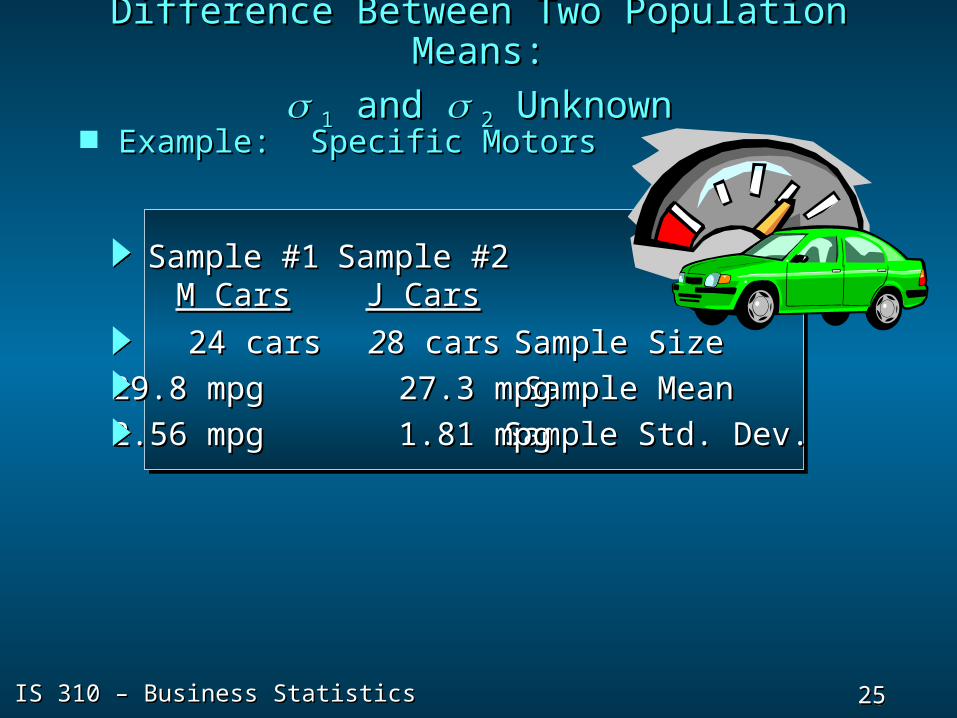
Example: Specific MotorsExample: Specific Motors
Difference Between Two Population Difference Between Two Population Means:Means:
11 and and 2 2 Unknown Unknown
Specific Motors of DetroitSpecific Motors of Detroit
has developed a new automobilehas developed a new automobile
known as the M car. 24 M carsknown as the M car. 24 M cars
and 28 J cars (from Japan) were roadand 28 J cars (from Japan) were road
tested to compare miles-per-gallon (mpg) performance. tested to compare miles-per-gallon (mpg) performance.
The sample statistics are shown on the next slide.The sample statistics are shown on the next slide.
25 25 Slide
Slide
IS 310 – Business StatisticsIS 310 – Business Statistics
Difference Between Two Population Difference Between Two Population Means:Means:
11 and and 2 2 Unknown Unknown Example: Specific MotorsExample: Specific Motors
Sample SizeSample Size
Sample MeanSample Mean
Sample Std. Dev.Sample Std. Dev.
Sample #1Sample #1M CarsM Cars
Sample #2Sample #2J CarsJ Cars
24 cars24 cars 2 28 cars8 cars
29.8 mpg 27.3 mpg29.8 mpg 27.3 mpg
2.56 mpg 1.81 mpg2.56 mpg 1.81 mpg
26 26 Slide
Slide
IS 310 – Business StatisticsIS 310 – Business Statistics
Difference Between Two Population Difference Between Two Population Means:Means:
11 and and 2 2 Unknown Unknown
Let us develop a 90% confidenceLet us develop a 90% confidence
interval estimate of the differenceinterval estimate of the difference
between the mpg performances ofbetween the mpg performances of
the two models of automobile.the two models of automobile.
Example: Specific MotorsExample: Specific Motors
27 27 Slide
Slide
IS 310 – Business StatisticsIS 310 – Business Statistics
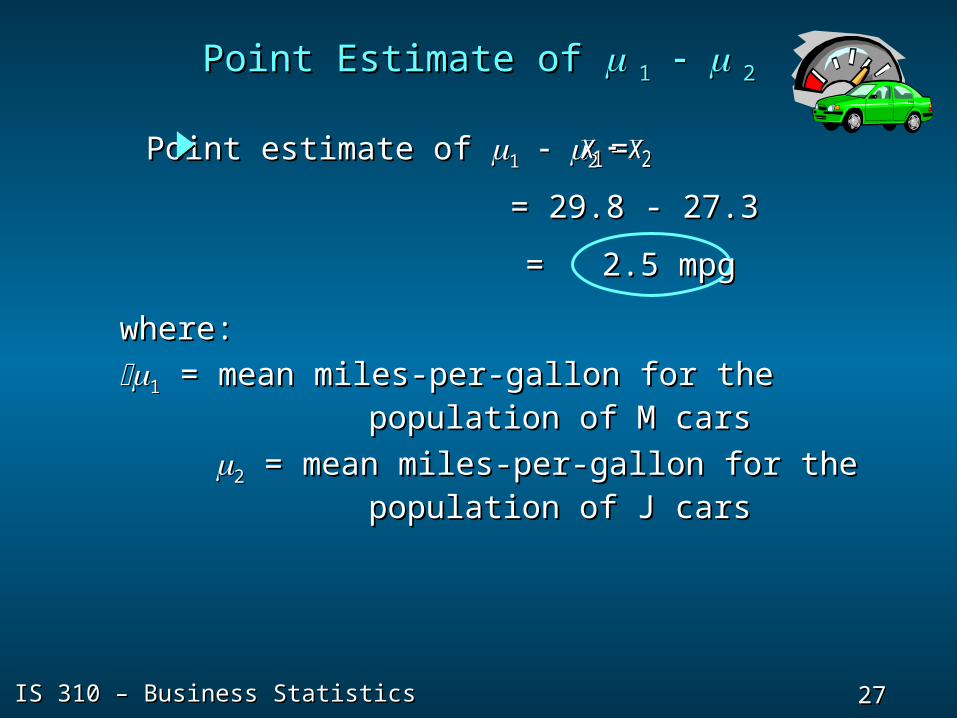
Point estimate of Point estimate of 11 2 2 ==x x1 2x x1 2
Point Estimate of Point Estimate of 1 1 2 2
where:where:
11 = mean miles-per-gallon for the = mean miles-per-gallon for the population of M carspopulation of M cars
22 = mean miles-per-gallon for the = mean miles-per-gallon for the population of J carspopulation of J cars
= 29.8 - 27.3= 29.8 - 27.3
= 2.5 mpg= 2.5 mpg

28 28 Slide
Slide
IS 310 – Business StatisticsIS 310 – Business Statistics
Interval Estimate of µ - µInterval Estimate of µ - µ 1 2 1 2
Interval estimateInterval estimate 2 22 2 29.8 – 27.3 ± t √ (2.56) /24 + (1.81) /28)29.8 – 27.3 ± t √ (2.56) /24 + (1.81) /28) 0.1/2 0.1/2 2.5 ± 1.676 (0.62)2.5 ± 1.676 (0.62) 2.5 ± 1.042.5 ± 1.04 1.46 and 3.541.46 and 3.54 We are 90% confident that the difference We are 90% confident that the difference
between the average miles per gallon between between the average miles per gallon between the J cars and M cars is between 1.46 and 3.54.the J cars and M cars is between 1.46 and 3.54.
29 29 Slide
Slide
IS 310 – Business StatisticsIS 310 – Business Statistics
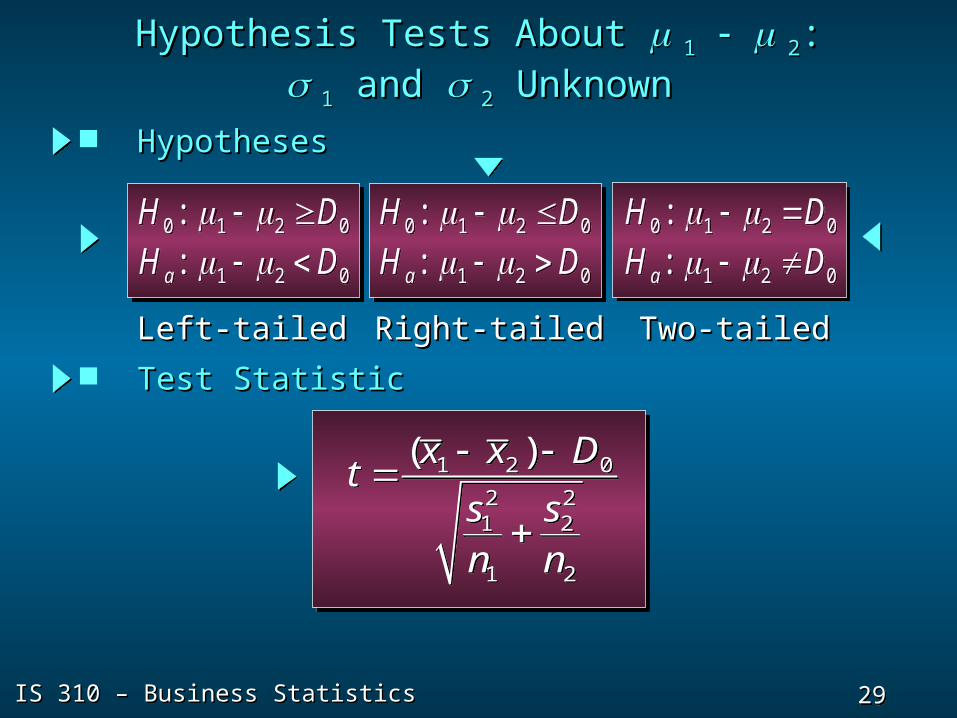
Hypothesis Tests About Hypothesis Tests About 1 1 2 2:: 1 1 and and 2 2 Unknown Unknown
HypothesesHypotheses
1 2 0
2 21 2
1 2
( )x x Dt
s sn n
1 2 0
2 21 2
1 2
( )x x Dt
s sn n
1 2 0: aH D 1 2 0: aH D 0 1 2 0: H D 0 1 2 0: H D 0 1 2 0: H D 0 1 2 0: H D
1 2 0: aH D 1 2 0: aH D 0 1 2 0: H D 0 1 2 0: H D 1 2 0: aH D 1 2 0: aH D
Left-tailedLeft-tailed Right-tailedRight-tailed Two-tailedTwo-tailed Test StatisticTest Statistic

30 30 Slide
Slide
IS 310 – Business StatisticsIS 310 – Business Statistics
Example: Specific MotorsExample: Specific Motors
Hypothesis Tests About Hypothesis Tests About 1 1 2 2:: 1 1 and and 2 2 Unknown Unknown
Can we conclude, using aCan we conclude, using a
.05 level of significance, that the.05 level of significance, that the
miles-per-gallon (miles-per-gallon (mpgmpg) performance) performance
of M cars is greater than the miles-per-of M cars is greater than the miles-per-
gallon performance of J cars?gallon performance of J cars?

31 31 Slide
Slide
IS 310 – Business StatisticsIS 310 – Business Statistics
2. Specify the level of significance.2. Specify the level of significance.
3. Compute the value of the test statistic.3. Compute the value of the test statistic.
= .05= .05
pp –Value and Critical Value Approaches –Value and Critical Value Approaches
Hypothesis Tests About Hypothesis Tests About 1 1 2 2:: 1 1 and and 2 2 Unknown Unknown
1 2 0
2 2 2 21 2
1 2
( ) (29.8 27.3) 0 4.003
(2.56) (1.81)24 28
x x Dt
s sn n
1 2 0
2 2 2 21 2
1 2
( ) (29.8 27.3) 0 4.003
(2.56) (1.81)24 28
x x Dt
s sn n
32 32 Slide
Slide
IS 310 – Business StatisticsIS 310 – Business Statistics
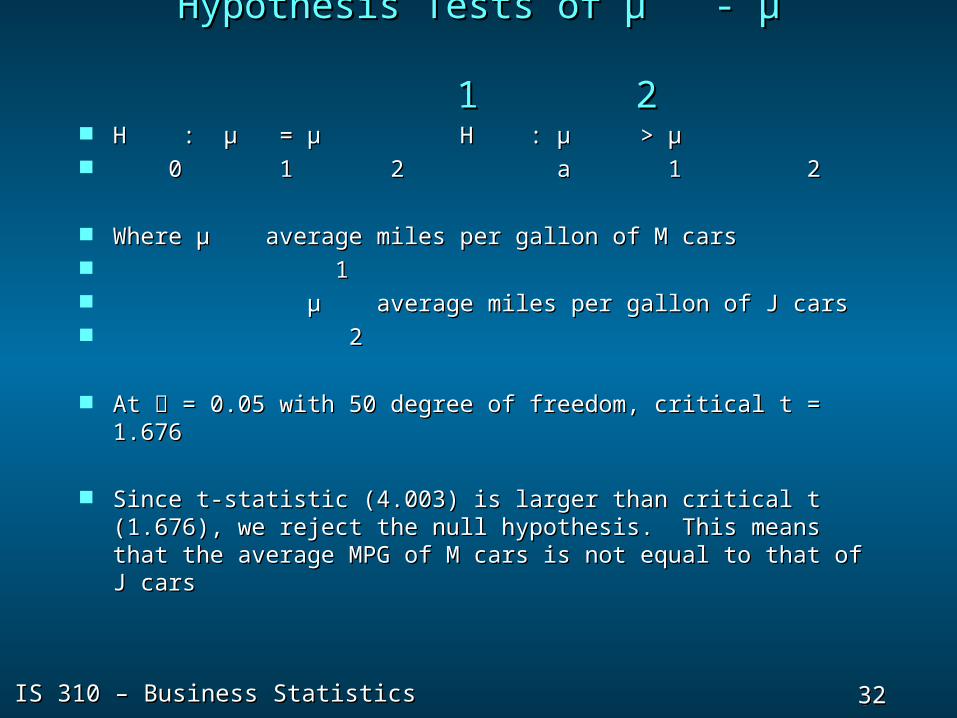
Hypothesis Tests of µ - µHypothesis Tests of µ - µ 1 2 1 2
H : µ = µ H : µ > µH : µ = µ H : µ > µ 0 1 2 a 1 20 1 2 a 1 2
Where µ average miles per gallon of M carsWhere µ average miles per gallon of M cars 11 µ average miles per gallon of J carsµ average miles per gallon of J cars 22
At = 0.05 with 50 degree of freedom, critical t = 1.676At = 0.05 with 50 degree of freedom, critical t = 1.676
Since t-statistic (4.003) is larger than critical t (1.676), Since t-statistic (4.003) is larger than critical t (1.676), we reject the null hypothesis. This means that the we reject the null hypothesis. This means that the average MPG of M cars is not equal to that of J carsaverage MPG of M cars is not equal to that of J cars

33 33 Slide
Slide
IS 310 – Business StatisticsIS 310 – Business Statistics
End of Chapter 10End of Chapter 10Part APart A