Chapter 1 Why Statistics? distribute - SAGE Publications Incof your cell phone based on this report?...
24
3 Chapter 1 Why Statistics? As you read the chapter, consider the following questions: 1.1 Why do we use statistics to analyze data? 1.2 How do descriptive and inferential statistics differ? 1.3 Why are there so many different kinds of statistical tests? 1.4 What are the methods we use to collect data? 1.5 How do the methods used to collect data affect the statistics we use? WHAT CAN STATISTICS DO FOR ME? Imagine that you have just purchased a new bookshelf from IKEA or Target. You get the box home, open it up, and find 38 pieces with instructions on how to assemble the bookshelf, including pieces of wood, screws, nails, nuts, and bolts. The instructions also say that you will need some tools to help you assemble your bookshelf: a hammer, a flat head screwdriver, a Phillips head screwdriver, and an Allen wrench. Sound familiar? Most of us have been faced with this type of situation before, and if you have not, you probably know someone who has assem- bled furniture they have bought. Is this usually an easy task? Sometimes it is, if all the pieces are in the box, you have all of the right tools and know how to use them, and have a good set of instructions to follow. However, there are times when you are asked to use a tool you do not have or know how to use or are given instructions that are difficult to follow. Statistics as a Tool The situation described here (and shown in Photo 1.1) is very similar to the process of using statistics to understand data from a research study. The pieces you are given in the box are similar to the data you have collected. You collected the appropriate data to help you answer a Copyright ©2018 by SAGE Publications, Inc. This work may not be reproduced or distributed in any form or by any means without express written permission of the publisher. Do not copy, post, or distribute
Transcript of Chapter 1 Why Statistics? distribute - SAGE Publications Incof your cell phone based on this report?...

3
Chapter 1Why Statistics?
As you read the chapter, consider the following questions:
1.1 Why do we use statistics to analyze data?
1.2 How do descriptive and inferential statistics differ?
1.3 Why are there so many different kinds of statistical tests?
1.4 What are the methods we use to collect data?
1.5 How do the methods used to collect data affect the statistics we use?
WHAT CAN STATISTICS DO FOR ME?
Imagine that you have just purchased a new bookshelf from IKEA or Target. You get the box home, open it up, and find 38 pieces with instructions on how to assemble the bookshelf, including pieces of wood, screws, nails, nuts, and bolts. The instructions also say that you will need some tools to help you assemble your bookshelf: a hammer, a flat head screwdriver, a Phillips head screwdriver, and an Allen wrench. Sound familiar? Most of us have been faced with this type of situation before, and if you have not, you probably know someone who has assembled furniture they have bought. Is this usually an easy task? Sometimes it is, if all the pieces are in the box, you have all of the right tools and know how to use them, and have a good set of instructions to follow. However, there are times when you are asked to use a tool you do not have or know how to use or are given instructions that are difficult to follow.
Statistics as a ToolThe situation described here (and shown in Photo 1.1) is very similar to the process of using statistics to understand data from a research study. The pieces you are given in the box are similar to the data you have collected. You collected the appropriate data to help you answer a
Copyright ©2018 by SAGE Publications, Inc. This work may not be reproduced or distributed in any form or by any means without express written permission of the publisher.
Do not
copy
, pos
t, or d
istrib
ute

Part I Why Do We Use statIstIcs?4
research question (“How often do college students feel anxious?” or “What is the effect of anxiety on test performance?”). The tools (hammer, screwdrivers) are the statistics you can use to organize and analyze the data you collected. This is like assembling the pieces of the bookshelf using the tools: You can use different types of statistics to assemble the data into something you can more easily understand and interpret. Finally, you have instructions. This text and the instruction you are receiving in the course you are taking are the instructions for how to assemble your data into something that is easier to interpret. That is what this text is all about—providing instructions on how to use statistics as tools to better understand and interpret the data you have. But the starting place is always the collection of data. Thus, in this chapter and throughout the text, we will also discuss some of the issues relevant to data collection, such as measurement and research design types, to help you see the connection between the collection of data and the statistics we choose as tools for understanding those data.
The process of using statistics can be frustrating at times for a beginner, but statistics are essential for understanding your data. Knowing something about statistics can help you better understand arguments made with statistics or how data can be used to solve problems in society or an organization. Imagine that you had a set of data (e.g., a set of numbers from customers representing satisfaction with the products made by the company you work for) but no tools for assembling those data into something you can interpret. How would you answer your research question about how satisfied your customers are? This would be like trying to assemble the pieces of your bookshelf without your hammer and screwdrivers—a task that
Photo 1.1 Using statistics is similar to using a screwdriver as a tool to assemble furniture. Statistics provide tools to help you assemble data into something you can more easily interpret.
©iStock/monkeybusinessimages
Copyright ©2018 by SAGE Publications, Inc. This work may not be reproduced or distributed in any form or by any means without express written permission of the publisher.
Do not
copy
, pos
t, or d
istrib
ute

chaPter 1 Why Statistics? 5
would be extremely difficult or impossible. The statistics you will read about in this text provide the tools you need to better understand your data. Statistics can help you summarize the scores (e.g., “On average, how satisfied are your customers?”), examine how different the scores are from participant to participant (e.g., “What is the range of scores in the data set?”), display the average scores in organized graphs and tables, and test predictions you have about average scores in different groups of participants or from the same participants at different times. You can even use statistics to examine relationships between different sets of data (e.g., “Are customers with more information about your company more satisfied with your company’s products?”). In this text, we will consider statistical tools for accomplishing each of these different tasks.
Statistics in the MediaStatistics are everywhere. Think about how often you encounter statistics in your daily life. You will see that statistics are all around you. Because they are useful tools for organizing and understanding data, you will see that statistics are used quite often in many different sources of information you encounter in your daily life. When you applied to your college or university, you probably encountered some basic statistics about the students at that institution. At Illinois State University (see Photo 1.2) where I teach, for example, a quick glance at the admissions web page states that 55% of the students are women, the average ACT score for incoming freshmen in Fall 2012 was 24.0, and 68% of classes have 29 or fewer students in them. Why does the admissions page include these statistics? To provide information about the students who attend the
Photo 1.2 Many colleges and universities provide statistics about their students to help prospective students decide if they want to apply for admission.
Copyright ©2018 by SAGE Publications, Inc. This work may not be reproduced or distributed in any form or by any means without express written permission of the publisher.
Do not
copy
, pos
t, or d
istrib
ute

Part I Why Do We Use statIstIcs?6
university and what the university is like to prospective students who might want to apply. This information can help a student decide if Illinois State University is a place to which they might be offered admission and if it is a place they would like to be for college.
Where else might you encounter statistics? Most media sources will use statistics to present information about something they are reporting on or to try to argue a particular point of view. For example, a recent article in the New York Times online stated that from 2003 to 2013, heart attack rates have dropped by 38% (Kolata, 2015). Let’s consider what this means. Does this mean that you, as an individual, now have a 38% lower chance of having a heart attack than you did in 2003? No, that is not the right conclusion to make from this statistic. The main reason this is incorrect is that this statistic is based on the rates of heart attacks across a large number of individuals and individual differences can influence these values. This is one of the reasons that research studies typically involve the measurement of behaviors of a large group of individuals instead of one person to answer the research question. We will discuss this issue further later in the chapter.
Let’s consider another set of statistics also presented by the New York Times: An article presented information about a study that looked at the relationship between teen smoking rates and the legal age of cigarette sales in a city in Massachusetts (Bakalar, 2015). The city raised the age limit to 21 for cigarette sales. Other nearby cities did not change their age limit, which remained at 18 years of age (see Figure 1.1 for an illustration of this study). The researchers compared selfreported smoking behaviors for individuals under the age of 18 in the city with the 21year age limit and individuals in a nearby city with an 18year age limit. They found that cigarette purchases by individuals under 18 years of age dropped by 6.8% in the city with the
Figure 1.1 Description of a Study Comparing Self-Reported Cigarette Purchases by People Under Age 18 in Cities With Different Age Limits for Cigarette Purchases
City that raisedsmoking age to 21
Compare statistics0.4% drop in cigarettepurchases reported
6.8% drop in cigarettepurchases reported
Collect dataabout cigarette purchases
from people underage 18
Collect dataabout cigarette purchases
from people underage 18
Nearby city withsmoking age of 18
Copyright ©2018 by SAGE Publications, Inc. This work may not be reproduced or distributed in any form or by any means without express written permission of the publisher.
Do not
copy
, pos
t, or d
istrib
ute
chaPter 1 Why Statistics? 7
21year age limit. In the cities with a lower age limit (18year), cigarette purchases by individuals under 18 years old only dropped by 0.4%. Consider what these statistics could mean for proposing a nationwide increase in the age to legally buy cigarettes.
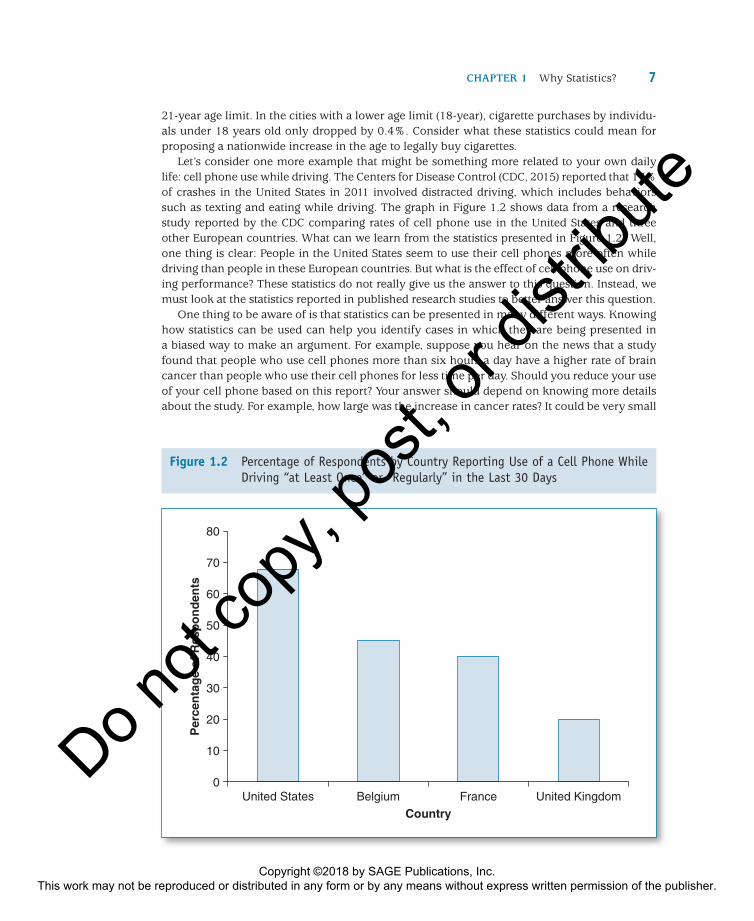
Let’s consider one more example that might be something more related to your own daily life: cell phone use while driving. The Centers for Disease Control (CDC, 2015) reported that 17% of crashes in the United States in 2011 involved distracted driving, which includes behaviors such as texting and eating while driving. The graph in Figure 1.2 shows data from a research study reported by the CDC comparing rates of cell phone use in the United States and three other European countries. What can we learn from the statistics presented in Figure 1.2? Well, one thing is clear: People in the United States seem to use their cell phones more often while driving than people in these European countries. But what is the effect of cell phone use on driving performance? These statistics do not really give us the answer to this question. Instead, we must look at the statistics reported in published research studies to better answer this question.
One thing to be aware of is that statistics can be presented in many different ways. Knowing how statistics can be used can help you identify cases in which they are being presented in a biased way to make an argument. For example, suppose you hear on the news that a study found that people who use cell phones more than six hours a day have a higher rate of brain cancer than people who use their cell phones for less time per day. Should you reduce your use of your cell phone based on this report? Your answer should depend on knowing more details about the study. For example, how large was the increase in cancer rates? It could be very small
United States0
10
20
30
40
50
60
70
80
Belgium FranceCountry
Per
cen
tag
e o
f R
esp
on
den
ts
United Kingdom
Figure 1.2 Percentage of Respondents by Country Reporting Use of a Cell Phone While Driving “at Least Once” or “Regularly” in the Last 30 Days
Copyright ©2018 by SAGE Publications, Inc. This work may not be reproduced or distributed in any form or by any means without express written permission of the publisher.
Do not
copy
, pos
t, or d
istrib
ute

Part I Why Do We Use statIstIcs?8
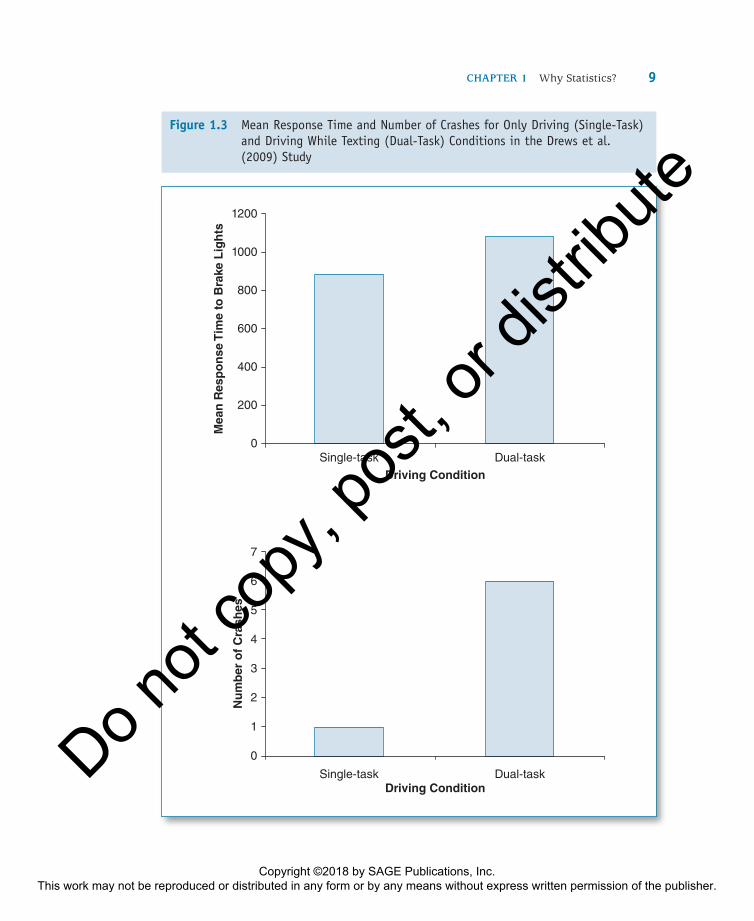
Statistics in ResearchThe statistics reported in the media come from research studies conducted to better understand behavior and what affects it. Consider a research study that looks at the question of how cell phone use affects driving performance. Drews, Hazdani, Godfrey, Cooper, and Strayer (2009) conducted a study to compare driving performance while participants focused all their attention on driving and while driving and texting. Participants in the study completed a driving task in a simulator under both singletask (only driving) and dualtask (driving and texting) conditions. They then compared how quickly the participants responded when presented with brake lights from a car in front of them and the number of crashes they had in the singletask and dualtask conditions. They found that the participants responded more slowly to brake lights and had more crashes when they were driving while texting. Figure 1.3 shows the descriptive statistics the researchers reported from this study (in the form of average scores
for response time and total number of crashes). Descriptive statistics are the type of statistics that help us summarize (or describe) the data.
Let’s consider what we can learn from the statistics shown in Figure 1.3. The top graph shows us the mean or average response time for the participants to step on the brake in the driving simulator when they
(e.g., less than 1%) or rather large (e.g., 36%). You should also consider how the study was conducted—were there other differences across these groups of people that could cause a difference in cancer rates besides the amount of time they use their cell phones (e.g., anxiety levels)? Finally, even if the difference in cancer rates seems large, is this difference between
groups statistically significant (i.e., considering the data from the individuals measured in the study, is the difference between groups large enough to generalize to all people who use cell phones)? Your knowledge of statistics can help you identify what you need to know about the statistics others report so that you can use the information to consider your own behavior.
Statistically significant: a statistical outcome indicating that the data from the individuals measured show that an effect or relationship exists
Descriptive statistics: statistics that help researchers summarize or describe data
Mean: the average score for a set of data
1.1 Consider some statistics you have encountered recently in your daily life. In what way(s) have these statistics influenced your thinking about an issue?
1.2 Review the statistics presented from the New York Times on the decrease of heart attack rates. What additional information do you think you would need to apply this rate reduction statistic to an individual’s current heart attack probability?
1.3 Review the description of the study about teen smoking rates. Based on the statistics presented, would you recommend a national increase in the age to buy cigarettes to 21 years? Why or why not?
Stop and Think
Copyright ©2018 by SAGE Publications, Inc. This work may not be reproduced or distributed in any form or by any means without express written permission of the publisher.
Do not
copy
, pos
t, or d
istrib
ute
chaPter 1 Why Statistics? 9
Figure 1.3 Mean Response Time and Number of Crashes for Only Driving (Single-Task) and Driving While Texting (Dual-Task) Conditions in the Drews et al. (2009) Study
1200
1000
800
600
Mea
n R
esp
on
se T
ime
to B
rake
Lig
hts
400
200
Single-task Dual-task
Dual-task
Driving Condition
Driving Condition
0
7
6
5
4
Nu
mb
er o
f C
rash
es
3
2
1
0
Single-task
1200
1000
800
600
Mea
n R
esp
on
se T
ime
to B
rake
Lig
hts
400
200
Single-task Dual-task
Dual-task
Driving Condition
Driving Condition
0
7
6
5
4
Nu
mb
er o
f C
rash
es
3
2
1
0
Single-task
Copyright ©2018 by SAGE Publications, Inc. This work may not be reproduced or distributed in any form or by any means without express written permission of the publisher.
Do not
copy
, pos
t, or d
istrib
ute

Part I Why Do We Use statIstIcs?10
saw brake lights on the car in front of them. To find these values, the researchers took all the response times for braking responses when the brake lights appeared (this happened 42 times per participant) and calculated an average response time for each participant. Then, they averaged all the participants’ average response times to get the mean for each situation or condition tested in the study (i.e., only driving and driving while texting). The mean response times for each participant were averaged to calculate the condition means shown in the graph. Thus, the mean is an average score from a set of data. You can see in the graph that the participants were about 200 milliseconds (0.2 seconds) slower to brake when they were texting than when they were driving without texting.
The bottom graph shows the number of crashes in each condition. This is a descriptive statistic known as the frequency. The frequency is simply how often something occurred in a set of data. The graph in Figure 1.3 shows how frequent crashes were in the two conditions. This graph shows more crashes in the
dualtask than in the singletask condition, indicating that more crashes occurred when people drove while texting. These descriptive statistics (the mean and frequency) help us better understand what the data can tell us from the Drews et al. (2009) study. However, these statistics do not tell us if the dualtask condition is significantly worse in terms of response time for braking or the number of crashes than the singletask condition. Why not? Well, imagine we redid the study with another set of participants and got different descriptive statistics that were similar for the two conditions. How would we know which set of statistics to believe? And in fact, we could
do this study over and over with different participants and get slightly different mean values each time. In other words, there will be variability in the scores not only from person to person but also from study to study. This is where inferential statistics and hypothesis testing come in. Inferential statistics are the type of statistics that help researchers test their hypotheses. They will help answer the question for drivers overall:
Does driving while texting really result in worse driving performance? In fact, the researchers in this study conducted two different inferential statistics tests for the mean response time and number of crashes data and concluded from these tests that the driving while texting condition was significantly worse than the just driving condition for both measures.
RESEARCH DESIGN AND STATISTICS
The Purpose of Research in PsychologyIt should be clear by now that statistics are used to help us understand data. But where do the data come from? And how does the type of data we collect affect the statistics we use to under
stand them? The rest of this chapter will focus on answering these questions. As I discuss the different types of research designs, I will define some of the variables that are important to these designs. The variables are the attributes that can differ across
Frequency: how often a response or score occurs within a data set
Variables: attributes that can vary across individuals
Variability: the spread of scores in a distribution
Inferential statistics: statistics that help researchers test hypotheses
Copyright ©2018 by SAGE Publications, Inc. This work may not be reproduced or distributed in any form or by any means without express written permission of the publisher.
Do not
copy
, pos
t, or d
istrib
ute

chaPter 1 Why Statistics? 11
individuals, which can be measured from individuals but can also be controlled by the researcher.
New knowledge in scientific fields of study (such as psychology) relies on research studies. This is the primary means of learning new things about the world in a scientific way: Go out and observe them. For example, if we want to know whether punishment will change behavior less effectively than a reward, the best way to answer this question is to observe and compare individuals’ behavior after they have been rewarded for a behavior and after they have been punished for failure to perform the behavior. This comparison will show us whether behavior is affected in a different way for reward versus punishment. This kind of study will give us the clearest answer to our question. In another case, we might want to know how anxiety in college students relates to their scores on their final exams (see Photo 1.3). To answer this question, we might ask students to answer some items on a questionnaire about anxiety just before finals to measure their level of anxiety. We might then also measure their scores on their final exams (or obtain the scores from their records with their permission) to determine if the two measures are related (i.e., change together across the group of students in our study).
In both of these cases, we are observing the behaviors to learn about them. In the first example, we are directly observing a behavior in two situations (rewards and punishments), and in the second example, we are observing selfreported thoughts and behaviors on a questionnaire and scores on exams. When we make observations, we produce data that we need to understand. But how we make those observations is just as important as how we analyze the data. In addition, the way we make the observations will affect how we use statistics to understand them. Therefore, it’s important to know something about research methods before
Photo 1.3 Research question: How anxious are college students before final exams?
©iStock/Wavebreakmedia
Copyright ©2018 by SAGE Publications, Inc. This work may not be reproduced or distributed in any form or by any means without express written permission of the publisher.
Do not
copy
, pos
t, or d
istrib
ute

Part I Why Do We Use statIstIcs?12
we can understand how we use statistics to understand the data that come from these methods. To get a better sense of where statistics fits into the process of research, take a look at Figure 1.4. It shows the steps in conducting research and where statistics fit into this process (Step 6: Analyzing the Data). In the next section of this chapter, I will briefly describe a couple of common methods that are used to observe behavior to help you see how this process works. The choice of method is based on the type of question a researcher wants to answer.
Different Research DesignsThe two examples I already described (comparing behavior after rewards and punishments and relating anxiety measured from responses on a questionnaire to final exam scores) each represent two of the most common methods of observing behavior: an experiment and a correlational study. Experiments will help us determine if something causes a behavior, but correlational studies can only help us determine if there is some kind of relationship (which might not be a causal relationship) between two measures. When we compare behavior in two situations or conditions (parts of an indepen-dent variable), we are typically using an experimental design, either a true experiment if individuals in our study are randomly assigned to the situations we want to compare or a quasi-experiment if the individuals are in those situations already in some way. In our rewards and punishments example, the feedback is the independent variable (which is the causal factor we are interested in) and the
conditions that are compared with this independent variable are the rewards and punishments. In the next section, I will discuss these concepts further and describe some additional examples of experiments.
Experiments
The goal of an experiment is to examine how a situation of interest (e.g., the outcome of a behavior; a
Step 1: Choosing a research question
Step 2: Conducting a literature review
Step 3: Developing a hypothesis
Step 4: Designing the study
Step 5: Conducting the study
Step 6: Analyzing the data
Step 7: Reporting the results
Figure 1.4 Steps in the Research Process
Experiment: a type of research design that involves the comparison of behavior observed in different situations
Correlational study: a type of research design that examines the relationships between different measures of behavior
Copyright ©2018 by SAGE Publications, Inc. This work may not be reproduced or distributed in any form or by any means without express written permission of the publisher.
Do not
copy
, pos
t, or d
istrib
ute

chaPter 1 Why Statistics? 13
reward or punishment) changes a behavior. The situation of interest is called the independent variable. Researchers use experiments when they want to gain information about the causes of behavior. Let’s consider an example of an experiment: What are the effects on your behavior of the stories you were read as a child? Lee, Talwar, McCarthy, Ross, Evans, and Arruda (2014) examined this question in an experiment that looked at the effects of stories on lying in children. They played a toy identification game with children 3 to 7 years old. A sound was played from the toy that was located behind them, and they were asked to try to identify the toy without looking at it. Before the last toy was identified, the researcher left the room to retrieve the story. Children were videotaped to determine if they peeked at the toy or not. The researcher then returned and read a randomly assigned story to the child (see Figure 1.5 for the stories read). After reading the story, which had a lying theme with a positive outcome (classic George Washington story), no lying theme (the tortoise and the hare), or a lying theme with a negative outcome (the rest of the stories in Figure 1.5), the children were asked if they had peeked at the toy while the researcher was out of the room. From the video observations, it was determined if the children told the truth or not. Figure 1.5 presents the percentage of children who heard each story who told the truth about peeking at the toy. The asterisk shows where there was a statistically significant difference between stories: Only the positiveoutcome story increased the percentage of children who told the truth over the other types of stories. Thus, stories with a lying theme and a positive outcome have a positive effect on honest behavior in children, but stories with a lying theme and a negative outcome do not seem to change honest behavior as compared with a story that was not about lying.
The conditions being compared in the Lee et al. (2014) experiment were the different stories—the story the children heard was the independent variable. The experiment was designed specifically to determine if the story they heard caused a difference in the children’s honesty. Thus, honesty was the behavior they were interested in measuring. This is known as the dependent variable. Every research study has at least one dependent variable because there is at least one behavior that is being measured in every study. This is true regardless of the type of research design being used. However, independent variables are specific to experiments and quasiexperiments.
Here is another example that further illustrates the difference between true experiments and quasiexperiments: You’re trying to decide whether you should bring your laptop to class to take notes on or if you should just leave it home (it’s heavy, after all) and take notes in a notebook by hand (see Photo 1.4). An experiment can help you decide if the laptop is worth lugging to class. Researchers Mueller and Oppenheimer (2014) conducted an experiment to figure out if taking notes on a laptop is better or worse for learning of lecture material than taking notes with pen and paper. They had college students come to the lab and take notes with either a laptop or with pen and paper, whichever way they normally took notes in their classes. They took notes on a TED Talk video presented to them. Later, they answered questions about
Independent variable: a variable in an experiment that changes across or within subjects to allow comparison of behavior in those different situations
Quasi-experiment: a type of research design that involves the comparison of behavior observed in different situations, but where subjects are not randomly assigned to the different situations
Dependent variable: the behavior of interest that is observed in a research study
Copyright ©2018 by SAGE Publications, Inc. This work may not be reproduced or distributed in any form or by any means without express written permission of the publisher.
Do not
copy
, pos
t, or d
istrib
ute

Part I Why Do We Use statIstIcs?14
the material presented in the TED Talk and their responses were scored for accuracy. Across three different studies, students performed better overall on the questions after taking notes by hand than after taking notes on a laptop. Thus, these results suggest that it may not be worth it to carry your laptop to class. However, because the students were allowed to choose the method they typically used to take notes, Mueller and Oppenheimer’s studies do not qualify as true experiments. Instead, they are quasiexperiments because there may be something that changed across subjects other than notetaking method that could explain the results. Perhaps, for example, students who learn more easily already use the byhand method for taking notes and thus this group contained better learners because the students were not randomly assigned to the two notetaking methods. A true experiment with the notetaking method randomly assigned to the students would help rule out other explanations of the results.
As we discuss statistics in more detail in the coming chapters, you will see that experiments and quasiexperiments typically employ the same types of statistics to analyze data. This is because both of these designs focus on comparing behavior across conditions. One the main differences between them is that the conditions being compared can occur within subjects in experiments, but not in quasiexperiments (where they can only occur between
100
90
80
70
60
Pee
kers
Wh
o T
old
th
e Tr
uth
(%
)
50
40
30
20
10
0Tortoiseand the
Hare
Classic George
Washington
Boy WhoCried Wolf
Story
Pinocchio NegativeGeorge
Washington
*
Figure 1.5 Results From the Lee et al. (2014) Study Showing the Effects of Different Stories on the Percentage of Children Who Peeked and Then Told the Truth
SOURCE: Lee, Talwar, McCarthy, Ross, Evans, & Arruda (2014). Can classic moral stories promote honesty in children? Psychological Science, 25, 1630–1636.
Copyright ©2018 by SAGE Publications, Inc. This work may not be reproduced or distributed in any form or by any means without express written permission of the publisher.
Do not
copy
, pos
t, or d
istrib
ute

chaPter 1 Why Statistics? 15
Photo 1.4 The research question asked by Mueller and Oppenheimer (2014) in their study was this: Which is better for learning in a lecture, taking notes by hand or typing them using a laptop?
©iStock/diego_cervo, ©iStock/michal-rojek
Copyright ©2018 by SAGE Publications, Inc. This work may not be reproduced or distributed in any form or by any means without express written permission of the publisher.
Do not
copy
, pos
t, or d
istrib
ute

Part I Why Do We Use statIstIcs?16
subjects). The difference is that in a between-subjects variable, different groups of people experience the different conditions being compared. This was the case for both the children’s stories and notetaking studies presented above. However, in an experiment, a researcher may choose to compare situations as a within-subjects variable. This allows one to compare behavior in different conditions for the same person. This type of variable can be useful when the behavior of interest varies a lot across subjects. Using a withinsubjects variable can help rule out differences in behavior seen in the study that could occur between
subjects. The choice between independent variables that are manipulated between subjects and within subjects will affect the kinds of statistics tests that are used to understand the data, as you will see in later chapters of this text.
Between-subjects variable: changing situations across different groups of subjects in a research study
Within-subjects variable: changing situations within a single group of subjects in a research study such that each subject experiences of all the different situations being compared
1.4 For each of the following studies, identify the independent and dependent variables:
a. You want to know if having a cell phone out while you study is a distraction, so you conduct a short study to figure this out. You observe your friends while they study for their coursework. You record whether each one has a cell phone out while they study and place them in either the “cell phone” group or “no cell phone” group, based on what you observe. Then you record how many minutes out of an hour of studying they appear to be on task. You compare the two groups of people to see if they differ in time on task.
b. Your statistics instructor has recruited students to be in a study in his lab. You sign up for the study, and when you participate, this is what you are asked to do: You are asked to complete two blocks of trials where you have to decide if a string of letters that appears on the screen is a real word or not as quickly as you can. During one block of trials, you focus entirely on this task. In the other block of tri-als, you are asked to also hold a short list of words in memory until the end of the block, when you have to recall them. You are told that the purpose of the study is to examine the effect of the memory task on your ability to decide if the strings of letters are words.
1.5 For each of the studies listed above, identify whether it is an experiment or a quasi-experiment.
1.6 For each of the studies in 1.4, identify whether the independent variable was manipu-lated between subjects or within subjects.
Stop and Think
Copyright ©2018 by SAGE Publications, Inc. This work may not be reproduced or distributed in any form or by any means without express written permission of the publisher.
Do not
copy
, pos
t, or d
istrib
ute
chaPter 1 Why Statistics? 17
Correlational Studies
Another common research design used in psychological studies is the correlational study. As described earlier, a correlational study examines relationships between measured dependent variables. In other words, correlational studies help researchers determine if two behaviors are related in some way. The relationship could be causal, such that one behavior causes the other, or it could be indirect, such that both behaviors are caused by a third factor. The correlational study cannot tell you which type of relationship exists with the level of certainty that an experiment can, but it can tell you if the behaviors you’re observing change together in some way.
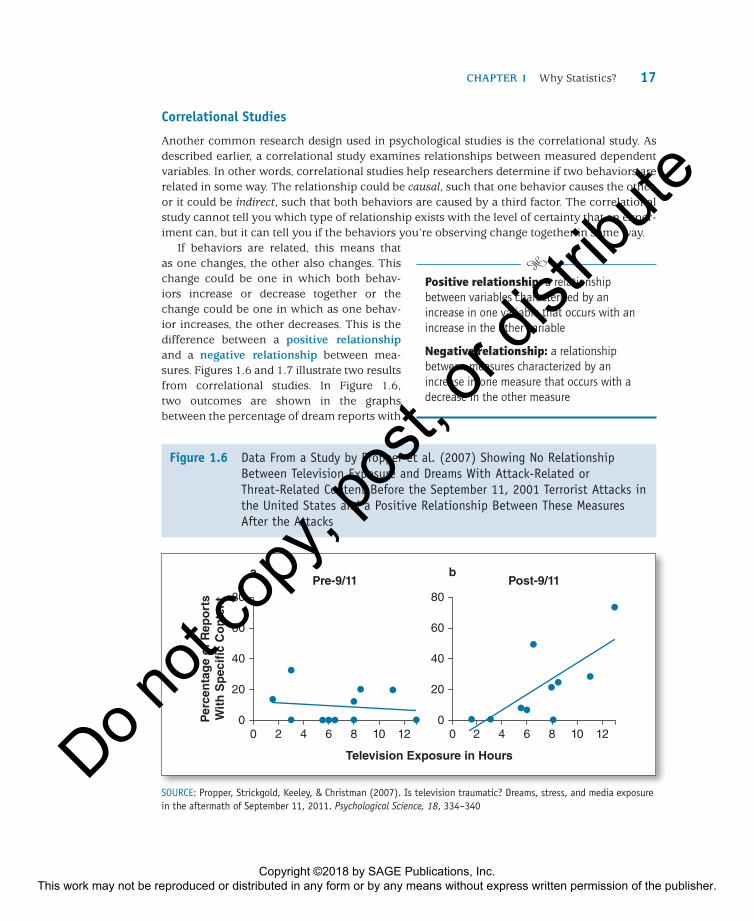
If behaviors are related, this means that as one changes, the other also changes. This change could be one in which both behaviors increase or decrease together or the change could be one in which as one behavior increases, the other decreases. This is the difference between a positive relationship and a negative relationship between measures. Figures 1.6 and 1.7 illustrate two results from correlational studies. In Figure 1.6, two outcomes are shown in the graphs between the percentage of dream reports with
Positive relationship: a relationship between variables characterized by an increase in one variable that occurs with an increase in the other variable
Negative relationship: a relationship between measures characterized by an increase in one measure that occurs with a decrease in the other measure
60
Per
cen
tag
e o
f R
epo
rts
Wit
h S
pec
i c
Co
nte
nt
40
20
80Pre-9/11
a b
Television Exposure in Hours
Post-9/11
00
60
40
20
80
002 4 6 8 10 12 2 4 6 8 10 12
Figure 1.6 Data From a Study by Propper et al. (2007) Showing No Relationship Between Television Exposure and Dreams With Attack-Related or Threat-Related Content Before the September 11, 2001 Terrorist Attacks in the United States and a Positive Relationship Between These Measures After the Attacks
SOURCE: Propper, Strickgold, Keeley, & Christman (2007). Is television traumatic? Dreams, stress, and media exposure in the aftermath of September 11, 2011. Psychological Science, 18, 334–340
Copyright ©2018 by SAGE Publications, Inc. This work may not be reproduced or distributed in any form or by any means without express written permission of the publisher.
Do not
copy
, pos
t, or d
istrib
ute

Part I Why Do We Use statIstIcs?18
attackrelated or threatrelated content and hours of television exposure on September 11, 2001, the day of the terrorist attacks in the United States (Propper, Srickgold, Keeley, & Christman, 2007). In the graph shown in Panel A, no relationship is seen between these measures before the attacks because no change occurred in reported dreams as TV exposure increased, but in Panel B, a positive relationship is seen after the attacks; more dreams were reported along with more TV exposure. No relationship exists in Panel A because there is no consistent change in dream reports as the number of hours of television exposure increases—the data show a flat line that does not increase or decrease. However, dream reports consistently increase with the increase in television exposure in Panel B, showing a positive relationship between these measures. In Figure 1.7, data from a study by Inzlicht, McKay, and Aronson (2006) are shown that illustrate a negative relationship. In this study, the researchers examined the relationship between African American students’ sensitivity to racial stigma and the students’ self regulation abilities (i.e., how well they felt they could focus on their academic work amid distracting activities). These data show a negative relationship between the students’ sensitivity to racial stigma and their regulation abilities: As their sensitivity to stigma increased, their selfregulation abilities decreased.
Figures 1.6 and 1.7 illustrate the three types of relationships that can be found in a correlational study. A finding of no relationship indicates that the two dependent variables do
90
80
70
60
50
100
40
201510Stigma Sensitivity (RS-race)
Sel
f-R
egu
lati
on
(S
ES
RL
)
50 25
Figure 1.7 Data From a Study by Inzlicht et al. (2006) Showing That Stigma Sensitivity and Self-Regulation Are Negatively Related
SOURCE: Inzlicht, McKay, & Aronson (2006). Stigma as ego depletion; How being the target of prejudice affects self-control. Psychological Science, 17, 262-269.
Copyright ©2018 by SAGE Publications, Inc. This work may not be reproduced or distributed in any form or by any means without express written permission of the publisher.
Do not
copy
, pos
t, or d
istrib
ute

chaPter 1 Why Statistics? 19
not consistently change together. A finding of a positive relationship indicates that the two dependent variables consistently change together in the same direction (both go up together and both go down together). A finding of a negative relationship indicates that the two dependent variables consistently change together, but in different directions (as one goes up, the other goes down). However, the most important thing to remember about correlational studies is that they do not provide direct causal information about the relationship. In other words, just because a relationship is found between the two variables does not mean that a change in one variable causes a change in the other variable. Thus, whenever you hear a report about a relationship between two variables, think to yourself, “Correlation does not imply causation,” and consider other things that could be causal factors to explain the relationship. Unless an experiment has been conducted, you must consider the possibility that the relationship is not a causal one.
The way you measure your dependent variables in a correlational study affects the statistics you use to look for relationships. The next chapter will examine the different ways that behaviors can be observed and measured. But before we look at the process of data collection in more detail, there are a couple of issues to consider in research: validity and reliability.
1.7 Consider the differences between experiments and correlational studies as you read the research questions below. For each question, which type of study (experimental or correlational) would be better for answering the question? Explain your answers.
a. Do energy drinks help you focus more while studying?
b. Do anxious people tend to sleep less?
c. Does eating red meat give you cancer?
d. Who earns a higher starting salary in their first job, people with higher college grade point averages (GPAs) or people with higher aptitude test scores (ACT, SAT, etc.)?
1.8 Consider the description of the Inzlicht et al. (2006) study presented in this section. How could these researchers have examined a causal relationship between stigma and self-regulation? Why do you think they chose to conduct a correlational study instead?
Stop and Think
Issues in Research: Validity and ReliabilityValidity
One of the biggest differences between experiments and correlational studies involves validity. Validity is how well the study tests what you want it to test. There are a few different types of validity to consider in a research study. One type is internal validity, the degree
Internal validity: the degree to which a research study provides causal information about behavior
Copyright ©2018 by SAGE Publications, Inc. This work may not be reproduced or distributed in any form or by any means without express written permission of the publisher.
Do not
copy
, pos
t, or d
istrib
ute

Part I Why Do We Use statIstIcs?20
to which a study provides causal information about behavior. Experiments tend to have higher internal validity than correlational studies because they provide better tests of causal relationships. However, experiments can also differ in how much internal validity they have. An experiment that is designed to focus exclusively on the independent variable as the cause of a change in the dependent variable will have higher internal validity because it controls other factors to rule out other possible explanations of a change in the dependent variable across the conditions.
Another type of validity to consider is external validity, the degree to which a study provides information about behavior that exists outside of the study. A study with higher external validity will examine behaviors that exist in the everyday lives of the individuals being studied. The more artificial the situation set up in a research study, the lower the external
validity because the behaviors observed might also be artificial. This means that the more a researcher controls for additional factors that can cause the observed behaviors to change (i.e., increases the internal validity), the more artificial the behaviors may be due to the control of those other factors. Thus, internal and external validity can affect one another as a researcher designs a study. In some cases, correlational studies that have lower internal validity may have higher external validity.
Other types of validity, such as construct valid-ity, relate to whether or not you have chosen a good way to measure the behavior. Construct validity is typically considered for surveys and questionnaires that are designed to measure a behavior through selfreports. If the items on the survey do a good job measuring the behavior you are interested in, then the
survey has good construct validity. These types of measures can be used in experiments or correlational studies, but they are more common in correlational studies, making construct validity an important issue when surveys and questionnaires are used as measures.
Reliability
Reliability refers to the consistency of a measure of behavior. If the measure of behavior provides the same values each time it is measured under the same or similar circumstances, then it is a reliable measure. Issues of reliability can arise when multiple researchers are measuring or observing behaviors. If individuals are being observed for specific behaviors by different researchers, it is possible that each researcher is recording or measuring the behaviors in a dif
ferent way. This is an issue of inter-rater reliability. If each researcher measures the behavior in different ways, the measures will be inconsistent and will not accurately reflect the behavior of interest. Thus, with multiple observers, it is important to check the interrater reliability of the measurements to ensure that they are consistent. Reliability can also be about the consistency of measurements over time or across items of survey or questionnaire. If the circumstances are the same, then a measure with good test–retest reliability will provide a similar score each time it is
External validity: the degree to which the results of a study apply to individuals and realistic behaviors outside the study
Inter-rater reliability: a measure of the degree to which different observers measure behaviors in similar ways
Test–retest reliability: indicates that the scores on a survey will be similar when participants complete the survey more than once under similar circumstances
Construct validity: the degree to which a measure is an accurate measure of the behavior of interest
Copyright ©2018 by SAGE Publications, Inc. This work may not be reproduced or distributed in any form or by any means without express written permission of the publisher.
Do not
copy
, pos
t, or d
istrib
ute

chaPter 1 Why Statistics? 21
used to measure a behavior from the same individual. A survey with good internal con-sistency will yield consistent scores across items that address the same behavior of interest. In other words, there should be a relationship between the different items about the same behavior. Thus, having a reliable measure of a behavior can increase the validity of your study, making it an important issue to consider when choosing a measure of behavior.
Statistics can help a researcher determine how reliable a measure is. For example, internal consistency and consistency across different observers/raters of behavior can be determined using statistics that examine the relationships between scores on different items or from different raters. Although the details of these statistics will not be specifically addressed in the chapters of this text, you may come across these reliability measures as you read about research that reported using surveys, questionnaires, or independent raters of behavior.
Internal consistency: a form of reliability that tests relationships between scores on different items of a survey
1.9 Suppose you come across each of the surveys described below. Which issue seems to be the bigger problem, validity or reliability?
a. You see a survey in a magazine about the quality of your relationship with your significant other. The items on the survey ask questions about your favorite color, favorite food, and favorite type of music.
b. You complete a survey as part of a research study on eating behaviors of college students. The items ask how much you like to eat different types of foods. You complete the survey once while you are hungry and then again one year later after you have eaten a large meal. Overall, your ratings are lower the second time you take the survey.
1.10 Explain how an unreliable measure of behavior can lower the internal validity of a research study.
Stop and Think
CHAPTER SUMMARY
1.1 Why do we use statistics to analyze data?
Statistics help us summarize a set of data and test hypotheses about behavior. They are important tools in understanding data from research studies in which we learn new knowledge about behavior.
1.2 how do descriptive and inferential statistics differ?
Descriptive statistics help us summarize a set of data. They include graphs and tables of the data, calculated values that represent typical scores, and values that represent the difference between the scores.
Inferential statistics help us test hypotheses made about the data. They use the descriptive statistics to determine the likelihood of obtaining our data when a hypothesis about the data is true.
Copyright ©2018 by SAGE Publications, Inc. This work may not be reproduced or distributed in any form or by any means without express written permission of the publisher.
Do not
copy
, pos
t, or d
istrib
ute

Part I Why Do We Use statIstIcs?22
1.3 Why are there so many different kinds of statistical tests?
There are many different ways to observe behavior, so many statistics have been developed to help researchers understand the observations that they have used. In addition, different statistics are helpful for the types of research designs described in this chapter. For example, experiments and correlational studies rely on different types of inferential statistics to answer the research questions asked in each of these designs.
1.4 What are the methods we use to collect data?
A brief description of some of the methods used in collecting data was provided in this chapter with an emphasis on the differences between experiments that provide causal information and correlational studies that provide information about relationships between different types of measures. The statistics we use to test our predictions about the data will depend on the methods used to collect those data and the scale of those measures.
1.5 how do the methods used to collect data affect the statistics we use?
As already mentioned, experiments and correlational studies use different inferential statistics because data are collected to answer different kinds of research questions in these designs. In addition, the observation techniques can vary across these designs, which require different types of statistics to better understand them. For example, in survey studies, there are statistics to help us examine the validity and reliability of the survey. The rest of this text will discuss this question in much more detail.
THINKING ABOUT RESEARCH
A summary of a research study in psychology is given below. As you read the summary, think about the following questions:
1. Was this study an experiment or a correlational study? Remember that an experiment will contain an independent variable, but a correlational study will not.
2. Identify the dependent variables. Explain how these variables were measured in the study.
3. Consider the validity of this study. Which types of validity discussed in this chapter are relevant for this study?
4. In what way(s) is reliability important in this study?
5. Examine the graph presented in Figure 1.8. Why are there two lines in this graph? What do the two lines represent in the study? Does this graph help you understand the data from the study? Why or why not?
6. How were inferential statistics used in this study?
Duffy, K. A., & Chartrand, T. L. (2015). The extravert advantage: How and when extraverts build rapport with other people. Psychological Science, 26, 1795–1802.
Note: Study 1 of this article is described below.
Purpose of the Study. Extraverts are known to have more social interactions than introverts, but how do they do it? What behaviors do extraverts exhibit that give them a social edge? Researchers Duffy and Chartrand (2015) designed a study to answer this question. They hypothesized that one important aspect of extraverts’ behavior was mimicking other people they wanted to get along with. Their study compared the relationship between mimicry and extraversion under two conditions: one in which subjects were given some motivation to get along with someone else during a task (goalpresent condition) and one in which subjects were not given this motivation (goalabsent condition).
Copyright ©2018 by SAGE Publications, Inc. This work may not be reproduced or distributed in any form or by any means without express written permission of the publisher.
Do not
copy
, pos
t, or d
istrib
ute

chaPter 1 Why Statistics? 23
Method of the Study. This study included 84 female undergraduate students as participants. Half of the participants were randomly assigned to the goalpresent condition and the other half were assigned to the goalabsent condition. In the goalpresent condition, the subjects were told that the task worked better when people got along with each other. In the goalabsent condition, this instruction was not given to the subjects. The participants were asked to complete a task in which they took turns with another subject (who was actually a trained researcher) describing presented photographs. During this task, the researcher performed easily mimicked behaviors (e.g., touching her hair or face, tapping her foot). During the task, the subject was filmed to examine the amount of time they spent mimicking the behaviors. Two researchers later coded the films to measure the time. At the end of the task, the subjects completed a questionnaire measuring their level of extraversion.
Results of the Study. The relationship between extraversion score and time spent mimicking was examined separately for the two goal groups. Figure 1.8 presents the relationship for each condition. Using inferential statistics, the researchers confirmed that there was a positive relationship between extraversion score and mimicry in the goalpresent condition, but there was no relationship between these variables in the goalabsent condition.
3.5
3.0
2.5
2.0
1.5
1.0
0.5
0.06.05.55.04.5
Extraversion
Sq
uar
e R
oo
t o
f M
imic
ry(s
eco
nd
s o
f m
imic
ry/m
inu
te o
f in
tera
ctio
n)
4.03.53.02.5 6.5
Goal Present Goal Absent
Figure 1.8 Data From the Duffy and Chartrand (2015) Study
SOURCE: Duffy & Chartrand (2015). The extravert advantage: How and when extraverts build rapport with other people. Psychological Science, 26, 1795-1802.
Copyright ©2018 by SAGE Publications, Inc. This work may not be reproduced or distributed in any form or by any means without express written permission of the publisher.
Do not
copy
, pos
t, or d
istrib
ute

Part I Why Do We Use statIstIcs?24
Conclusions of the Study. From the results of this study, the researchers concluded that extraverts mimic others they wish to get along with as a way to effectively socially interact with them. However, they only seem to exhibit the mimicry behaviors when they have the goal of getting along with another person. Thus, mimicry seems to be one behavior that extraverts use to get along well with others.
TEST YOURSELF
1. Imagine you’ve heard an ad that states something like “Four out of five dentists recommend using Product X.”
a. Which of the following statistics is this statement most likely based on?
• When they asked five dentists if they recommend Product X, the first four said “yes” and the last one said “no.”
• When they asked a sample of dentists if they recommend Product X, 80% of the sample said “yes.”
• When they surveyed a sample of dentists, 80% of them said they would use Product X.
b. What other information might you want to know before you decide if you want to use Product X?
2. Consider the graphs presented in this chapter. Notice how they are constructed. Answer the questions about the graphs below.
a. For the graphs presented in Figure 1.3, what is presented on the xaxis (the horizontal axis)? What is presented on the yaxis (the vertical axis)? Which of these is the independent variable in the Drews et al. (2009) study and which is the dependent variable?
b. For the graphs presented in Figure 1.6, what do each of the dots in the graphs represent? How do these graphs differ in structure from the graph presented in Figure 1.5? Note the differences you see between these graphs.
3. A quasiexperiment is an experiment in which __________.
a. three or more groups of subjects are compared
b. subjects are not randomly assigned to groups
c. the relationship between two measured variables is tested
4. Inferential statistics help us __________.
a. summarize the data
b. rule out alternative explanations of the results
c. test hypotheses about the results
5. A graph is a form of __________.
a. descriptive statistic
b. inferential statistic
c. validity
d. reliability
Copyright ©2018 by SAGE Publications, Inc. This work may not be reproduced or distributed in any form or by any means without express written permission of the publisher.
Do not
copy
, pos
t, or d
istrib
ute

chaPter 1 Why Statistics? 25
Read the following scenario to answer questions 6-9. Imagine that a research team is investigating the role of participant mood on memory for a film clip. They randomly assign participants to one of two moodinduction conditions (happy versus sad) and ask them to complete a multiplechoice test on the film clip content and a demographic questionnaire (class year, age, gender). They find that, on average, participants in the sad mood condition answered 80% of the questions correctly, and the happy mood condition answered 75% correctly.
6. The researchers want to know how much of their sample is comprised of freshman, sophomores, juniors, and seniors. What type of statistic can they use to gather this information?
a. Descriptive statistics
b. Valid statistics
c. Inferential statistics
d. Experimental statistics
7. Imagine that the researchers hypothesized that a sad mood results in better memory than a happy mood. What type of statistic can they use to gather this information?
a. Descriptive statistic
b. Valid statistic
c. Inferential statistic
d. Experimental statistic
8. What is the independent variable?
a. The memory test for the film clips
b. The mood condition
c. The class year of the participants
d. None of the above
9. What is the dependent variable?
a. The memory test for the film clips
b. The mood condition
c. The class year of the participants
d. None of the above
Read the following scenario to answer questions 10-14. A researcher has conducted a study on the effect of text color on student retention of class material. His experiment procedure used an old, slightly stained overhead projector, and his colleagues warn him that his results may not generalize to other realworld settings, since most projectors do not have the same stain patterns.
10. His colleagues are questioning the ______________ validity of the study.
a. internal
b. external
c. construct
d. face
Copyright ©2018 by SAGE Publications, Inc. This work may not be reproduced or distributed in any form or by any means without express written permission of the publisher.
Do not
copy
, pos
t, or d
istrib
ute
Part I Why Do We Use statIstIcs?26
11. A researcher has developed a survey designed to assess students’ fears about research methods and related coursework. Her data suggest that students get roughly the same scores when they take the assessment more than once. This is one indicator that her assessment has high ___________________ reliability.
a. consistent
b. interrater
c. test–retest
d. internal
12. Every study has an independent variable.
a. True
b. False
13. Every study has a dependent variable.
a. True
b. False
14. The methods used by an experimenter are crucial to the ______________ validity of a study.
a. internal
b. external
c. construct
d. both (a) and (b)
Copyright ©2018 by SAGE Publications, Inc. This work may not be reproduced or distributed in any form or by any means without express written permission of the publisher.
Do not
copy
, pos
t, or d
istrib
ute