Chapter 1: UV-Visible & Fluorescence Spectroscopy · Chapter 1: UV-Visible & Fluorescence...
6
1 Chapter 1: UV-Visible & Fluorescence Spectroscopy This chapter covers two methods of spectroscopic characterization: UV-Visible absorption spectroscopy (often abbreviated as UV-Vis) and fluorescence emission spectroscopy. These two methods are measured over the same range of wavelengths, but are caused by two different phenomena. In both cases, the wavelengths used are the near-ultraviolet range (200 to 400 nm) and the visible range (400 to 750 nm). These two regions are typically considered together as a single category because there is a common physical basis for the behavior of a compound in both UV and visible light. UV-Vis measures the absorption of light in this range, while fluorescence measures the light emitted by a sample in this range after absorbing light at a higher energy than it is emitting. 1.1 UV-Visible Spectroscopy UV-Visible absorption spectroscopy involves measuring the absorbance of light by a compound as a function of wavelength in the UV-visible range. When a molecule absorbs a photon of UV-Vis light, the molecule is excited from its ground state to an electronic excited state. In other words, an electron is promoted from the HOMO (Highest-energy Occupied Molecular Orbital) of the molecule to the LUMO (Lowest-energy Unoccupied Molecular Orbital) of the molecule. The HOMO is commonly a π orbital of a conjugated functional group and the LUMO is commonly a π* orbital of the conjugated functional group. The smaller the energy difference between HOMO and LUMO, the less energy is needed and the longer the wavelength that will be absorbed (Figure 1-1). Figure 1-1: The relationship between HOMO-LUMO gap and absorbed wavelength of light. For this process to occur, the energy of the photon has to match the energy of the HOMO-LUMO gap. For most conjugated molecules, the photons with the correct amount of energy just happen to fall within the range of near UV and visible light, which is why these frequencies are used. The biggest factor in determining the HOMO-LUMO gap is the extent of the conjugated system – bigger systems have smaller HOMO-LUMO gaps. Another factor that can change the HOMO-LUMO gap is the functional groups that are conjugated to the double bonds of the molecule, since these can raise or lower the energy or either orbital. The wavelength which is most strongly absorbed by a compound is called its λmax (pronounced “lambda max”) and can be measured by UV-visible spectroscopy. Unlike IR, where most functional groups typically absorb a narrow range of wavelengths and give a sharp peak, UV- Vis always shows broad peaks. The absorption occurs over a band of wavelengths because slightly different wavelengths will cause simultaneous electronic and vibrational excitation. This is described in more detail in the section on fluorescence spectroscopy, below.
Transcript of Chapter 1: UV-Visible & Fluorescence Spectroscopy · Chapter 1: UV-Visible & Fluorescence...

1
Chapter 1: UV-Visible & Fluorescence Spectroscopy
This chapter covers two methods of spectroscopic characterization: UV-Visible absorption spectroscopy
(often abbreviated as UV-Vis) and fluorescence emission spectroscopy. These two methods are measured
over the same range of wavelengths, but are caused by two different phenomena. In both cases, the
wavelengths used are the near-ultraviolet range (200 to 400 nm) and the visible range (400 to 750 nm).
These two regions are typically considered together as a single category because there is a common physical
basis for the behavior of a compound in both UV and visible light. UV-Vis measures the absorption of light in this range, while fluorescence measures the light emitted by a sample in this range after absorbing
light at a higher energy than it is emitting.
1.1 UV-Visible Spectroscopy
UV-Visible absorption spectroscopy involves measuring the absorbance of light by a compound as a
function of wavelength in the UV-visible range. When a molecule absorbs a photon of UV-Vis light, the
molecule is excited from its ground state to an electronic excited state. In other words, an electron is
promoted from the HOMO (Highest-energy Occupied Molecular Orbital) of the molecule to the LUMO
(Lowest-energy Unoccupied Molecular Orbital) of the molecule. The HOMO is commonly a π orbital of
a conjugated functional group and the LUMO is commonly a π* orbital of the conjugated functional
group. The smaller the energy difference between HOMO and LUMO, the less energy is needed and the longer the wavelength that will be absorbed (Figure 1-1).
Figure 1-1: The relationship between HOMO-LUMO gap and absorbed wavelength of light.
For this process to occur, the energy of the photon has to match the energy of the HOMO-LUMO gap.
For most conjugated molecules, the photons with the correct amount of energy just happen to fall within
the range of near UV and visible light, which is why these frequencies are used.
The biggest factor in determining the HOMO-LUMO gap is the extent of the conjugated system – bigger
systems have smaller HOMO-LUMO gaps. Another factor that can change the HOMO-LUMO gap is
the functional groups that are conjugated to the double bonds of the molecule, since these can raise or
lower the energy or either orbital. The wavelength which is most strongly absorbed by a compound is
called its λmax (pronounced “lambda max”) and can be measured by UV-visible spectroscopy. Unlike IR,
where most functional groups typically absorb a narrow range of wavelengths and give a sharp peak, UV-
Vis always shows broad peaks. The absorption occurs over a band of wavelengths because slightly
different wavelengths will cause simultaneous electronic and vibrational excitation. This is described in
more detail in the section on fluorescence spectroscopy, below.

Chapter 1: UV-Visible & Fluorescence Spectroscopy
2
1.2 Colors and Light Adsorption
Whenever a compound absorbs a particular wavelength or color from white light, the combination of the
reflected wavelengths makes the compound appear a complementary color. For example, if a compound
absorbs in the visible region at 590 nm, which is yellow, the combination of all the other wavelengths
which are reflected makes the compound appear blue. The exact cutoffs for these color ranges are
somewhat subjective, but most reference sources cite values similar to the ones given below.
λmax (nm) Color
Absorbed
Color
Observed
<400 Ultraviolet White
400–435 Violet Yellow-Green
435–480 Blue Yellow
480–500 Green-Blue Orange
500-560 Green Red
560–590 Yellow-Green Violet
590–600 Yellow Blue
600–610 Orange Green-Blue
610–700 Red Green
1.3 Procedure for Collecting a UV-Vis Spectrum
The instrument used to collect UV-Vis spectra is called a spectrometer. The teaching labs at CU own
several spectrometers of the SpectroVis Plus type. (This instrument can also be used to collect
fluorescence spectra, as described below.) This instrument uses a white incandescent bulb to emit light in
the range of 380 nm to 950 nm. Note that this barely extends into the UV range and is primarily in the
visible wavelengths, but for the purposes of the teaching labs this is usually sufficient. More advanced
spectrometers can emit and detect wavelengths across the entire near-UV and visible range.
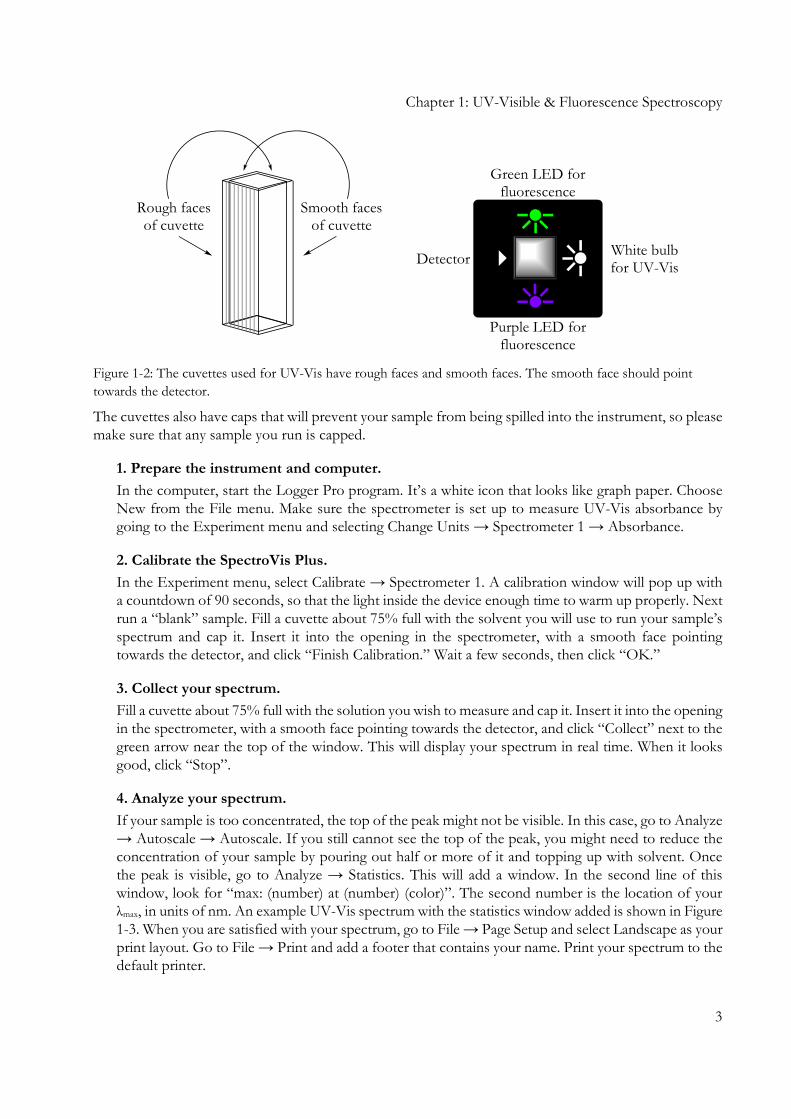
The sample holders used in the instrument are called cuvettes. They have two rough faces and two smooth
faces (Figure 1-2). The opening in the spectrometer where the cuvette is inserted is surrounded by
markings indicating the locations of the detector and the light sources. When you insert your cuvette into
the spectrometer, you should make sure that a smooth face is pointing towards the detector, marked with
a white triangle. This means the light can pass from the white bulb, through the sample, and into the
detector, without being interrupted by the cuvette.
Chapter 1: UV-Visible & Fluorescence Spectroscopy
3
Figure 1-2: The cuvettes used for UV-Vis have rough faces and smooth faces. The smooth face should point
towards the detector.
The cuvettes also have caps that will prevent your sample from being spilled into the instrument, so please
make sure that any sample you run is capped.
1. Prepare the instrument and computer.
In the computer, start the Logger Pro program. It’s a white icon that looks like graph paper. Choose
New from the File menu. Make sure the spectrometer is set up to measure UV-Vis absorbance by
going to the Experiment menu and selecting Change Units → Spectrometer 1 → Absorbance.
2. Calibrate the SpectroVis Plus.
In the Experiment menu, select Calibrate → Spectrometer 1. A calibration window will pop up with
a countdown of 90 seconds, so that the light inside the device enough time to warm up properly. Next
run a “blank” sample. Fill a cuvette about 75% full with the solvent you will use to run your sample’s
spectrum and cap it. Insert it into the opening in the spectrometer, with a smooth face pointing
towards the detector, and click “Finish Calibration.” Wait a few seconds, then click “OK.”
3. Collect your spectrum.
Fill a cuvette about 75% full with the solution you wish to measure and cap it. Insert it into the opening
in the spectrometer, with a smooth face pointing towards the detector, and click “Collect” next to the
green arrow near the top of the window. This will display your spectrum in real time. When it looks
good, click “Stop”.
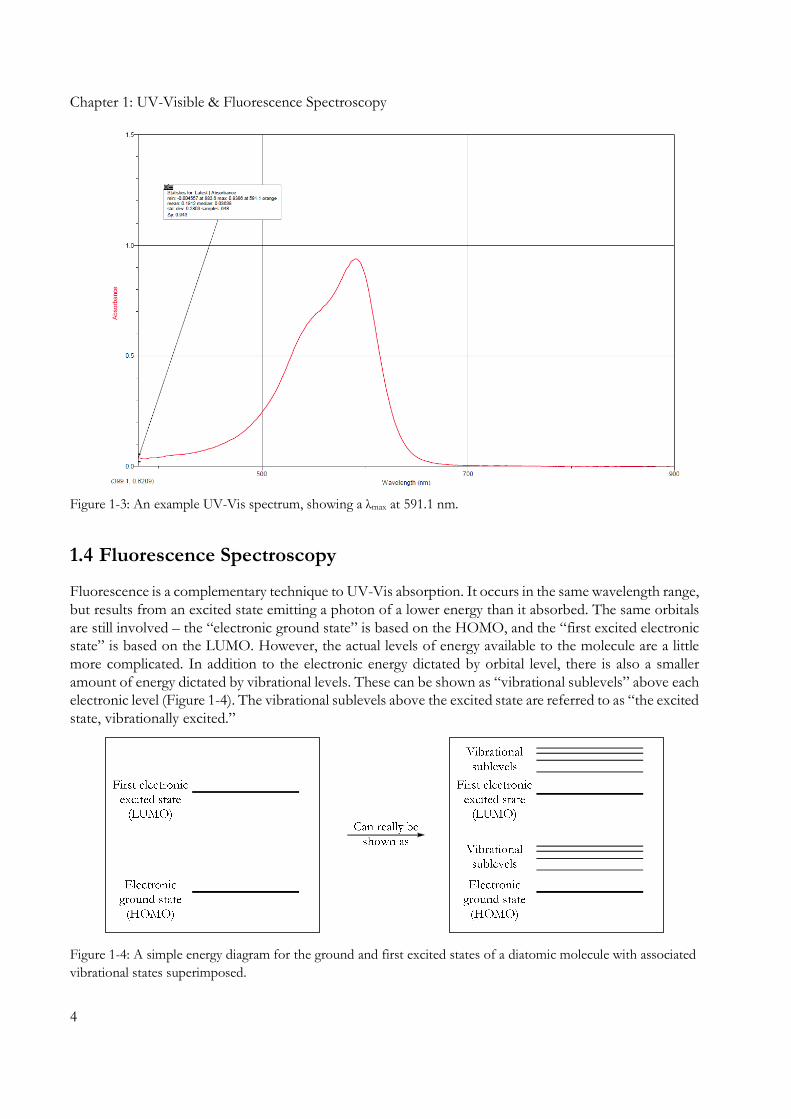
4. Analyze your spectrum.
If your sample is too concentrated, the top of the peak might not be visible. In this case, go to Analyze
→ Autoscale → Autoscale. If you still cannot see the top of the peak, you might need to reduce the
concentration of your sample by pouring out half or more of it and topping up with solvent. Once
the peak is visible, go to Analyze → Statistics. This will add a window. In the second line of this
window, look for “max: (number) at (number) (color)”. The second number is the location of your
λmax, in units of nm. An example UV-Vis spectrum with the statistics window added is shown in Figure
1-3. When you are satisfied with your spectrum, go to File → Page Setup and select Landscape as your
print layout. Go to File → Print and add a footer that contains your name. Print your spectrum to the
default printer.
Rough facesof cuvette
Smooth facesof cuvette
Green LED forfluorescence
Purple LED forfluorescence
White bulbfor UV-Vis
Detector
Chapter 1: UV-Visible & Fluorescence Spectroscopy
4
Figure 1-3: An example UV-Vis spectrum, showing a λmax at 591.1 nm.
1.4 Fluorescence Spectroscopy
Fluorescence is a complementary technique to UV-Vis absorption. It occurs in the same wavelength range,
but results from an excited state emitting a photon of a lower energy than it absorbed. The same orbitals
are still involved – the “electronic ground state” is based on the HOMO, and the “first excited electronic state” is based on the LUMO. However, the actual levels of energy available to the molecule are a little
more complicated. In addition to the electronic energy dictated by orbital level, there is also a smaller
amount of energy dictated by vibrational levels. These can be shown as “vibrational sublevels” above each
electronic level (Figure 1-4). The vibrational sublevels above the excited state are referred to as “the excited
state, vibrationally excited.”
Figure 1-4: A simple energy diagram for the ground and first excited states of a diatomic molecule with associated
vibrational states superimposed.

Chapter 1: UV-Visible & Fluorescence Spectroscopy
5
When a molecule absorbs a photon of UV or visible light, an electron moves from the HOMO to the
LUMO to create either the excited state in its ground vibrational level, or the excited state vibrationally excited. From the sublevels, it can undergo “vibrational relaxation”, which causes it to lose a little bit of
energy non-radiatively (that is, without emitting a photon), and drop back down to the ground state. Once
it reaches the lowest vibration level of the excited state, it can emit a photon and drop back to the ground
state or the ground state vibrationally excited, or it can decay back to ground state non-radiatively by
emission of heat. (Another option is that is can use this excess energy to undergo a photochemical
reaction.) Overall, this means that the photon that eventually gets emitted is lower in energy (and longer
in wavelength) than the photon that was initially absorbed. The diagram used to describe this process is
called a Jablonski diagram, shown in Figure 1-5.
Figure 1-5: Fluorescence, shown in this Jablonski diagram, involves emitting a photon at a lower energy than the
photon that was initially absorbed. The diagram is read from left to right – absorbance occurs first, then
vibrational relaxation, then fluorescence.
Some commercially available fluorescent dyes absorb in the UV and fluoresce in the visible, so the dyed
item appears to glow slightly when irradiated with UV light. White shirts, when irradiated with so-called black lights that produce UV light in the region 330 to 380 nm, glow blue because of a fluorescent dye
incorporated in the fabric.
Not all molecules electronically excited fluoresce; some just decay to ground state with emission of heat.
This phenomenon explains why your car gets hot in the summer sun with the windows closed. The fabric
absorbs light to create electronic excited states of the dye molecules and these decay to ground states with
emission of heat. The car gets hot because the window glass is not transparent to heat which is radiation in the infrared region of the electromagnetic spectrum.
1.5 Procedure for Collecting a Fluorescence Spectrum
The same spectrometer used for UV-Vis, the SpectroVis Plus, can also be used for fluorescence. As in
UV-Vis, the smooth side of the cuvette should be pointed towards the detector. The difference between
UV-Vis and fluorescence is that instead of having a white light pass directly through the sample into the

Chapter 1: UV-Visible & Fluorescence Spectroscopy
6
detector, the sample is illuminated from the side through the rough side of the cuvette. The rough side
exists so that this light can be properly scattered throughout the sample, since direct transmission of light through the sample is not desirable for fluorescence.
The SpectroVis Plus contains two separate LEDs for fluorescence measurements. One emits purple light
a 405 nm and one emits green light at 500 nm. You do not need to calibrate the instrument if you are
collecting a fluorescence spectrum. This is because, unlike the white bulb used for UV-Vis, the color
profile of the LEDs will not drift over time as the light source ages.
1. Prepare the instrument and computer.
In the computer, start the Logger Pro program. It’s a white icon that looks like graph paper. Choose
New from the File menu. Make sure the spectrometer is set up to measure UV-Vis absorbance by
going to the Experiment menu and selecting Change Units → Spectrometer 1 → Fluorescence 405
nm or 500 nm, depending on which wavelength is needed for your experiment.
2. Collect your spectrum.
Fill a cuvette about 75% full with the solution you wish to measure and cap it. Insert it into the opening
in the spectrometer, with a smooth face pointing towards the detector, and click “Collect” next to the
green arrow near the top of the window. This will display your spectrum in real time. When it looks
good, click “Stop”.
3. Analyze your spectrum.
If your sample is too concentrated, the top of the peak might not be visible. In this case, go to Analyze
→ Autoscale → Autoscale. If you still cannot see the top of the peak, you might need to reduce the
concentration of your sample by pouring out half or more of it and topping up with solvent. Once
the peak is visible, go to Analyze → Statistics. This will add a window. In the second line of this
window, look for “max: (number) at (number) (color)”. The second number is the location of your
λmax. When you are satisfied with your spectrum, go to File → Page Setup and select Landscape as
your print layout. Go to File → Print and add a footer that contains your name. Print your spectrum
to the default printer.