CHAPTER 1 Univariate data - St Leonard's College · PDF fileChapter Answers CHAPTER 1...
17
Chapter Answers CHAPTER 1 Univariate data Exercise 1A — Types of data 1 Numerical a, b, c, g, h Categorical d, e, f, i, j, k, l, m 2 Discrete c, g Continuous a, b, h 3 C 4 C Exercise 1B — Stem plots 1 a 1 2 5 8 12 13 13 16 16 17 21 23 24 25 25 26 27 30 32 b 10 11 23 23 30 35 39 41 42 47 55 62 c 101 102 115 118 122 123 123 136 136 137 141 143 144 155 155 156 157 d 50 51 53 53 54 55 55 56 56 57 59 a 1 4 5 8 10 12 16 19 19 21 21 25 29 2 Busker's earnings are inconsistent. 3 It seems to be an activity for older people. 4 C Page 1 of 17 Maths Quest 12 Further Mathematics 3E TI 2.0 ED - Answers - CHAPTER 1 Univariate data 27/11/2013 http://content.jacplus.com.au/faces/pages/ebookviewer.xhtml?isbn=1742464599&pk=5811f7f3de8a584...
Transcript of CHAPTER 1 Univariate data - St Leonard's College · PDF fileChapter Answers CHAPTER 1...

Chapter Answers
CHAPTER 1 Univariate dataExercise 1A — Types of data
1 Numerical a, b, c, g, h
Categorical d, e, f, i, j, k, l, m
2 Discrete c, g
Continuous a, b, h
3 C
4 C
Exercise 1B — Stem plots
1 a 1 2 5 8 12 13 13 16 16 17 21 23 24 25 25 26 27 30 32
b 10 11 23 23 30 35 39 41 42 47 55 62
c 101 102 115 118 122 123 123 136 136 137 141 143 144 155 155 156 157
d 50 51 53 53 54 55 55 56 56 57 59
a 1 4 5 8 10 12 16 19 19 21 21 25 29
2
Busker's earnings are inconsistent.
3
It seems to be an activity for older people.
4 C
Page 1 of 17Maths Quest 12 Further Mathematics 3E TI 2.0 ED - Answers - CHAPTER 1 Univariate data
27/11/2013http://content.jacplus.com.au/faces/pages/ebookviewer.xhtml?isbn=1742464599&pk=5811f7f3de8a584...

5
Ages are spread considerably; not all are young.
6
Bulldogs, Melbourne, St Kilda
7
8
There are two groups, one with house prices between $510 000 and $550 000 and the other with prices between $580 000 and $670 000.
9 a
Page 2 of 17Maths Quest 12 Further Mathematics 3E TI 2.0 ED - Answers - CHAPTER 1 Univariate data
27/11/2013http://content.jacplus.com.au/faces/pages/ebookviewer.xhtml?isbn=1742464599&pk=5811f7f3de8a584...
b
c
10 a
b
c
Values are bunched together; they vary little.
Exercise 1C — Dot plots, frequency histograms and bar charts
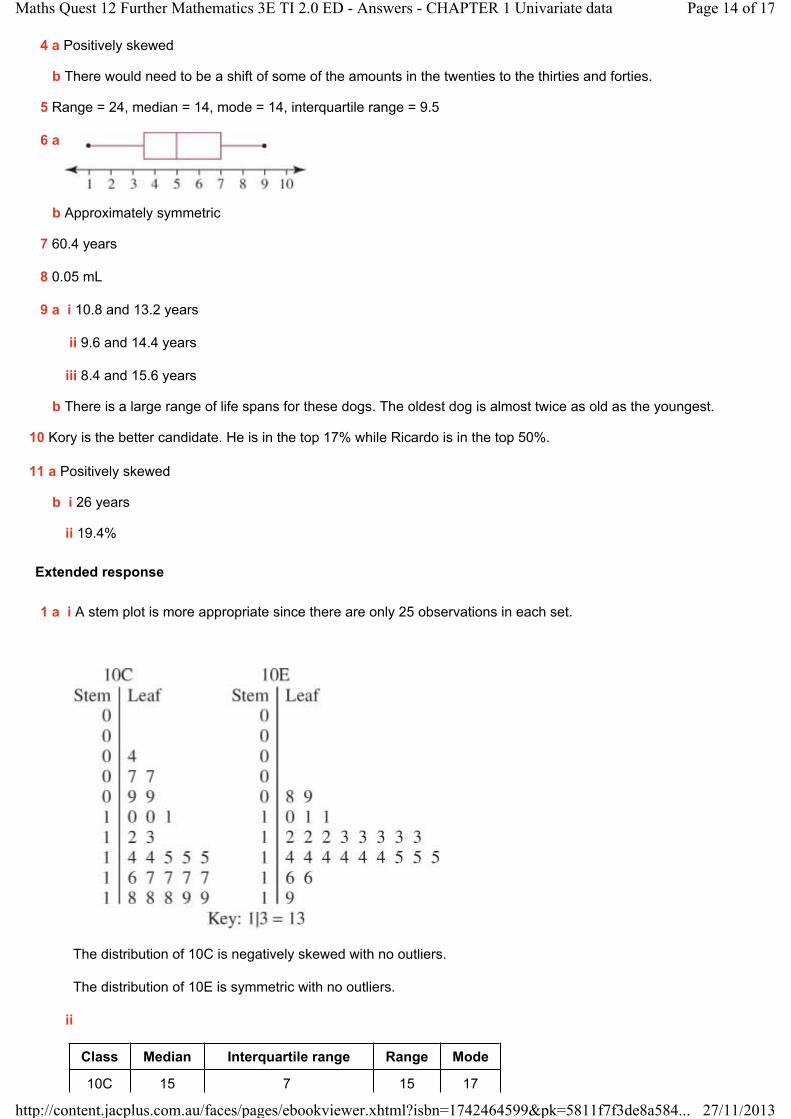
1 a
Class Frequency
1−1.9 1
Page 3 of 17Maths Quest 12 Further Mathematics 3E TI 2.0 ED - Answers - CHAPTER 1 Univariate data
27/11/2013http://content.jacplus.com.au/faces/pages/ebookviewer.xhtml?isbn=1742464599&pk=5811f7f3de8a584...

2−2.9 2
3−3.9 2
Class Frequency
4−4.9 6
5−5.9 5
6−6.9 1
b
Class interval Frequency
10−14 3
15−19 9
20−24 10
Class interval Frequency
25−29 10
30−34 10
35−39 1
c
Score Frequency
0.3 1
0.4 2
0.5 1
0.6 1
0.7 1
0.8 2
Score Frequency
0.9 2
1.0 2
1.1 1
1.2 1
1.3 1
2 a
Page 4 of 17Maths Quest 12 Further Mathematics 3E TI 2.0 ED - Answers - CHAPTER 1 Univariate data
27/11/2013http://content.jacplus.com.au/faces/pages/ebookviewer.xhtml?isbn=1742464599&pk=5811f7f3de8a584...

b
c
3 Check your histograms against those shown in question 2 answers.
4
5 a
NZ 26.5%
US 13.5%
UK 12.8%
India 10.1%
China 7.5%
Thailand 6.4%
Fiji 6.2%
Singapore 6.0%
HK 5.9%
Malaysia 5.1%
b
Page 5 of 17Maths Quest 12 Further Mathematics 3E TI 2.0 ED - Answers - CHAPTER 1 Univariate data
27/11/2013http://content.jacplus.com.au/faces/pages/ebookviewer.xhtml?isbn=1742464599&pk=5811f7f3de8a584...

6 Participation in activities
The statement seems untrue as there are similar participation rates for all ages. However, the data don't indicate types of activities.
Exercise 1D — Describing the shape of stem plots and histograms
1 a Symmetric
b Negatively skewed
c Positively skewed
d Symmetric
e Symmetric
f Positively skewed
2 a Symmetric
b Symmetric
c Symmetric
d Negatively skewed
e Negatively skewed
f Positively skewed
3 E
4 C
5 Negatively skewed
6 Positively skewed. This tells us that most of the flight attendants in this group spend a similar number of nights interstate per month. A few stay away more than this and a very few stay away a lot more.
7 a Symmetric
b This tells us that there are few low-weight dogs and few heavy dogs but most dogs have a weight in the teens (in kg).
8 a Symmetric
b Most students receive about $8 (give or take $2).
9 a Positively skewed
b i 15
ii 85%
Page 6 of 17Maths Quest 12 Further Mathematics 3E TI 2.0 ED - Answers - CHAPTER 1 Univariate data
27/11/2013http://content.jacplus.com.au/faces/pages/ebookviewer.xhtml?isbn=1742464599&pk=5811f7f3de8a584...
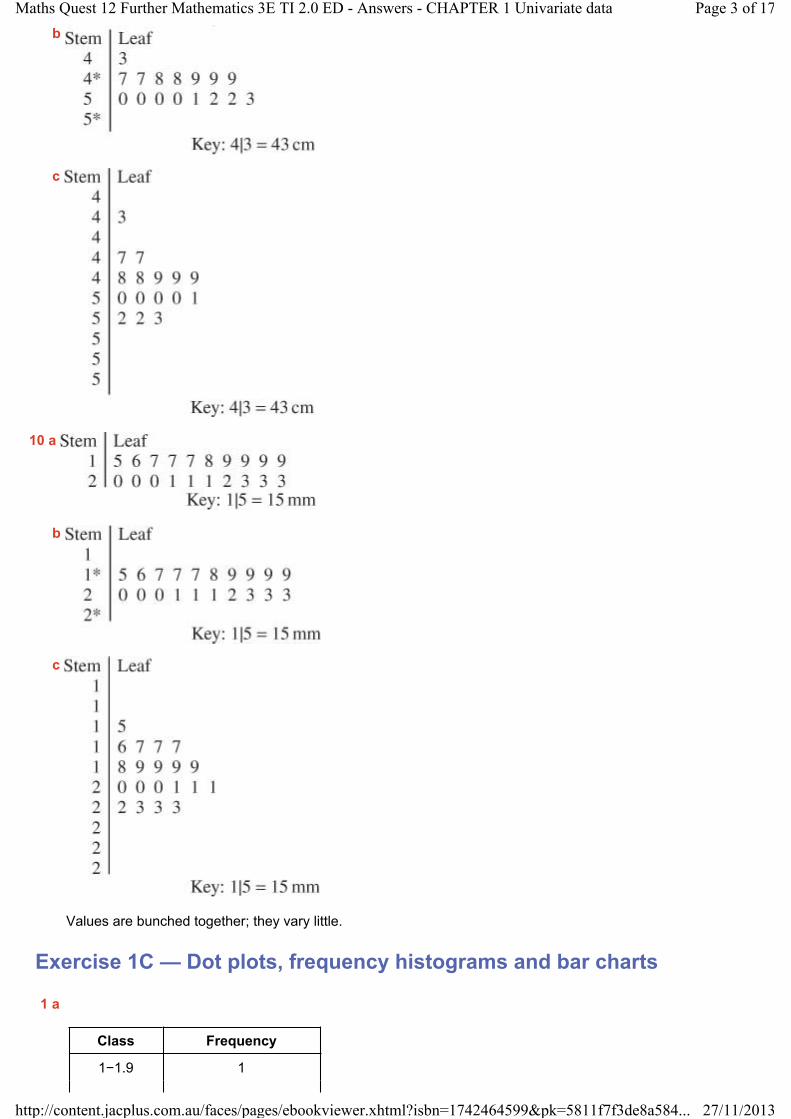
Exercise 1E — The median, the interquartile range, the range and the mode
1
Median Range Mode
a 37 56 38, 49
b 5 17 5
c 11 18 8, 11
d 42.5 18 43
e 628 72 613, 628, 632
2
Median Range
a 6 7
b 17 9
c 6 6
d 10 13
e 18.5 14
f 4 7
g 19 17
h 4.5 9
i 23 21
3 a 10
b 8
c The IQRs (middle 50%) are similar for the two restaurants but there is no indication of the actual numbers of cars.
4 An example is 2 3 6 8 9. There are many others.
5 a Yes. The lowest score occurs several times. An example is 2 2 2 3 5 6.
b Yes. There are several data points that have the median value. An example is 3 5 5 5 5 5 7.
6 C
7
Median Interquartile range Range Mode
a 21 18 45 15, 23, 32
b 27.5 8 20 29
c 3.7 3 5.9 3.7
8
Median Interquartile range Range Mode
Page 7 of 17Maths Quest 12 Further Mathematics 3E TI 2.0 ED - Answers - CHAPTER 1 Univariate data
27/11/2013http://content.jacplus.com.au/faces/pages/ebookviewer.xhtml?isbn=1742464599&pk=5811f7f3de8a584...

a 42 21 91 46
b 32 7 30 34
The data in set a have a greater spread than in set b, although the medians are similar. The spread of the middle 50% (IQR) of data for set a is bigger than for set b but the difference is not as great as the spread for all the data (range).
Exercise 1F — Boxplots
1
Range Interquartile range Median
a 12 6 8
b 7 2 5
c 350 100 250
d 100 30 65
e 20 10 25
2 c i
d ii
a iii
b iv
3 The boxplots should show the following:
Minimum value Q1 Median Q3 Maximum value
a 3 6 8.5 14 18
b 3 5 7 9 12
c 4.3 4.6 5 5.4 5.6
d 11 15.5 18 20 22
e 0.4 0.7 0.9 1.1 1.3
4 D
5
6
7 a
The data are negatively skewed with an outlier on the lower end. The reason for the outlier may be that the person wasn't at the show for long or possibly didn't like the rides.
Page 8 of 17Maths Quest 12 Further Mathematics 3E TI 2.0 ED - Answers - CHAPTER 1 Univariate data
27/11/2013http://content.jacplus.com.au/faces/pages/ebookviewer.xhtml?isbn=1742464599&pk=5811f7f3de8a584...

8 a Two similar properties: both sets of data have the same minimum value and they both have a slight negative skew.
b Boys IQR =16
Girls IQR = 16.5
c The reason for an outlier in the boys' data may be that the student did not understand how to do the test, or he stopped during the test rather than working continuously.
Exercise 1G — The mean
1 a 7.2
b 7.125
c 4.9875
d 16.7
e 0.8818
2 a 1.0783 No, because of the outlier.
b 17 Yes
c 30.875 Yes
d 15.57 No, because of the outlier.
3 12
4 D
5 A
6 a Median
b Mean
c Median
d Median
7 a 36.09
b 16.63
c 168.25
d 18.55
8 a
b median = 22
The distribution is positively skewed — confirmed by the table and the boxplot.
Exercise 1H — Standard deviation
1 a 1.21
b 2.36
c 6.01
d 2.45
Page 9 of 17Maths Quest 12 Further Mathematics 3E TI 2.0 ED - Answers - CHAPTER 1 Univariate data
27/11/2013http://content.jacplus.com.au/faces/pages/ebookviewer.xhtml?isbn=1742464599&pk=5811f7f3de8a584...

e 0.06
2 0.48%
3 0.06 m
4 0.51 seconds
5 15.49
6 C
Exercise 1I — The 68-95-99.7% rule and z-scores
1 a Yes
b Yes
c No
d No
e No
f Yes
2 a 8 10 12
b 6 10 14
c 4 10 16
3 a 3.7 5 6.3
b 2.4 5 7.6
c 1.1 5 8.9
4 a 35 s and 63 s
b 21 s and 77 s
c 7 s and 91 s
5 a 1.3 mm and 2.5 mm
b 0.7 mm and 3.1 mm
c 0.1 mm and 3.7 mm
6 a 11.7 N and 12.3 N
b 11.4 N and 12.6 N
c 11.1 N and 12.9 N
7 a 5 and 9
b 3 and 11
c 1 and 13
8 E
9 C
10 a 84%
Page 10 of 17Maths Quest 12 Further Mathematics 3E TI 2.0 ED - Answers - CHAPTER 1 Univariate data
27/11/2013http://content.jacplus.com.au/faces/pages/ebookviewer.xhtml?isbn=1742464599&pk=5811f7f3de8a584...

b 2.5%
c 84%
d 97.35%
11 a 0.15%
b 2.5%
c 84%
d 83.85%
e 81.5%
12 C
13 a 336
b 10
c 380
14 a i 1360
ii 1950
iii 317
b 100
15 3
16 −2
17 −0.27
18 1.5
19 a −0.48
b 1.44
c 0.08
d −2.24
e 2.8
20 a , s = 1.76
b 1.68
21 B
22 B
23 a English 1.25, Maths 1.33
b Maths mark is better as it has a higher z-score.
24 Second test, Barbara's z-score was −0.33 compared to −0.5 in the first test.
25 a
Page 11 of 17Maths Quest 12 Further Mathematics 3E TI 2.0 ED - Answers - CHAPTER 1 Univariate data
27/11/2013http://content.jacplus.com.au/faces/pages/ebookviewer.xhtml?isbn=1742464599&pk=5811f7f3de8a584...

b z = 1.18
c 84%
d i Cage 5.15
Barn 4.35
FR 4.1
ii It could be concluded that the more space a chicken has, the fewer eggs it lays because the median is greatest for cage eggs.
Exercise 1J — Populations and simple random samples
1 b
2 Answers will vary.
3 Answers will vary.
4 Answers will vary.
Chapter review
Multiple choice
1 B
2 D
3 C
4 D
5 C
6 A
7 C
8 E
9 E
10 B
11 D
12 C
13 D
14 A
15 B
16 B
17 C
18 D
Page 12 of 17Maths Quest 12 Further Mathematics 3E TI 2.0 ED - Answers - CHAPTER 1 Univariate data
27/11/2013http://content.jacplus.com.au/faces/pages/ebookviewer.xhtml?isbn=1742464599&pk=5811f7f3de8a584...

19 C
20 B
21 D
22 C
Short answer
1 Many answers possible.
2 a
b
c
Stem plot b is probably an appropriate display. No real need for stems in fifths.
3 a
c The data are approximately symmetrical. More than half the drivers exceeded the limit. The fastest drivers were about 15 km/h over the limit. Many other conclusions are possible.
Page 13 of 17Maths Quest 12 Further Mathematics 3E TI 2.0 ED - Answers - CHAPTER 1 Univariate data
27/11/2013http://content.jacplus.com.au/faces/pages/ebookviewer.xhtml?isbn=1742464599&pk=5811f7f3de8a584...
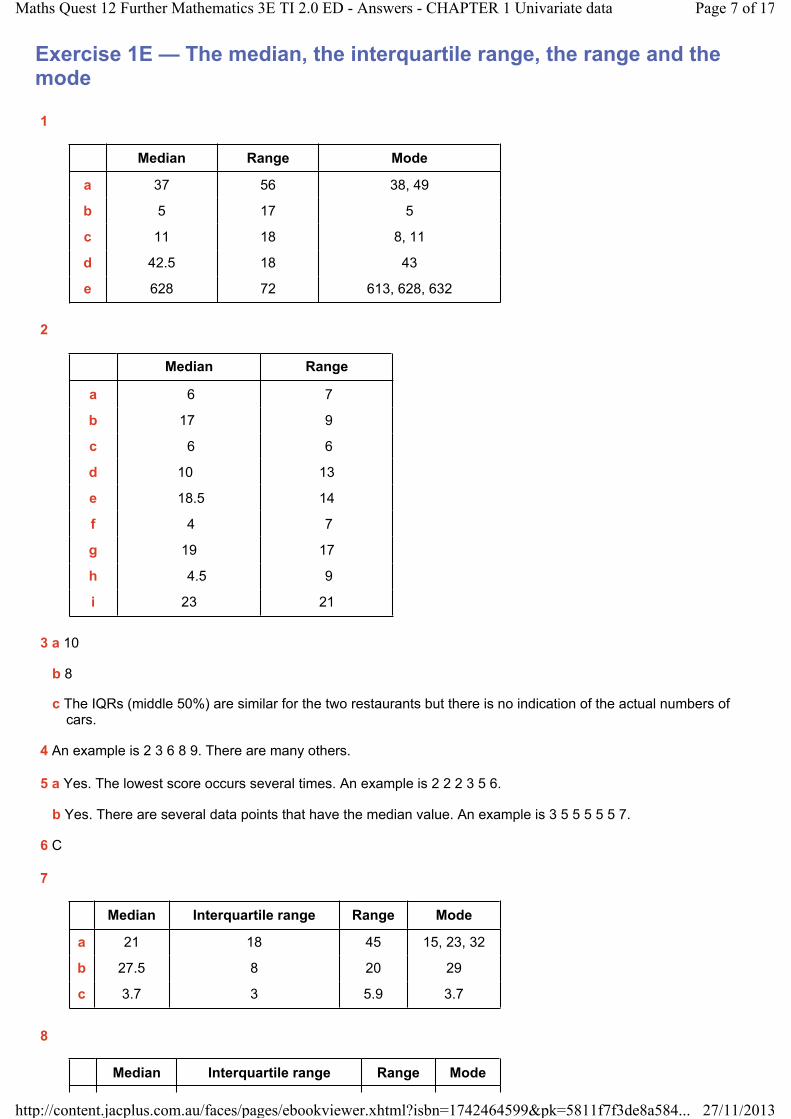
4 a Positively skewed
b There would need to be a shift of some of the amounts in the twenties to the thirties and forties.
5 Range = 24, median = 14, mode = 14, interquartile range = 9.5
6 a
b Approximately symmetric
7 60.4 years
8 0.05 mL
9 a i 10.8 and 13.2 years
ii 9.6 and 14.4 years
iii 8.4 and 15.6 years
b There is a large range of life spans for these dogs. The oldest dog is almost twice as old as the youngest.
10 Kory is the better candidate. He is in the top 17% while Ricardo is in the top 50%.
11 a Positively skewed
b i 26 years
ii 19.4%
Extended response
1 a i A stem plot is more appropriate since there are only 25 observations in each set.
The distribution of 10C is negatively skewed with no outliers.
The distribution of 10E is symmetric with no outliers.
ii
Class Median Interquartile range Range Mode
10C 15 7 15 17
Page 14 of 17Maths Quest 12 Further Mathematics 3E TI 2.0 ED - Answers - CHAPTER 1 Univariate data
27/11/2013http://content.jacplus.com.au/faces/pages/ebookviewer.xhtml?isbn=1742464599&pk=5811f7f3de8a584...

10E 13 2.5 11 14
iii
iv
Class Mean Standard deviation
10C 13.64 4.24
10E 13.2 2.35
v For 10C the median provides a better indication, whereas for 10E the mean and the median are close anyway.
vi The 68–95–99.7% rule can be applied to the distribution of 10E's data since it is approximately bell-shaped.
b We use the median of the 10C scores to give us an indication of the centre of the distribution. The median of the 10C scores is 15. For 10E, the distribution is symmetric and hence we use the mean to give us an indication of the centre of the distribution. The mean of 10E scores is 13.2. The range of the 10C scores is 15 whereas for 10E the range is 11. Also, the standard deviation for 10C is 4.24 and for 10E it is 2.35. This means that the scores in 10C are more spread out than those in 10E, which are relatively bunched. So, while in 10C there are more students with higher marks than in 10E, the range of marks in 10C is greater and this would make it a more challenging class to teach.
2 a Office workers: negatively skewed with outlier Sports instructors: positively skewed
b
Office workers Sports instructors
Median 121.5 beats/min 73 beats/min
IQR 19.5 beats/min 14 beats/min
Range 58 beats/min 46 beats/min
Mode 130 beats/min 68, 72 beats/min
c
d
Office workers Sports instructors
Page 15 of 17Maths Quest 12 Further Mathematics 3E TI 2.0 ED - Answers - CHAPTER 1 Univariate data
27/11/2013http://content.jacplus.com.au/faces/pages/ebookviewer.xhtml?isbn=1742464599&pk=5811f7f3de8a584...

s = 15.3 beats/min s = 12.4 beats/min
e Not used since the distributions are not bell-shaped.
f Office workers: Pulse rates are generally very high, clustered around 120-130 beats/min. Also, there is one person whose rate was much lower than the rest. This outlier (76) produces a large range and makes the mean slightly lower than the median. As a result the median is a more appropriate measure of the centre of the data rather than the mean.
Sports instructors: Pulse rates are generally low, clustered around 60-70 beats/min, although there are a few people with rates much higher, which makes the mean slightly higher than the median and also produces quite a large range. As a result of the skewed distribution the median is the more appropriate measure of the centre of the data rather than the mean, although there is little difference between these values.
3 a Discrete, numerical data
b
Looks to be slightly negatively skewed.
c Q2 = 16 cm
Q1 = 15 cm
Q3 = 17 cm
Lowest score = 13 cm
Highest score = 19 cm
d Symmetric
e Given the data itself, the boxplot does.
f Mean = 16 cm = median
g s = 1.75 cm, 1600
h
Negatively skewed with an outlier at the lower end
i 1600
j The river fish seem to be larger overall. Only 1600 of the coastal fish lie above 17.75 cm, whereas 1600 of the river fish lie above 19.25 cm. All the quartiles for the river fish are higher than those for the coastal ones. It would seem that the river fish have grown more than the coastal fish.
Page 16 of 17Maths Quest 12 Further Mathematics 3E TI 2.0 ED - Answers - CHAPTER 1 Univariate data
27/11/2013http://content.jacplus.com.au/faces/pages/ebookviewer.xhtml?isbn=1742464599&pk=5811f7f3de8a584...

4 a
b Somewhat symmetrical or slightly positively skewed
c Mean = 2.89 kg, s = 0.54 kg
The mean of the sample is only just less than the suggested mean, in fact it is only about 0.2 of 1 standard deviation away from it. So the suggestion is probably right.
d i 149
ii 29
iii 5
5 a 23.1
b 10.8
c i Median and IQR
ii 23.9
iii Median gives a better indication of the typical BMI as it is not affected by extreme values. The mean, however, is affected.
Page 17 of 17Maths Quest 12 Further Mathematics 3E TI 2.0 ED - Answers - CHAPTER 1 Univariate data
27/11/2013http://content.jacplus.com.au/faces/pages/ebookviewer.xhtml?isbn=1742464599&pk=5811f7f3de8a584...