CHAPTER 1 THEORITICAL INTRODUCTION Introduction to …
75
“A Study on Product Positioning of Volvo Cars” PES BBM DECEMBER 2015 – FEBRUARY 2016 Page 1 CHAPTER 1 THEORITICAL INTRODUCTION Introduction to Marketing The objective of all business enterprises is to satisfy the needs and wants of the society. Marketing is, therefore, a basic function of all business firms. When a salesperson sells washing machines, a doctor treats a patient or a Government asks people to take their children for getting polio drops, each is marketing something to the targets. Traditionally, small firm owners did not give as much importance to marketing as to other functions such as accountancy, production and selling. Training programmers, enterprise development and the current thrust for competitiveness have now given high priority to promoting marketing awareness among small business owners, and marketing is now assuming its rightful place along with the other business functions. Since early 1990’s, there has been a change in the thinking of businessmen from product orientation to consumer orientation. Modern business concerns lay emphasis on ‘selling satisfaction’ and not merely on selling products. The activities have to be coordinated so as to develop the marketing mix, which provides maximum satisfaction to the customers. That is why marketing research and product planning occupy an important role in marketing. The other important functions of marketing include: buying and assembling, selling, standardization, packing, storing, transportation, promotion, pricing and risk bearing. Thus, the scope of marketing is very wide and no more restricted to merely selling products.
Transcript of CHAPTER 1 THEORITICAL INTRODUCTION Introduction to …
“A Study on Product Positioning of Volvo Cars”
PES BBM DECEMBER 2015 – FEBRUARY 2016 Page 1
CHAPTER 1
THEORITICAL INTRODUCTION
Introduction to Marketing
The objective of all business enterprises is to satisfy the needs and wants of the society.
Marketing is, therefore, a basic function of all business firms. When a salesperson sells washing
machines, a doctor treats a patient or a Government asks people to take their children for getting
polio drops, each is marketing something to the targets.
Traditionally, small firm owners did not give as much importance to marketing as to other
functions such as accountancy, production and selling. Training programmers, enterprise
development and the current thrust for competitiveness have now given high priority to
promoting marketing awareness among small business owners, and marketing is now assuming
its rightful place along with the other business functions.
Since early 1990’s, there has been a change in the thinking of businessmen from product
orientation to consumer orientation. Modern business concerns lay emphasis on ‘selling
satisfaction’ and not merely on selling products. The activities have to be coordinated so as to
develop the marketing mix, which provides maximum satisfaction to the customers.
That is why marketing research and product planning occupy an important role in marketing.
The other important functions of marketing include: buying and assembling, selling,
standardization, packing, storing, transportation, promotion, pricing and risk bearing. Thus, the
scope of marketing is very wide and no more restricted to merely selling products.
“A Study on Product Positioning of Volvo Cars”
PES BBM DECEMBER 2015 – FEBRUARY 2016 Page 2
Marketing Meaning
Marketing may be narrowly defined as a process by which goods and services are exchanged and
the values determined in terms of money prices. That means marketing includes all those
activities carried on to transfer the goods from the manufacturer or, producers to the consumers.
We shall be learning later that marketing is more than a mere physical process of distributing
goods and services. It is the process of discovering and translating consumer wants into products
and services. It begins with the customer(by finding their needs) and ends with the customer(by
satisfying their needs).
The scope of marketing can be understood in terms of functions that an entrepreneur has to
perform. These include the following:
a) Functions of exchange: which include buying, assembling, packaging and selling.
b) Functions of physical supply: include transportation, storage and warehousing.
Functions of facilitation: Product Planning and Development, Marketing Research,
standardization, Grading, Packaging, Branding, Sales Promotion, The objective of all business
enterprises is to satisfy the needs and wants of the society. Marketing is, therefore, a basic
function of all business firms. When a salesperson sells washing machines, a doctor treats a
patient or a Government asks people to take their children for getting polio drops, each is
marketing something to the targets.
Traditionally, small firm owners did not give as much importance to marketing as to other
functions such as accountancy, production and selling. Training programmers, enterprise
development and the current thrust for competitiveness have now given high priority to
promoting marketing awareness among small business owners, and marketing is now assuming
its rightful place along with the other business functions.
“A Study on Product Positioning of Volvo Cars”
PES BBM DECEMBER 2015 – FEBRUARY 2016 Page 3
Since early 1990’s, there has been a change in the thinking of businessmen from product
orientation to consumer orientation. Modern business concerns lay emphasis on ‘selling
satisfaction’ and not merely on selling products. The activities have to be coordinated so as to
develop the marketing mix, which provides maximum satisfaction to the customers.
That is why marketing research and product planning occupy an important role in marketing.
The other important functions of marketing include: buying and assembling, selling,
standardization, packing, storing, transportation, promotion, pricing and risk bearing. Thus, the
scope of marketing is very wide and no more restricted to merely selling products.
Marketing may be narrowly defined as a process by which goods and services are exchanged and
the values determined in terms of money prices. That means marketing includes all those
activities carried on to transfer the goods from the manufacturer or, producers to the consumers.
We shall be learning later that marketing is more than a mere physical process of distributing
goods and services. It is the process of discovering and translating consumer wants into products
and services. It begins with the customer(by finding their needs) and ends with the customer(by
satisfying their needs).
The scope of marketing can be understood in terms of functions that an entrepreneur has to
perform. These include the following:
a) Functions of exchange: which include buying, assembling, packaging and selling.
b) Functions of physical supply: include transportation, storage and warehousing.
c) Functions of facilitation: Product Planning and Development, Marketing Research,
standardization, Grading, Packaging, Branding, Sales Promotion,
d) Financing.
“A Study on Product Positioning of Volvo Cars”
PES BBM DECEMBER 2015 – FEBRUARY 2016 Page 4
The Marketing Concept:
The marketing concept holds that the key to achieving organizational goals consists in
determining the needs and wants of target markets and delivering the desired satisfaction more
effectively and efficiently than competitors. Under marketing concept, the emphasis is on selling
satisfaction and not merely on selling a product. The objective of marketing is not the
maximization of profitable sales volume, but profits through the satisfaction of customers. The
consumer is the pivot point and all marketing activities operate around this central point. It is,
therefore, essential that the entrepreneurs identify the customers, establish a rapport with them,
identify their needs and deliver the goods and services that would meet their requirements.
The components of marketing concept are as under:
a) Satisfaction of Customers: In the modern era, the customer is the focus of the
organization. The organization should aim at producing those goods and services, which
will lead to satisfaction of customers.
b) Integrated marketing: The functions of productions, finance and marketing should be
integrated to satisfy the needs and expectations of customers.
c) Profitable sales volume: Marketing is successful only when it is capable of maximizing
profitable sales and achieves long-run customer satisfaction.
Importance of Marketing in Small Business:
Since marketing is consumer oriented, it has a positive impact on the business firms. It enables
the entrepreneurs to improve the quality of their goods and services. Marketing helps in
improving the standard of living of the people by offering a wide variety of goods and services
with the freedom of choice, and by treating the customer as the most important person.
Marketing generates employment both in production and in distribution areas. Since a business
firm generates revenue and earns profits by carrying out marketing functions, it will engage in
exploiting more and more economic resources of the country to earn more profits. A large scale
“A Study on Product Positioning of Volvo Cars”
PES BBM DECEMBER 2015 – FEBRUARY 2016 Page 5
business can have its own formal marketing network, media campaigns, and sales force, but a
small unit may have to depend totally on personal efforts and resources making it informal and
flexible. Marketing makes or breaks a small enterprise. An enterprise grows, stagnates, or
perishes with the success or failure, as the case may be, of marketing. “Nirma” is appropriate
example of the success of small scale enterprise.
Marketing Research:
Marketing research is the means by which the information necessary to run a business is
obtained. It helps an entrepreneur to take decisions concerning the type of product, the price
policy, the channel of distribution, and sales promotion can be made rightly with the help of
marketing information at the right time. It is the gathering, recording, and analysis of all facts
about the problems relating to the transfer and sale of goods and services from producer to
consumer. For example, a hotel should find out what all services are needed to satisfy its
customers and a toy manufacturer making toy cars need to find out if children really want a
particular type of toy cars or not and so on. Every company, irrespective of size, must research
its market, customers and competition; initially to set it on the right course and then continually
to monitor its performance. Small-scale firms are often unable to afford continous marketing
research. However, they can use personal contacts and other informal methods for collecting
required information about markets.
Market Segmentation:
A market consists of large number of individual customers who differ in terms of their needs,
preferences and buying capacity. Therefore, it becomes necessary to divide the total market into
different segments or homogenous customer groups. Such division is called market
segmentation. They may have uniformity in employment patterns, educational qualifications,
economic status, preferences, etc.
Market segmentation enables the entrepreneur to match his marketing efforts to the requirements
of the target market. Instead of wasting his efforts in trying to sell to all types of customers, a
small scale unit can focus its efforts on the segment most appropriate to its market.
“A Study on Product Positioning of Volvo Cars”
PES BBM DECEMBER 2015 – FEBRUARY 2016 Page 6
A market can be segmented on the basis of the following variables:
1. Geographic Segmentation: The characteristics of customers often differ across nations,
states, regions, cities or neighborhoods. The entrepreneur can decide to operate in one or
a few or all the geographic areas, but pay attention to differences in geographic needs and
preferences.
2. Demographic Segmentation: Variables such as age, sex, family size, income, occupation,
education, religion, race and nationality are widely used for market segmentation.
3. Psychological variables: Personality, life style, social class, etc., can also be used for
market segmentation. For example, some products like pens, watches, cosmetic send
briefcases are designed differently for common men and status seekers.
4. Behavioral Segmentation: Buyers are divided into groups on the basis of their
knowledge, attitude, use or response to a product.
Marketing Mix:
In order to cater to the requirements of identified market segment, an entrepreneur has to
develop an appropriate marketing mix. Marketing mix is a systematic and balanced
combination of the four inputs which constitute the core of a company’s marketing system –
the product, the price structure, the promotional activities and the place or distribution
system”. These are popularly known as “Four P’s” of marketing an appropriate combination
of these four variables will help to influence demand. The problem facing small firms is that
they sometimes do not feel themselves capable of controlling each of the four variables in
order to influence the demand.
A brief description of the four elements of marketing mix is a s follows:
1. Product: The first element of marketing mix is product. A product is anything that can be
offered to a market for attention, acquisition, use, or consumption that might satisfy a
want or need. Products include physical objects, services, events, persons, places, ideas or
mixes of these. This element involves decisions concerning product line, quality, design,
brand name, label, after sales services, warranties, product range, etc. Inappropriate
combination of features and benefits by the small firm will provide the product with
“A Study on Product Positioning of Volvo Cars”
PES BBM DECEMBER 2015 – FEBRUARY 2016 Page 7
USP(unique selling proposition). This will enhance the customer loyalty in favor of its
products. Consumer products are bought for final consumption; whereas Industrial
products are bought by individuals and organizations for further processing or for use in
conducting business.
2. Price: The second element is the price, which affects the volume of sales. It is one of the
most difficult tasks of the marketing manager to fix the right price. The variables that
significantly influence the price of a product is – demand of the product, cost,
competition and government regulation. The product mix includes – determination of unit
price of thr product, pricing policies and strategies, discounts and level of margins, credit
policy, terms of delivery, payment, etc. Pricing decisions have direct influence on the
sales volume and profits of the firm. Price, therefore, is an important element of the
marketing mix. Right price can be determined through pricing research and by adopting
test-marketing techniques. Small firms should think of pricing as a method whereby
prices are set with regard to costs, profit targets, competition and the perceived value of
products. Because of their simplicity, cost-plus-pricing are attractive to small businesses,
though this is not the only mode of pricing utilized by small firms. For example, the
profit margin in the cost-plus approach may well be fixed after examining both the nature
of the market and the competitor activity within it. It is a mistake for small firms to rely
wholly on cost-plus, but very often small firms do that to the detriment of profits and
market share.
3. Promotion: Promotion is an important part of the marketing mix of a business enterprise.
The purpose of promotion is to inform, persuade and influence the prospective customers.
Advertising, salesmanship, sales promotion and publicity are often used to inform the
people about the availability of products and create among them the desire to buy the
products. No business enterprise can market its products unless it undertakes promotional
activities effectively. The prospective customers have to be informed about the product,
its features, utility and availability. The need for promotional activities has increased
because of stiff competition, widening of market, rapid changes in technology and tastes
of customers.
4. Place: This is another key marketing mix tool, which stands for the various activities the
company undertakes to make the product available to target customers. Place mix or
“A Study on Product Positioning of Volvo Cars”
PES BBM DECEMBER 2015 – FEBRUARY 2016 Page 8
delivery mix is the physical distribution of products at the right time and at the right
place. It refers to finding out the best means of selling, sources of selling(wholesaler,
retailers, and agents), inventory control, storage facility, location, warehousing,
transportation, etc. This includes decisions about the channels of distribution, which
make the product available to target customers at the right time, at the right place and at
the right price. By selecting wrong distribution channels or by using the ones it has
traditionally used, small firm could be depriving it of new market opportunities. In a
situation where a small firm has only one primary product, the general rise and fall of
sales will lead to a rise and fall of the firm, unless the firm learns to consistently adjust its
marketing mix to match consumer demand.
Product Positioning
Product positioning involves tailoring an entire marketing program- including product
attributes, image, and price, as well as packaging, distribution, and service – to best meet
the needs of consumers within a particular market segment. In this way, product
positioning is part of the overall process of market segmentation, but involves a
narrowing of focus. “Segmentation analysis tells us how the market is defined and allows
us to target one or more opportunities,” Glen L.Urban and Steven.H.Star wrote in their
book Advanced Marketing Strategy, “Product positioning takes place within a target
market segment and tells us how we can compete most effectively in that market
segment.”
The key to product positioning understands the dimensions consumers use to evaluate
competing marketing programs and make purchase decisions. It may be helpful for small
business managers to create a graph in order to map consumer perceptions along several
different dimensions. Once consumer perceptions are understood, the next step is to
select the best positioning for the product and take steps to align the marketing program
behind this positioning choice. Some examples of possible positioning choices include
quality, reliability, and unique features or benefits. Before delving into product
positioning further, it may be helpful to understand the process and goals of market
segmentation.
“A Study on Product Positioning of Volvo Cars”
PES BBM DECEMBER 2015 – FEBRUARY 2016 Page 9
Suppose a company has researched and selected its target market. If it is the only
company serving the target market, it will have no problem in selling the product at a
price that will yield reasonable profit. However, if several firms pursue this target market
and their products are undifferentiated, most buyers will buy from the lowest priced
brand. Either, all the firms will have to lower their price or the only alternative is to
differentiate its product or service from that of the competitors, thereby securing a
competitive advantage and better price and profit. The company must carefully select the
ways in which it will distinguish itself from competitors.
Suppose a scooter manufacturer, say Bajaj, gets worried that scooter buyers see most
scooter brands as similar and, therefore, choose their brand mainly on the basis of price.
Realizing this, Bajaj may decide to differentiate their scooters physical characteristics.
“Differentiation is the act of designing a set of meaningful differences to distinguish the
company’s offer from competitors’ offers. May be Bajaj claims its scooters to be
different from others because of its highest fuel efficiency and economy. LML claims
maximum durability and added physical features, whereas Vijay Super may have claimed
higher mileage. Thus, all scooters appeal differently to different buyers. Not all buyers
will notice or be interested in all the ways one brand differs from another. Such firm will
want to promote those few differences that will appeal most strongly to its target market.
Positioning is the act of designing the company’s offer so that it occupies distinct and a
valued position in the target customer’s minds. Positioning calls for the company to
decide how many differences and which differences to promote to the target customers.
How many differences to promote: Many marketers advocate aggressively promoting
only one benefit to the target market.e.g.: Rosser Reeves said a company should develop
a unique selling proposition (USP) for each brand and stick to it. Thus, Godrej
refrigerators claim, automatic defrost, while Rim claims to have dirt-blasters. Each brand
should pick an attribute and claim itself to be “number one” on it. What are some of the
“number one” positions to promote? The major ones are “best quality”, “best service”,
“best value”, “most advanced technology” etc. If a company hammers at any one of these
“A Study on Product Positioning of Volvo Cars”
PES BBM DECEMBER 2015 – FEBRUARY 2016 Page 10
positioning points and delivers it properly, it will probably be best know and are called
for this strength.
Besides single benefit positioning, the company can try for double benefit
positioning- e.g.: Forman’s toothpaste claims that it cleans teeth and protects the enamel.
There are even cases of successful triple benefit positioning. e.g.: Videocon washing
machines claims that the machine “washes, rinses an even dries the clothes.” Many
people want all three benefits, and the challenge is to continue them that the brand
delivers all three.
What differences to promote: A company should promote its major strengths provided
that the target market values these strengths. The company should also recognize that
differentiation is a continuous process. It would seem that the company should go after
cost or service to improve its market appeal relative to competitors. However, many other
considerations arise.
1.How important are improvements in each of these attributes to the target customers?
2.Can the company afford to make the improvements, and how fast can it complete them?
3.Would the competitors also be able to improve service if the company started to do so,
and in that case, how would the company react?
This type of reasoning can help the company choose or add genuine competitive
advantages.
Communicating the Company’s positioning: The company must not only develop a clear
positioning strategy, it must also communicate ineffectively. Suppose a company chooses
the “best in quality” positioning strategy. It must then make sure that it can communicate
this claim convincingly. Quality is communicated by choosing those physical signs and
cute that people normally use to judge quality. Quality is often communicated through
other marketing elements.
A high price usually signals a premium-quality product to buyers. The product’s quality
image is also affected by the packaging, distribution advertising and promotion. The
manufacturer’s reputation also contributes to the perception of quality. To make a quality
“A Study on Product Positioning of Volvo Cars”
PES BBM DECEMBER 2015 – FEBRUARY 2016 Page 11
claim credible, the surest way is to offer “satisfaction or your money back”. Smart
companies try to communicate their quality to buyers and guarantee that this quality will
be delivered or their money will be refunded.
Market Segmentation
Market segmentation is the science of dividing an overall market into key customer
subsets, or segments, whose members share similar characteristics and needs. Because it
involves significant market research, market segmentation can be costly. But it is
particularly important for small businesses, which often lack the resources to target large
aggregate markets or to maintain a wide range of differentiated products for varied
markets. Market segmentation allows a small business to develop a product and a
marketing mix that fit a relatively homogenous part of the total market. By focusing its
resources on a specific customer base in this way, a small business may be able to carve
out a market niche that it can serve well than its larger competitors.
In general, customers are willing to pay a premium for a product that meets their needs
more specifically than does a competing product. Thus marketers who successfully
segment the overall market and adapt their products to the needs of one or more smaller
segments stand to gain in terms of increased profit margins and reduced competitive
pressures. But the potential gains offered by market segmentation must be measured
against the costs, which-in addition to the market research required to segment a market-
may include increased production and marketing expenses.
In their book-“The Portable MBA in Marketing”, Alexander Hiram and Charles D.
Scheme identified six steps that companies should take in the market segmentation
process. The first step is to determine the boundaries of the market. In completing this
step, a marketer should use a formal business plan to develop a broad definition of their
business, and then consider the offerings of both direct and indirect competitors to gain
information about the basic needs of consumers in the market. The second step in the
process is to decide which variables to use in segmenting the market. Many companies
fall into the trap of collecting data on as many variables as possible and then attempting
to sort through it later to draw meaningful conclusions. Instead, Hiram and Scheme
“A Study on Product Positioning of Volvo Cars”
PES BBM DECEMBER 2015 – FEBRUARY 2016 Page 12
recommend that marketers use their knowledge of the market to select a few relevant
variables in advance. This approach is generally less expensive and will likely provide
more useful results.
The third step in the market segmentation process is actually collecting and analyzing
data, which involves applying market research tools. The goal in analyzing the data is to
identify market segments that are internally homogenous, yet are distinctly heterogeneous
with respect to other segments. The fourth step is to develop a detailed profile of each
market segment, which involves selecting those variables that are most closely related to
consumers’ actual buying behavior.
The fifth step in the market segmentation process is to decide which segment or segments
to serve. In targeting a particular segment, a marketer should look for opportunities i.e.
customers with unsatisfied wants and needs) that provide a good match for the
organization and its resources. It is important that the marketer consider not only the size
and potential profitability of a market segment, but also whether the company’s skills,
technologies, and objectives would enable it to meet the needs of that segment better than
its competitors.
Understanding Consumer Perceptions
Product positioning-which is the sixth and final step in the market segmentation process-
involves developing a product and marketing plan that will appeal to the selected market
segment. In order to position a product effectively, a small business must identify the
attributes that are most important to consumers in the segment, and then develop an
overall marketing strategy that will attract consumers’ attention. Positioning can be
usefully applied during the earliest stages of product design, when a company first
identifies who its target customer will be in terms of demographic, geographic, and
behavioral characteristics.
A number of tools exist to help marketers understand the consumer perceptions that
underlie purchase decisions. One such tool, a perceptual map, is a graph that can portray
various product positioning options in a visual manner. Marketers can create perceptual
“A Study on Product Positioning of Volvo Cars”
PES BBM DECEMBER 2015 – FEBRUARY 2016 Page 13
maps from market research data in order to identify consumer needs that are not being
fulfilled. For example, say that consumers were asked to rate home computers on the
following attributes:
1) Ease of use,
2) Availability of service,
3) Processing speed,
4) Data storage capacity,
These four attributes could be combined into two perceptual dimensions:
1) Utility (considering of ease of use and availability of service), which would appeal to
non-experts who needed a basic computer for business or personal use.
2) Technical (consisting of processing speed and storage capacity), which would appeal
to experimental computer users who wanted the latest in technology.
Then each brand of home computer could be represented on the graph
according to consumers’ perceptions of the product. If most computer manufacturers
touted their products’ technical attributes, there might be an opportunity for a new market
entrant who emphasized ease of use and service.
However, it is also important to understand the relative importance that consumers place
upon the different dimensions. In the home computer market, for example, consumers
ultimately want both utility and technical characteristics, but vary in the importance they
place upon each product dimension. “The implications of these importance’s for
positioning are significant,” according to Urban and Star.” It is necessary to understand
preference differences within the targeted market segments because they are important in
selecting a position for a brand and in determining the competitive structure within the
segment. When preferences vary within a segment, positions and physical product
features may vary considerably. If preferences are relatively homogenous within a
segment, the positions of competing brands will be relatively similar, and the quantity of
advertising and promotion will be the critical competitive weapons.”
“A Study on Product Positioning of Volvo Cars”
PES BBM DECEMBER 2015 – FEBRUARY 2016 Page 14
It is also important to note that price is not represented in the home computer perceptual
map, whereas price definitely has an effect on the final purchase decision made by
consumers. Marketers can reflect the importance of price by adding a dimension to the
perceptual map, so that it becomes a cube, or by dividing the dimensional coordinates of
each brand by its average price. The resulting map would show “utility per dollar” and
“technical attributes per dollar,” or the tradeoffs consumers make between the original
dimensions and price. Finally, small business owners need to consider the fact that
perceptual maps show “overall dimensions of evaluation and not detailed features,” as
Urban and Star noted. “Feature selection is critical in positioning, however, because
features are an important determinant of overall perception and choice.” In fact, product
features influence both consumer perceptions and product pricing.
Positioning Options
Once marketers have mapped consumer perceptions of competing brands and gained an
understanding of the target market segment, the next step is to select a position for their products.
In positioning a product within a market segment, marketers should try to maximize the share of
consumer choices attained by their product in order to achieve long-run profitability for the firm.
Strategies that can help marketers to maximize share include adding features desired by
consumers or advertising to improve consumer perceptions. Both of these strategies can be
costly, however, so it is important for companies to balance the cost of making such expenditures
with the payoff.
Marketers have several different positioning options available to them. One positioning option is
quality emphasis, which includes not only defect-free production but also product design and
customer service that meets or exceeds customer expectations. Another positioning option
available to marketers involves offering unique features or benefits that consumers are unable to
find in competing products, from environmentally-friendly production aspects to trendiness.
Ideally, such features and benefits grow out of the company’s unique sources of competitive
advantage in the marketplace. This makes it difficult for competitors to match the features and
benefits without incurring high costs. “If we develop a unique competitive advantage on a
“A Study on Product Positioning of Volvo Cars”
PES BBM DECEMBER 2015 – FEBRUARY 2016 Page 15
dimension of importance to a significant portion of the market, we can enjoy a substantial share
and high margins,” Urban and Star noted. Of course, continued market research and innovation
are necessary to maintain such a competitive advantage.
In some cases, rather than selecting a product positon within the accepted structure of a market
segment, a company may instead try to create a new dimension of importance to consumers. But
creating a new dimension is difficult and usually results from major product innovations.
Another option available to marketers is to postion products across different, yet overlapping,
market segments. It is important to note, however, that since some consumers may belong to
both segments, positioning claims for a product should never conflict. To avoid confusing
consumers, it may be necessary to use a different brand name for the product in each segment, or
to make a broad appeal to both segments and then change the positioning slightly with each
segment.
“A Study on Product Positioning of Volvo Cars”
PES BBM DECEMBER 2015 – FEBRUARY 2016 Page 16
TITLE: “A STUDY ON PRODUCT POSITIONING OF VOLVO CARS”
INTRODUCTION:
Volvo Car Corporation, or Volvo Personvagnar AB, is a Swedish premium automobile
manufacturer established in 1927 in Gothenburg, Sweden which is also currently its headquarters
where it operated out of the VAK building. It is a wholly owned subsidiary of Zhejiang Geely
Holding Group of China.
Volvo Cars manufactures and markets sport utility vehicles, station wagons, sedans, compact
executive sedans, and coupes. With approximately 2,300 local dealers from around 100 national
sales companies worldwide, Volvo Cars' largest markets are the United States, Sweden, China
and Belgium. In 2011, Volvo Cars sold 449,255 cars globally, an increase of 20.3% compared to
2010.
A positioning statement is not only something to be published but acts as a guide to crystallize a
company’s unique place in the market and ultimately, a document to refer its present and future
growth opportunities in the industry. Product positioning helps a company to know their position
in the current market and helps them to understand the customers mind-set. Based on the review
received from the customers, a company will be able to bring changes in their products if
required so as to keep their sales growing.
SCOPE OF THE STUDY:
To know where the company or brand stands in the minds of the customer.
To know how to position the product in the market
To receive the feedback and try to implement the customers decision.
“A Study on Product Positioning of Volvo Cars”
PES BBM DECEMBER 2015 – FEBRUARY 2016 Page 17
OBJECTIVES:
To study the mind-set of the customers
To know the perception about the product in the customers mind.
To see whether the product launched is reached to every customers mind.
RESEARCH METHODOLOGY:
1. INTERVIEW METHOD.
The Interview method of collecting data involves presentation of oral-verbal stimuli and reply in
terms of oral-verbal responses. This method can be used through personal interview and if
possible telephone interview.
Sample:
A part of population, which is selected for obtaining necessary information. Sampling is the
process of obtaining information about an entire population by examining only a part of it and
hence the sampling procedure used in this study, is random sampling.
Therefore the survey will be conducted in different parts of Bangalore on random basis i.e.
questionnaire were given to customers randomly.
Sample Size:
100 respondents is the sampling size that is planned upon. Based on the responses, a conclusion
can be achieved.
Method of Sampling:
a) Simple random sampling :
“A Study on Product Positioning of Volvo Cars”
PES BBM DECEMBER 2015 – FEBRUARY 2016 Page 18
In simple random sampling, each unit of population has an equal chance to be selected as sample.
Random sampling is the process of selecting a sample in such a way that all individual in the
defined population have an equal and independent chance of being selected for the sample. Here
the selection of one unit in no way affects to the selection of any other unit. This procedure is the
best method of obtaining a representative sample. Random sampling is very much necessary for
inferential statistics. Because in most of the inferential statistics the prime assumption is the
randomness of data. The inferential statistics permits the researcher to make inferences about the
population on the basis of data obtained from the sample.
Sources of Data Collection:
Primary Data:
Primary data are first-hand information. It is the main source of data for the project. For collection
of data, questionnaires are prepared which is the most common instrument to collect primary data.
After questionnaires prepared, it is circulated to few selected number of customers, direct contact
methods are applied to get the information through questionnaires.
Secondary Data:
Secondary data are second hand or published information data that were collected for another
purpose and already exist somewhere. Secondary data provides a starting point for research and
offer the advantages of low cost and ready availability secondary data will be collected to acquire
more information, which will be helpful in solving the problems. In this project work, secondary
data are collected through company brochures and other publications. Internet also plays a vital
role in collecting the secondary data.
“A Study on Product Positioning of Volvo Cars”
PES BBM DECEMBER 2015 – FEBRUARY 2016 Page 19
TOOLS FOR DATA COLLECTION:
Questionnaire:
This method of data collection is quite popular, particularly in case of big enquiries. Private
individual research workers, private and public, are adopting it. A questionnaire consists of a
number of questions printed or typed in a definite order on a firm or set of firms. The questionnaire
is given to respondents who are expected to read and understand the questions. The respondents
have to answer the questions on their own. A diagnostic questionnaire will be used to elicit
information from the customer about their opinions of Volvo cars. Information like Sales
strategies, product positioning, demand, price, quality, future sales etc will be determined through
this questionnaire.
PLAN OF ANALYSIS:
The collected data is to be transformed graphically and systematically analyzed for reliable results.
Use of Pie Chart, Line Graph etc. will help in clearly understanding the data and categorizing the
information.
LIMITATIONS OF STUDY:
The study planned to be conducted in Bangalore cannot generalize in the whole state of
Karnataka as Volvo cars have sufficient hold on the city only.
Due to a specific time span, the study has been limited from closing satisfactory number of
questionnaire and information.
Some of the respondents would not be aware of the latest products, which made the
questionnaire uncompleted.
Most of the respondents would be interested in the small segment of Volvo cars, which might
condense the study.
“A Study on Product Positioning of Volvo Cars”
PES BBM DECEMBER 2015 – FEBRUARY 2016 Page 20
Overall Scheme
Chapter 1:
It deals with the study of introduction to marketing, meaning of marketing, concept of marketing,
marketing segmentation, market research, marketing mix and product life cycle. Brief explanation
about the promotional strategies, promotional mix and factors influencing promotional strategy.
Chapter 2:
This chapter deals with the Title of Study, Statement of problem, Scope of study, objective of
study, Research methodology, Methods of sample, Source of data collection, Tools of collection of
data and limitation of study.
Chapter 3:
This chapter deals with the company which includes about the company, history, list of companies,
list of categories, mission and value of the company.
Chapter 4:
It deals with the analysis and interpretation part of the project which includes tables and graphs.
Chapter 5:
This chapter gives you a detailed explanation about the findings, suggestions and conclusion.
“A Study on Product Positioning of Volvo Cars”
PES BBM DECEMBER 2015 – FEBRUARY 2016 Page 21
CHAPTER 3:
COMPANY PROFILE
About the Company:
The Volvo Group (Swedish: Volvokoncernen; legally Aktiebolaget Volvo, usually shortened
to AB Volvo) is a Swedish multinational manufacturing company headquartered in Gothenburg.
While its core activity is the production, distribution and sale of trucks, buses and construction
equipment, Volvo also supplies marine and industrial drive systems and financial services.
Although the two firms are still often conflated, Volvo Cars, also based in Gothenburg, has been
a totally separate company since it was sold off in 1999. The companies still share the Volvo
logo and co-operate in running the Volvo Museum.
Volvo was established in 1915 as a subsidiary of SKF, the ball bearing manufacturer; however
the Volvo Group and Volvo Cars consider themselves to have been officially founded on 14
April 1927, when the first car, the Volvo ÖV 4 series, affectionately known as "Jakob", rolled
out of the factory in Hisingen, Gothenburg.
Volvo means "I roll" in Latin, conjugated from "volvere", in reference to ball bearings. The brand
name Volvo was originally registered as a trademark in May 1911 with the intention to be used
for a new series of SKF ball bearings. This idea was only used for a short period and SKF
decided to simply use "SKF" as the trademark for all its bearing products.
In 1924, Assar Gabrielsson, an SKF sales manager, and engineer Gustav Larson, the two
founders, decided to start construction of a Swedish car. Their vision was to build cars that could
withstand the rigors of the country's rough roads and cold temperatures.
The company AB Volvo had no activities until 10 August 1926. After one year of preparations
involving the production of ten prototypes the firm was ready to commence the car-
manufacturing business within the SKF group. AB Volvo was introduced at the Stockholm stock
exchange in 1935 and SKF then decided to sell its shares in the company. Volvo was delisted
from NASDAQ in June 2007, but remains listed on the Stockholm exchange.
“A Study on Product Positioning of Volvo Cars”
PES BBM DECEMBER 2015 – FEBRUARY 2016 Page 22
In 1999, Volvo Group decided to sell its automobile manufacturing business and concentrate on
commercial vehicles. Ford saw advantages in acquiring a profitable prestige mid-size European
automobile manufacturer, well renowned for its safety aspects, as an addition to its Premier
Automotive Group. The buyout of Volvo Cars was announced on 28 January 1999, and in the
following year the acquisition was completed at a price of $6.45 billion USD. As a result of
the divestiture, the Volvo trademark is now utilized by two separate companies:
Volvo Group – a manufacturer of commercial vehicles, etc. owned by Swedish interests.
Volvo Car Corporation or Volvo Cars – a manufacturer of automobiles owned by Zhejiang
Geely Holding Group and formerly owned by Ford Motor Company.
When the global economic crisis of 2008 threatened the US automakers, Swedish authorities
became concerned about the fate of Volvo if Ford would file for bankruptcy. These concerns
mounted after repeated mass-layoffs at Volvo. Ford announced in December 2008 that it was
considering selling Volvo Cars. Initially, a sale price of US$6 billion was reported, Ford reported
it was also looking into the possibility of spinning off Volvo as an independent company. The
Swedish government was asked to look into a possible state ownership of Volvo, or a financial
bailout for Volvo Cars and SAAB of GM. Former parent AB Volvo agreed to help Volvo cut
costs through partnerships, and suggested taking part in a shared ownership of Volvo Cars
amongst a larger consortium. Other rumored candidates to purchase Volvo Cars included BMW
AG of Germany, Investor AB of Sweden, Chinese investors, or Russian investors.
Although it was rumoured that Volkswagen would buy Volvo Cars, and despite initial denials,
Chinese company Geely Holding Group was ultimately selected to take over the Swedish
automaker. Geely Group Holdings Co. allegedly bid about US$-1.5 billion to take over Volvo,
with Goldman Sachs investing HK$2.59 billion (334 million USD) in the holding company.
History
The Volvo Group has its origin in 1927, when the first Volvo car rolled off the production line at
the factory in Gothenburg. Only 280 cars were built that year. The first truck, the "Series 1",
debuted in January 1928, as an immediate success and attracted attention outside the country. In
1930, Volvo sold 639 cars, and the export of trucks to Europe started soon after; the cars did not
become well-known outside Sweden until after World War II.
“A Study on Product Positioning of Volvo Cars”
PES BBM DECEMBER 2015 – FEBRUARY 2016 Page 23
Pentaverken, who had manufactured engines for Volvo, was acquired in 1935, providing a secure
supply of engines and entry into the marine engine market.
The first bus, named B1, was launched in 1934, and aircraft engines were added to the growing
range of products at the beginning of the 1940s. In 1963, Volvo opened the Volvo Halifax
Assembly plant, the first assembly plant in the company's history outside of Sweden in Halifax,
Canada. In 1999, the European Union blocked a merger with Scania AB.
Volvo Group sold its car division Volvo Car Corporation to Ford Motor Company for $6.45
billion during 2000; it was placed within the Premier Automotive Group alongside Jaguar, Land
Rover and Aston Martin. Volvo engineering resources and components would be used in various
Ford, Land Rover and Aston Martin products, with the second generation Land Rover
Freelander designed on the same platform as the second generation Volvo S80. The Volvo T5
petrol engine was used in the Ford Focus ST and RS performance models, and Volvo's satellite
navigation system was used on certain Aston Martin Vanquish, DB9 and V8 Vantage models.
Ford sold the Volvo Car Corporation in 2010 to Geely Automobile of China for $1.8 billion,
following on from their sale of Jaguar Land Rover in 2008 and Aston Martin in 2007.
Renault Véhicules Industriels (which included Mack Trucks, but not Renault's stake in Irisbus)
was sold to Volvo during January 2001, Volvo renamed it Renault Trucks in
2002. Renault became AB Volvo's biggest shareholder with a 19.9% stake (in shares and voting
rights) as part of the deal. Renault increased its shareholding to 21.7% by 2010.
AB Volvo acquired 13% of the shares in the Japanese truck manufacturer UD Trucks (the former
Nissan Diesel) from Nissan Motor Co Ltd (part of the Renault-Nissan Alliance) during 2006
becoming a major shareholder. Volvo Group took complete ownership of Nissan Diesel in 2007
to extend its presence in the Asian Pacific market.
Renault sold 14.9% of their stake in AB Volvo in October 2010 (comprising 14.9% of the share
capital and 3.8% of the voting rights) for €3.02bn. This share sale left Renault with around
17.5% of Volvo's voting rights. Renault sold their remaining shares in December 2012
(comprising 6.5% of the share capital and 17.2% of the voting rights at the time of transaction)
for €1.6bn, leaving Swedish industrial investment group Aktiebolaget Industrivärden as the
largest shareholder, with 6.2% of the share capital and 18.7% of the voting rights.
“A Study on Product Positioning of Volvo Cars”
PES BBM DECEMBER 2015 – FEBRUARY 2016 Page 24
Members:
1. OlofPersson
AB VOLVO, CEO
2. Nick Connor
AB VOLVO, MD
3. Muralidharan Angadu
AB VOLVO, PRESIDENT (INDIA)
Brands:
Volvo Trucks
Volvo Buses
Volvo Construction Equipment
Volvo Finance Service
Renault Trucks
UD Trucks
Prevost
Mack Trucks
Eicher (50:50 joint venture with Eicher Motors, India)
Volvo Penta
Nova Bus
SDLG (Shandong Lingong, China)
“A Study on Product Positioning of Volvo Cars”
PES BBM DECEMBER 2015 – FEBRUARY 2016 Page 25
Volvo Rents
Cars List:
S80
S60
V40(cross country)
XC60
XC90
Vision: To be a world class provider of treasury services, valued as the natural and integrated
business partner to the Volvo Group of Companies.
Mission:
Create shareholder value by optimizing the cost of capital in the Volvo Group.
Limit the impact, but also take advantage, of macroeconomic development.
Provide the Volvo Group of Companies with treasury and each management related services.
“A Study on Product Positioning of Volvo Cars”
PES BBM DECEMBER 2015 – FEBRUARY 2016 Page 26
SWOT Analysis:
Strength:
Efficient and world class safety standards.
A high inclination towards maintaining quality of driving experience.
Offers variants of car models to suit the customer preferences.
Attracts elite class with its elegant as well as classic style.
Volvo has over 100,000 employees globally.
Volvo subsidiaries include brands like Mack Trucks, Renault Trucks, UD Trucks, Volvo
Construction, Equipment, Volvo Buses, Volvo Trucks.
Weakness:
Limited penetration middle income segment due to high price especially in the emerging
economies.
Unable to create a huge market share in high priced cars due to presence of global automobile
giants.
Opportunities:
Expanding Automobile market.
Acquiring more market share in integrating with current entities involved in automobile
business.
The increasing per capita income and purchasing power.
Threats:
“A Study on Product Positioning of Volvo Cars”
PES BBM DECEMBER 2015 – FEBRUARY 2016 Page 27
Dominance of big international automobile companies.
Improved and innovative features included by competitors.
Increasing usage of government transport and high fuel costs.
STP Analysis:
Segment:
Sedan, SUV Segment.
Target Groups:
High end young business executives preferring luxurious and safe cars.
Positioning:
Positioned as the safest cars to drive by adding innovative safety features.
Competitors:
While there is globalization taking place there is no chance of any firm or business or
establishment run in monopoly terms. The competitors come into play as soon as you implement
any new ideas, thoughts, goods or services.
Here are some of the competitors of AB Volvo:
BMW
Mercedes-Benz
Audi
Volkswagen
Jaguar

“A Study on Product Positioning of Volvo Cars”
PES BBM DECEMBER 2015 – FEBRUARY 2016 Page 28
Volvo doesn’t compete with Ferrari, Lamborghini, Porsche because Volvo doesn’t manufacture
sports car, where in they only manufacture business class cars.
The competitors increased when they established their outlets in India with other domestic and
international car manufacturers.
Awards & Achievements:
IIHS Top Safety Pick+
Vincentric’s 2012 Best Value in America
NHTSA 5-Star Safety Rating
NEMPA 2011 New England Winter Vehicles Award
VIncentric’s 2012 Best Value in America
An Edmunds.com Consumers’ Favorites: Best Family Vehicle (September 2012)
Best Luxury SUV, NWAPA
The Center for Auto Safety
IntelliChoice 2011 Best Overall Value Premium Luxury Crossover/Wagon Class
USAA Preferred Best Value Midsize Luxury Sedan
International Car of the Year(ICOTY)
World’s 10 Best Interiors Award
World’s 10 Best Engines
IIHS Top Safety Pick: Large Cars
“A Study on Product Positioning of Volvo Cars”
PES BBM DECEMBER 2015 – FEBRUARY 2016 Page 29
Milestones:
1944 – safety cage
1944 – laminated windscreen
1957 – anchor points for two-point safety belts, front
1958 – anchor points for two-point safety belts, rear
1959 – three-point safety belt, standard in front seats
1964 – rearward-facing child safety seat, first prototype tested
1966 – crumple zones front and rear
1966 – safety door-locks
1969 – inertia-reel safety belts
1971 – reminder safety belt
1972 – three-point safety belt, outer rear seats
1972 – rearward-facing child safety seat
1974 – multistage impact absorbing steering column
1974 – bulb integrity sensor
1975 – braking system with stepped bore master cylinder
1978 – child safety booster cushion
1982 – "anti-submarining" protection
1986 – three-point safety belt in centre rear seat (740/760)
1990 – integrated child safety cushion in centre rear seat (940/960)
1991 – Side Impact Protection System (850 and 940/960)
1991 – automatic height adjusting safety belt
1992 – reinforced rear seats, estate models
1995 – front side airbags (seat-mounted) for torso (850), integrated child safety cushion,
outer rear seats
1997 – Roll Over Protection System (C70)
1998 – Whiplash Protection System (S80)
1998 – roof-mounted inflatable curtain side airbags (S80)
2001 – SCC : Volvo Safety Concept Car
“A Study on Product Positioning of Volvo Cars”
PES BBM DECEMBER 2015 – FEBRUARY 2016 Page 30
2002 – Roll Stability Control (XC90)
2003 – Volvo Intelligent Vehicle Architecture, new front structure (S40, V50)
2003 – rear seat belt reminders (S40, V50)
2003 – Intelligent Driver Information System, a system that selectively blocks information to
the driver in complex traffic situations and lets the information through once the situation has
calmed down (S40, V50)
2003 – Volvo's Traffic Accident Research Team, inaugurated in Bangkok
2004 – Blind Spot Information System, informs the driver of vehicles in the blind spots,
using a yellow LED in the A-pillars (S40, V50)
2005 – door-mounted inflatable curtain airbags (C70)
2006 – Personal Car Communicator (S80)
2006 – Collision Warning Brake Support, a system that warns the driver and gives brake
support when a collision with another vehicle in front of the car is imminent (S80)
2006 – Electrical Parking Brake (S80)
2007 – Driver Alert Control, a driver drowsiness detection system that alerts the driver when
the system detects that they are becoming tired (S80, V70, XC70)
2007 – Lane Departure Warning, a system that warns the driver for unintended lane
departures (S80, V70, XC70)
2007 – Collision Warning with Auto Brake, a system that automatically brakes the car when
a collision with another vehicle in front of the car is imminent (S80, V70, XC70)
2007 – Distance Alert, a system that helps the driver keeping a safe distance to the vehicle
ahead, by continuously measuring the distance and lighting up the vehicle's head up display
if the time gap becomes shorter than what the driver has specified (S80, V70, XC70)
2007 – Alcoguard, a hand-held device that the driver blows into before they can start the car,
mainly aimed for the company-car sector, taxi operators, state authorities and municipalities
(S80, V70, XC70)
2008 – City Safety, a system that automatically brakes the car at speeds below 30 km/h
(19 mph) if an obstruction is detected in front of the car (new XC60)
“A Study on Product Positioning of Volvo Cars”
PES BBM DECEMBER 2015 – FEBRUARY 2016 Page 31
2010 – Pedestrian Detection with Auto Brake, a system that warns the driver and
automatically brakes the car when a collision with a pedestrian in front of the car is imminent
(S60)
2012 – Pedestrian airbag, covering the A-pillars and the lower part of the windscreen in case
of collision with a pedestrian (Volvo V40)
2012 – Knee airbag, for the driver (V40)
2012 – Upgraded City Safety, now working up to 50 km/h (31 mph) (S80, V70, XC70,
XC60, S60, V60, new V40)
2012 – Lane Keeping Aid, a system that steers the car back into the lane again if it is about
to unintentionally drift out of the lane (V40)
2012 – Road Sign Information, a system that reads road signs and displays them in the
information display, thereby helping the driver to remember speed limits, no-overtaking
stretches, low-speed areas, etc. (S80, V70, XC70, XC60, S60, V60, V40)
2012 – Enhanced Blind Spot Information System, now able to detect approaching vehicles
up to 70 meters behind the car (V40)
2012 – Cross Traffic Alert, alerting the driver of crossing traffic approaching from the sides
(up to 30 meters away) when reversing out of a parking space (V40)
2013 – Cyclist Detection with Auto Brake, a system that warns the driver and automatically
brakes the car when a collision with a cyclist travelling in the same direction as the car in
front of the car is imminent (S80, V70, XC70, XC60, XC90, S60, V60, V40)
2014 - Inflatable Child Seat Concept The innovation, which is still in the development stage,
is easy to install and can be tucked away in a small bag when not in use. This means that the
child seat can be easily transferred between cars and the bag even fits in carry-on luggage
when flying or travelling.
“A Study on Product Positioning of Volvo Cars”
PES BBM DECEMBER 2015 – FEBRUARY 2016 Page 32
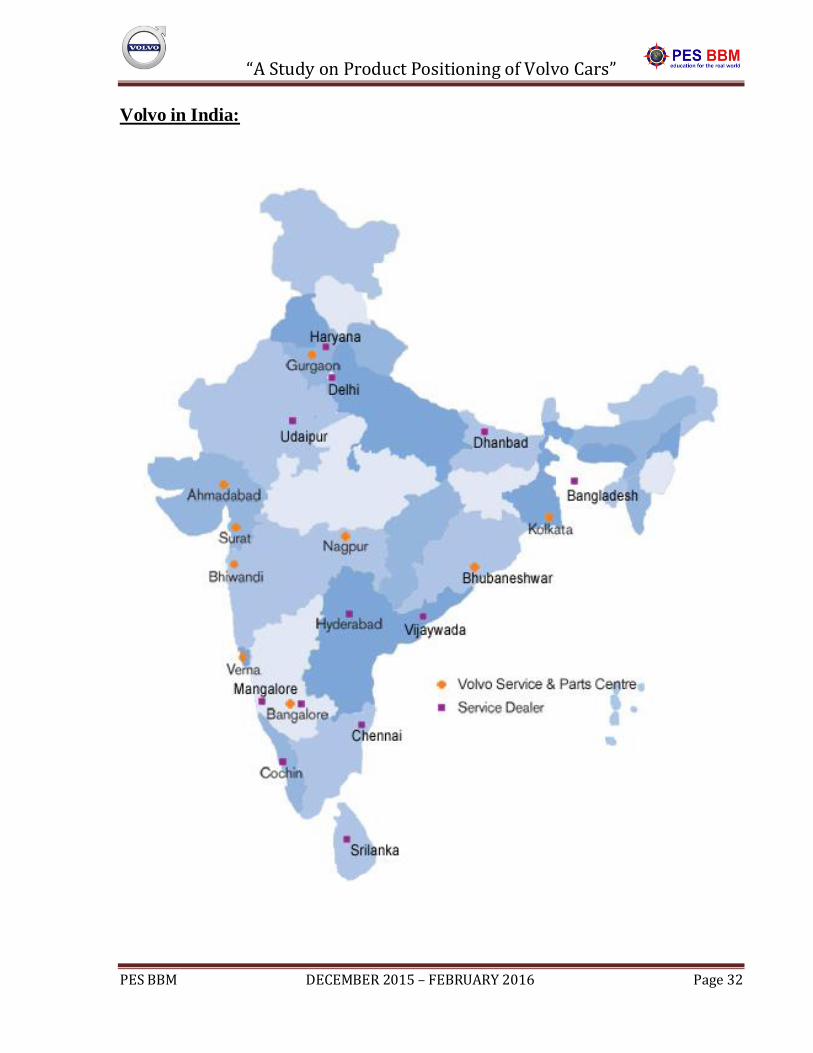
Volvo in India:
“A Study on Product Positioning of Volvo Cars”
PES BBM DECEMBER 2015 – FEBRUARY 2016 Page 33
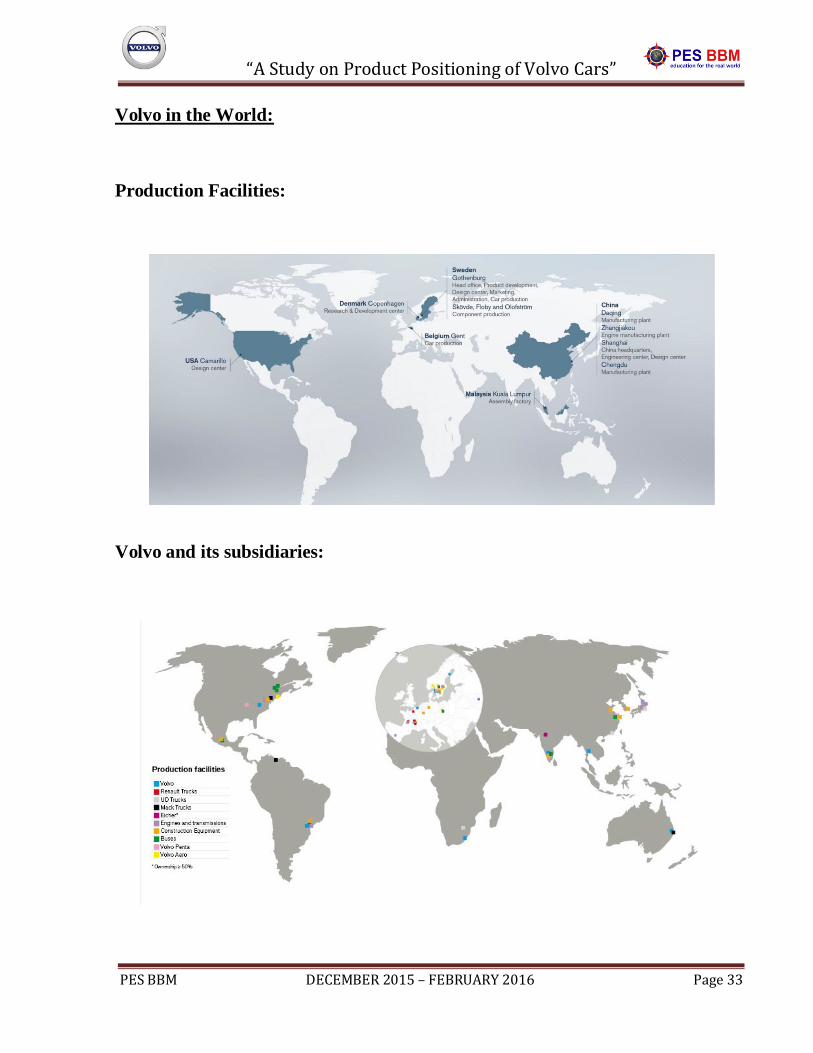
Volvo in the World:
Production Facilities:
Volvo and its subsidiaries:
“A Study on Product Positioning of Volvo Cars”
PES BBM DECEMBER 2015 – FEBRUARY 2016 Page 34
Chapter 4:
ANALYSIS AND INTERPRETATION
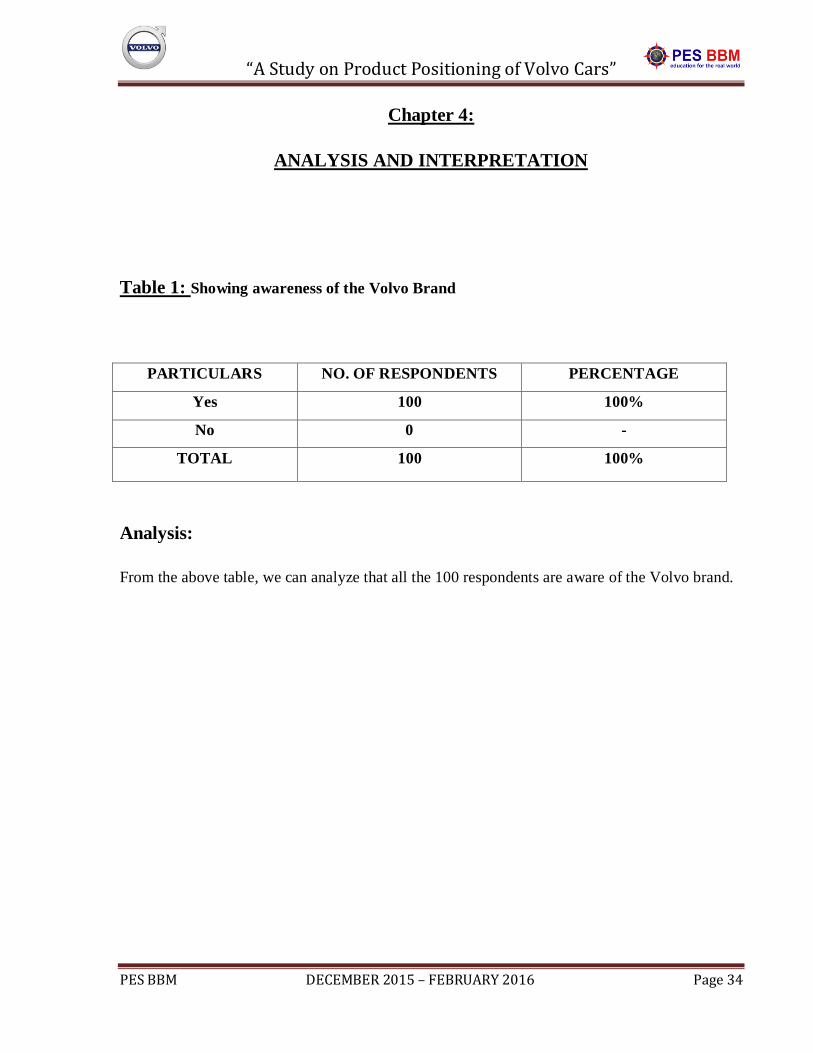
Table 1: Showing awareness of the Volvo Brand
PARTICULARS NO. OF RESPONDENTS PERCENTAGE
Yes 100 100%
No 0 -
TOTAL 100 100%
Analysis:
From the above table, we can analyze that all the 100 respondents are aware of the Volvo brand.
“A Study on Product Positioning of Volvo Cars”
PES BBM DECEMBER 2015 – FEBRUARY 2016 Page 35
Graph 1: Showing awareness of the Volvo Brand
Interpretation:
From the above graph, we can interpret that all the respondents are aware of Volvo cars. This
shows that Volvo is a major contender in the luxury car segment and the brand name has been
published significantly.
Yes
No
“A Study on Product Positioning of Volvo Cars”
PES BBM DECEMBER 2015 – FEBRUARY 2016 Page 36
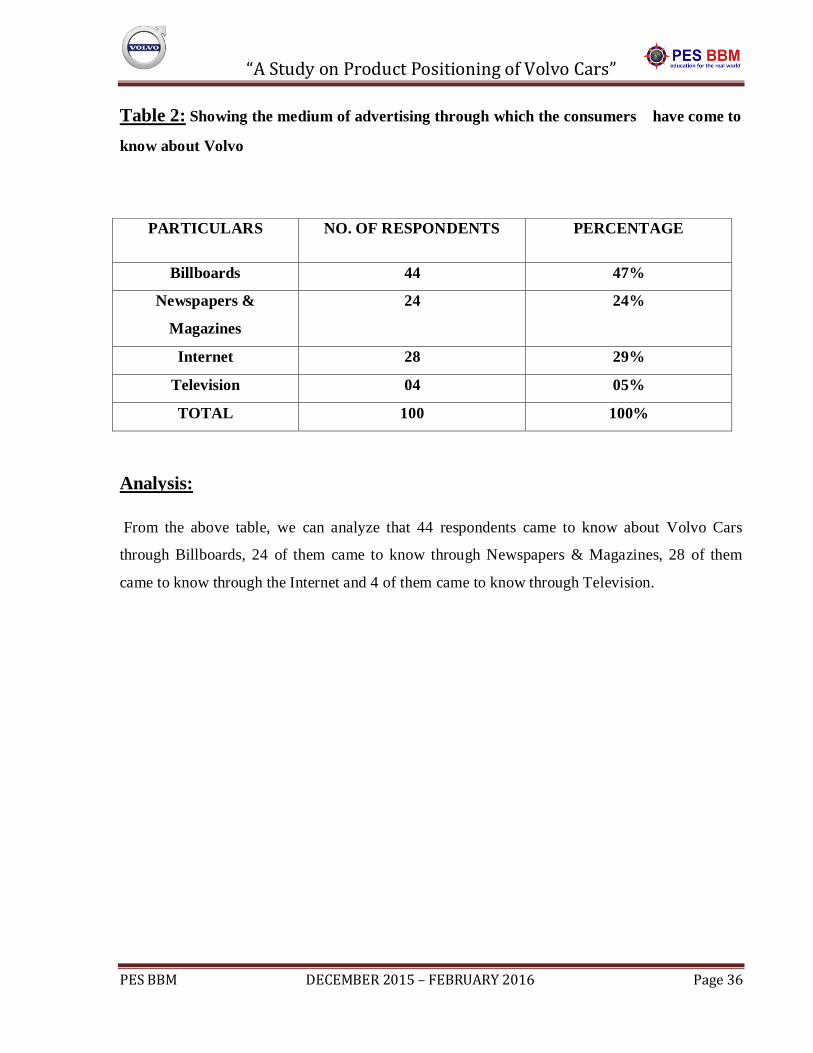
Table 2: Showing the medium of advertising through which the consumers have come to
know about Volvo
PARTICULARS NO. OF RESPONDENTS PERCENTAGE
Billboards 44 47%
Newspapers &
Magazines
24 24%
Internet 28 29%
Television 04 05%
TOTAL 100 100%
Analysis:
From the above table, we can analyze that 44 respondents came to know about Volvo Cars
through Billboards, 24 of them came to know through Newspapers & Magazines, 28 of them
came to know through the Internet and 4 of them came to know through Television.
“A Study on Product Positioning of Volvo Cars”
PES BBM DECEMBER 2015 – FEBRUARY 2016 Page 37
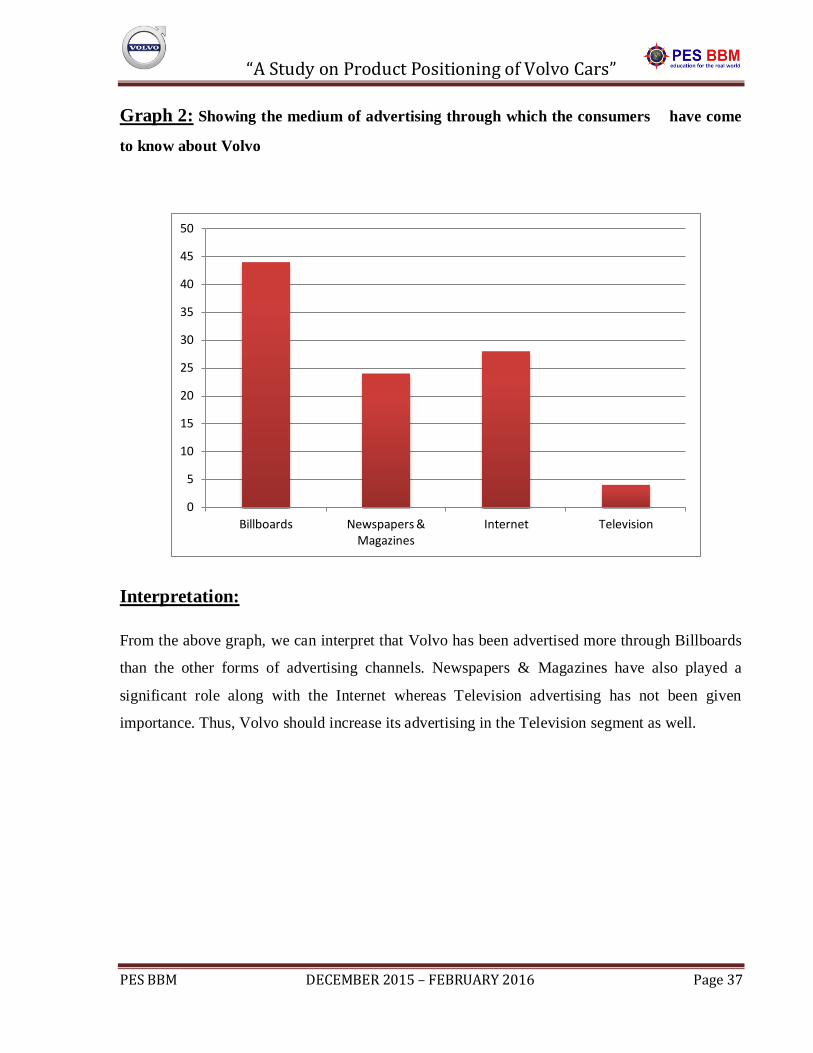
Graph 2: Showing the medium of advertising through which the consumers have come
to know about Volvo
Interpretation:
From the above graph, we can interpret that Volvo has been advertised more through Billboards
than the other forms of advertising channels. Newspapers & Magazines have also played a
significant role along with the Internet whereas Television advertising has not been given
importance. Thus, Volvo should increase its advertising in the Television segment as well.
0
5
10
15
20
25
30
35
40
45
50
Billboards Newspapers & Magazines
Internet Television
“A Study on Product Positioning of Volvo Cars”
PES BBM DECEMBER 2015 – FEBRUARY 2016 Page 38
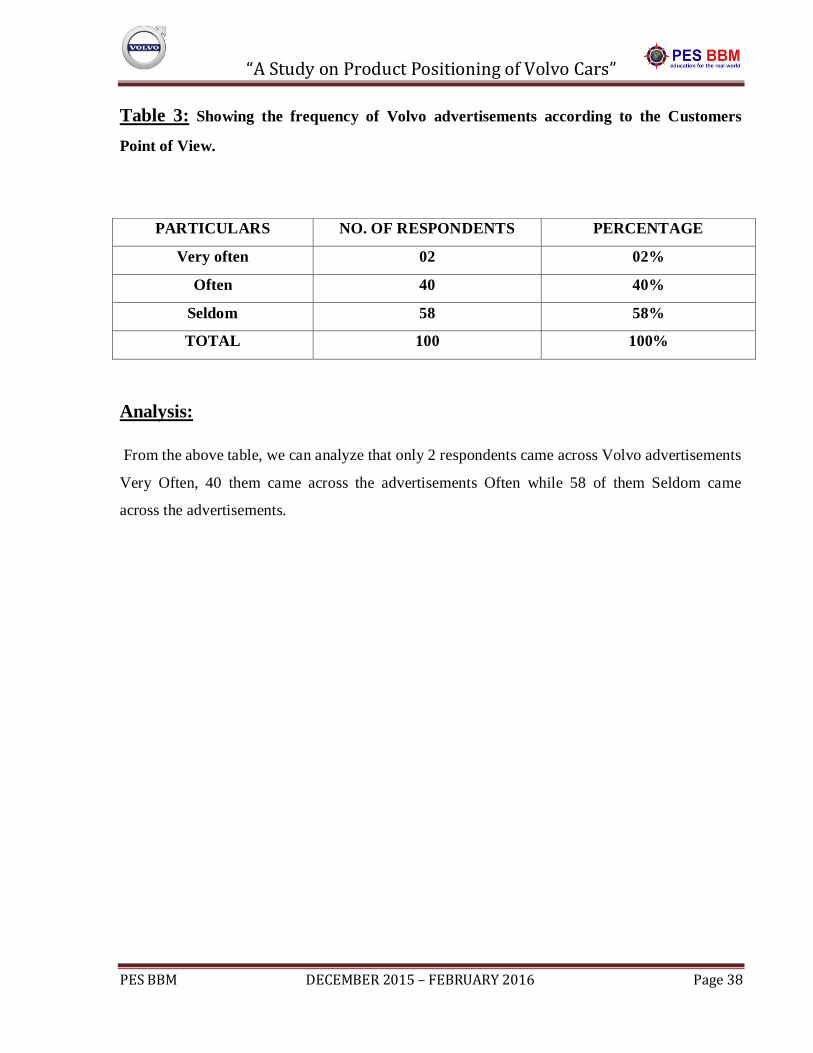
Table 3: Showing the frequency of Volvo advertisements according to the Customers
Point of View.
PARTICULARS NO. OF RESPONDENTS PERCENTAGE
Very often 02 02%
Often 40 40%
Seldom 58 58%
TOTAL 100 100%
Analysis:
From the above table, we can analyze that only 2 respondents came across Volvo advertisements
Very Often, 40 them came across the advertisements Often while 58 of them Seldom came
across the advertisements.
“A Study on Product Positioning of Volvo Cars”
PES BBM DECEMBER 2015 – FEBRUARY 2016 Page 39
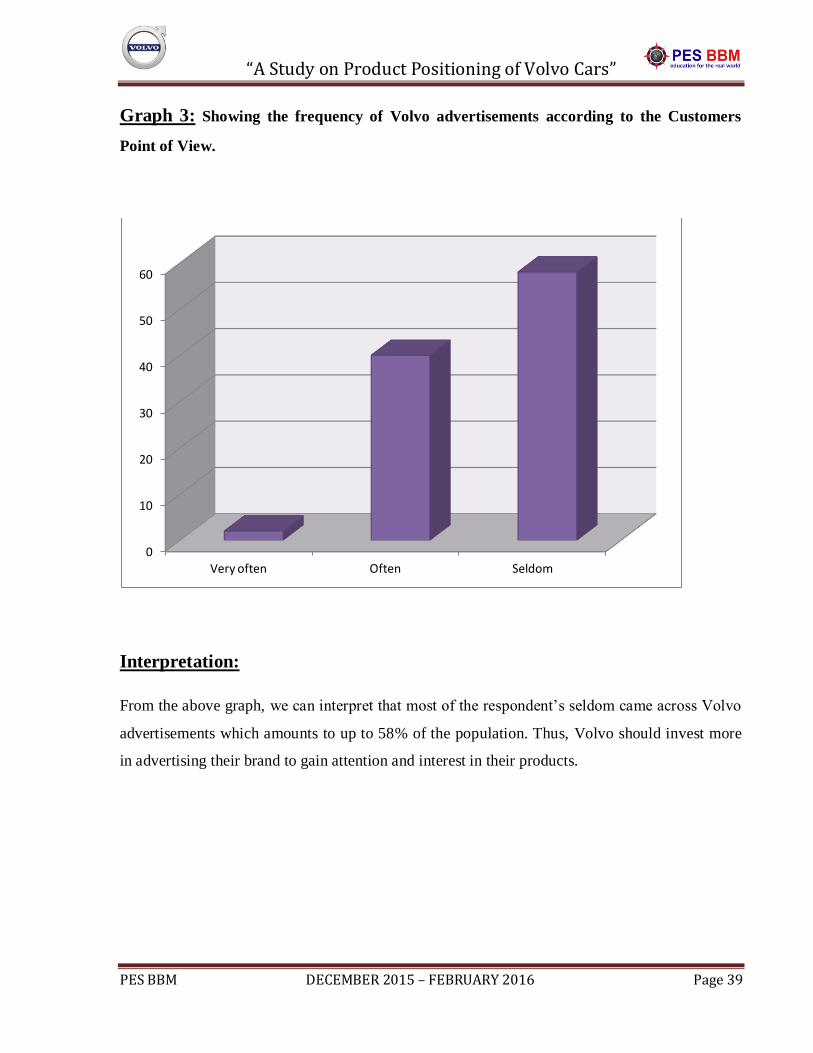
Graph 3: Showing the frequency of Volvo advertisements according to the Customers
Point of View.
Interpretation:
From the above graph, we can interpret that most of the respondent’s seldom came across Volvo
advertisements which amounts to up to 58% of the population. Thus, Volvo should invest more
in advertising their brand to gain attention and interest in their products.
0
10
20
30
40
50
60
Very often Often Seldom
“A Study on Product Positioning of Volvo Cars”
PES BBM DECEMBER 2015 – FEBRUARY 2016 Page 40
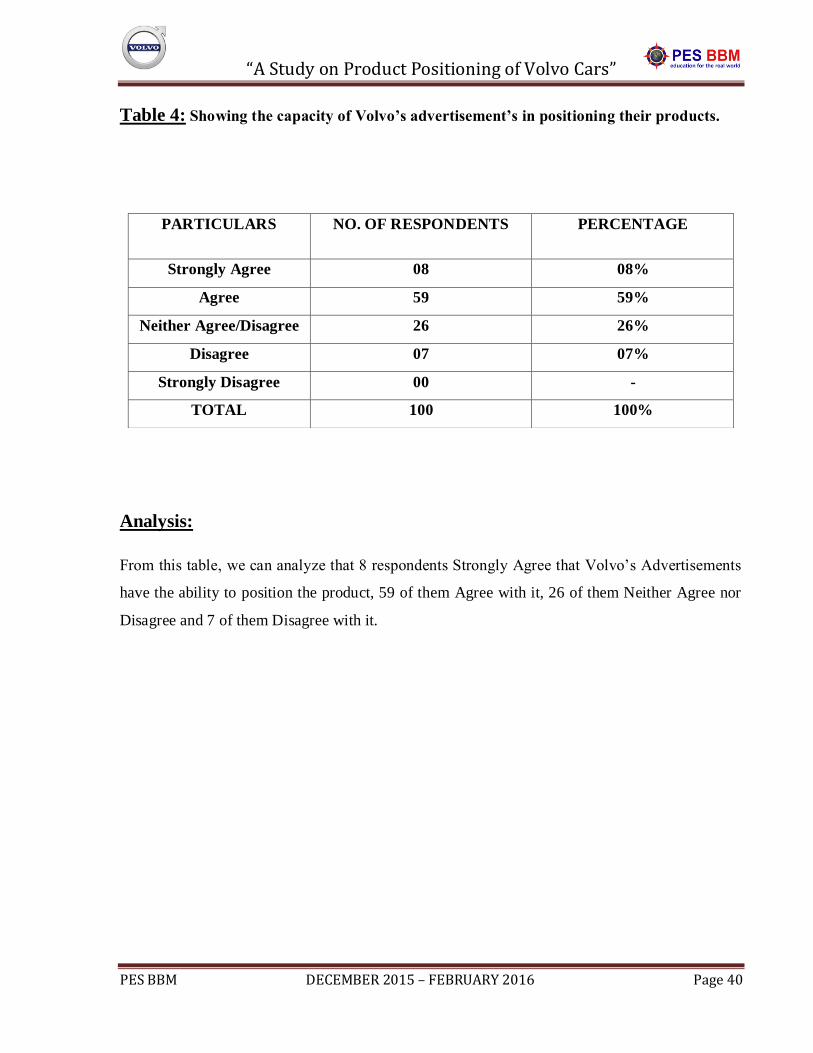
Table 4: Showing the capacity of Volvo’s advertisement’s in positioning their products.
Analysis:
From this table, we can analyze that 8 respondents Strongly Agree that Volvo’s Advertisements
have the ability to position the product, 59 of them Agree with it, 26 of them Neither Agree nor
Disagree and 7 of them Disagree with it.
PARTICULARS NO. OF RESPONDENTS PERCENTAGE
Strongly Agree 08 08%
Agree 59 59%
Neither Agree/Disagree 26 26%
Disagree 07 07%
Strongly Disagree 00 -
TOTAL 100 100%

“A Study on Product Positioning of Volvo Cars”
PES BBM DECEMBER 2015 – FEBRUARY 2016 Page 41
Graph 4: Showing the capacity of Volvo’s advertisement’s in positioning their products.
Interpretation:
From the above graph, we can interpret that most of the respondents agree that Volvo’s
Advertisements have that ability to position the product which amounts to up to 59 respondents.
This shows that Volvo advertisements are effective on consumers making it a positive
characteristic of the company.
0
10
20
30
40
50
60
“A Study on Product Positioning of Volvo Cars”
PES BBM DECEMBER 2015 – FEBRUARY 2016 Page 42
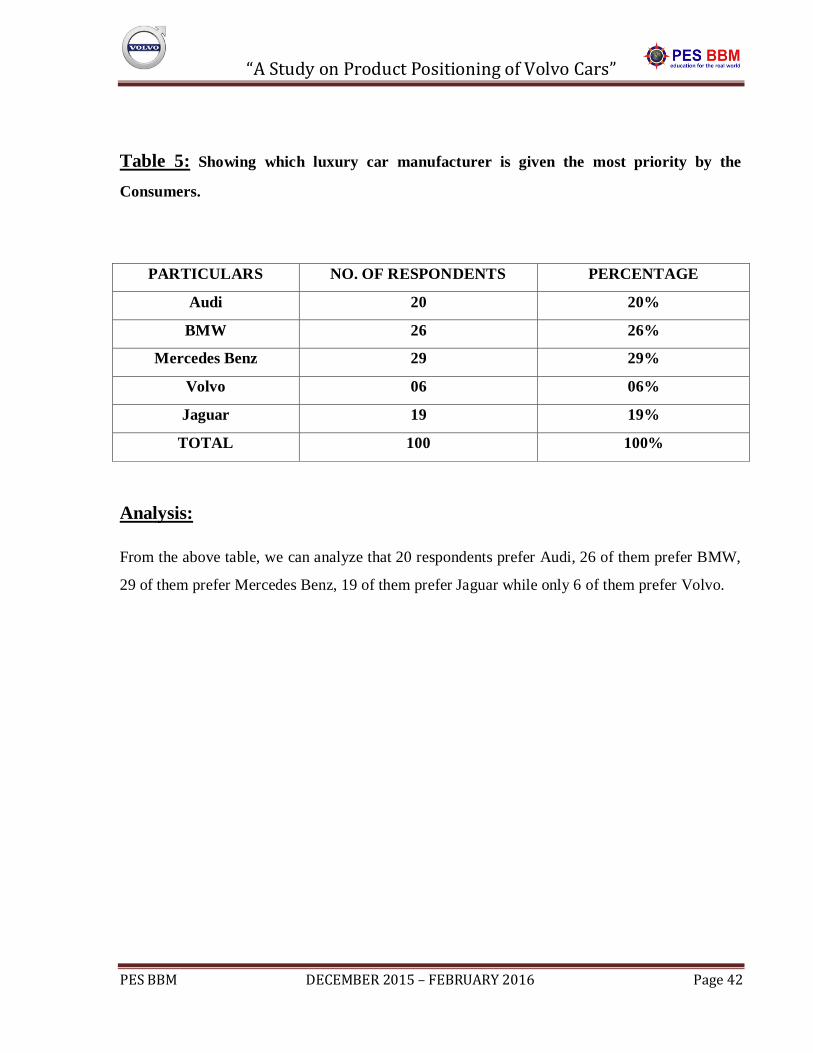
Table 5: Showing which luxury car manufacturer is given the most priority by the
Consumers.
PARTICULARS NO. OF RESPONDENTS PERCENTAGE
Audi 20 20%
BMW 26 26%
Mercedes Benz 29 29%
Volvo 06 06%
Jaguar 19 19%
TOTAL 100 100%
Analysis:
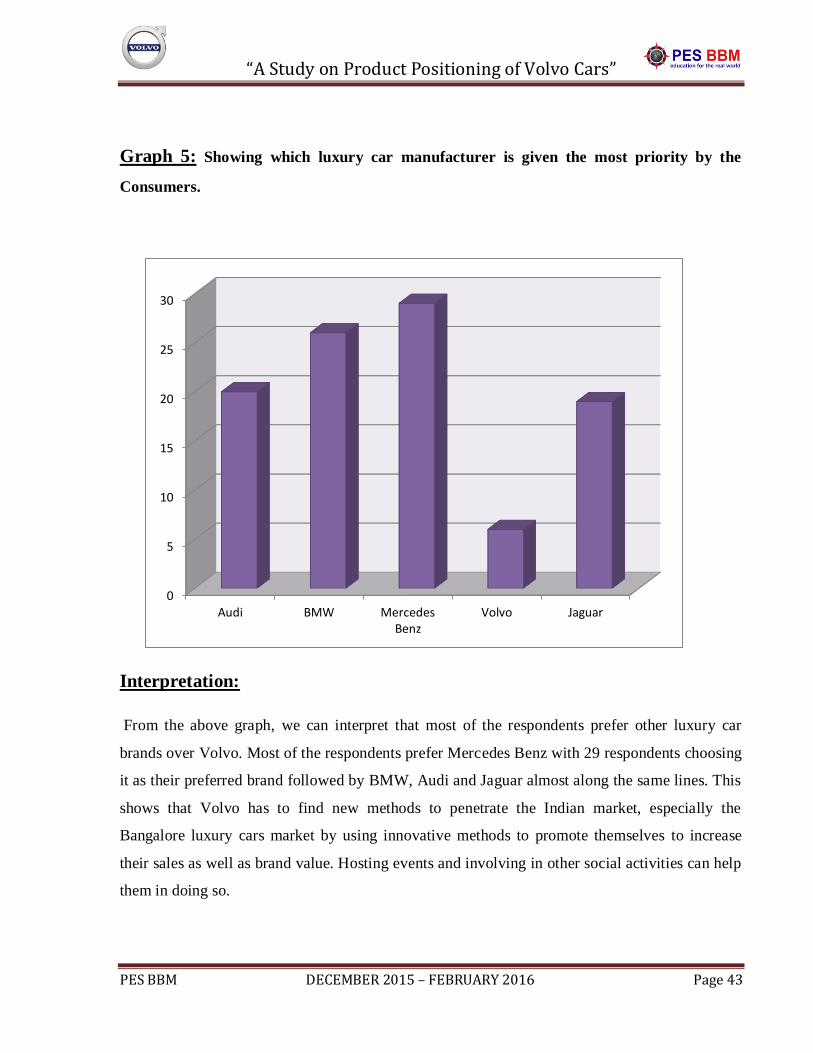
From the above table, we can analyze that 20 respondents prefer Audi, 26 of them prefer BMW,
29 of them prefer Mercedes Benz, 19 of them prefer Jaguar while only 6 of them prefer Volvo.
“A Study on Product Positioning of Volvo Cars”
PES BBM DECEMBER 2015 – FEBRUARY 2016 Page 43
Graph 5: Showing which luxury car manufacturer is given the most priority by the
Consumers.
Interpretation:
From the above graph, we can interpret that most of the respondents prefer other luxury car
brands over Volvo. Most of the respondents prefer Mercedes Benz with 29 respondents choosing
it as their preferred brand followed by BMW, Audi and Jaguar almost along the same lines. This
shows that Volvo has to find new methods to penetrate the Indian market, especially the
Bangalore luxury cars market by using innovative methods to promote themselves to increase
their sales as well as brand value. Hosting events and involving in other social activities can help
them in doing so.
0
5
10
15
20
25
30
Audi BMW Mercedes Benz
Volvo Jaguar
“A Study on Product Positioning of Volvo Cars”
PES BBM DECEMBER 2015 – FEBRUARY 2016 Page 44
Table 6: Showing the opinion of Consumers regarding the quality of Volvo cars compared
to its Competitors.
PARTICULARS NO. OF RESPONDENTS PERCENTAGE
Very Good 23 23%
Good 65 65%
Average 12 12%
Poor 00 -
Very Poor 00 -
TOTAL 100 100%
Analysis:
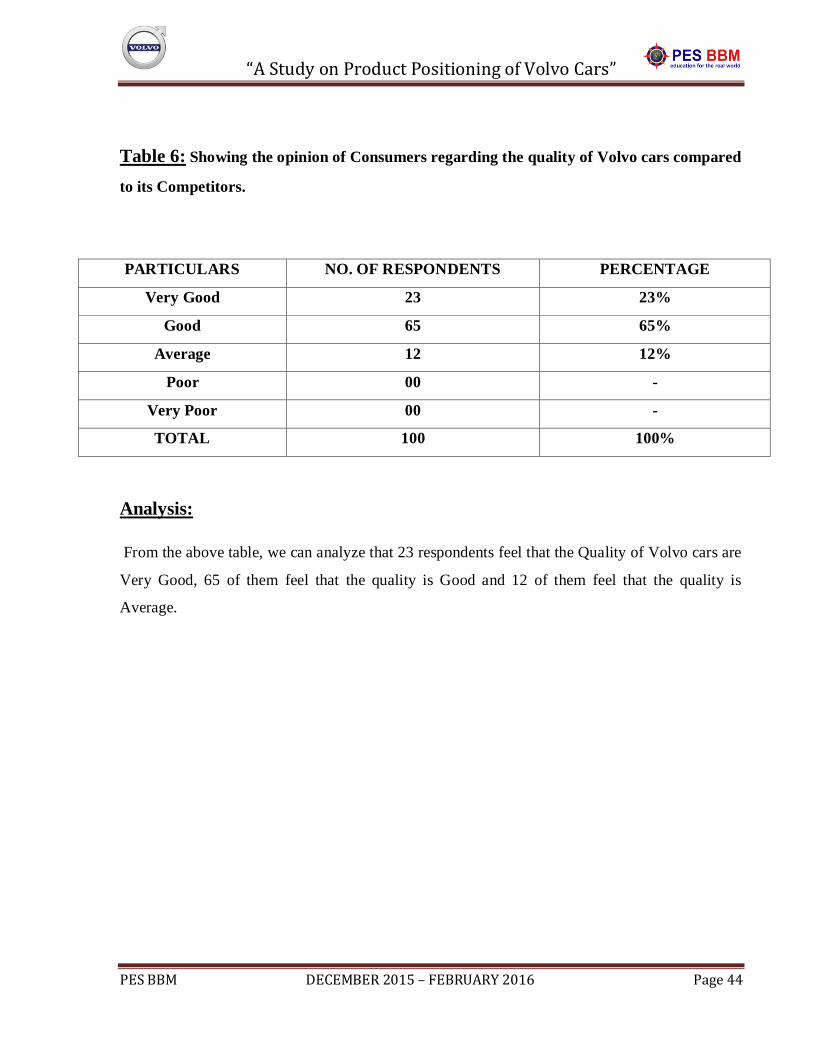
From the above table, we can analyze that 23 respondents feel that the Quality of Volvo cars are
Very Good, 65 of them feel that the quality is Good and 12 of them feel that the quality is
Average.
“A Study on Product Positioning of Volvo Cars”
PES BBM DECEMBER 2015 – FEBRUARY 2016 Page 45
Graph 6: Showing the opinion of Consumers regarding the quality of Volvo cars
compared to its Competitors.
Interpretation:
From the above graph, we can interpret that most of the respondents feel that the build quality of
Volvo cars are good. While 23 respondents feel that is very good, 65 respondents feel that the
build quality is good. This shows that the build qualities of Volvo cars are good compared to its
competitors.
Very Good
Good
Average
Poor
Very Poor
“A Study on Product Positioning of Volvo Cars”
PES BBM DECEMBER 2015 – FEBRUARY 2016 Page 46
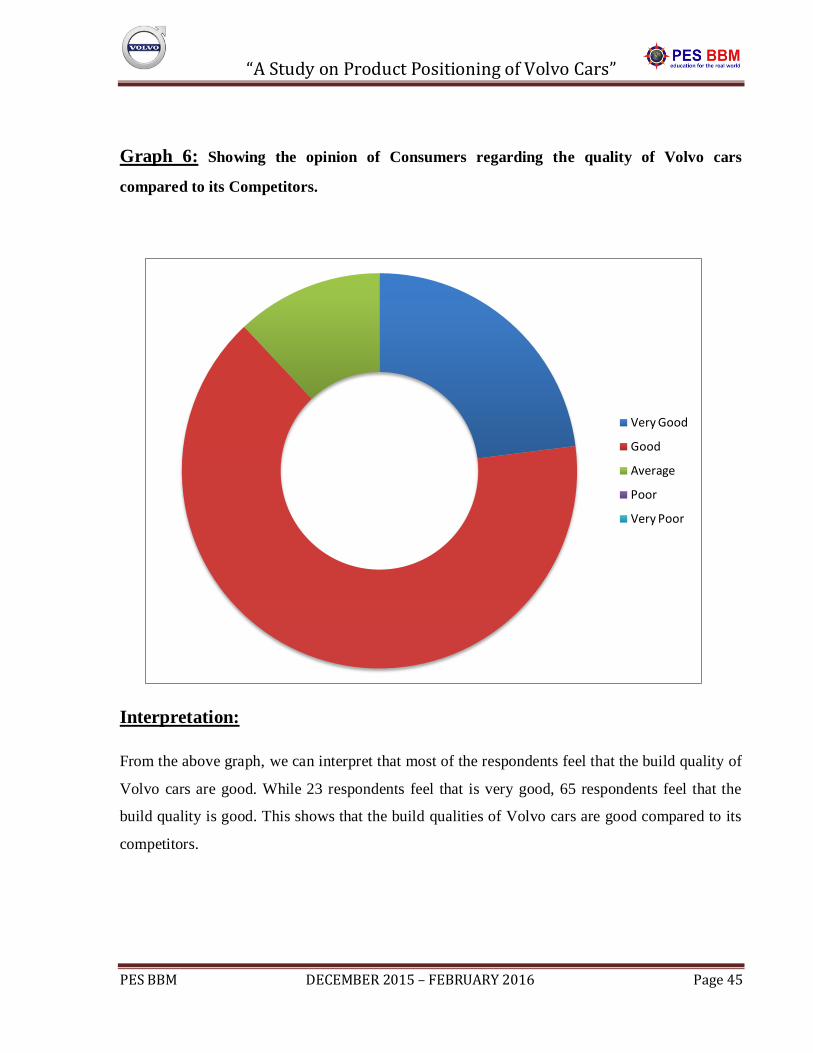
Table 7: Showing the opinion of Consumers regarding the price of Volvo cars compared
to its Competitors.
PARTICULARS NO. OF RESPONDENTS PERCENTAGE
Very Good 14 14%
Good 65 65%
Average 20 20%
Poor 01 01%
Very Poor 00 -
TOTAL 100 100%
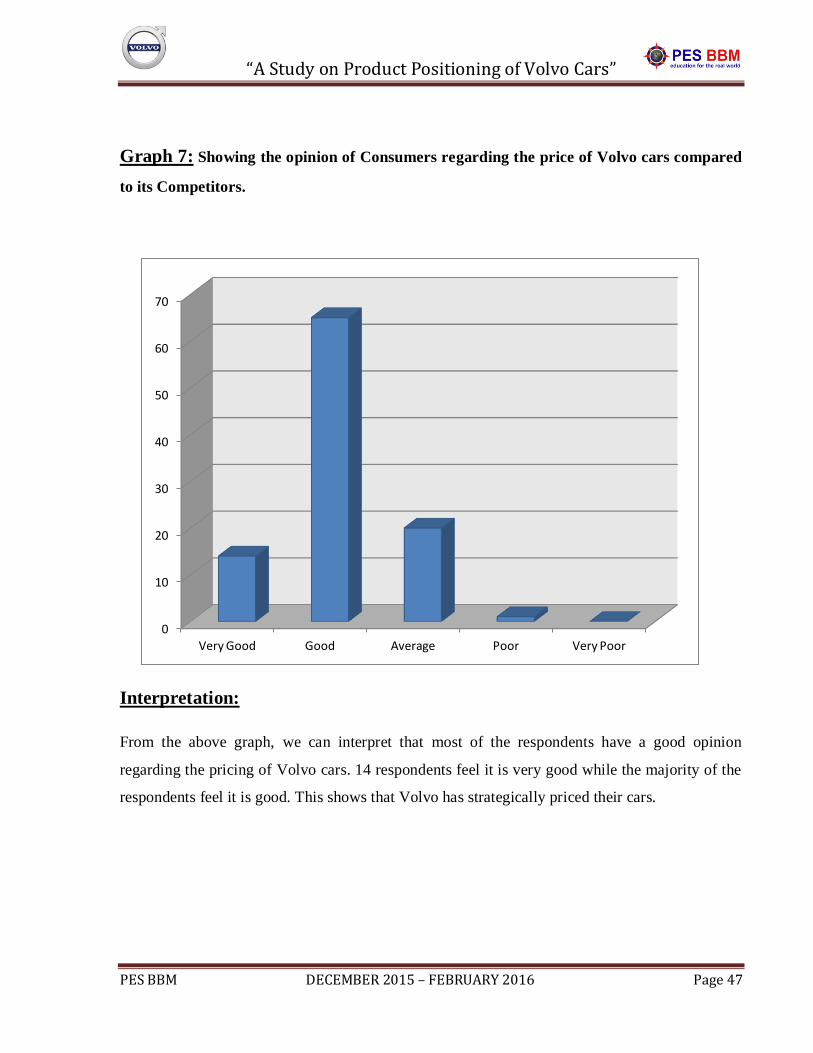
Analysis:
From the above table, we can analyze that 14 respondents feel that the price of Volvo cars are
Very Good, 65 of them feel that the price is Good and 20 of them feel that the price is Average
and 1 respondent feels that it is Poor compared to its competitors.
“A Study on Product Positioning of Volvo Cars”
PES BBM DECEMBER 2015 – FEBRUARY 2016 Page 47
Graph 7: Showing the opinion of Consumers regarding the price of Volvo cars compared
to its Competitors.
Interpretation:
From the above graph, we can interpret that most of the respondents have a good opinion
regarding the pricing of Volvo cars. 14 respondents feel it is very good while the majority of the
respondents feel it is good. This shows that Volvo has strategically priced their cars.
0
10
20
30
40
50
60
70
Very Good Good Average Poor Very Poor
“A Study on Product Positioning of Volvo Cars”
PES BBM DECEMBER 2015 – FEBRUARY 2016 Page 48
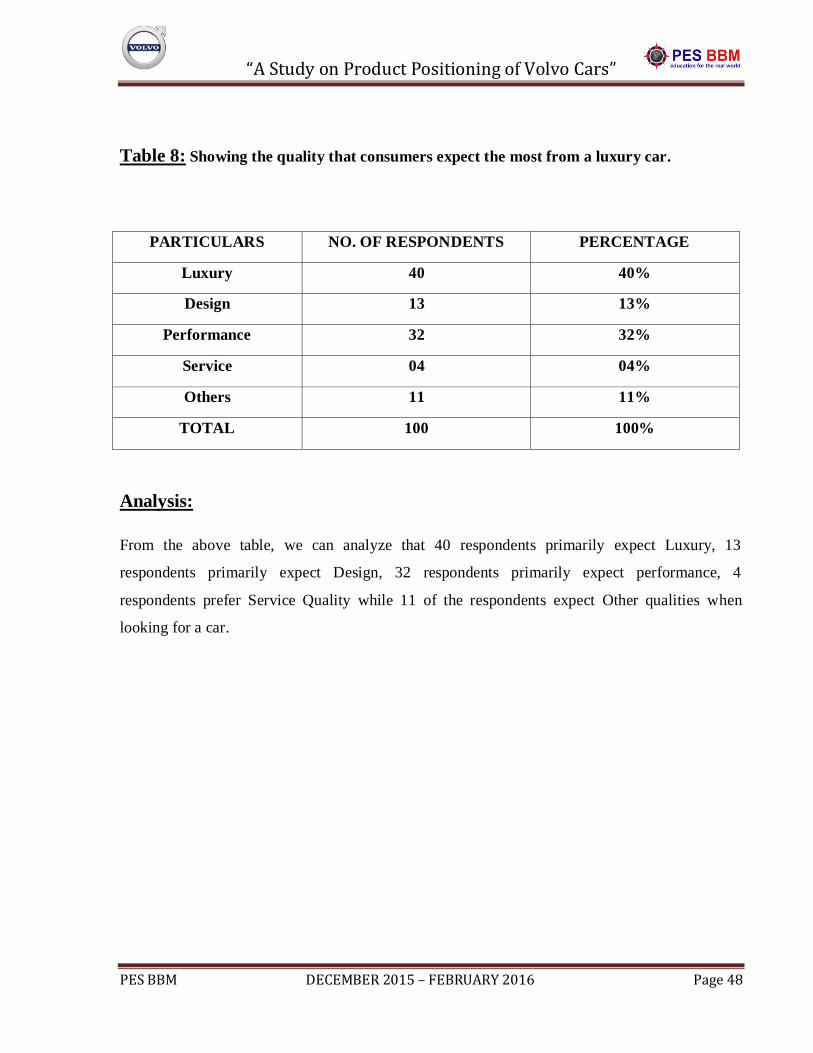
Table 8: Showing the quality that consumers expect the most from a luxury car.
PARTICULARS NO. OF RESPONDENTS PERCENTAGE
Luxury 40 40%
Design 13 13%
Performance 32 32%
Service 04 04%
Others 11 11%
TOTAL 100 100%
Analysis:
From the above table, we can analyze that 40 respondents primarily expect Luxury, 13
respondents primarily expect Design, 32 respondents primarily expect performance, 4
respondents prefer Service Quality while 11 of the respondents expect Other qualities when
looking for a car.
“A Study on Product Positioning of Volvo Cars”
PES BBM DECEMBER 2015 – FEBRUARY 2016 Page 49
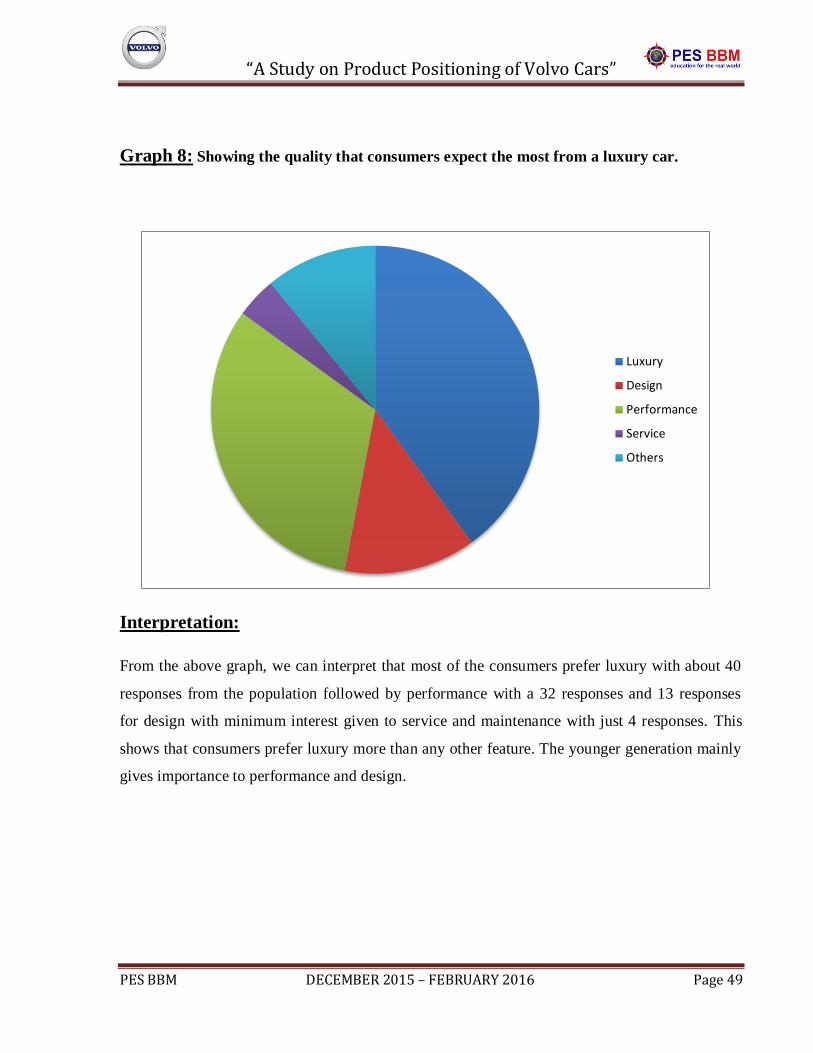
Graph 8: Showing the quality that consumers expect the most from a luxury car.
Interpretation:
From the above graph, we can interpret that most of the consumers prefer luxury with about 40
responses from the population followed by performance with a 32 responses and 13 responses
for design with minimum interest given to service and maintenance with just 4 responses. This
shows that consumers prefer luxury more than any other feature. The younger generation mainly
gives importance to performance and design.
Luxury
Design
Performance
Service
Others
“A Study on Product Positioning of Volvo Cars”
PES BBM DECEMBER 2015 – FEBRUARY 2016 Page 50
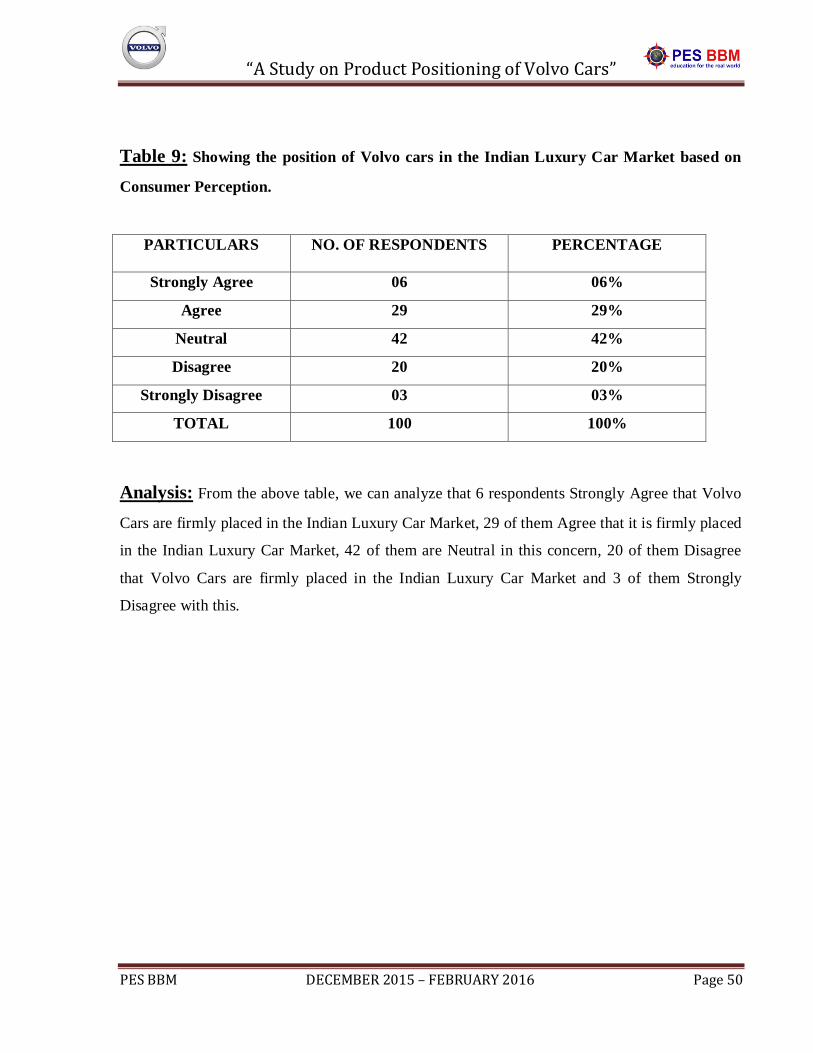
Table 9: Showing the position of Volvo cars in the Indian Luxury Car Market based on
Consumer Perception.
Analysis: From the above table, we can analyze that 6 respondents Strongly Agree that Volvo
Cars are firmly placed in the Indian Luxury Car Market, 29 of them Agree that it is firmly placed
in the Indian Luxury Car Market, 42 of them are Neutral in this concern, 20 of them Disagree
that Volvo Cars are firmly placed in the Indian Luxury Car Market and 3 of them Strongly
Disagree with this.
PARTICULARS NO. OF RESPONDENTS PERCENTAGE
Strongly Agree 06 06%
Agree 29 29%
Neutral 42 42%
Disagree 20 20%
Strongly Disagree 03 03%
TOTAL 100 100%
“A Study on Product Positioning of Volvo Cars”
PES BBM DECEMBER 2015 – FEBRUARY 2016 Page 51
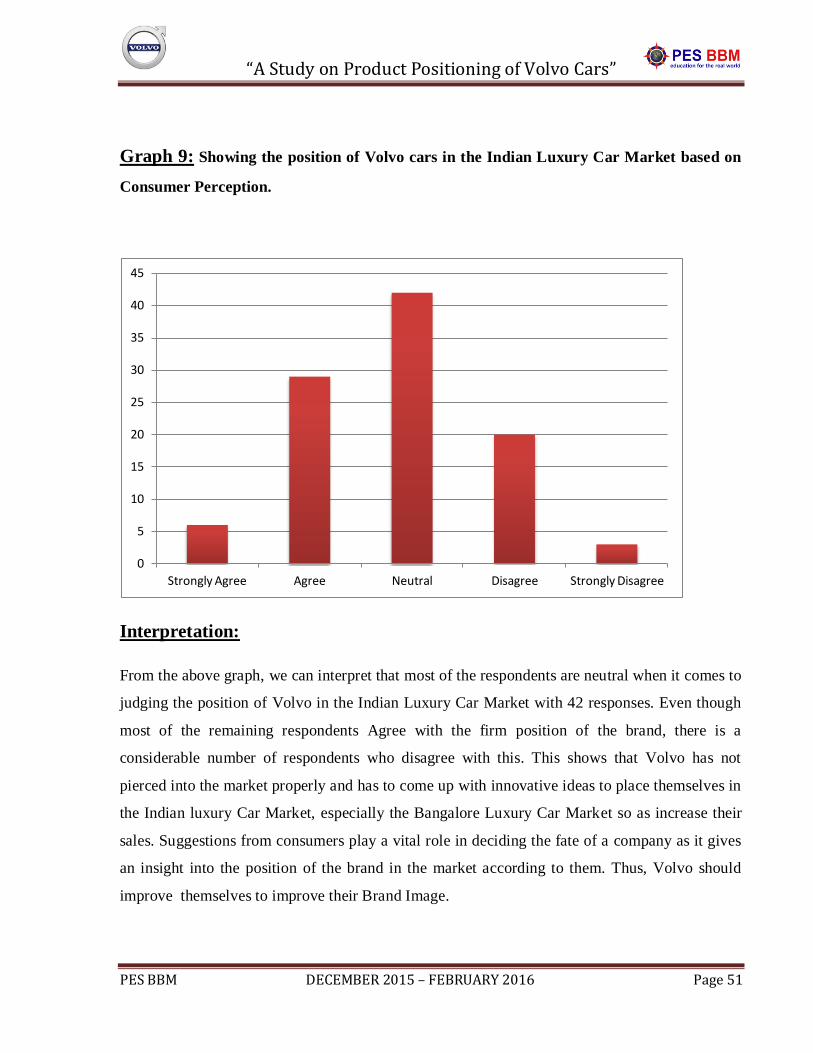
Graph 9: Showing the position of Volvo cars in the Indian Luxury Car Market based on
Consumer Perception.
Interpretation:
From the above graph, we can interpret that most of the respondents are neutral when it comes to
judging the position of Volvo in the Indian Luxury Car Market with 42 responses. Even though
most of the remaining respondents Agree with the firm position of the brand, there is a
considerable number of respondents who disagree with this. This shows that Volvo has not
pierced into the market properly and has to come up with innovative ideas to place themselves in
the Indian luxury Car Market, especially the Bangalore Luxury Car Market so as increase their
sales. Suggestions from consumers play a vital role in deciding the fate of a company as it gives
an insight into the position of the brand in the market according to them. Thus, Volvo should
improve themselves to improve their Brand Image.
0
5
10
15
20
25
30
35
40
45
Strongly Agree Agree Neutral Disagree Strongly Disagree
“A Study on Product Positioning of Volvo Cars”
PES BBM DECEMBER 2015 – FEBRUARY 2016 Page 52
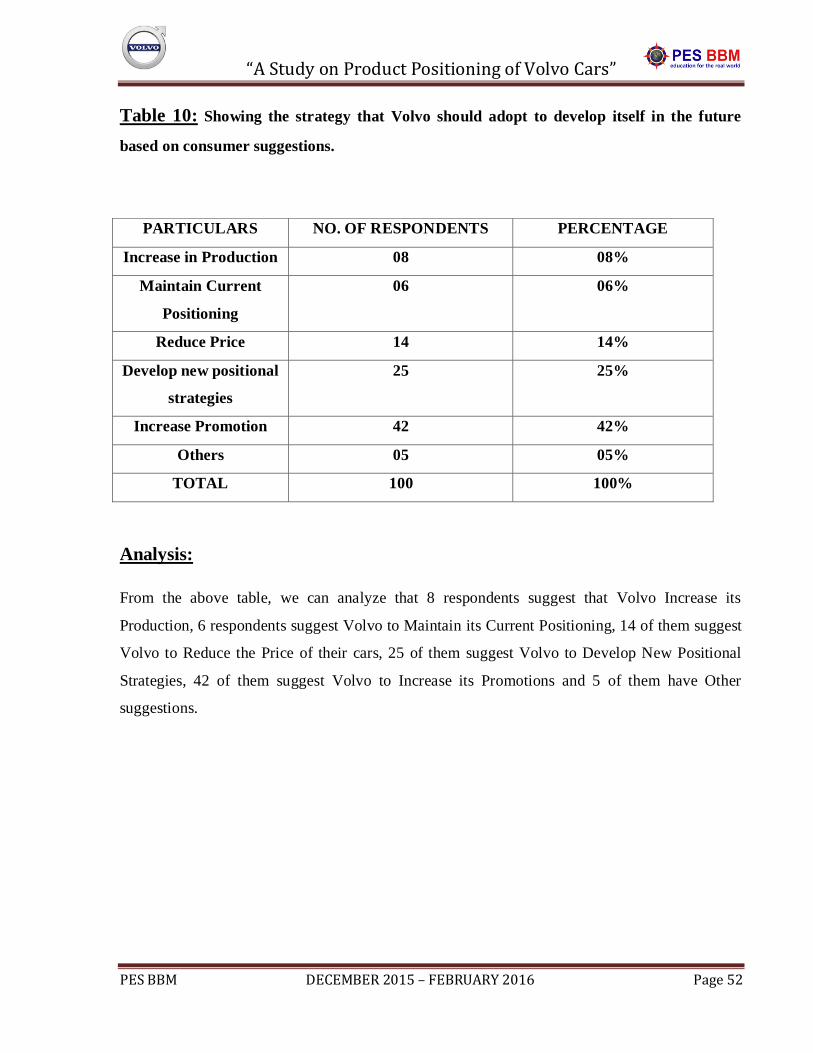
Table 10: Showing the strategy that Volvo should adopt to develop itself in the future
based on consumer suggestions.
PARTICULARS NO. OF RESPONDENTS PERCENTAGE
Increase in Production 08 08%
Maintain Current
Positioning
06 06%
Reduce Price 14 14%
Develop new positional
strategies
25 25%
Increase Promotion 42 42%
Others 05 05%
TOTAL 100 100%
Analysis:
From the above table, we can analyze that 8 respondents suggest that Volvo Increase its
Production, 6 respondents suggest Volvo to Maintain its Current Positioning, 14 of them suggest
Volvo to Reduce the Price of their cars, 25 of them suggest Volvo to Develop New Positional
Strategies, 42 of them suggest Volvo to Increase its Promotions and 5 of them have Other
suggestions.
“A Study on Product Positioning of Volvo Cars”
PES BBM DECEMBER 2015 – FEBRUARY 2016 Page 53
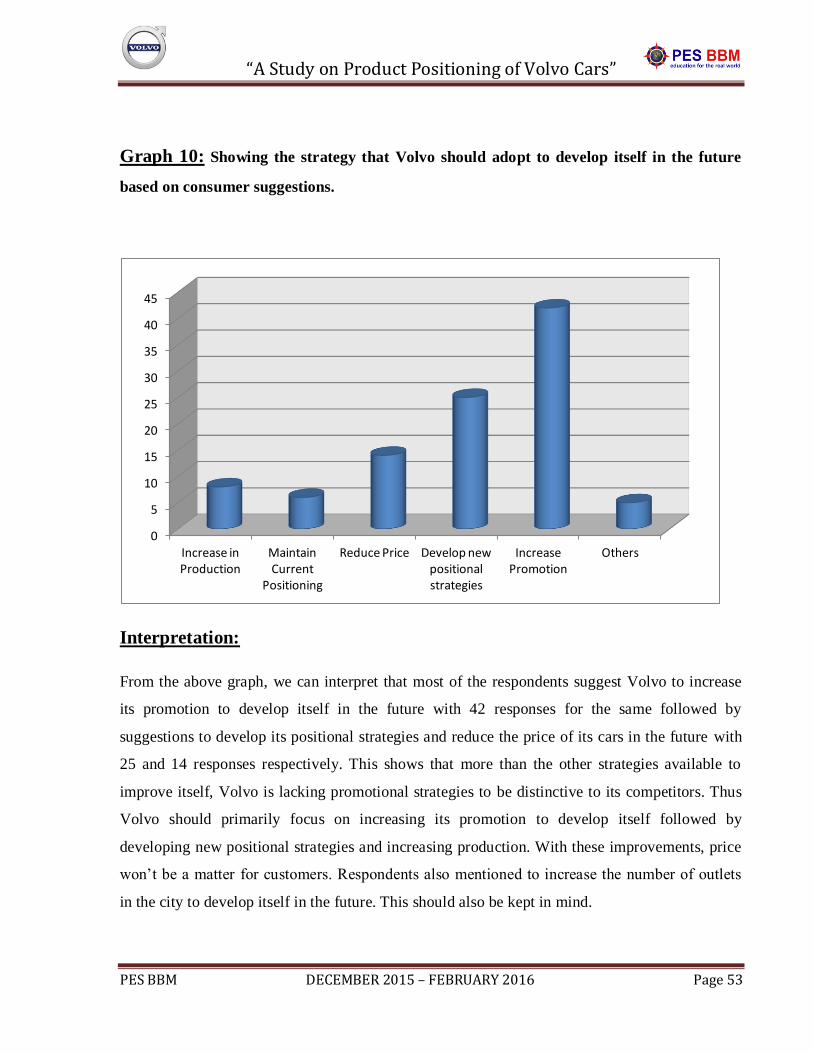
Graph 10: Showing the strategy that Volvo should adopt to develop itself in the future
based on consumer suggestions.
Interpretation:
From the above graph, we can interpret that most of the respondents suggest Volvo to increase
its promotion to develop itself in the future with 42 responses for the same followed by
suggestions to develop its positional strategies and reduce the price of its cars in the future with
25 and 14 responses respectively. This shows that more than the other strategies available to
improve itself, Volvo is lacking promotional strategies to be distinctive to its competitors. Thus
Volvo should primarily focus on increasing its promotion to develop itself followed by
developing new positional strategies and increasing production. With these improvements, price
won’t be a matter for customers. Respondents also mentioned to increase the number of outlets
in the city to develop itself in the future. This should also be kept in mind.
0
5
10
15
20
25
30
35
40
45
Increase in Production
Maintain Current
Positioning
Reduce Price Develop new positional strategies
Increase Promotion
Others
“A Study on Product Positioning of Volvo Cars”
PES BBM DECEMBER 2015 – FEBRUARY 2016 Page 54
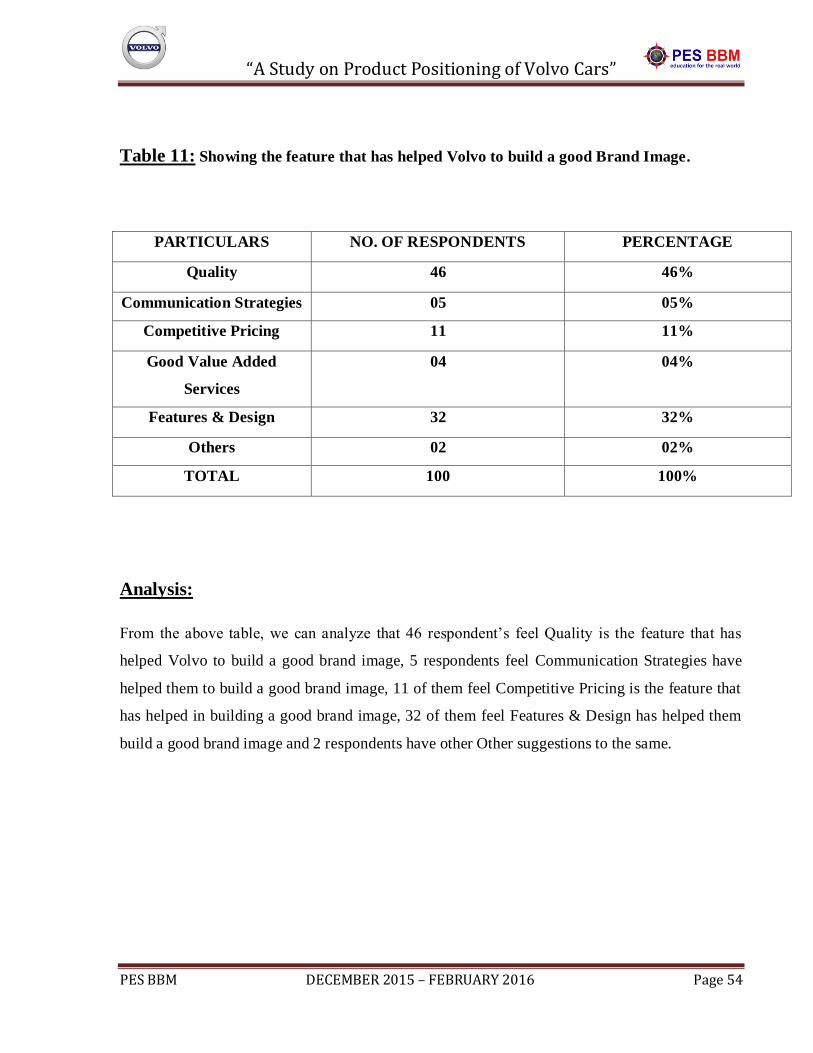
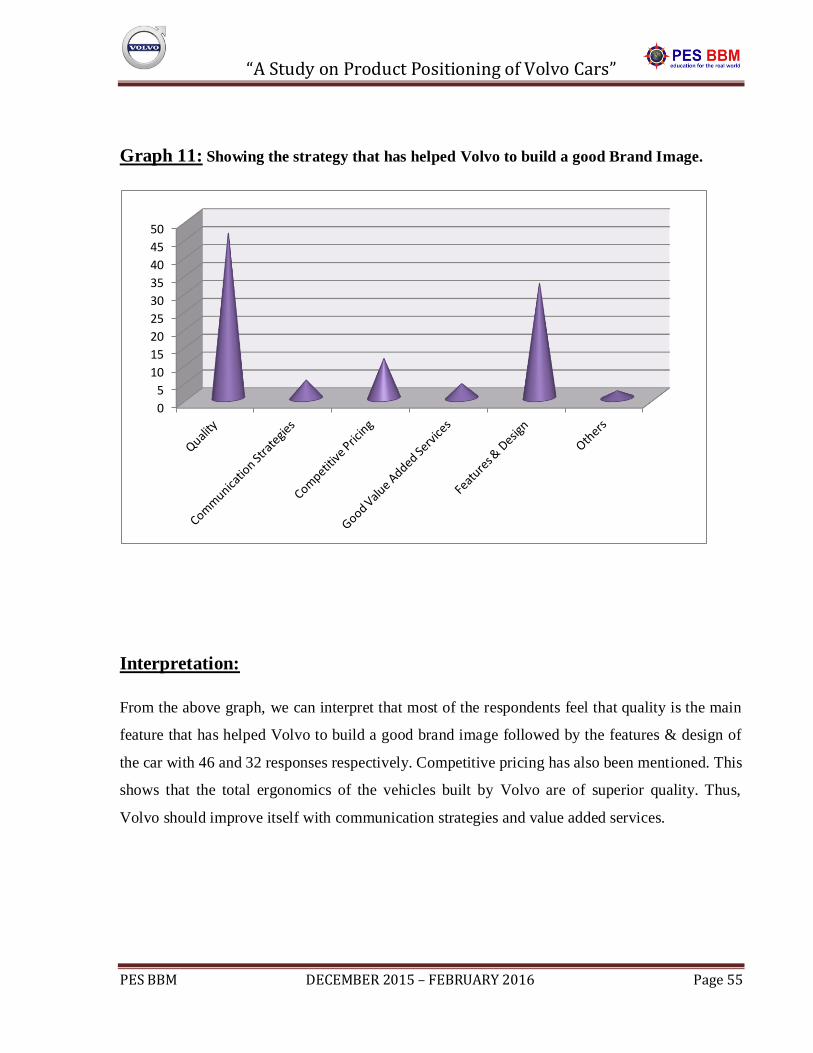
Table 11: Showing the feature that has helped Volvo to build a good Brand Image.
PARTICULARS NO. OF RESPONDENTS PERCENTAGE
Quality 46 46%
Communication Strategies 05 05%
Competitive Pricing 11 11%
Good Value Added
Services
04 04%
Features & Design 32 32%
Others 02 02%
TOTAL 100 100%
Analysis:
From the above table, we can analyze that 46 respondent’s feel Quality is the feature that has
helped Volvo to build a good brand image, 5 respondents feel Communication Strategies have
helped them to build a good brand image, 11 of them feel Competitive Pricing is the feature that
has helped in building a good brand image, 32 of them feel Features & Design has helped them
build a good brand image and 2 respondents have other Other suggestions to the same.
“A Study on Product Positioning of Volvo Cars”
PES BBM DECEMBER 2015 – FEBRUARY 2016 Page 55
Graph 11: Showing the strategy that has helped Volvo to build a good Brand Image.
Interpretation:
From the above graph, we can interpret that most of the respondents feel that quality is the main
feature that has helped Volvo to build a good brand image followed by the features & design of
the car with 46 and 32 responses respectively. Competitive pricing has also been mentioned. This
shows that the total ergonomics of the vehicles built by Volvo are of superior quality. Thus,
Volvo should improve itself with communication strategies and value added services.
0
5
10
15
20
25
30
35
40
45
50
“A Study on Product Positioning of Volvo Cars”
PES BBM DECEMBER 2015 – FEBRUARY 2016 Page 56
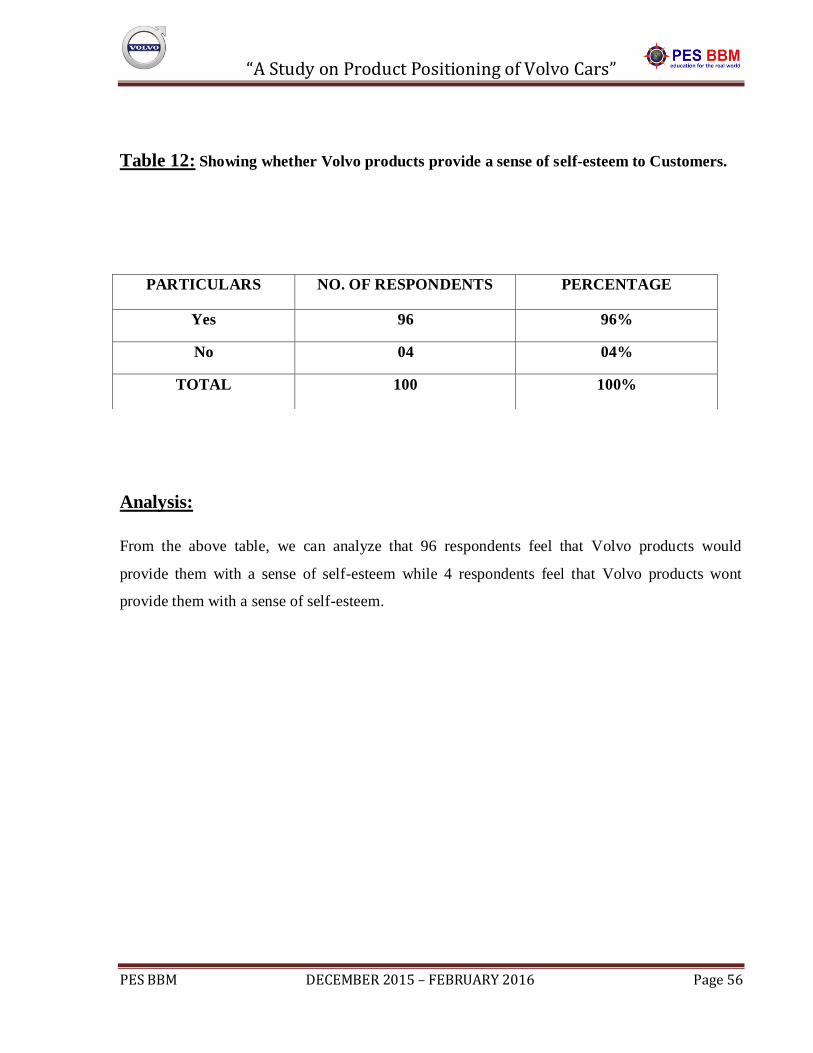
Table 12: Showing whether Volvo products provide a sense of self-esteem to Customers.
Analysis:
From the above table, we can analyze that 96 respondents feel that Volvo products would
provide them with a sense of self-esteem while 4 respondents feel that Volvo products wont
provide them with a sense of self-esteem.
PARTICULARS NO. OF RESPONDENTS PERCENTAGE
Yes 96 96%
No 04 04%
TOTAL 100 100%

“A Study on Product Positioning of Volvo Cars”
PES BBM DECEMBER 2015 – FEBRUARY 2016 Page 57
Graph 12: Showing whether Volvo products provide a sense of self-esteem to Customers.
Interpretation:
From the above graph, we can interpret that most of the respondents feel that Volvo products
would provide them with a sense of self-esteem with 96 responses for the same while 4
respondents don’t feel the same. Overall, this helps in proving that Volvo is a premium car
manufacturer in the market.
Yes
No
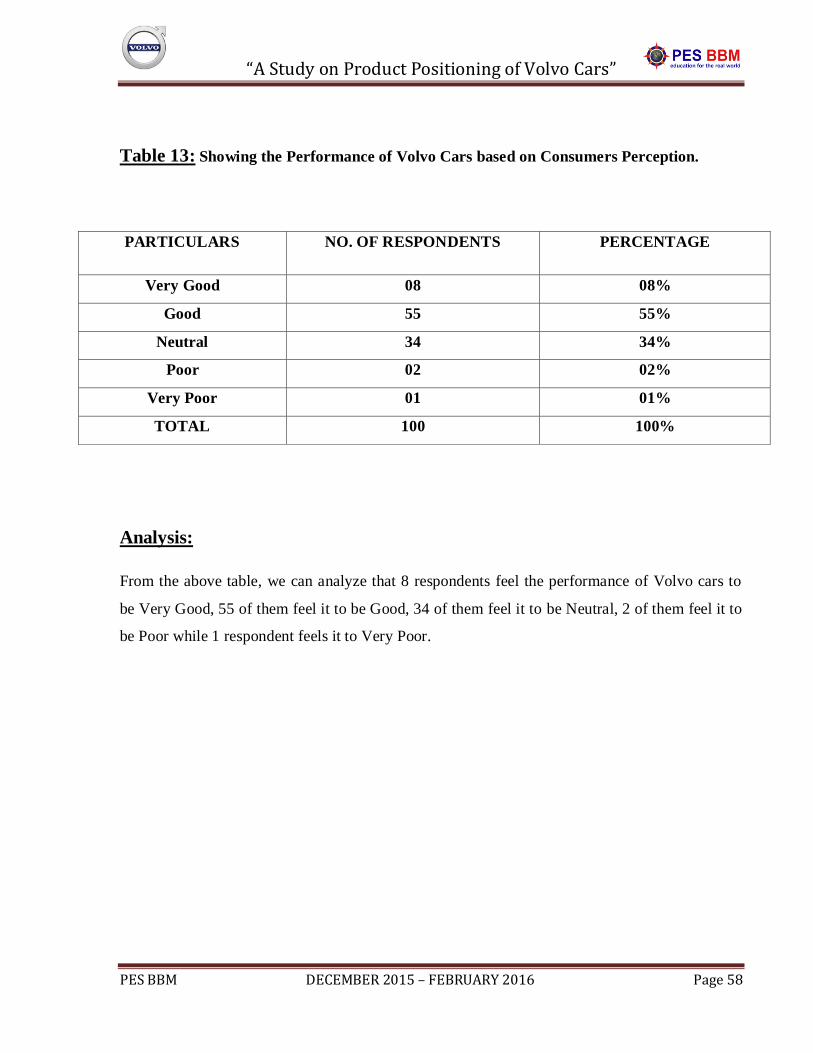
“A Study on Product Positioning of Volvo Cars”
PES BBM DECEMBER 2015 – FEBRUARY 2016 Page 58
Table 13: Showing the Performance of Volvo Cars based on Consumers Perception.
PARTICULARS NO. OF RESPONDENTS PERCENTAGE
Very Good 08 08%
Good 55 55%
Neutral 34 34%
Poor 02 02%
Very Poor 01 01%
TOTAL 100 100%
Analysis:
From the above table, we can analyze that 8 respondents feel the performance of Volvo cars to
be Very Good, 55 of them feel it to be Good, 34 of them feel it to be Neutral, 2 of them feel it to
be Poor while 1 respondent feels it to Very Poor.
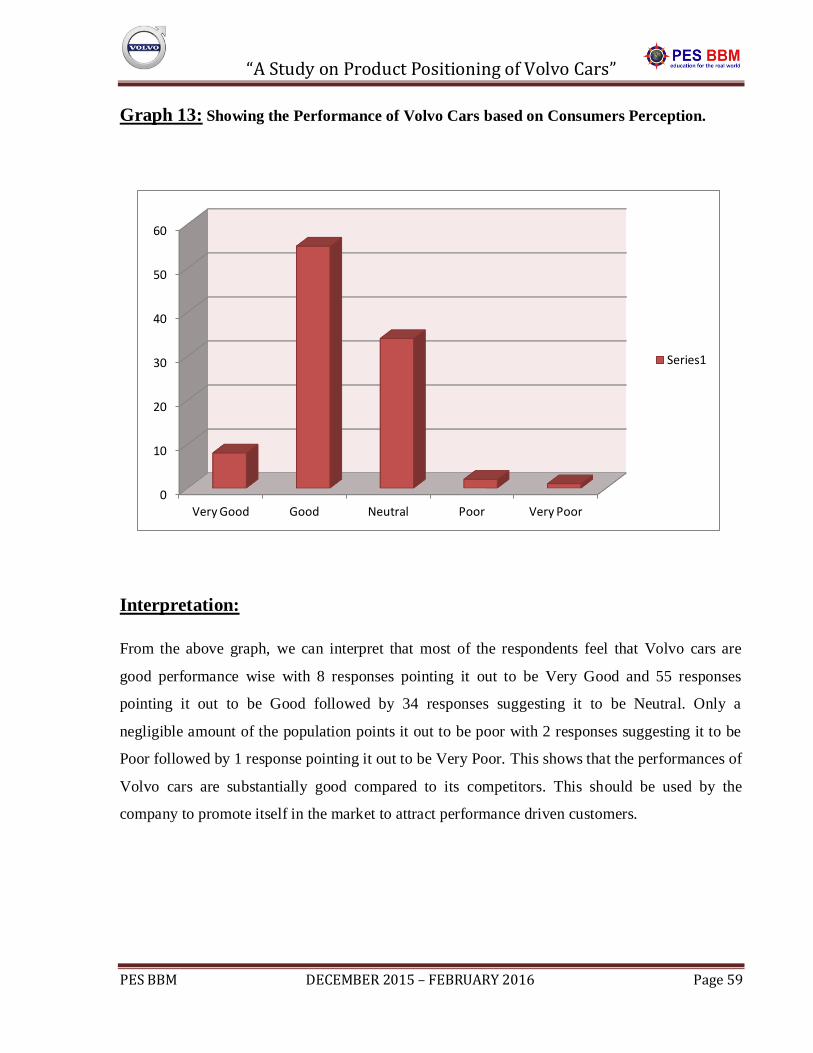
“A Study on Product Positioning of Volvo Cars”
PES BBM DECEMBER 2015 – FEBRUARY 2016 Page 59
Graph 13: Showing the Performance of Volvo Cars based on Consumers Perception.
Interpretation:
From the above graph, we can interpret that most of the respondents feel that Volvo cars are
good performance wise with 8 responses pointing it out to be Very Good and 55 responses
pointing it out to be Good followed by 34 responses suggesting it to be Neutral. Only a
negligible amount of the population points it out to be poor with 2 responses suggesting it to be
Poor followed by 1 response pointing it out to be Very Poor. This shows that the performances of
Volvo cars are substantially good compared to its competitors. This should be used by the
company to promote itself in the market to attract performance driven customers.
0
10
20
30
40
50
60
Very Good Good Neutral Poor Very Poor
Series1
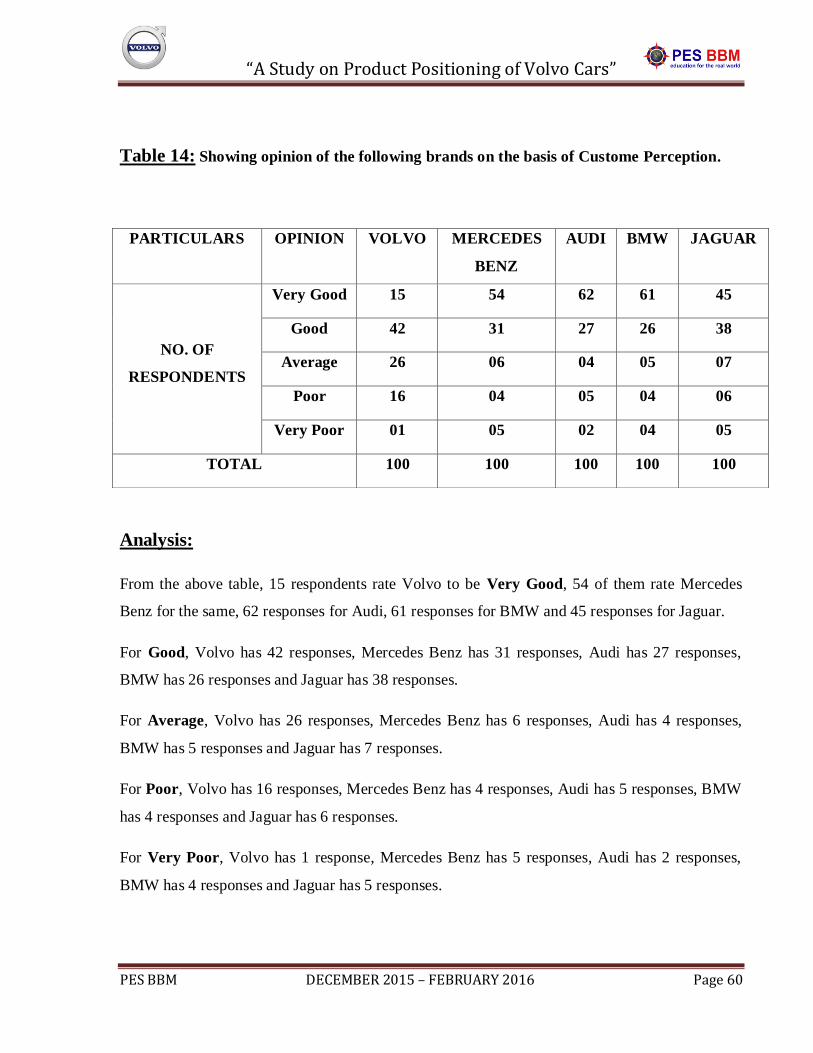
“A Study on Product Positioning of Volvo Cars”
PES BBM DECEMBER 2015 – FEBRUARY 2016 Page 60
Table 14: Showing opinion of the following brands on the basis of Custome Perception.
Analysis:
From the above table, 15 respondents rate Volvo to be Very Good, 54 of them rate Mercedes
Benz for the same, 62 responses for Audi, 61 responses for BMW and 45 responses for Jaguar.
For Good, Volvo has 42 responses, Mercedes Benz has 31 responses, Audi has 27 responses,
BMW has 26 responses and Jaguar has 38 responses.
For Average, Volvo has 26 responses, Mercedes Benz has 6 responses, Audi has 4 responses,
BMW has 5 responses and Jaguar has 7 responses.
For Poor, Volvo has 16 responses, Mercedes Benz has 4 responses, Audi has 5 responses, BMW
has 4 responses and Jaguar has 6 responses.
For Very Poor, Volvo has 1 response, Mercedes Benz has 5 responses, Audi has 2 responses,
BMW has 4 responses and Jaguar has 5 responses.
PARTICULARS OPINION VOLVO MERCEDES
BENZ
AUDI BMW JAGUAR
NO. OF
RESPONDENTS
Very Good 15 54 62 61 45
Good 42 31 27 26 38
Average 26 06 04 05 07
Poor 16 04 05 04 06
Very Poor 01 05 02 04 05
TOTAL 100 100 100 100 100
“A Study on Product Positioning of Volvo Cars”
PES BBM DECEMBER 2015 – FEBRUARY 2016 Page 61
Interpretation:
We can interpret this as the perception of respondents towards different competitors of Volvo.
Majority of the respondents choose Audi as the most preferred brand followed by BMW,
Mercedes Benz and Jaguar.
Based on the data obtained, Volvo seems to be in the last. This shows that Volvo should adopt
new strategies to improve themselves in the future.
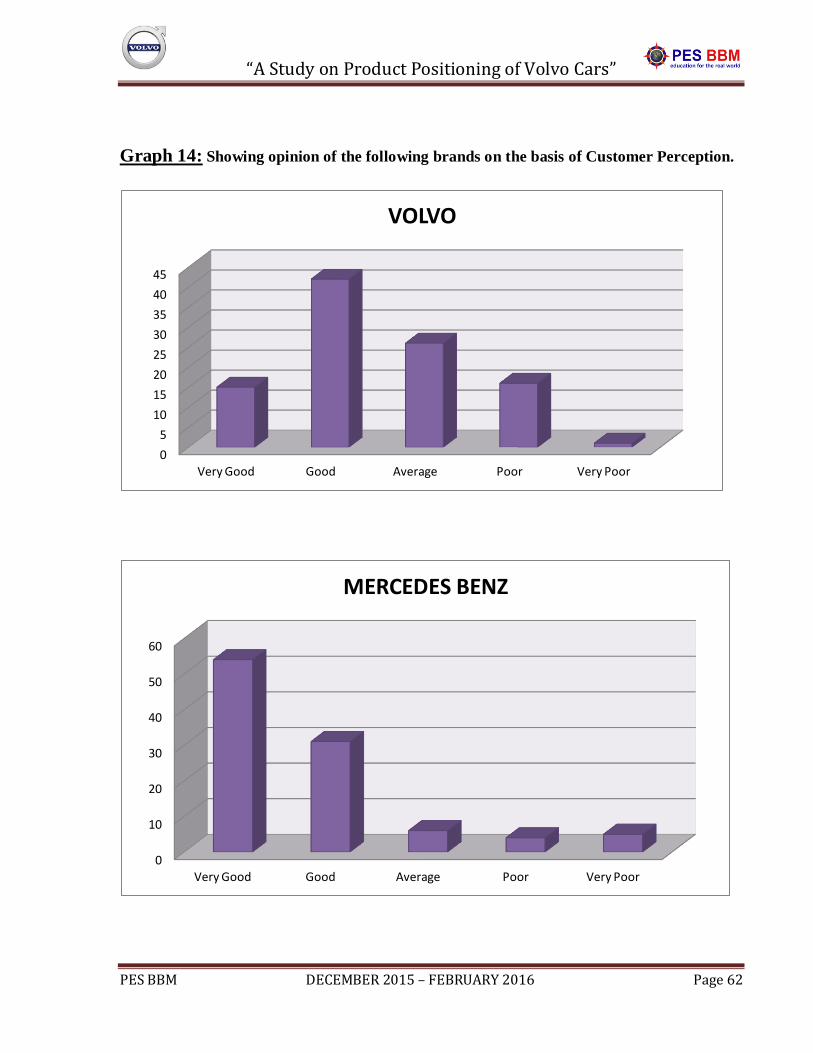
“A Study on Product Positioning of Volvo Cars”
PES BBM DECEMBER 2015 – FEBRUARY 2016 Page 62
Graph 14: Showing opinion of the following brands on the basis of Customer Perception.
0
5
10
15
20
25
30
35
40
45
Very Good Good Average Poor Very Poor
VOLVO
0
10
20
30
40
50
60
Very Good Good Average Poor Very Poor
MERCEDES BENZ
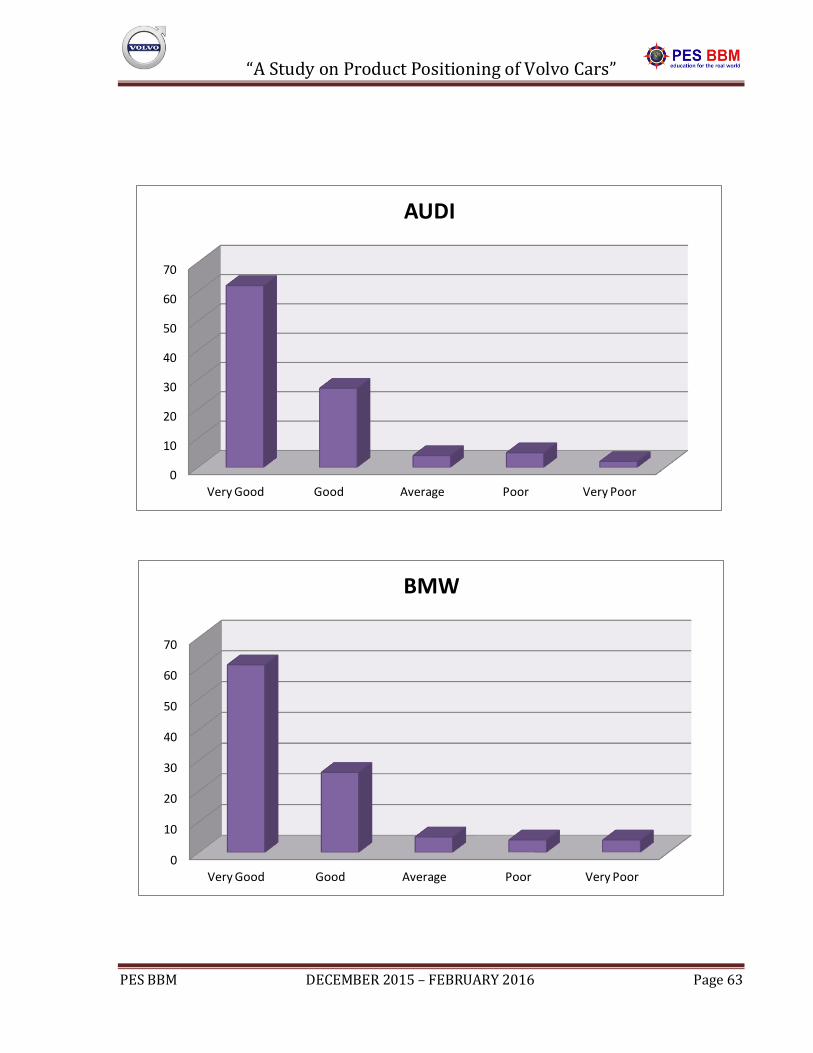
“A Study on Product Positioning of Volvo Cars”
PES BBM DECEMBER 2015 – FEBRUARY 2016 Page 63
0
10
20
30
40
50
60
70
Very Good Good Average Poor Very Poor
AUDI
0
10
20
30
40
50
60
70
Very Good Good Average Poor Very Poor
BMW
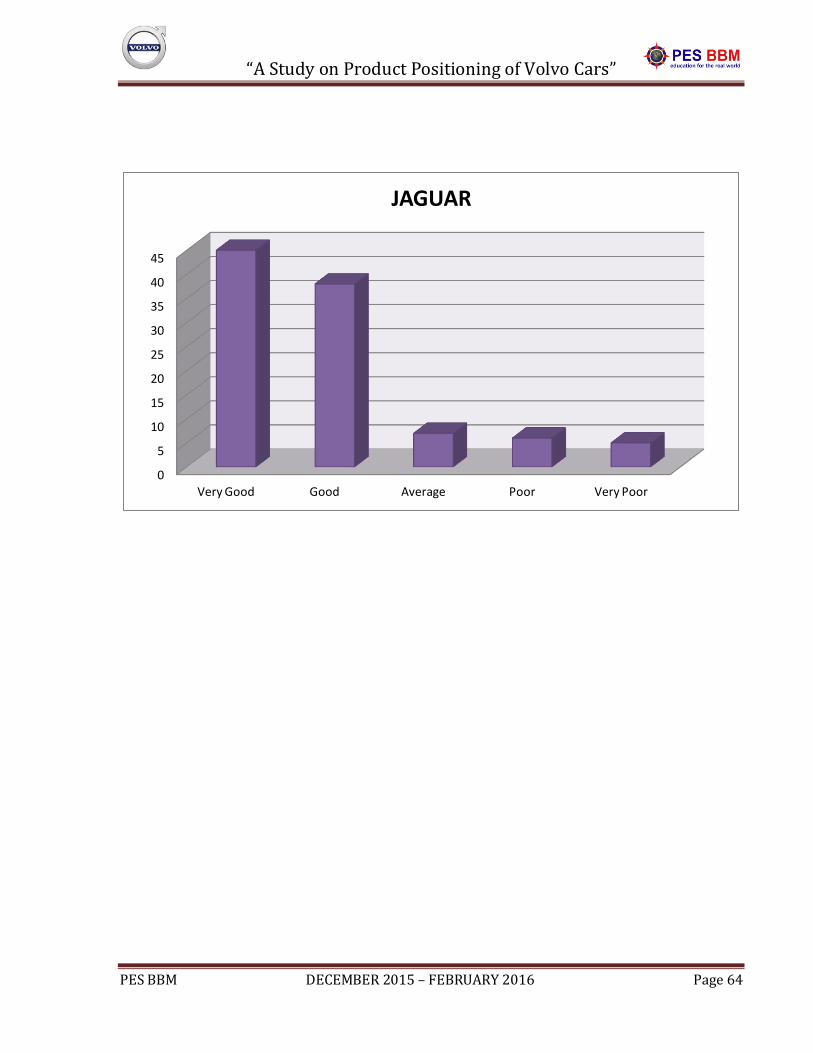
“A Study on Product Positioning of Volvo Cars”
PES BBM DECEMBER 2015 – FEBRUARY 2016 Page 64
0
5
10
15
20
25
30
35
40
45
Very Good Good Average Poor Very Poor
JAGUAR
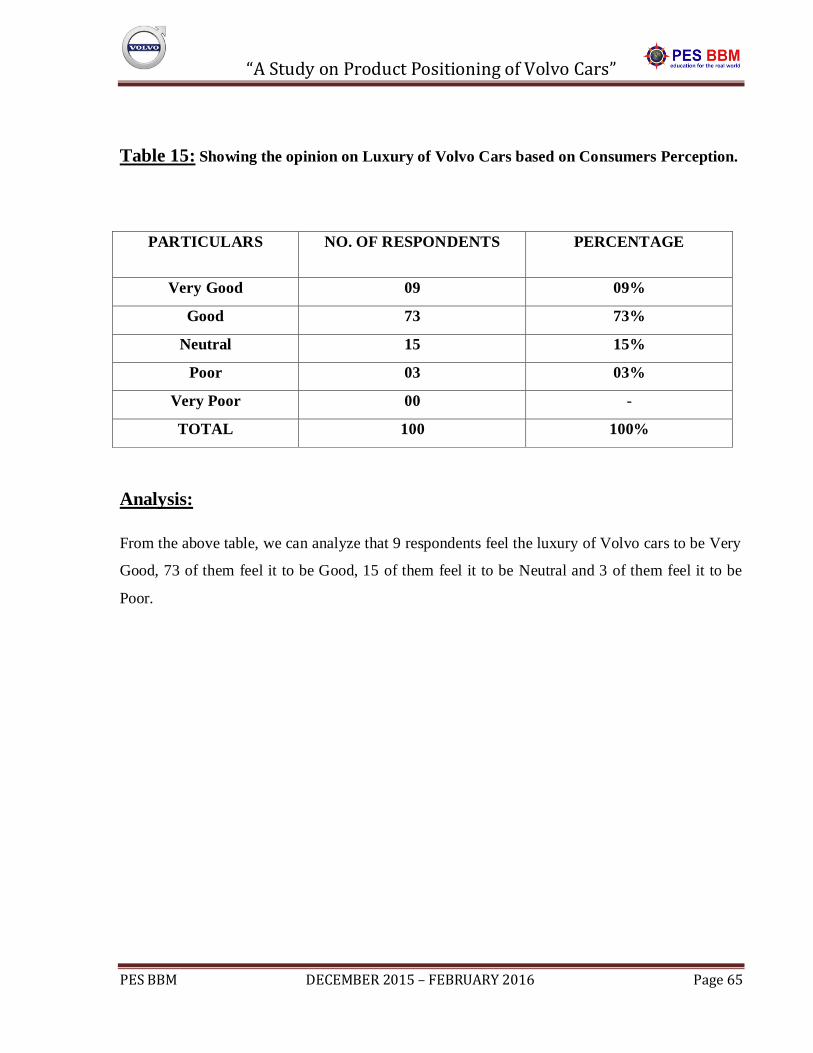
“A Study on Product Positioning of Volvo Cars”
PES BBM DECEMBER 2015 – FEBRUARY 2016 Page 65
Table 15: Showing the opinion on Luxury of Volvo Cars based on Consumers Perception.
PARTICULARS NO. OF RESPONDENTS PERCENTAGE
Very Good 09 09%
Good 73 73%
Neutral 15 15%
Poor 03 03%
Very Poor 00 -
TOTAL 100 100%
Analysis:
From the above table, we can analyze that 9 respondents feel the luxury of Volvo cars to be Very
Good, 73 of them feel it to be Good, 15 of them feel it to be Neutral and 3 of them feel it to be
Poor.
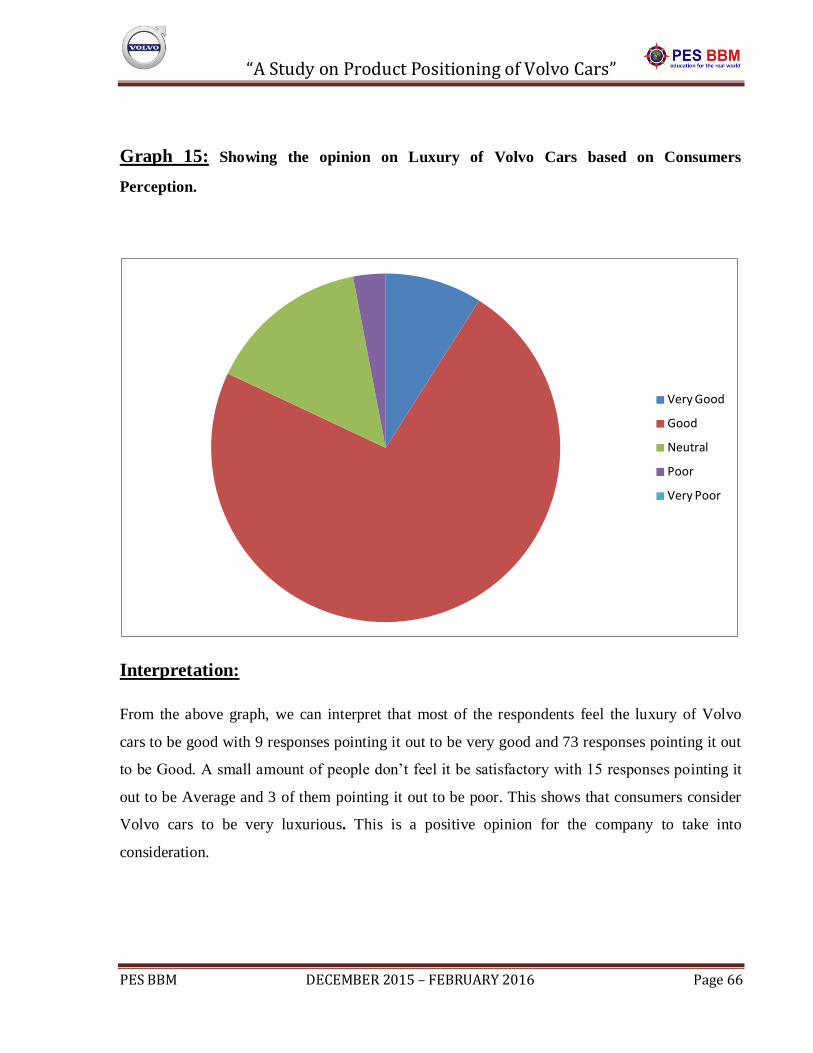
“A Study on Product Positioning of Volvo Cars”
PES BBM DECEMBER 2015 – FEBRUARY 2016 Page 66
Graph 15: Showing the opinion on Luxury of Volvo Cars based on Consumers
Perception.
Interpretation:
From the above graph, we can interpret that most of the respondents feel the luxury of Volvo
cars to be good with 9 responses pointing it out to be very good and 73 responses pointing it out
to be Good. A small amount of people don’t feel it be satisfactory with 15 responses pointing it
out to be Average and 3 of them pointing it out to be poor. This shows that consumers consider
Volvo cars to be very luxurious. This is a positive opinion for the company to take into
consideration.
Very Good
Good
Neutral
Poor
Very Poor
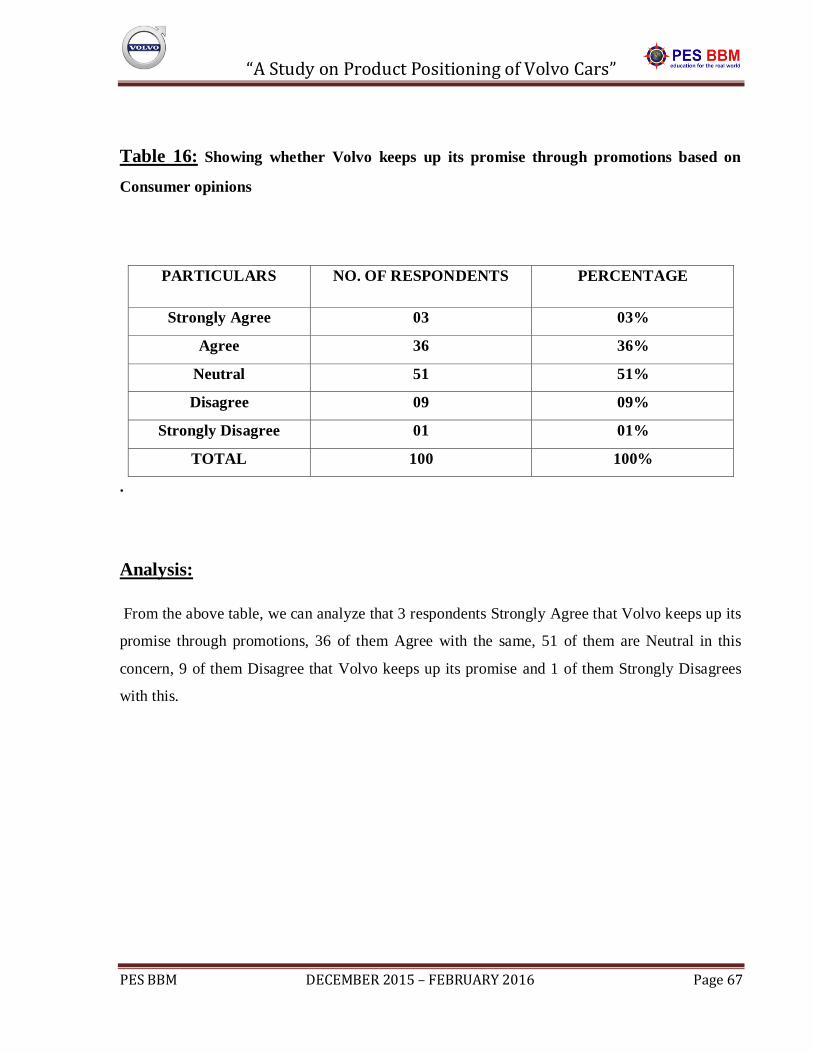
“A Study on Product Positioning of Volvo Cars”
PES BBM DECEMBER 2015 – FEBRUARY 2016 Page 67
Table 16: Showing whether Volvo keeps up its promise through promotions based on
Consumer opinions
.
Analysis:
From the above table, we can analyze that 3 respondents Strongly Agree that Volvo keeps up its
promise through promotions, 36 of them Agree with the same, 51 of them are Neutral in this
concern, 9 of them Disagree that Volvo keeps up its promise and 1 of them Strongly Disagrees
with this.
PARTICULARS NO. OF RESPONDENTS PERCENTAGE
Strongly Agree 03 03%
Agree 36 36%
Neutral 51 51%
Disagree 09 09%
Strongly Disagree 01 01%
TOTAL 100 100%
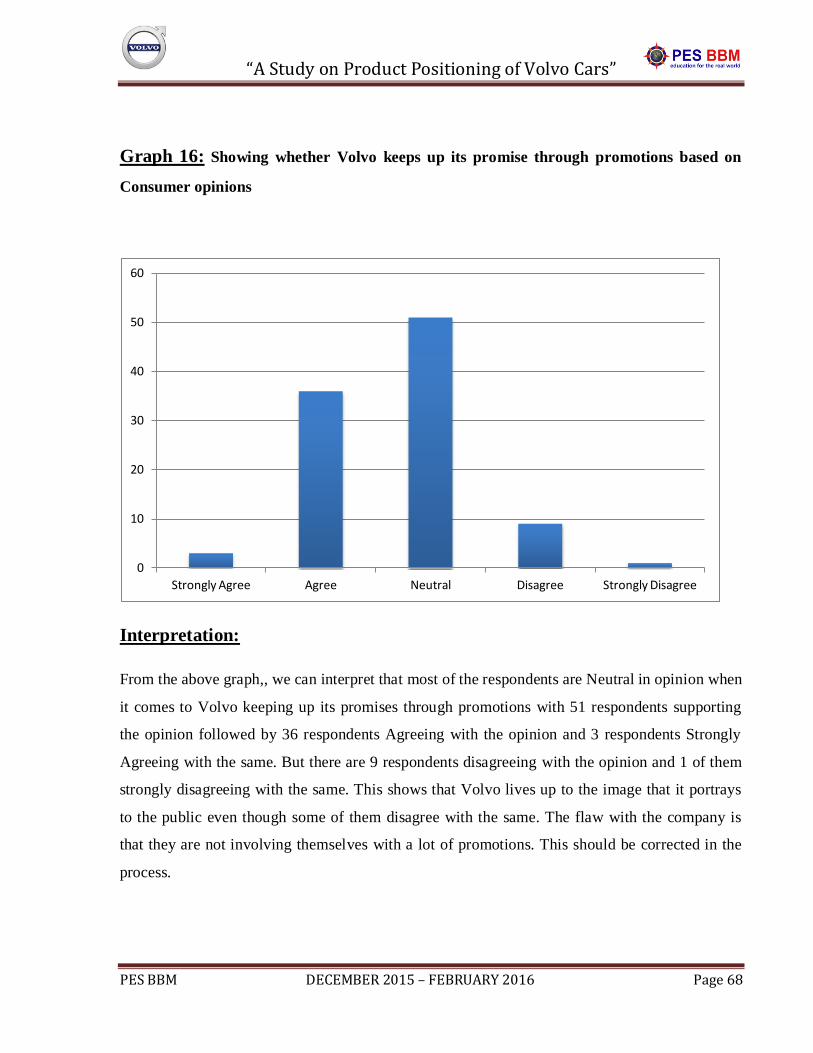
“A Study on Product Positioning of Volvo Cars”
PES BBM DECEMBER 2015 – FEBRUARY 2016 Page 68
Graph 16: Showing whether Volvo keeps up its promise through promotions based on
Consumer opinions
Interpretation:
From the above graph,, we can interpret that most of the respondents are Neutral in opinion when
it comes to Volvo keeping up its promises through promotions with 51 respondents supporting
the opinion followed by 36 respondents Agreeing with the opinion and 3 respondents Strongly
Agreeing with the same. But there are 9 respondents disagreeing with the opinion and 1 of them
strongly disagreeing with the same. This shows that Volvo lives up to the image that it portrays
to the public even though some of them disagree with the same. The flaw with the company is
that they are not involving themselves with a lot of promotions. This should be corrected in the
process.
0
10
20
30
40
50
60
Strongly Agree Agree Neutral Disagree Strongly Disagree
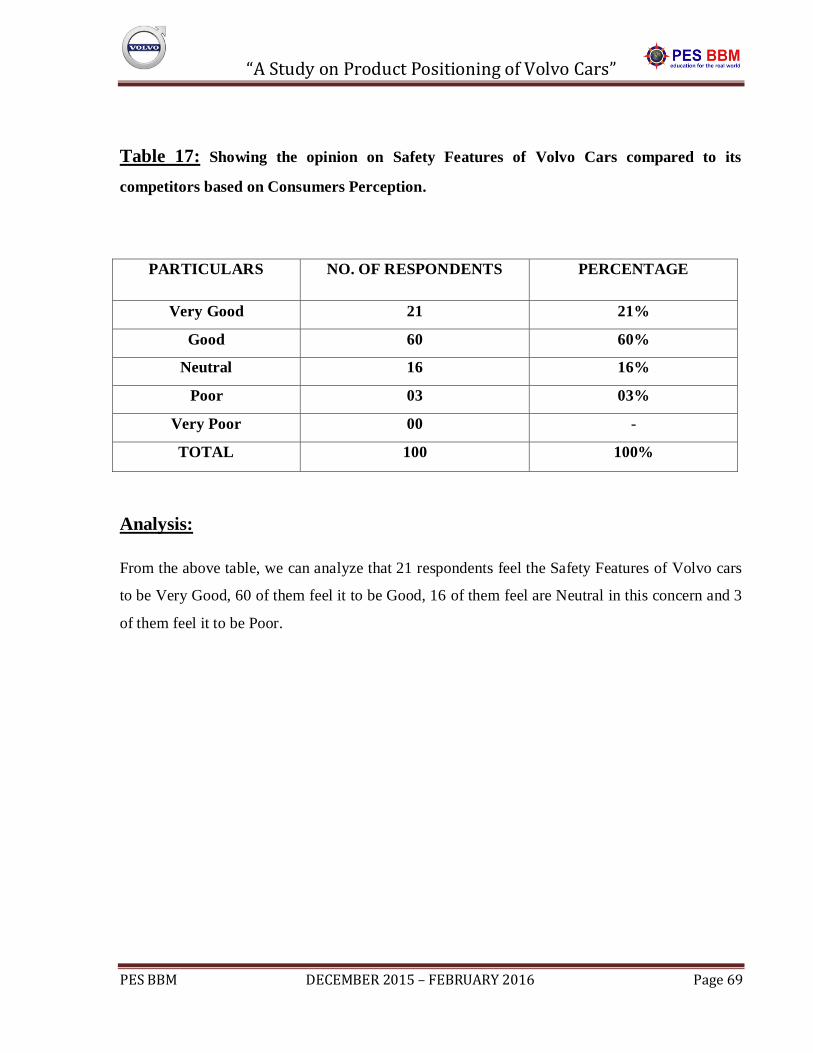
“A Study on Product Positioning of Volvo Cars”
PES BBM DECEMBER 2015 – FEBRUARY 2016 Page 69
Table 17: Showing the opinion on Safety Features of Volvo Cars compared to its
competitors based on Consumers Perception.
PARTICULARS NO. OF RESPONDENTS PERCENTAGE
Very Good 21 21%
Good 60 60%
Neutral 16 16%
Poor 03 03%
Very Poor 00 -
TOTAL 100 100%
Analysis:
From the above table, we can analyze that 21 respondents feel the Safety Features of Volvo cars
to be Very Good, 60 of them feel it to be Good, 16 of them feel are Neutral in this concern and 3
of them feel it to be Poor.
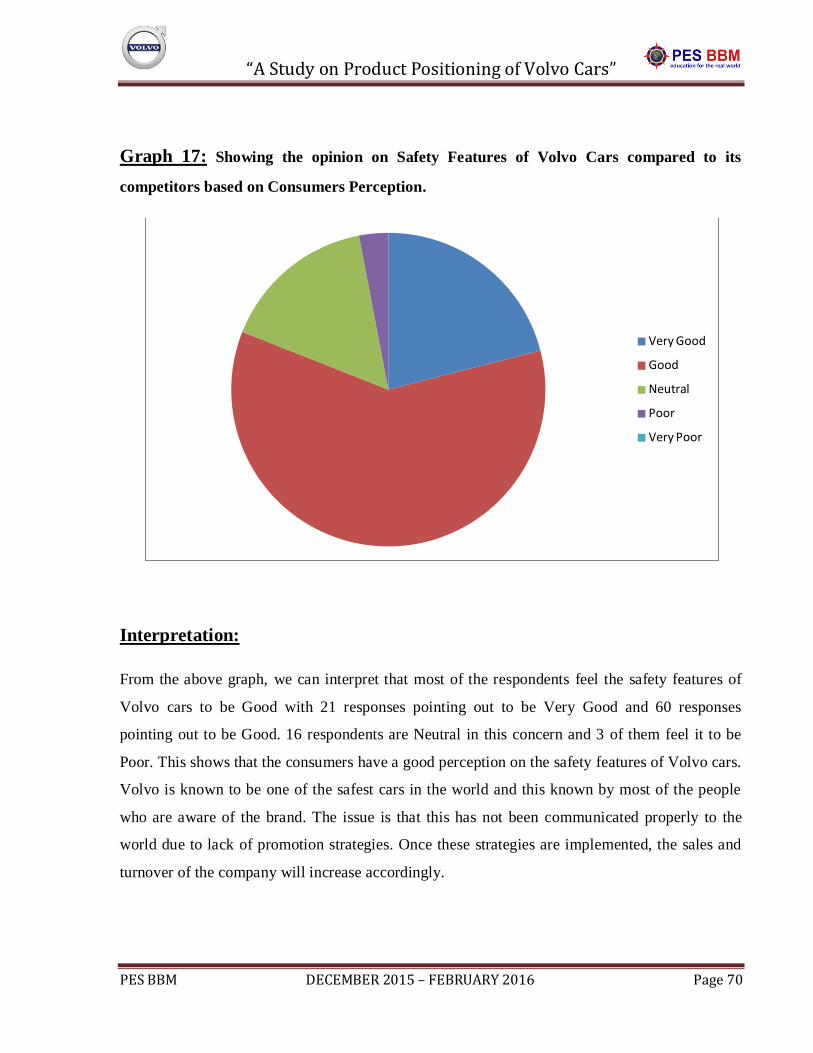
“A Study on Product Positioning of Volvo Cars”
PES BBM DECEMBER 2015 – FEBRUARY 2016 Page 70
Graph 17: Showing the opinion on Safety Features of Volvo Cars compared to its
competitors based on Consumers Perception.
Interpretation:
From the above graph, we can interpret that most of the respondents feel the safety features of
Volvo cars to be Good with 21 responses pointing out to be Very Good and 60 responses
pointing out to be Good. 16 respondents are Neutral in this concern and 3 of them feel it to be
Poor. This shows that the consumers have a good perception on the safety features of Volvo cars.
Volvo is known to be one of the safest cars in the world and this known by most of the people
who are aware of the brand. The issue is that this has not been communicated properly to the
world due to lack of promotion strategies. Once these strategies are implemented, the sales and
turnover of the company will increase accordingly.
Very Good
Good
Neutral
Poor
Very Poor
“A Study on Product Positioning of Volvo Cars”
PES BBM DECEMBER 2015 – FEBRUARY 2016 Page 71
CHAPTER 5:
FINDINGS, SUGGESTIONS AND CONCLUSIONS
FINDINGS
The data obtained from various sources via survey method among potential customers, future
potential customers and present customers with the help of personal interviews questionnaires
refers to the findings of the whole study.
The findings are as follows:
Most of the customers of Volvo cars belong to the same class of individuals.
Volvo promotes its products through various mediums such as Television, Newspapers &
Magazines, Billboards, Internet, Radio as well as Word of Mouth
Volvo advertisements are seldom seen by the public.
Major portion of respondents as well as customers of Volvo cars are Male than Female.
Most of the potential customers are businessmen.
Volvo should increase its advertising in the Television segment more than the other than the
other advertising mediums.
Volvo should invest more in advertising their brand to gain attention and interest in their
products.
Volvo advertisements are effective on consumers making it a positive characteristic of the
company.
Volvo has to find new methods to penetrate the Indian market, especially the Bangalore
luxury cars market by using innovative methods to promote themselves to increase their sales
as well as brand value. Hosting events and involving in other social activities can help them in
doing so.
The build qualities of Volvo cars are better compared to its competitors.
“A Study on Product Positioning of Volvo Cars”
PES BBM DECEMBER 2015 – FEBRUARY 2016 Page 72
Volvo has strategically priced its cars compared to its competitors.
Consumers prefer luxury more than any other feature. The younger generation mainly gives
importance to performance and design.
Volvo has not pierced into the market properly and has to come up with innovative ideas to
place themselves in the Indian luxury Car Market, especially the Bangalore Luxury Car
Market so as increase their sales. Suggestions from consumers play a vital role in deciding the
fate of a company as it gives an insight into the position of the brand in the market according
to them. Thus, Volvo should improve themselves to improve their Brand Image.
More than the other strategies available to improve itself, Volvo is lacking promotional
strategies to be distinctive to its competitors. Thus Volvo should primarily focus on increasing
its promotion to develop itself followed by developing new positional strategies and
increasing production. With these improvements, price won’t be a matter for customers.
Respondents also mentioned to increase the number of outlets in the city to develop itself in
the future. This should also be kept in mind.
The total ergonomics of the vehicles built by Volvo are of superior quality. Thus, Volvo
should improve itself with communication strategies and value added services.
Volvo is a premium car manufacturer in the market.
The performances of Volvo cars are substantially good compared to its competitors. This
should be used by the company to promote itself in the market to attract performance driven
customers.
The perception of respondents towards different competitors of Volvo shows that Volvo has
not yet penetrated the market properly.
Majority of the respondents choose Audi as the most preferred brand followed by BMW,
Mercedes Benz and Jaguar. Based on the data obtained, Volvo seems to be in the last. This
shows that Volvo should adopt new strategies to improve themselves in the future.
Consumers consider Volvo cars to be very luxurious. This is a positive opinion for the
company to take into consideration.
“A Study on Product Positioning of Volvo Cars”
PES BBM DECEMBER 2015 – FEBRUARY 2016 Page 73
Volvo lives up to the image that it portrays to the public even though some of them disagree
with the same. The flaw with the company is that they are not involving themselves with a lot
of promotions. This should be corrected in the process.
The consumers have a good perception on the safety features of Volvo cars. Volvo is known
to be one of the safest cars in the world and this known by most of the people who are aware
of the brand. The issue is that this has not been communicated properly to the world due to
lack of promotion strategies. Once these strategies are implemented, the sales and turnover of
the company will increase accordingly.
“A Study on Product Positioning of Volvo Cars”
PES BBM DECEMBER 2015 – FEBRUARY 2016 Page 74
SUGGESTIONS
The study conducted for analyzing the product positioning of Volvo cars revealed the strengths
and weaknesses of the marketing strategies applied by the company. Thus through intense study
and on the basis of suggestions taken from potential customers, the following suggestions might
of great help for Volvo and its dealers to improve their position in the market in the future:
The company should give more importance to promotions.
Brand awareness should be created so as to increase the Brand Image.
The company should involve itself in social activities so as to show their presence in the
market and create interest among customers.
The pricing of the cars should be decreased.
The company should give intense publicity to the marketing programs and the awareness
programs and to their benefits in order to ensure maximum participation from customers and
dealer convenience.
Outdoor sales promotion concentration should be emphasized upon.
Easy availability of accessories.
Television advertising should be emphasized upon.
Customer service improvisation.
Organize exhibitions to educate customers about the latest products.
“A Study on Product Positioning of Volvo Cars”
PES BBM DECEMBER 2015 – FEBRUARY 2016 Page 75
CONCLUSION
The analysis entitled “a study on product positioning of Volvo cars “ in the context of marketing
Volvo cars, in view of other objectives of research i.e., the problems faced by dealers, customers
of Volvo products making some useful suggestions for Volvo, its dealers and most of all, its
customers.
The best efforts have been made to make the study fruitful, although the time span was not
enough for a detailed study, in the limited time span, I was able to succeed somewhat towards
the respondents aim.
Volvo is using the sales promotional tools like television, billboards, newspapers, magazines,
radio, word- of –mouth communication, displays and press launches to promote its products so
as to position itself in a positive way.
The product positioning of Volvo is very effective. The awareness and marketing programs of
Volvo are helpful in a way but more emphasis should be given upon increasing the promotion of
the brand as a whole so as to raise awareness in both urban and rural areas as potential customers
can be based anywhere.
So it can be concluded that Volvo should give more importance to its promotional strategies and
reduce the price at the same time.