Chapter 1 Oil and LNG Imports and Trade Flow Outlook · Oil and LNG Imports and Trade Flow Outlook...
12
Chapter 1 Oil and LNG Imports and Trade Flow Outlook November 2016 This chapter should be cited as ERIA (2016), ‘Oil and LNG Imports and Trade Flow Outlook’, in Kimura, S., T. Morikawa and S. Singh (eds.), Sea Lane Security of Oil and Liquefied Natural Gas in the EAS Region. ERIA Research Project Report 2015-14, Jakarta: ERIA, pp.1-12.
-
Upload
truongnhan -
Category
Documents
-
view
232 -
download
1
Transcript of Chapter 1 Oil and LNG Imports and Trade Flow Outlook · Oil and LNG Imports and Trade Flow Outlook...

Chapter 1
Oil and LNG Imports and Trade Flow Outlook
November 2016
This chapter should be cited as
ERIA (2016), ‘Oil and LNG Imports and Trade Flow Outlook’, in Kimura, S., T. Morikawa and S. Singh (eds.), Sea Lane Security of Oil and Liquefied Natural Gas in the EAS Region. ERIA Research Project Report 2015-14, Jakarta: ERIA, pp.1-12.
1
Chapter 1
Oil and LNG Imports and Trade Flow Outlook
1. Oil
1.1. Trade
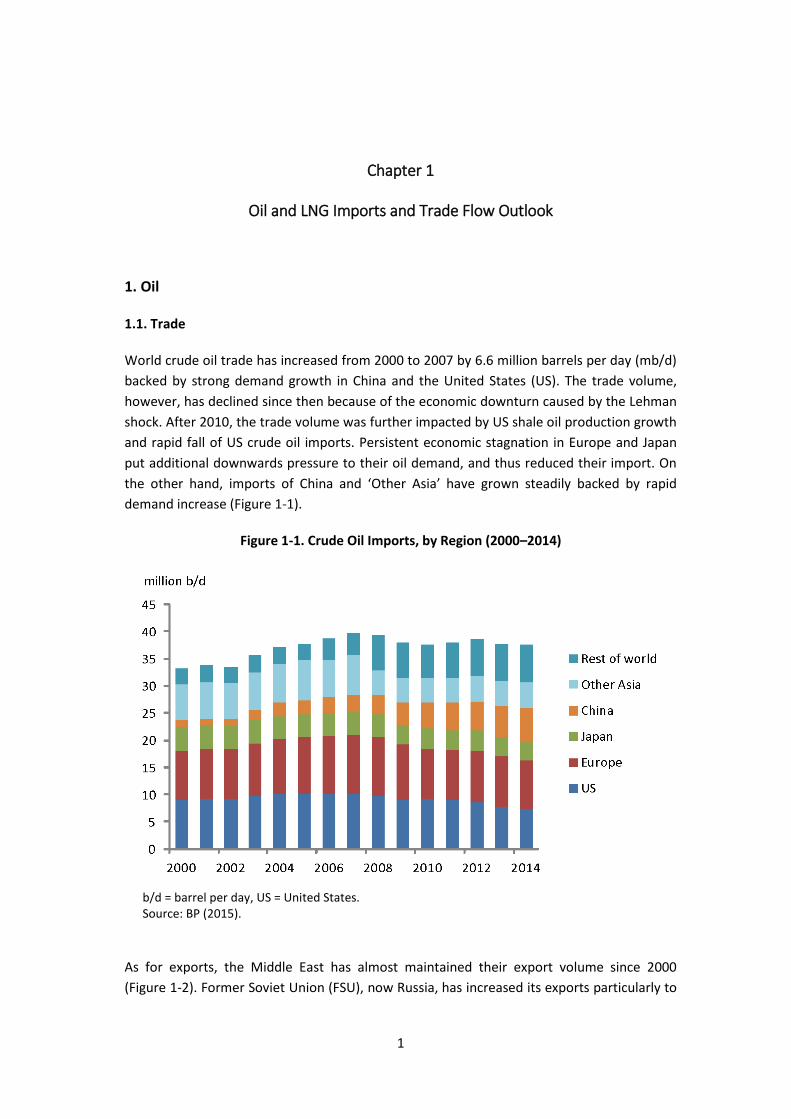
World crude oil trade has increased from 2000 to 2007 by 6.6 million barrels per day (mb/d)
backed by strong demand growth in China and the United States (US). The trade volume,
however, has declined since then because of the economic downturn caused by the Lehman
shock. After 2010, the trade volume was further impacted by US shale oil production growth
and rapid fall of US crude oil imports. Persistent economic stagnation in Europe and Japan
put additional downwards pressure to their oil demand, and thus reduced their import. On
the other hand, imports of China and ‘Other Asia’ have grown steadily backed by rapid
demand increase (Figure 1-1).
Figure 1-1. Crude Oil Imports, by Region (2000–2014)
b/d = barrel per day, US = United States. Source: BP (2015).
As for exports, the Middle East has almost maintained their export volume since 2000
(Figure 1-2). Former Soviet Union (FSU), now Russia, has increased its exports particularly to

2
the Asian market though Africa and Latin America have failed to maintain their export
volume. This is, because in some African countries such as Libya and Nigeria, civil strife or
political instability has hindered steady production and exports. As for Latin America, the US
used to be the biggest market for their crude oil exports, but tough competition from
Canadian crude oil and increased shale oil production in the US significantly narrowed export
windows for their crude oil.
Figure 1-2. Crude oil exports by Region (2000–2014)
FSU = Former Soviet Union. Source: BP (2015).
It is highly likely that oil demand in Asia will continue to grow (Table 1-1). China has led the
demand growth in the region since the mid-2000s, and it will remain so with imports of 12
mb/d in 2040, by far the largest in the world. South Asia, importing 9 mb/d and the
Association of Southeast Asian Nations (ASEAN), importing 7 mb/d, will also emerge as other
demand giants towards 2040. Oil production in Asia- Pacific will either decline or maintain at
best, the region will continue to be the major oil importer in the world. Thus, the share of
Asia-Pacific in world crude oil imports will increase from 48 percent in 2014 to 71 percent in
2040.
Meanwhile, Asia-Pacific shares only 2 percent of the world crude oil export in 2014, and the
share will further decrease towards 2040 due to decline of production in the region (Table 1-
2). Europe will be even more negative; the export of which will be negligible in 2030
onwards. The US and Canada are expected to increase their export, thanks to their shale
revolution to a certain extent. FSU and Africa will expand their exports gradually too. North

3
America, FSU, and Africa will contribute to diversify export sources of Asian importers;
however, the Middle East will clearly remain by far the largest export region in the
foreseeable future with 25mb/d export in 2040, sharing 52 percent of the world total.
Table 1-1. Crude Oil Import Outlook (2014–2040)
ASEAN = Association of Southeast Asian Nations; FSU = Former Soviet Union; US = United States. Source: IEEJ.
Table 1-2. Crude Oil Export Outlook, by Region (2014–2040)
ASEAN = Association of Southeast Asian Nations; FSU = Former Soviet Union; US = United States. Source: IEEJ.

4
1.1.2. Trade flow and shipping frequency through major choke points
Being by far the largest export region, the Middle East is currently the origin of the major
crude oil flow (Figure 1-3). It exported 12 mb/d to Asia, 2 mb/d to Europe, and 2 mb/d to
North America in 2014. This is followed by the flows from non-Organisation for Economic
Co-operation and Development (OECD) Europe/Central Asia, mostly Russia to Europe
(4mb/d), Africa to Europe (3mb/d), and Latin America to North America (2mb/d).
Figure 1-3. Major Interregional Oil Flows (2014)
ASEAN = Association of Southeast Asian Nations; OECD = Organisation for Economic Co-operation and Development. Source: IEEJ.
There is no doubt that, among various choke points in the world, the Hormuz and
Malacca/Singapore Straits will be the two most important passages for oil trade for Asia. In
the last several years in the 2010s, dependence on Middle Eastern crude oil has eased
because of a larger volume of crude imports from non-Middle Eastern sources such as
Russia, Africa, and Latin America. Figure 1-4 represents the growing oil demand in Asia that
will be largely met by the Middle East because of its development cost competitiveness and
geographical proximity, although the growth rate will slow down after 2030 due to demand
growth in the Middle East. This means the dependence on the two important choke points
will inevitably increase.
It should be noted that this oil flow outlook only concerns crude oil rather than oil products.
Should oil products and liquefied petroleum gas (LPG) be included, the total oil flow (i.e.
5
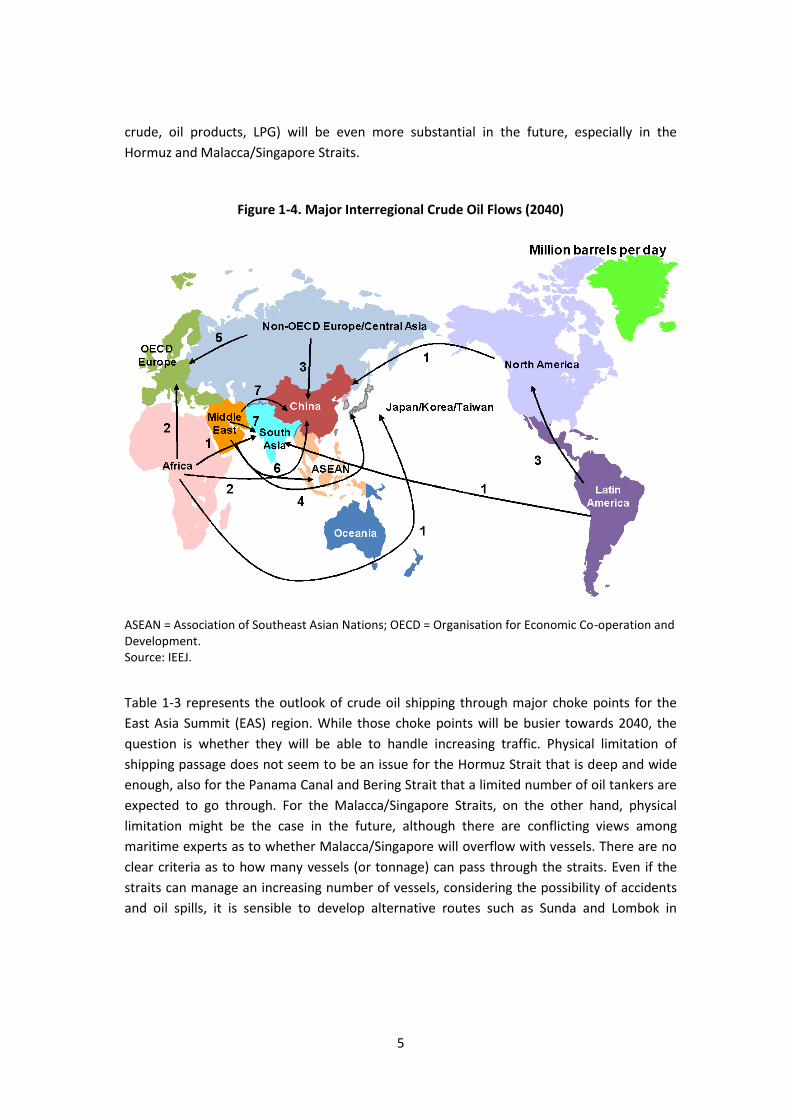
crude, oil products, LPG) will be even more substantial in the future, especially in the
Hormuz and Malacca/Singapore Straits.
Figure 1-4. Major Interregional Crude Oil Flows (2040)
ASEAN = Association of Southeast Asian Nations; OECD = Organisation for Economic Co-operation and Development. Source: IEEJ.
Table 1-3 represents the outlook of crude oil shipping through major choke points for the
East Asia Summit (EAS) region. While those choke points will be busier towards 2040, the
question is whether they will be able to handle increasing traffic. Physical limitation of
shipping passage does not seem to be an issue for the Hormuz Strait that is deep and wide
enough, also for the Panama Canal and Bering Strait that a limited number of oil tankers are
expected to go through. For the Malacca/Singapore Straits, on the other hand, physical
limitation might be the case in the future, although there are conflicting views among
maritime experts as to whether Malacca/Singapore will overflow with vessels. There are no
clear criteria as to how many vessels (or tonnage) can pass through the straits. Even if the
straits can manage an increasing number of vessels, considering the possibility of accidents
and oil spills, it is sensible to develop alternative routes such as Sunda and Lombok in
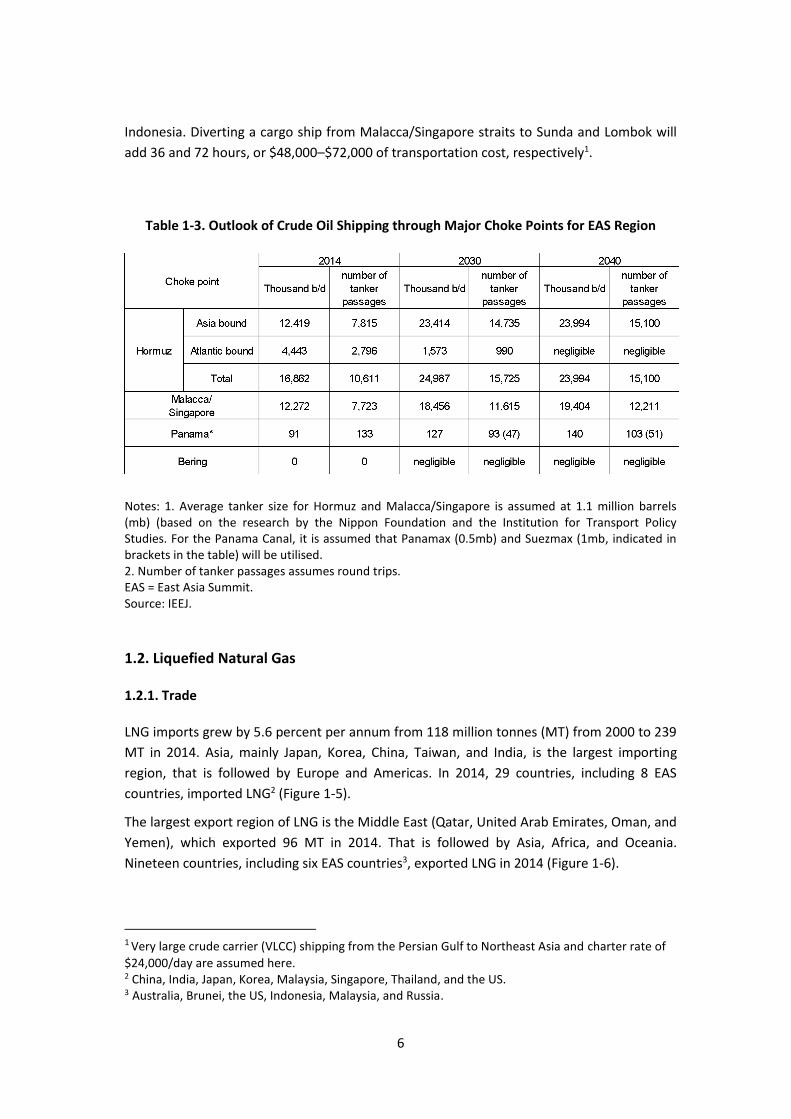
6
Indonesia. Diverting a cargo ship from Malacca/Singapore straits to Sunda and Lombok will
add 36 and 72 hours, or $48,000–$72,000 of transportation cost, respectively1.
Table 1-3. Outlook of Crude Oil Shipping through Major Choke Points for EAS Region
Notes: 1. Average tanker size for Hormuz and Malacca/Singapore is assumed at 1.1 million barrels (mb) (based on the research by the Nippon Foundation and the Institution for Transport Policy Studies. For the Panama Canal, it is assumed that Panamax (0.5mb) and Suezmax (1mb, indicated in brackets in the table) will be utilised. 2. Number of tanker passages assumes round trips. EAS = East Asia Summit. Source: IEEJ.
1.2. Liquefied Natural Gas
1.2.1. Trade
LNG imports grew by 5.6 percent per annum from 118 million tonnes (MT) from 2000 to 239
MT in 2014. Asia, mainly Japan, Korea, China, Taiwan, and India, is the largest importing
region, that is followed by Europe and Americas. In 2014, 29 countries, including 8 EAS
countries, imported LNG2 (Figure 1-5).
The largest export region of LNG is the Middle East (Qatar, United Arab Emirates, Oman, and
Yemen), which exported 96 MT in 2014. That is followed by Asia, Africa, and Oceania.
Nineteen countries, including six EAS countries3, exported LNG in 2014 (Figure 1-6).
1 Very large crude carrier (VLCC) shipping from the Persian Gulf to Northeast Asia and charter rate of
$24,000/day are assumed here. 2 China, India, Japan, Korea, Malaysia, Singapore, Thailand, and the US. 3 Australia, Brunei, the US, Indonesia, Malaysia, and Russia.

7
Figure 1-5. LNG Imports, by Region (2000–2014)
LNG = liquefied natural gas; MT = million tonne. Source: GIIGNL (2015).
Figure 1-6. LNG Exports, by Region (2000–2014)
FSU = Former Soviet Union; LNG = liquefied natural gas; MT = million tonne. Source: GIIGNL (2015).
Table 1-4 represents LNG import outlook towards 2040. With robust natural gas demand
and inadequate supply growth, international trade of natural gas, especially in the form of
LNG, is likely to increase rapidly towards 2040. According to the IEEJ, LNG demand in Asia
will expand from 179 MT in 2014 to as much as 394 MT in 2040.

8
However, the forecast situations may vary from country to country. Japan, the largest LNG
importer in the world, will greatly decrease its imports mainly due to the restart of its
nuclear power plants, renewable expansion, and energy efficiency. Korea is expected to
follow a similar path with its expansion of nuclear and coal-fired power generation. Despite
the uncertainty in terms of the extent of energy efficiency, gas-fired power generation in the
power mix, and pipeline gas imports, China will be the largest LNG importing country in the
world in 2040. Compared with Northeast Asia, other regions will remain minor importers.
Nevertheless, with 62 MT, India will be the third largest LNG importer in the world in 2040.
LNG imports in Southeast Asian countries will quickly reach 70 MT in 2040. While Europe will
import significantly more in the future, the import growth potential in Oceania, North
America, and South America is limited towards 2040.
Table 1-4. LNG Import Outlook
Source: IEEJ.

9
Table 1-5 represents the LNG export outlook towards 2040. The biggest change in terms of
LNG export towards 2040 is the emergence of North America as a significant export region.
Thanks to the shale revolution, the region, especially the US, is rapidly developing export
capacity. Exporting the first cargo from the Gulf of Mexico in 2016, the US export will reach
as much as 95 MT in 2040. Oceania, mainly Australia, is expanding capacity too. Together
with Papua New Guinea, the region will export as much as the US in 2040. The Middle East,
on the other hand, will export less in 2020 mainly due to feed gas shortage as well as losing
market share. However, the LNG demand growth will call for Middle East supplies in 2030
onwards, and the Middle East will pick up its export quickly.
Table 1-5. LNG Export Outlook
ASEAN = Association of Southeast Asian Nations; FSU = Former Soviet Union; S&C America = South and Central America; US = United States. Source: IEEJ.
1.2.2. Trade flow and shipping frequency through major choke points
Figure 1-7 indicates major LNG flows in 2014. Flows are from the Middle East to Asia (74
MT), Southeast Asia to Northeast Asia (48 MT), Oceania to Asia (27 MT), the Middle East to
Europe (18 MT), and Africa to Europe (15 MT). With excessive supply to Europe, 6MT was
reloaded at European LNG terminals and re-exported to Asia and Latin America.
Figure 1-8 outlooks major LNG flows in 2040. Major choke points like Hormuz and
Malacca/Singapore straits will remain important especially for Asian countries, although LNG
flows will be more diversified. Panama and Bering will emerge as new choke points since the
US will be the third largest LNG exporter by 2020 and the giant Yamal LNG in Arctic will start
operation by 2020. For Atlantic market, Hormuz, Bab al-Mandab, and Suez will remain
critical especially for the cargoes from Middle East. With commercialisation of East African
LNG in Mozambique and possibly Tanzania and regasification terminals in Sub Sahara Africa
might make Cape of Good Hope and Mozambique Channel significant choke points, too.

10
Figure 1-7. Major LNG Flows (2014)
Source: GIIGNL (2015).
Figure 1-8. Major LNG Flows (2040)
ASEAN = Association of Southeast Asian Nations; LNG = liquefied natural gas; OECD = Organisation for Economic Co-operation and Development. Source: IEEJ.

11
Taking future flow changes into account, the Hormuz Strait, Malacca/Singapore Straits, the
Panama Canal, and the Bering Strait are the most important choke points for LNG supplies to
Asian countries.
Table 1-6 represents the outlook of LNG shipping through major choke points for the EAS
region. With robust demand growth, major choke points will clearly be busier with more
LNG tankers. Hormuz and Malacca/Singapore Straits will remain the busiest of all. With
existing exporters, Qatar and the United Arab Emirates, it is assumed that Iran will start
exporting LNG in the 2020s. Panama and Bering traffic will pick up quickly, but not to the
extent of the Hormuz and Malacca/Singapore Straits. The latter will not only accommodate
east bound tankers mainly from the Middle East and Africa to meet the demand mainly in
Northeast Asia but also some west bound tankers mainly from Australia to Malaysian and
Singaporean regasification terminals.
Therefore, as mentioned in Section 1.2, diverting away from Malacca/Singapore could be a
reality in the future. Should that be the case, there would be additional shipping hours and
the cost would be $56,000–$84,0004.
Table 1-6. Outlook of LNG Shipping through Major Choke Points for the EAS Region
Note: 1. Tanker size is assumed to be 170,000 cubic meter (79,000 tonnes) 2. Number of tanker passages assumes round trips. Source: IEEJ.
4 Tanker rate of $28,000 is assumed here.