Chapter 1 · moderate upturn in investment and a pick-up in trade growth. Global GDP growth is...
45
OECD Economic Outlook, Volume 2017 Issue 2 © OECD 2017 11 Chapter 1 GENERAL ASSESSMENT OF THE MACROECONOMIC SITUATION
Transcript of Chapter 1 · moderate upturn in investment and a pick-up in trade growth. Global GDP growth is...

OECD Economic Outlook, Volume 2017 Issue 2
© OECD 2017
11
Chapter 1
GENERAL ASSESSMENTOF THE MACROECONOMIC SITUATION

1. GENERAL ASSESSMENT OF THE MACROECONOMIC SITUATION
OECD ECONOMIC OUTLOOK, VOLUME 2017 ISSUE 2 © OECD 201712
IntroductionThe global economy is now growing at its fastest pace since 2010, with the upturn
becoming increasingly synchronised across countries. This long awaited lift to global
growth, supported by policy stimulus, is being accompanied by solid employment gains, a
moderate upturn in investment and a pick-up in trade growth. Global GDP growth is
projected to be just over 3½ per cent this year, strengthening further to 3¾ per cent in 2018
before easing slightly in 2019 (Figure 1.1; Table 1.1). On a per capita basis, growth is set to
improve but fall short of pre-crisis norms in the majority of OECD and non-OECD
economies. Inflation is currently subdued in the major economies and is set to remain
moderate, although edging up gradually as resource pressures build.
Whilst the near-term cyclical improvement is welcome, it remains modest compared
with the standards of past recoveries. Moreover, the prospects for continuing the global
growth up-tick through 2019 and securing the foundations for higher potential output and
more resilient and inclusive growth do not yet appear to be in place. The lingering effects of
prolonged sub-par growth after the financial crisis are still present in investment, trade,
productivity and wage developments. Some improvement is projected in 2018 and 2019, with
firms making new investments to upgrade their capital stock, but this will not suffice to fully
offset past shortfalls, and thus productivity gains will remain limited. Growth also remains
Figure 1.1. GDP growth projections for the major economiesYear-on-year percentage changes
Note: Horizontal lines show the average annual growth rate of GDP in the period 1987-2007. Data for Russia are for the average annualgrowth rate in the period 1994-2007.1. With growth in Ireland in 2015 computed using gross value added at constant prices excluding foreign-owned multinational
enterprise dominated sectors.2. Fiscal years.Source: OECD Economic Outlook 102 database; IMF World Economic database; and OECD calculations.
1 2 http://dx.doi.org/10.1787/888933630487
World United States JapanOECD¹ Euro area¹
0.0
0.5
1.0
1.5
2.0
2.5
3.0
3.5
4.0%
20162017
20182019
A. Real GDP growth for the world and in the OECD
non-OECD India² BrazilChina Russia Indonesia
-4
-2
0
2
4
6
8
10%
B. Real GDP growth in the non-OECD

1. GENERAL ASSESSMENT OF THE MACROECONOMIC SITUATION
OECD ECONOMIC OUTLOOK, VOLUME 2017 ISSUE 2 © OECD 2017 13
softer than in the past in the emerging market economies (EMEs), dimming both prospects
for their catch-up and for faster global growth (given their steadily rising role in the global
economy). EME growth is hampered by slowing reform efforts and financial vulnerabilities
from high debt burdens, particularly in China. Financial risks are also rising in advanced
economies, with the extended period of low interest rates encouraging greater risk-taking
and further increases in asset valuations, including in housing markets (Chapter 2).
Productive investments that would generate the wherewithal to repay the associated
financial obligations (as well as make good on other commitments to citizens) appear
insufficient.
Improved short-term momentum and the fiscal room created by the current
accommodative monetary policy environment provide an opportune moment for further
rebalancing policy to address the structural impediments to stronger and more inclusive
medium-term growth, and to increase resilience against possible risks. Monetary policy
will be differentiated according to the need to support growth but with greater attention to
financial stability and the potential for cross-border turbulence from rising differences in
policy settings across countries. The fiscal easing underway in many economies should be
delivered as planned in 2018, alongside redoubled efforts to focus tax and spending policies
and structural policy efforts on the country-specific measures required to support
inclusive and sustainable growth. Active and timely deployment of prudential and
supervisory policies in both advanced and emerging market economies would help to
address financial vulnerabilities (Chapter 2). Better integrated policy packages that address
domestic and international weaknesses are necessary to ensure that the gains from
Table 1.1. The modest cyclical recovery will continue
1 2 http://dx.doi.org/10.1787/888933631133
OECD area, unless noted otherwise
Average 2017 2018 20192005-2014 2015 2016 2017 2018 2019 Q4 Q4 Q4
Real GDP growth1
World2
3.8 3.3 3.1 3.6 3.7 3.6 3.8 3.7 3.6
OECD2,7
1.5 2.4 1.8 2.4 2.4 2.1 2.5 2.2 1.9
United States 1.5 2.9 1.5 2.2 2.5 2.1 2.5 2.3 2.0
Euro area7 0.8 1.5 1.8 2.4 2.1 1.9 2.5 1.9 1.8
Japan 0.6 1.1 1.0 1.5 1.2 1.0 1.5 1.1 0.4
Non-OECD2
6.2 4.0 4.1 4.6 4.9 4.8 4.8 4.8 4.8
China 10.0 6.9 6.7 6.8 6.6 6.4 6.8 6.5 6.3
Output gap3-0.9 -1.4 -1.2 -0.5 0.2 0.6
Unemployment rate47.2 6.8 6.3 5.8 5.5 5.3 5.6 5.4 5.3
Inflation1,52.0 0.8 1.1 1.9 2.1 2.2 1.9 2.2 2.4
Fiscal balance6-4.6 -2.9 -3.0 -2.6 -2.4 -2.2
World real trade growth14.7 2.7 2.6 4.8 4.1 4.0 4.1 4.2 3.9
1. Percentage changes; last three columns show the increase over a year earlier.
2. Moving nominal GDP weights, using purchasing power parities.
3. Per cent of potential GDP.
4. Per cent of labour force.
5. Private consumption deflator.
6. Per cent of GDP.
7. With growth in Ireland in 2015 computed using gross value added at constant prices excluding foreign-owned multinational
enterprise dominated sectors.
Source: OECD Economic Outlook 102 database.
Per cent

1. GENERAL ASSESSMENT OF THE MACROECONOMIC SITUATION
OECD ECONOMIC OUTLOOK, VOLUME 2017 ISSUE 2 © OECD 201714
technological change and cross-border trade and investment are more widely shared by
workers, households and regions.
Prospects for the medium term depend on the responses of market actors to policy
settings, including the monetary policy stance, the effective deployment of fiscal space and
associated changes in the quality of the public finances. Further structural policy reforms
focusing on measures to promote greater business dynamism, trade and investment,
encourage increased labour force participation, and improve the functioning of financial
institutions would strengthen growth potential and complement the productivity gains that
could be achieved through corporate spending on knowledge-based capital. The upside
potential for productivity and wages to support inclusive growth – the avenue by which
countries can meet the expectations of citizens – depends on the packages of policies
appropriate for each country. Given high debt, financial turbulence from unexpected
macroeconomic policies, or a materialisation of downside risks in key economies or financial
markets, would result in weaker growth outcomes, larger shortfalls from past performance,
and a further diminishing of trust in the capabilities of policymakers.
Global growth momentum will stay strong, but only for a whileGlobal GDP growth is set to be just over 3½ per cent this year, the fastest for seven
years, with improved outcomes in both advanced economies and the EMEs. Confidence
measures and levels of new orders for businesses remain strong (Figure 1.2, Panel A),
Figure 1.2. The cyclical upturn has gathered pace this year
Note: 3mma stands for 3-month moving average.1. Based on OECD member countries, Brazil, China, India, Indonesia, Russia and South Africa.Source: OECD Main Economic Indicators database; Markit; Thomson Reuters; and OECD calculations.
1 2 http://dx.doi.org/10.1787/888933630506
2006 2008 2010 2012 2014 2016-6
-4
-2
0
2
4
Consumer confidenceBusiness confidence
A. Consumer and business confidence¹
2006 2008 2010 2012 2014 2016-4
-3
-2
-1
0
1
2PMI, normalised, 3mma
B. Global services output
2006 2008 2010 2012 2014 2016-15
-10
-5
0
5
10
15Y-o-y % changes
C. Global industrial production growth
2006 2008 2010 2012 2014 20160
1
2
3
4
5
6
7Y-o-y % changes
D. Global retail sales growth

1. GENERAL ASSESSMENT OF THE MACROECONOMIC SITUATION
OECD ECONOMIC OUTLOOK, VOLUME 2017 ISSUE 2 © OECD 2017 15
pointing to improved short-term growth prospects, although they have run ahead of
activity data in some countries and sectors (Figure 1.2, Panel B). Industrial production and
retail sales growth have also both strengthened this year (Figure 1.2, Panels C and D).
Amongst the advanced economies, policy easing (both fiscal and monetary) is helping
growth to remain stronger than anticipated in the euro area, and also in many other small
open economies strongly connected to the euro area via value-chain linkages. Strong
infrastructure investment in China in 2016 and 2017 is a key driver of the upturn in the
EMEs, boosting external demand elsewhere, especially in Asia, and contributing to the
recovery now underway in many commodity-exporting economies. By some measures,
financial conditions remain supportive in the major economies (see below), although
further increases in asset prices and the compression of risk spreads are adding to
potential financial vulnerabilities. Commodity prices have risen, partly reflecting strong
industrial demand as well as geopolitical risks and supply constraints from the agreement
amongst OPEC and select non-OPEC members to restrict oil production through to March
2018. Nonetheless, prices remain below the peaks seen in 2010-11, suggesting that the
impact on growth prospects may be modest, although they will push up headline inflation.
The broad-based cyclical upturn (Figure 1.3, Panel A) is set to persist into 2018, with
global GDP growth projected to strengthen to 3.7%.1 Over 2017-19 as a whole, global growth
is projected to average 3.6% per annum, which is comparatively modest for a cyclical
upswing. In the advanced economies, supportive macroeconomic policies, steady labour
market improvements and accommodative financial conditions should help to underpin
demand, with GDP growth averaging close to 2¼ per cent over the projection period. On a
per capita basis, GDP growth is also projected to improve over 2017-19 in the advanced
1. Key technical assumptions underlying the projections are set out in Annex A1.
Figure 1.3. The upturn is broad-based, but remains modest by past standards
1. Accelerating/slowing growth refers to a comparison with the previous year at annual frequency.2. The OECD and non-OECD aggregates are calculated with moving nominal GDP per capita weights using purchasing power parities.
The non-OECD aggregate is based on data for Argentina, Brazil, China, Colombia, Costa Rica, India, Indonesia, Lithuania, Russia,Saudi Arabia, South Africa and the Dynamic Asian Economies (Chinese Taipei, Hong Kong - China, Malaysia, the Philippines,Singapore, Thailand and Vietnam).
Source: OECD Economic Outlook 102 database; UN database; and OECD calculations.1 2 http://dx.doi.org/10.1787/888933630525
2008 2010 2012 2014 2016 20180
5
10
15
20
25
30
35
40
45
50
Number of countries
ContractionSlowing growth
Accelerating growth
A. GDP growth of selected countries¹
1990-2007 2007-2016 2016-20190
1
2
3
4
5
6 %
OECD non-OECD
B. GDP per capita growth²

1. GENERAL ASSESSMENT OF THE MACROECONOMIC SITUATION
OECD ECONOMIC OUTLOOK, VOLUME 2017 ISSUE 2 © OECD 201716
economies, but not at a pace sufficient to offset the decade of sub-par growth after 2007
(Figure 1.3, Panel B). Monetary policy is set to remain accommodative in the major
economies in 2018-19 and fiscal policy easing will offer more support to activity than in the
three years prior to 2017. In the median OECD economy, a fiscal easing of around 0.6% of
GDP is projected to occur over 2017-19, with the main boost in 2017 and 2018, after
consolidation of around 0.4% of GDP over 2015-16. By 2019, GDP growth is projected to ease
mildly in the majority of major economies as capacity constraints begin to emerge, in part
because the upturn in productive investment is projected to remain weaker than is
necessary to strengthen potential output growth.
In the EMEs, an upturn in investment is projected to support growth in India and the
Dynamic Asian Economies in 2018-19, and a continued recovery is projected in Brazil and
Russia, helped by the higher level of commodity prices and more accommodative
monetary policy. However, a projected gradual slowdown in domestic demand growth in
China, as stimulus measures in 2016-17 ease and necessary efforts continue to stabilise
corporate debt and reduce excess capacity, will check the overall pace of trade and output
growth in key trading partners in 2018-19. On a per capita basis, GDP growth in the
non-OECD economies as a whole is set to ease over 2017-19 (Figure 1.3, Panel B).
Global trade growth has rebounded since the first half of 2016 and become
increasingly broad-based across economies. Key factors underlying this include the
recovery in Europe (a relatively trade intensive part of the world economy), the strong pick-up
in electronics trade in Asia, and a shift in the composition of demand towards investment,
which is more import intensive (Figure 1.4, Panel A). Nonetheless, trade intensity is set to
remain mild by pre-crisis standards (Figure 1.4, Panel B). In part, this reflects structural
factors, including a slowdown (OECD-WTO, 2017), or possibly even a reversal (Haugh et al.,
2016), in the deepening of global value chains. The number of new trade restrictions in the
Figure 1.4. The trade upturn is being driven from Asia, but global trade intensity growthremains low
1. Commodity producers includes Argentina, Australia, Brazil, Chile, Colombia, Indonesia, Norway, New Zealand, Russia, Saudi Arabia,South Africa and other oil producing countries.
2. World trade volumes for goods plus services; global GDP at constant prices and market exchange rates. Period averages are the ratioof average annual world trade growth to average annual GDP growth in the period shown.
Source: OECD Economic Outlook 102 database; and OECD calculations.1 2 http://dx.doi.org/10.1787/888933630544
2013 2014 2015 2016 2017 2018 2019-1
0
1
2
3
4
5
6
% pts
ChinaOther AsiaCommodity producers¹Euro areaNorth America
Rest of the worldWorld
A. Contributions to world trade growth
2002-2007 2014 2016 20182013 2015 2017 2019
0.6
0.8
1.0
1.2
1.4
1.6
1.8
2.0
2.2
2.4% pts
Average 1970-2015 = 1.78
Average 1987-2007 = 2.16
B. Global trade intensity²

1. GENERAL ASSESSMENT OF THE MACROECONOMIC SITUATION
OECD ECONOMIC OUTLOOK, VOLUME 2017 ISSUE 2 © OECD 2017 17
major economies has also built up over the past decade, though the rate of increase is now
easing (WTO, 2017). The cyclical upturn in investment intensity is also projected to be
weaker than seen in the past at the global level (Figure 1.5).2
Strong and sustained medium-term growth is not yet secured
A more robust investment upturn is required for a sustained recovery in theadvanced economies
Investment is now rising in most advanced economies, but the upturn remains weaker
than the average of past recoveries, implying slow growth of productive capital and
limiting prospects for productivity growth and potential output. Since the financial crisis,
weak global demand growth and heightened policy and regulatory uncertainty have driven
the persistent weakness of investment (OECD, 2015; Égert and Gal, 2017). Financial
constraints arising from impaired banking sectors in some economies, resources trapped
in unproductive “zombie” firms (Adalet McGowan et al., 2017) and the slowdown in reform
efforts to tackle regulations that impede product market competition (OECD, 2017b) have
also helped to weaken incentives to invest.
Some of these constraints have begun to ease, with signals about prospects for
investment generally improving over the past year. After stagnating in 2016, business
investment has risen by just under 3¾ per cent in the advanced economies this year, and
capital goods production has strengthened through 2017. Corporate surveys also point to
improving investment intentions in the euro area and the United States and emerging
capacity shortages in Japan. The current broad-based improvement in near-term growth
prospects should also help to stimulate investment, given empirical and survey indications
Figure 1.5. Global investment intensity remains below past norms
Note: Period averages are the ratio of average annual gross investment growth to average annual GDP growth in the period shown.1. Ratio of OECD investment growth to OECD GDP growth in period shown.2. Fixed capital investment and GDP growth in the OECD, Brazil, China, Chinese Taipei, Hong Kong - China, India, Indonesia, Malaysia,
the Philippines, Russia, Singapore, South Africa, Thailand and Vietnam, at constant prices.Source: OECD Economic Outlook 102 database; IMF World Economic Outlook database; Consensus Economics; and OECD calculations.
1 2 http://dx.doi.org/10.1787/888933630563
2002-2007 2014 2016 20182013 2015 2017 2019
0.0
0.5
1.0
1.5
2.0 % pts
Average 1987-2007 = 1.21
Business plus governmentHousing
A. OECD investment intensity¹
2002-2007 2014 2016 20182013 2015 2017 2019
0.6
0.7
0.8
0.9
1.0
1.1
1.2
1.3
1.4
1.5
1.6 % pts
Average 1987-2007 = 1.27
Ratio investment growth to GDP growth
B. Global investment intensity²
2. Trade growth in Europe in 2019 will depend in part on the new economic relationship between theUnited Kingdom and the European Union (EU). The projections use a technical assumption thatthe United Kingdom has a transition arrangement with the EU after formal exit in 2019, whichminimises potential short-term disruptions to trade in 2019.

1. GENERAL ASSESSMENT OF THE MACROECONOMIC SITUATION
OECD ECONOMIC OUTLOOK, VOLUME 2017 ISSUE 2 © OECD 201718
that global demand matters as a distinct driver beyond domestic demand for many
investment decisions (OECD, 2015). However, questions remain about how strong and
long-lasting the investment rebound will be. Potential obstacles to a sustained recovery
include a step-down since the financial crisis in expectations over the longer-term for
global GDP growth;3 a decline in business dynamism in several countries (Figure 1.6; Carey
et al., 2016; Millar and Sutherland, 2016),4,5 with potentially adverse effects on competitive
innovation, investment and productivity diffusion; and still high global policy uncertainty,
including about trade policy developments. These all suggest that policy choices will have
an important bearing on medium-term investment prospects.
3. Consensus growth projections suggest that PPP-weighted global GDP growth is now expected toaverage only 3¼ per cent per annum over the next decade, compared with expectations prior to thecrisis and its immediate aftermath that future annual global growth would average around 4% perannum.
4. More timely quarterly data show a rise in the number of new enterprises created in 2016 and early2017 in some OECD countries (OECD, 2017h).
5. Information over a longer time period is available for the United States and Canada using nationaldefinitions of entry and exit rates. On average, over 2003-15 entry and exit rates in the United Stateswere 3 and 2 percentage points lower, respectively, than in the previous two decades (Millar andSutherland, 2016). In Canada, the equivalent gaps were around 4 percentage points (Carey et al., 2016).
Figure 1.6. Business dynamism has declined in several advanced economies
Note: Number of enterprise births and deaths in year t over number of active enterprises in year t. Data for the United States and Canadaare estimated in 2013-15 and 2014-15 respectively, using separate data from the US Census Bureau and Statistics Canada. The euro areaestimates are an unweighted average of birth and death rates in member states. The estimates for “other Europe“ are unweightedaverages of birth and death rates in the Czech Republic, Denmark, Hungary, Norway, Poland, Sweden and the United Kingdom.Source: OECD Structural and Demographic Business Statistics Database; Japanese Ministry of Health, Labour, and Welfare; and OECDcalculations.
1 2 http://dx.doi.org/10.1787/888933630582
2002 2004 2006 2008 2010 2012 20146
7
8
9
10
11
12
13
14
15
16 %
United StatesCanadaAustralia
A. Birth rates
2002 2004 2006 2008 2010 2012 20143
4
5
6
7
8
9
10
11
12
13 %
Euro areaJapanOther Europe
A. Birth rates
2002 2004 2006 2008 2010 2012 20146
7
8
9
10
11
12
13
14
15
16 %
United StatesCanadaAustralia
B. Death rates
2002 2004 2006 2008 2010 2012 20143
4
5
6
7
8
9
10
11
12
13 %
Euro areaJapanOther Europe
B. Death rates

1. GENERAL ASSESSMENT OF THE MACROECONOMIC SITUATION
OECD ECONOMIC OUTLOOK, VOLUME 2017 ISSUE 2 © OECD 2017 19
The pace of business investment growth in the advanced economies is projected to
average around 3½ per cent per annum over 2018-19, suggesting that longer-term
structural impediments outweigh more favourable cyclical conditions and leaving growth
of the productive capital stock (which includes government as well as business investment)
well below pre-crisis norms in most countries. In the median OECD economy, investment
spending in 2018-19 is projected to be around 15% below the level required to ensure the
productive net capital stock rises at the same average annual pace as over 1990-2007
(Figure 1.7).6 With depreciation rates having risen over time by over 1¼ percentage points
in the median OECD economy between the 1997-07 average and 2016 (in part due to the
shorter lifespans of technology investments), much stronger gross investment is now
required to achieve the same net capital stock growth (Figure 1.8).
However, there could still be improvements to growth prospects even if companies
seek only to upgrade their existing capital assets. The improving momentum in the global
IT cycle, driven by production in the Asian economies (Figure 1.9), signals that a key part of
any capital stock upgrade could be the replacement of old equipment and software with
new enhanced digital technologies, with associated benefits for productivity growth.
Broad structural policy packages, supported by supply-side fiscal measures, would
support demand and, even more importantly, improve longer-term growth prospects,
thereby helping to catalyse a stronger upturn in business investment (Box 1.1). In
particular, a stronger pace of progress towards competition-friendly regulations would
help to strengthen product market dynamism and competitive pressures and investment
(Döttling et al., 2017). More competitive product markets would raise the prospective rate
6. The extent of the shortfall for each country depends on the pre-crisis period that is chosen for thetarget growth of the capital stock. Choosing a shorter sample from 1997-2007 does not alter thefindings for the typical OECD economy, with the investment shortfall in the median OECD economyremaining at 15% and the unweighted average shortfall being 17% (down from 18% for 1990-2007).
Figure 1.7. Investment shortfalls are set to persistRatio of actual investment to gross investment required for net productive capital stock growth at the 1990-2007 annual average rate
Note: Estimates for the OECD are for the median country. Investment comprises business and government gross fixed capital investment.Source: OECD Economic Outlook 102 database; and OECD calculations.
1 2 http://dx.doi.org/10.1787/888933630601
0.5
0.6
0.7
0.8
0.9
1.0
1.1
1.2
1.3
0.5
0.6
0.7
0.8
0.9
1.0
1.1
1.2
1.3
AU
S
AU
T
BE
L
CA
N
CH
E
CH
L
CZ
E
DE
U
DN
K
ES
P
ES
T
FIN
FR
A
GB
R
GR
C
HU
N
IRL
ISL
ISR
ITA
JPN
KO
R
LUX
LVA
ME
X
NLD
NO
R
NZ
L
PO
L
PR
T
SV
K
SV
N
SW
E
TU
R
US
A
OE
CD
2015-172018-19

1. GENERAL ASSESSMENT OF THE MACROECONOMIC SITUATION
OECD ECONOMIC OUTLOOK, VOLUME 2017 ISSUE 2 © OECD 201720
of return on new investments and provide a better environment to revive the stalled
diffusion of innovation between frontier firms and the rest of the economy (Alesina et al.,
2005; Gal and Hijzen, 2016; Égert and Gal, 2017). Moves towards more reallocation-friendly
insolvency regimes would also reduce resources trapped in “zombie” firms and improve
the ability of more productive firms to attract additional capital (Adalet McGowan et al.,
2017; Chapter 2). Relatively favourable cyclical conditions provide a propitious opportunity
Figure 1.8. Rising depreciation rates are helping to hold down net investment in productive capitalPer cent of productive capital stock
Note: Business plus government investment. The series are annual averages for the period shown.Source: OECD Economic Outlook 102 database; and OECD calculations.
1 2 http://dx.doi.org/10.1787/888933630620
DEU GBR JPNFRA ITA USA
0
2
4
6
8 %
A. Gross investment
DEU GBR JPNFRA ITA USA
0
2
4
6
8 %
1997-072014-16
B. Scrapping rate
DEU GBR JPNFRA ITA USA
-1
0
1
2
3
4 %
C. Net investment
Figure 1.9. The upturn in the global IT cycle points to improving prospects for high-tech investment
1. Estimate for total semi-conductor billings 2017 based on data up to September. Global GDP is expressed in USD at market exchangerates.
2. Nominal billings in Europe and Asia-Pacific deflated using US semi-conductor import prices. Nominal billings in the Americasdeflated by US semiconductor export prices.
Source: World Semi-Conductor Statistics; Bureau of Labor Statistics; and OECD calculations.1 2 http://dx.doi.org/10.1787/888933630639
1980 1985 1990 1995 2000 2005 2010 20150.0
0.1
0.2
0.3
0.4
0.5
0.6
0.7 % of global GDP
A. Global semi-conductor billings¹
2013 2014 2015 2016 2017-5
0
5
10
15
20
25 USD 2010, % pts
AmericasEuropeAsia-Pacific
B. Contributions to the annual growthof semi-conductor billings²

1. GENERAL ASSESSMENT OF THE MACROECONOMIC SITUATION
OECD ECONOMIC OUTLOOK, VOLUME 2017 ISSUE 2 © OECD 2017 21
Box 1.1. Deeper reforms would strengthen growth prospects
Renewed structural policy efforts, including further liberalisation of trade and regulation, especially inservices, would help to improve the diffusion of new ideas and technologies between firms and acrosscountries and boost total factor productivity (TFP) growth. In turn, this could push the anticipated internalrate of return on investment above current hurdle rates and encourage firms to upgrade their capital stock,and thereby help to sustain the momentum of the current recovery. Technological upgrading that improvescapital quality would provide an additional boost to potential output.
In the OECD as a whole, the annual average contribution of TFP to potential output growth in the decadefrom 2007 to 2017 was just over 0.2 percentage point weaker than in the pre-crisis decade. Undertakingpolicies to close this gap would boost output growth in the medium term. Additional easing of regulatorybarriers in product markets, reductions of trade restrictions and more open economies, and stronger R&Dspending are key policies in this respect (OECD, 2017b; Égert and Gal, 2017; Haugh et al., 2016). Identifiedpolicy priorities differ across countries (table below), but frequently include steps to: streamline permitsand licenses; improve the transparency of regulation; reduce barriers to entry in network industries,professional services and retail sectors; lower barriers to trade and FDI; and strengthen collaborationbetween research institutes, universities and industry.
Reform recommendations to help strengthen business dynamismand knowledge diffusion
1 2 http://dx.doi.org/10.1787/888933631152
A stylised scenario using the NiGEM global macroeconomic model serves to illustrate the possible shortand medium-term growth effects that might be achieved if the rate of technical progress were to bestronger. The scenario considers the effects of raising labour-augmenting technical progress by0.2 percentage point per annum in all of the advanced economies for five years, beginning in the latter halfof 2017, with the 1% higher level of technical progress being maintained permanently thereafter.
There are a number of ways in which an increase of 1% in the level of TFP over five years can be achieved,based on the analysis in Égert and Gal (2017), especially if a collection of reforms are undertakensimultaneously in a number of different policy areas. Alternatively, the increase could be separatelyobtained from a large reform that raised trade openness by 5 percentage points (which is around twice theincrease projected in 2017-19 in the OECD economies compared with 2014-16), or a beneficial two-yearreform to product market regulation of a size that is somewhat larger than has been typically observed in
Countries with scope for gains and recommended actions
AUS, BEL, CAN, CHL, CZE, DEU, DNK, GRC, HUN, IRL, ISL, ISR, ITA, JPN,
KOR, LVA, MEX, NOR, NZL, POL, PRT, SVN
BEL, CAN, CZE, DEU, ESP, EST, GRC, HUN, IRL, ISR, JPN, LVA, MEX, NOR,
NZL, TUR
AUT, BEL, CAN, CZE, DEU, DNK, ESP, FIN, FRA, HUN, IRL, ISL, JPN, KOR,
LVA, LUX, MEX, NOR, PRT, SVN
CAN, CHE, ISL, ISR, JPN, KOR, MEX, NOR, NZL
AUS, CZE, EST, FIN, GBR, GRC, HUN, ISR, ITA, LVA, POL, USA
CAN, JPN, NOR, USA
AUS, CAN, CHL, CZE, EST, GBR, ISL, IRL, ITA, LUX, MEX, NLD, NZL, POL,
PRT, SVN, USA
Source:
Policy
Note : The countries identified are those in which the reform is identified as a priority for the country in 2017.
OECD (2017), Economic Policy Reforms 2017: Going for Growth, OECD Publishing, Paris.
Reforms to ease economy-wide regulatory barriers
Reforms to ease network industry regulatory
barriers
Reforms to ease service-sector regulatory barriers
Lowering barriers to trade and FDI
Improving physical and legal infrastructure
Reductions in corporation tax rates
Reforms to improve innovation capacity

1. GENERAL ASSESSMENT OF THE MACROECONOMIC SITUATION
OECD ECONOMIC OUTLOOK, VOLUME 2017 ISSUE 2 © OECD 201722
to undertake such reforms, as any potential short-term costs from weaker firms exiting the
market are likely to be lower and shorter-lived when demand and job creation are stronger.
More could also be done to tackle regulatory divergences in network industries to
encourage cross-border investment, especially in Europe (Fournier, 2015).
Box 1.1. Deeper reforms would strengthen growth prospects (cont.)
the past. A rise in the share of business R&D spending in GDP can also boost TFP, but the effects arecomparatively small, with an increase of 0.1 percentage point (which is roughly the difference betweenspending per annum in the OECD economies in 2014-15 and that in the previous decade) raising TFP by 0.1%after five years.
The NiGEM model simulations are run in forward-looking mode, so that private actors and financialmarkets start to adjust their behaviour in anticipation of the higher level of output in the future. Monetaryand fiscal policies are allowed to remain endogenous.
All told, the positive supply shock would raise OECD GDP growth by around ¼ percentage point perannum over 2018-19, and by a further 0.1 percentage point per annum on average over 2020-23, so that thelevel of GDP in the OECD economies is 0.9% higher than otherwise by 2023. The output gains are larger inthe United States than in the euro area or Japan (figure below), reflecting a more dynamic investmentresponse and a faster response of real wages to the improvement in labour efficiency. Business investmentgrowth is between 1 and 2 percentage points stronger in 2018 in the advanced economies than in thebaseline, and by 2023 the capital stock is around 1% higher than the baseline in the United States (and alsothe United Kingdom and Canada) and around 0.7% above the baseline in Japan and the euro area. Realwages also rise gradually over time, as they adjust towards the higher level of productivity, by 0.1-0.3%relative to baseline in the major advanced economies in 2019 and by 0.5% on average in these economiesby 2023, with somewhat stronger effects in the United States than elsewhere. In turn, this helps tostrengthen consumer spending. The collective boost to output in the advanced economies also has mildpositive spillovers to the EMEs and to world trade. Overall, global GDP growth is boosted by around 0.1percentage point per annum on average out to 2023, and world trade growth by around 0.2 percentage pointper annum over the same period.
The output gains from faster technical progress growth in the advanced economiesGDP at constant prices, difference from baseline, per cent
Source: OECD calculations.1 2 http://dx.doi.org/10.1787/888933630430
United States Japan BRICEuro area OECD World
0.0
0.2
0.4
0.6
0.8
1.0
1.2
1.4 %
0.0
0.2
0.4
0.6
0.8
1.0
1.2
1.4 %
20192023

1. GENERAL ASSESSMENT OF THE MACROECONOMIC SITUATION
OECD ECONOMIC OUTLOOK, VOLUME 2017 ISSUE 2 © OECD 2017 23
The onset of monetary policy normalisation in the major advanced economies might
have little direct effect on aggregate incentives to invest in productive assets. Corporate
hurdle rates for investment remain well above the cost of capital (Figure 1.10) and the
available survey evidence, though limited, suggests that hurdle rates have been high and
relatively sticky over time despite underlying fluctuations in the cost of finance (Sharpe
and Suarez, 2014; Deloitte, 2014; Norman, 2016).7 This is one reason why business
investment has remained weak despite the decline in policy and market interest rates over
the past decade. For the same reason, changes in tax rates (which affect the cost of capital)
may yield less impetus for investment than theory or historical evidence might suggest.
Changes in interest rates and taxes could still have a broader effect on corporate balance
sheets by affecting decisions to issue debt and undertake financial transactions, adding to
the growing disconnect between debt issuance and investment seen in recent years
(Chapter 2).
Reforms are needed to improve growth prospects in emerging market economies
A durable strengthening of growth in EMEs is central if global growth is to return to
higher long-term norms, given their rising share of global output and trade. However, GDP
growth has eased overall in these countries since the 2000s, progress in enacting structural
policies has slowed and demographic headwinds are now appearing in some countries.
Progress on catch-up in terms of GDP per capita has thus slowed in many EMEs.
In recent years, weaker growth outcomes in the major EMEs were largely accounted for
by a gradual moderation of growth in China, and a more substantial slowdown in
commodity exporting economies (Figure 1.11, Panel A). Domestic demand was especially
weak in many of the latter economies (Figure 1.11, Panel B). Growth in the major EME
commodity importers (excluding China) did also ease, but to a much smaller extent. Going
forward, as discussed above, growth in the non-China EMEs is now improving, helped by a
7. The average hurdle rate amongst the US companies responding to the Duke CFO Global BusinessOutlook Survey was 14.7% in 2007, 14.8% in 2011 and 13.6% in 2017.
Figure 1.10. Hurdle rates for corporate investment are well above the cost of capital
Source: Duke CFO Global Business Outlook Survey, June 2017; and Bank of England Finance and Investment Decisions Survey.1 2 http://dx.doi.org/10.1787/888933630658
United States Canada Europe United Kingdom Asia5
6
7
8
9
10
11
12
13
14
15 %
5
6
7
8
9
10
11
12
13
14
15 %
Average hurdle rateWeighted average cost of capitalCost of debt

1. GENERAL ASSESSMENT OF THE MACROECONOMIC SITUATION
OECD ECONOMIC OUTLOOK, VOLUME 2017 ISSUE 2 © OECD 201724
rebound in Brazil and Russia, two of the major commodity producers, and spillover effects
from policy stimulus in China. However, this upturn is set to be moderate by pre-crisis
standards, reflecting relatively modest external demand growth and the need for further
reforms to strengthen domestic demand.
Figure 1.11. GDP growth is subdued in the emerging market economies and medium-termprospects have declined
1. Commodity exporters include Argentina, Brazil, Chile, Colombia, Indonesia, Russia, Saudi Arabia, South Africa and other non-OECDoil producers. Commodity importers (ex. China) include India, Mexico, Turkey and the Dynamic Asian Economies (Chinese Taipei,Hong Kong - China, Malaysia, the Philippines, Singapore, Thailand and Vietnam). Emerging markets economies (ex. China) include thecountries in the commodity exporters group and commodity importers group. Countries are aggregated based on PPP GDP weights.
2. Average annual GDP growth expected over the following ten years in long-term consensus forecasts from the years shown.Commodity exporters include Argentina, Brazil, Chile, Colombia, Indonesia, Peru, Russia, Ukraine and Venezuela. Commodityimporters (ex. China) include Bulgaria, Chinese Taipei, Hong Kong – China, India, Malaysia, Mexico, Philippines, Romania, Singapore,Thailand and Turkey. Countries are aggregated based on PPP GDP weights.
3. Production function based estimates of potential output in Argentina, Brazil, Chile, China, Colombia, India, Indonesia, Mexico, Russia,Turkey and South Africa. HP-filter based estimates of potential output in Saudi Arabia, the Dynamic Asian Economies and othernon-OECD oil producers.
Source: OECD Economic Outlook 102 database; Consensus Economics; and OECD calculations.1 2 http://dx.doi.org/10.1787/888933630677
2000 2005 2010 2015-5
0
5
10
15 %
ChinaEMEs excl. ChinaCommodity exportersCommodity importers excl. China
A. Real GDP growth¹
2000 2005 2010 2015-5
0
5
10
15 %
ChinaEMEs excl. ChinaCommodity exportersCommodity importers excl. China
B. Real total domestic demand growth¹
2000 2005 2010 2015-5
0
5
10
15 %
ChinaEMEs excl. ChinaCommodity exportersCommodity importers excl. China
C. Potential GDP growth¹ ³
0
2
4
6
8
10 %
EMEs Commodity Commodity importers Chinaexcl. China exporters excl. China
19962001
20062011
20162017
D. Long-run growth expectations²

1. GENERAL ASSESSMENT OF THE MACROECONOMIC SITUATION
OECD ECONOMIC OUTLOOK, VOLUME 2017 ISSUE 2 © OECD 2017 25
A risk is that the cyclical rebound in growth outcomes could disappoint if there were
to be a sharper slowdown in China than currently projected, given the strong linkages of
the smaller Asian economies and commodity exporters with China through global value
chains (Figure 1.12). Financial vulnerabilities, such as high debt, currency mismatch
between debts and revenues, and rising non-performing loans in some EMEs could also
cloud the near-term growth outlook (Chapter 2). Capital flows may also become more
volatile if steps to normalise monetary policy in some advanced economies gather pace.
Further ahead, prospects for stronger output and per capita growth in EMEs will
depend on the extent to which supply-side developments improve and, in particular, on
whether investment and productivity growth can strengthen sufficiently to outweigh
demographic headwinds in some countries and a further moderation of growth in China.
In the EMEs as a whole, estimates of underlying growth potential have declined over the
past decade, especially in China and many commodity exporters (Figure 1.11, Panel C).
Excluding China, potential output growth for the commodity importing EMEs has
remained broadly unchanged. An underlying slowdown is also reflected in the steady
decline in long-term consensus expectations of average annual growth over the next
decade in the EMEs (Figure 1.11, Panel D), likely damping incentives to invest.8 Key factors
behind the slowdown in potential growth include:
● The contribution from capital per worker in the commodity exporters has been
particularly soft in recent years (Figure 1.13; World Bank, 2017). Despite their recent rises,
most commodity prices remain well below their peaks in 2008 and 2011-14, holding back
capital spending (Deutsche Bundesbank, 2015). In China, investment remains a key
8. Since 2011, expectations of average annual growth over the next decade have declined by2 percentage points in China and by close to 1½ percentage points in the other major EMEs.
Figure 1.12. China is an important trading partner for smaller Asian economiesand commodity exporters
Per cent of total domestic value-added in foreign final demand in 2014
Note: OECD TiVA Nowcast Estimates. Red is for the Dynamic Asian Economies, blue is for the commodity exporters and green for thecommodity importers.Source: OECD calculations.
1 2 http://dx.doi.org/10.1787/888933630696
0
5
10
15
20
25
30
35 %
HK
G
TW
N
MY
S
CH
L
PH
L
BR
A
ZA
F
SG
P
TH
A
IDN
VN
M
SA
U
CO
L
RU
S
IND
AR
G
TU
R
ME
X
A. China
0
10
20
30
40
50
60
70 %
ME
XC
OL
CH
NV
NM
TW
NIN
DP
HL
BR
AC
HL
SA
US
GP
HK
GID
NT
HA
MY
SA
RG
ZA
FT
UR
RU
S
B. United States

1. GENERAL ASSESSMENT OF THE MACROECONOMIC SITUATION
OECD ECONOMIC OUTLOOK, VOLUME 2017 ISSUE 2 © OECD 201726
factor underpinning growth (OECD, 2017d), but its pace has moderated, partly reflecting
necessary adjustments to reduce over-capacity in some sectors.
● Total factor productivity (TFP) growth has also slowed, especially in the commodity
exporters and China, partly due to weaker investment and trade growth since the crisis.
However, TFP growth has held up relatively well in the other major commodity
importers. In part this reflects a stronger pace of structural reforms in India since 2014
(OECD, 2017e), and major growth-enhancing reforms in Mexico (OECD, 2017f).
● Demographic developments in some EMEs have become less favourable, especially in
China and, to lesser extent, in many commodity exporters.
Stepping up the pace of structural policies to boost productivity growth, including
through more competition-friendly regulations and efforts to raise labour utilisation rates,
Figure 1.13. Potential GDP growth has fallen in many EMEs
Note: Contributions to potential output growth are expressed in percentage points. Commodity exporters include Argentina, Brazil, Chile,Colombia, Indonesia, Russia and South Africa. Commodity importers (ex. China) include India, Mexico and Turkey. Countries areaggregated based on PPP GDP weights.Source: OECD Economic Outlook 102 database; and OECD calculations.
1 2 http://dx.doi.org/10.1787/888933630715
2004 2006 2008 2010 2012 2014 2016 2018-1
0
1
2
3
4
5
6
7
8%
Capital per workerEmployment and part. rateWorking-age population
TFPPotential growth
A. EMEs excl. China
2004 2006 2008 2010 2012 2014 2016 2018-2
0
2
4
6
8
10
12
14
16 %
Capital per workerEmployment and part. rateWorking-age population
TFPPotential growth
B. China
2004 2006 2008 2010 2012 2014 2016 2018-1
0
1
2
3
4
5
6
7
8%
Capital per workerEmployment and part. rateWorking-age population
TFPPotential growth
C. EMEs commodity importers excl. China
2004 2006 2008 2010 2012 2014 2016 2018-1
0
1
2
3
4
5
6
7
8 %
Capital per workerEmployment and part. rateWorking-age population
TFPPotential growth
D. EMEs commodity exporters

1. GENERAL ASSESSMENT OF THE MACROECONOMIC SITUATION
OECD ECONOMIC OUTLOOK, VOLUME 2017 ISSUE 2 © OECD 2017 27
is essential to improve medium-term growth prospects in the EMEs and to provide avenues
to tackle challenges of inclusiveness. In recent years, progress in enacting structural
reforms has slowed in many EMEs based on OECD indicators, especially for policies aimed
at boosting labour productivity (OECD, 2017b; Figure 1.14). Other measures of regulatory
performance, such as the World Bank Doing Business survey, suggest that regulatory
quality relative to frontier countries has remained largely unchanged in most EMEs since
2014 (Figure 1.14, Panel B). Lowering barriers to foreign trade, investment and firm entry,
and reducing the state control of businesses would improve the efficiency of capital
allocation and boost job growth. Further, these kinds of regulations bear most heavily on
SMEs which are a key source of job creation (OECD, 2017g). Measures to boost investment
directly by tackling structural bottlenecks and expanding public investment in
infrastructure and human capital, where fiscal space exists, would also support stronger
underlying growth. Addressing potential financial vulnerabilities and improving
risk-management practices could also strengthen resilience in many EMEs, providing a
more stable environment to foster long-term investments (Chapter 2). Deeper capital
markets would also improve the efficiency of capital allocation and support job growth.
Figure 1.14. Reform responsiveness and improvements in regulatory quality have slowedin many EMEs
1. Responsiveness to OECD Going for Growth recommendations across EMEs. The EME aggregate is the simple average of EMEs shownin the chart.
2. Commodity exporters include Argentina, Brazil, Chile, Colombia, Indonesia, Russia, Saudi Arabia and South Africa. Commodityimporters (ex. China) include Chinese Taipei, Hong Kong – China, India, Malaysia, Mexico, Philippines, Singapore, Thailand, Turkeyand Vietnam. Aggregates are based on simple averages.
Source: OECD (2017), Economic Policy Reforms 2017, Going for Growth, OECD Publishing, Paris; World Bank Doing Business database; andOECD calculations.
1 2 http://dx.doi.org/10.1787/888933630734
0.0
0.1
0.2
0.3
0.4
0.5
0.6
0.7 %
ME
X
CH
N
IND
ZA
F
BR
A
IDN
TU
R
CH
L
EM
ES
2011-122013-142015-16
A. Overall reform responsiveness¹
2010 2011 2012 2013 2014 2015 2016 201755
60
65
70
75
80 %
EMEs excl. ChinaCommodity exportersCommodity importers excl. ChinaChina
B. Regulatory performance (distance to frontier)²
0.0
0.1
0.2
0.3
0.4
0.5
0.6
0.7 %
ME
X
CH
N
IND
ZA
F
BR
A
IDN
TU
R
CH
L
EM
ES
2011-122013-142015-16
C. Labour productivity reform responsiveness¹
0.0
0.1
0.2
0.3
0.4
0.5
0.6
0.7 %
ME
X
CH
N
IND
ZA
F
BR
A
IDN
TU
R
CH
L
EM
ES
2011-122013-142015-16
D. Labour utilisation reform responsiveness¹

1. GENERAL ASSESSMENT OF THE MACROECONOMIC SITUATION
OECD ECONOMIC OUTLOOK, VOLUME 2017 ISSUE 2 © OECD 201728
Inflation pressures are projected to be moderate
Headline consumer price inflation eased in mid-2017 in most major advanced and
emerging market economies, helped by the moderation in energy prices (Figure 1.15).
Meanwhile, underlying inflation across the advanced economies is currently subdued in
aggregate despite the broad-based cyclical upturn and the continued absorption of slack.
Apart from sluggish wage growth (discussed below), this leaves puzzles about the extent of
spare capacity, and the possible extent to which global or particular domestic factors are
helping to constrain inflationary pressures in the advanced economies (Figure 1.16):
● International and domestic competition and technological progress are holding down
prices of goods excluding energy and food, with falling price levels in the United States
and Japan and very muted increases in the euro area, and some services (Auer and
Fischer, 2010). These developments are also particularly notable in communication
services, with the persistent negative contributions of communication prices having
recently intensified in the main OECD areas.
Figure 1.15. Inflation is projected to remain moderate in the major economiesYear-on-year percentage changes
Note: Inflation is based on the harmonised consumer price index for the euro area countries and the United Kingdom, on the nationalheadline consumer price series for Canada and Japan and the EMEs, and on the personal consumption deflator for the United States.Inflation rates in Japan in 2014 and 2019Q4 are affected by the realised and expected increase in the consumption tax rate. Core inflationexcludes prices of food and energy.1. EMEs include Brazil, China, Costa Rica, Hungary, India, Indonesia, Mexico, Poland, Russia, South Africa and Turkey.Source: OECD Economic Outlook 102 database; and OECD calculations.
1 2 http://dx.doi.org/10.1787/888933630753
2012 2013 2014 2015 2016 2017 2018 2019-2
-1
0
1
2
3
4
5 %
United StatesEuro areaJapan
C. Headline inflation
2012 2013 2014 2015 2016 2017 2018 2019-2
-1
0
1
2
3
4
5 %
United StatesEuro areaJapan
D. Core inflation
2012 2013 2014 2015 2016 2017 2018 2019-4
-2
0
2
4
6
8 %
Range of min. and max. of headline inflation
Median of headline inflationMedian of core inflation
A. Inflation in advanced OECD economies
2012 2013 2014 2015 2016 2017 2018 2019-5
0
5
10
15
20 %
Range of min. and max. of headline inflationMedian of headline inflation
B. Inflation in EMEs¹

1. GENERAL ASSESSMENT OF THE MACROECONOMIC SITUATION
OECD ECONOMIC OUTLOOK, VOLUME 2017 ISSUE 2 © OECD 2017 29
Figure 1.16. Recent low core inflation has been driven by a mixture of idiosyncratic factorsand longer-term trends
Contributions to year-on-year core consumer price inflation in percentage points
1. Core inflation differs from the domestic definition and it excludes prices of energy and food. The spike in core inflation in Japanin 2014 is due the increase in the consumption tax rate.
Source: Ministry of Internal Affairs and Communications, Japan; Bureau of Economic Analysis; Eurostat; and OECD calculations.1 2 http://dx.doi.org/10.1787/888933630772
2004 2005 2006 2007 2008 2009 2010 2011 2012 2013 2014 2015 2016 2017-1.0
-0.5
0.0
0.5
1.0
1.5
2.0
2.5
3.0
3.5 % pts
-1.0
-0.5
0.0
0.5
1.0
1.5
2.0
2.5
3.0
3.5 % pts
Goods excl. food & energyHousing servicesHealth care services
Communication servicesFinancial & insurance servicesAll remaining services excl. energyCore
United States
2004 2005 2006 2007 2008 2009 2010 2011 2012 2013 2014 2015 2016 2017-1.0
-0.5
0.0
0.5
1.0
1.5
2.0
2.5
3.0
3.5 % pts
-1.0
-0.5
0.0
0.5
1.0
1.5
2.0
2.5
3.0
3.5 % pts
Goods excl. food & energyHousing servicesSocial protection & financial services
Communication servicesPackage holidays & accommodation servicesAll remaining services excl. energyCore
Euro area
2004 2005 2006 2007 2008 2009 2010 2011 2012 2013 2014 2015 2016 2017-2.0
-1.5
-1.0
-0.5
0.0
0.5
1.0
1.5
2.0
2.5
3.0 % pts
-2.0
-1.5
-1.0
-0.5
0.0
0.5
1.0
1.5
2.0
2.5
3.0 % pts
Goods excl. food & energyHousing servicesMedical services
Communication servicesAll remaining services excl. energyCore
Japan¹

1. GENERAL ASSESSMENT OF THE MACROECONOMIC SITUATION
OECD ECONOMIC OUTLOOK, VOLUME 2017 ISSUE 2 © OECD 201730
● Inflation expectations may have been weakened by the long period of low inflation in the
past. In particular in Japan, continued core price inflation at around zero possibly reflects
backward-looking inflation expectations of producers. Moreover, in several European
economies, the mode of the distribution of price changes for disaggregated core inflation
components has started to shift to the left since 2014-15 and become somewhat less
dispersed compared to the pre-crisis period, possibly suggesting a convergence of price
setting behaviour around a low level of inflation (Figure 1.17).9
● Country-specific factors are also pushing down inflation in the main advanced
economies. The particularly striking recent moderation of inflation in the United States
has been driven by the declining contribution of prices of financial services and low price
increases in healthcare services, with the latter reflecting longer-term changes in
regulation (Lorenzoni et al., 2017). In the euro area, although services price inflation has
strengthened recently (largely due to one-off changes in prices related to tourism), it
9. No similar shifts have been observed in Germany and the United States. The shifts have resultedalso in a significant narrowing of the distribution of price changes weighted by their respectivecore inflation weights.
Figure 1.17. The distributions of disaggregated core inflation price changes have shiftedand become less dispersed
Note: Estimated distributions for price changes of core inflation components, i.e. excluding prices of food and energy, at 4-digit level ofdisaggregation at annual frequency.1. 2017 figures are computed as the average changes from January to October 2017.Source: Eurostat; and OECD calculations.
1 2 http://dx.doi.org/10.1787/888933630791
-25 -20 -15 -10 -5 0 5 10 150.0
0.1
0.2
0.3
0.4200320072017¹
Euro area
Den
sity
-25 -20 -15 -10 -5 0 5 100.00
0.05
0.10
0.15
0.20
0.25
0.30200320072017¹
FranceD
ensi
ty
-20 -15 -10 -5 0 5 10 15 20 25 300.0
0.1
0.2
0.3
0.4200320072017¹
Italy
Den
sity
-30 -25 -20 -15 -10 -5 0 5 10 15 200.00
0.05
0.10
0.15
0.20200320072017¹
United Kingdom
Den
sity
1. GENERAL ASSESSMENT OF THE MACROECONOMIC SITUATION
OECD ECONOMIC OUTLOOK, VOLUME 2017 ISSUE 2 © OECD 2017 31
remains below pre-crisis levels, reflecting weaker dynamics of prices of services related
to housing and a number of diverse categories of services.
In the large EMEs, inflation has generally eased this year, particularly in Brazil and Russia
helped by past currency appreciation. In India, headline CPI inflation has also dipped below
target, reflecting in part transitory factors including demonetisation, a good monsoon,
large rebates before the rollout of the Goods and Services Tax and a strong rupee.
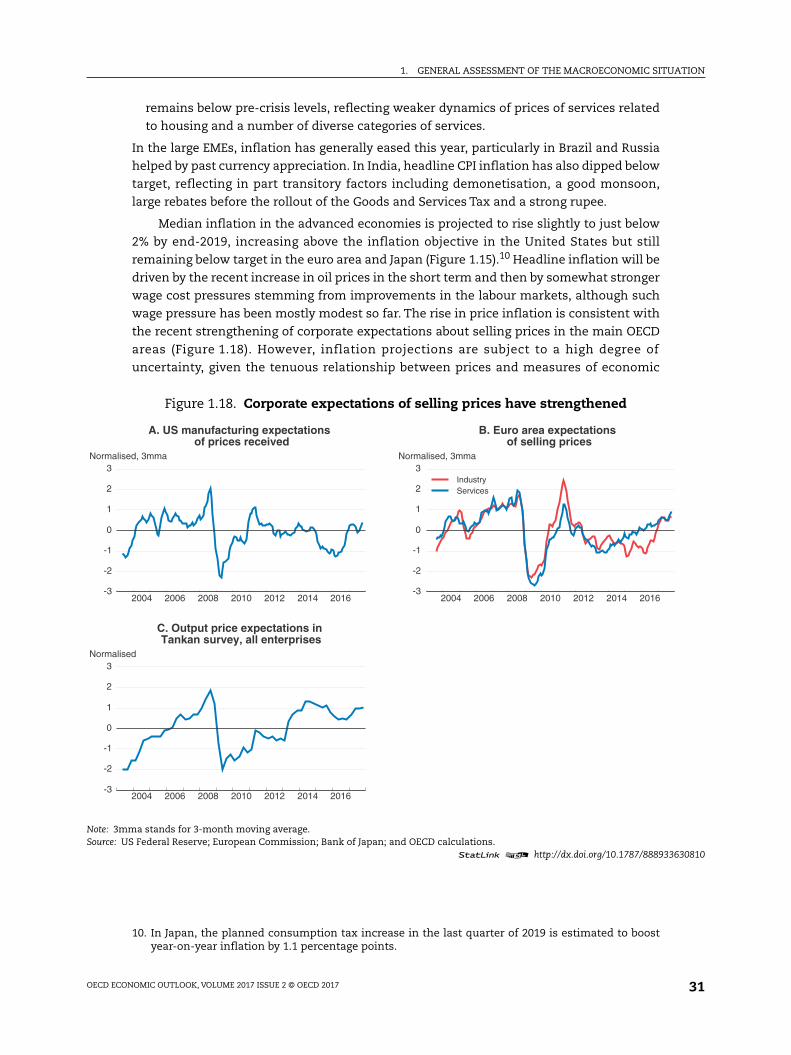
Median inflation in the advanced economies is projected to rise slightly to just below
2% by end-2019, increasing above the inflation objective in the United States but still
remaining below target in the euro area and Japan (Figure 1.15).10 Headline inflation will be
driven by the recent increase in oil prices in the short term and then by somewhat stronger
wage cost pressures stemming from improvements in the labour markets, although such
wage pressure has been mostly modest so far. The rise in price inflation is consistent with
the recent strengthening of corporate expectations about selling prices in the main OECD
areas (Figure 1.18). However, inflation projections are subject to a high degree of
uncertainty, given the tenuous relationship between prices and measures of economic
10. In Japan, the planned consumption tax increase in the last quarter of 2019 is estimated to boostyear-on-year inflation by 1.1 percentage points.
Figure 1.18. Corporate expectations of selling prices have strengthened
Note: 3mma stands for 3-month moving average.Source: US Federal Reserve; European Commission; Bank of Japan; and OECD calculations.
1 2 http://dx.doi.org/10.1787/888933630810
2004 2006 2008 2010 2012 2014 2016-3
-2
-1
0
1
2
3 Normalised, 3mma
A. US manufacturing expectations of prices received
2004 2006 2008 2010 2012 2014 2016-3
-2
-1
0
1
2
3 Normalised, 3mma
IndustryServices
B. Euro area expectations of selling prices
2004 2006 2008 2010 2012 2014 2016-3
-2
-1
0
1
2
3 Normalised
C. Output price expectations in Tankan survey, all enterprises

1. GENERAL ASSESSMENT OF THE MACROECONOMIC SITUATION
OECD ECONOMIC OUTLOOK, VOLUME 2017 ISSUE 2 © OECD 201732
slack, and the over-predictions of inflation in the past two years.11 In most EMEs, assuming
unchanged exchange rates, inflation is expected to stabilise at low levels, reflecting the
dissipation of recent price shocks and better-anchored inflation expectations. However, if
monetary policy in advanced countries is normalised faster than projected, the ensuing
depreciation of EMEs' currencies, unless there is complementary domestic policy
tightening, could add to inflationary pressures.
Labour market outcomes remain uneven
Labour market performance continues to improve in the advanced economies but
remains uneven. Employment and labour force participation rates in many countries are
now above the levels prior to the crisis (Figure 1.19), helped by reforms that have raised
activation, reduced pathways to early retirement, enhanced job creation and lowered
barriers to female labour force participation. Outcomes in the United States are a notable
exception amongst the major advanced economies, possibly associated in part with an
increased incidence of poor health and disability, including rising opioid prescriptions
(Krueger, 2017). In the OECD economies as a whole, the employment rates of older workers
(aged 55 and above) have risen sharply, but prime-age and youth employment rates are
only at, or still below, their immediate pre-crisis levels.12
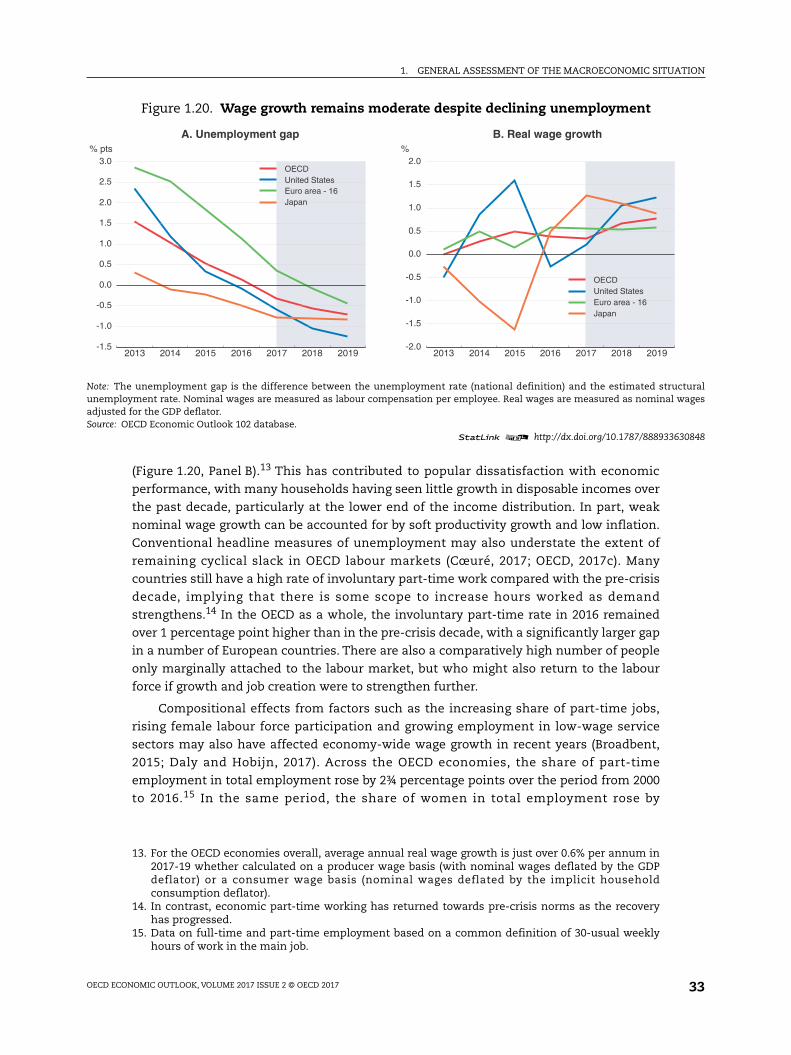
Wage growth also remains modest in most major economies, despite
higher employment rates and lower unemployment (Figure 1.20, Panel A). In the OECD
economies overall, real wage growth is projected to remain moderate over 2017-19, at just
over 0.6% per annum on average, up from 0.4% per annum on average in 2014-16
11. Two-year ahead consensus forecasts of headline inflation in 2015-16 were overestimated, onaverage by between 1 and 1¼ percentage points in the euro area, Japan and the United States.
12. The harmonised youth unemployment rate has however now declined to its pre-crisis level.
Figure 1.19. Employment and participation rates are now rising in the advanced economies
1. Employment as a percentage of the population aged 15-74.2. Labour force as a percentage of the population aged 15-74.Source: OECD Economic Outlook 102 database; and OECD calculations.
1 2 http://dx.doi.org/10.1787/888933630829
1995 2000 2005 2010 201550
55
60
65
70
75%
OECDUnited States
Euro areaJapan
A. Employment rate¹
1995 2000 2005 2010 201556
58
60
62
64
66
68
70
72
74%
OECDUnited States
Euro areaJapan
B. Labour force participation rate²
1. GENERAL ASSESSMENT OF THE MACROECONOMIC SITUATION
OECD ECONOMIC OUTLOOK, VOLUME 2017 ISSUE 2 © OECD 2017 33
(Figure 1.20, Panel B).13 This has contributed to popular dissatisfaction with economic
performance, with many households having seen little growth in disposable incomes over
the past decade, particularly at the lower end of the income distribution. In part, weak
nominal wage growth can be accounted for by soft productivity growth and low inflation.
Conventional headline measures of unemployment may also understate the extent of
remaining cyclical slack in OECD labour markets (Cœuré, 2017; OECD, 2017c). Many
countries still have a high rate of involuntary part-time work compared with the pre-crisis
decade, implying that there is some scope to increase hours worked as demand
strengthens.14 In the OECD as a whole, the involuntary part-time rate in 2016 remained
over 1 percentage point higher than in the pre-crisis decade, with a significantly larger gap
in a number of European countries. There are also a comparatively high number of people
only marginally attached to the labour market, but who might also return to the labour
force if growth and job creation were to strengthen further.
Compositional effects from factors such as the increasing share of part-time jobs,
rising female labour force participation and growing employment in low-wage service
sectors may also have affected economy-wide wage growth in recent years (Broadbent,
2015; Daly and Hobijn, 2017). Across the OECD economies, the share of part-time
employment in total employment rose by 2¾ percentage points over the period from 2000
to 2016.15 In the same period, the share of women in total employment rose by
Figure 1.20. Wage growth remains moderate despite declining unemployment
Note: The unemployment gap is the difference between the unemployment rate (national definition) and the estimated structuralunemployment rate. Nominal wages are measured as labour compensation per employee. Real wages are measured as nominal wagesadjusted for the GDP deflator.Source: OECD Economic Outlook 102 database.
1 2 http://dx.doi.org/10.1787/888933630848
2013 2014 2015 2016 2017 2018 2019-1.5
-1.0
-0.5
0.0
0.5
1.0
1.5
2.0
2.5
3.0 % pts
OECDUnited StatesEuro area - 16Japan
A. Unemployment gap
2013 2014 2015 2016 2017 2018 2019-2.0
-1.5
-1.0
-0.5
0.0
0.5
1.0
1.5
2.0 %
OECDUnited StatesEuro area - 16Japan
B. Real wage growth
13. For the OECD economies overall, average annual real wage growth is just over 0.6% per annum in2017-19 whether calculated on a producer wage basis (with nominal wages deflated by the GDPdeflator) or a consumer wage basis (nominal wages deflated by the implicit householdconsumption deflator).
14. In contrast, economic part-time working has returned towards pre-crisis norms as the recoveryhas progressed.
15. Data on full-time and part-time employment based on a common definition of 30-usual weeklyhours of work in the main job.
1. GENERAL ASSESSMENT OF THE MACROECONOMIC SITUATION
OECD ECONOMIC OUTLOOK, VOLUME 2017 ISSUE 2 © OECD 201734
2 percentage points, with around two-thirds of the increase accounted for by female
part-time employment.
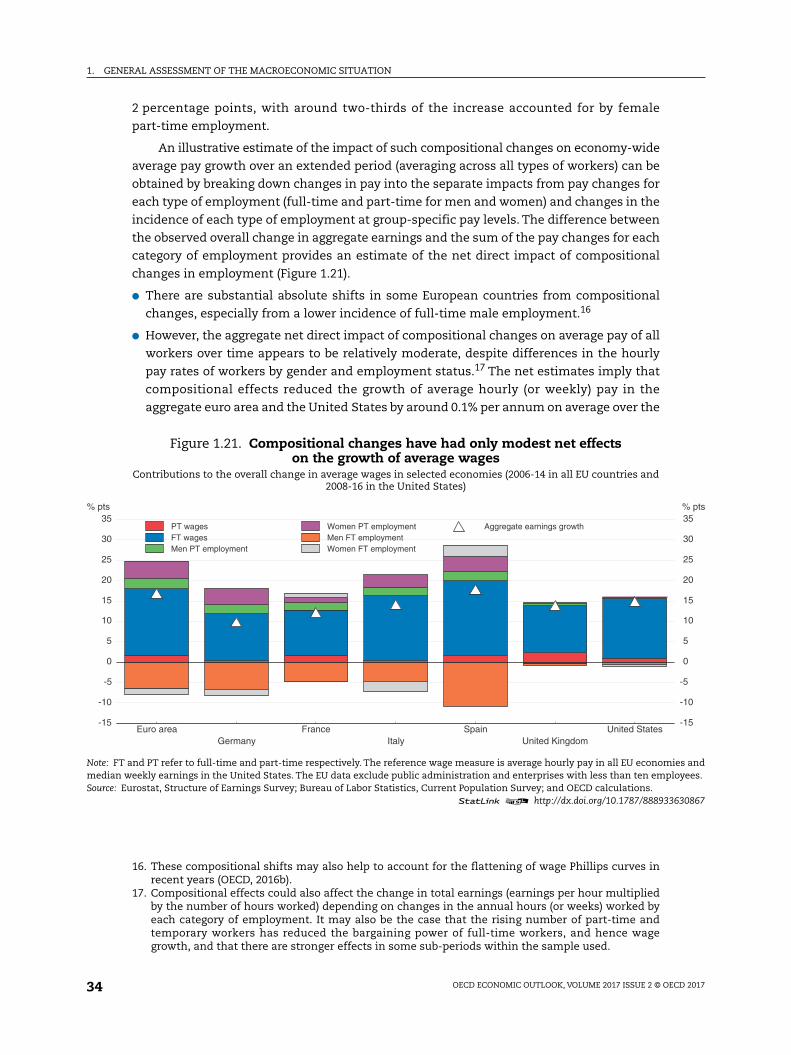
An illustrative estimate of the impact of such compositional changes on economy-wide
average pay growth over an extended period (averaging across all types of workers) can be
obtained by breaking down changes in pay into the separate impacts from pay changes for
each type of employment (full-time and part-time for men and women) and changes in the
incidence of each type of employment at group-specific pay levels. The difference between
the observed overall change in aggregate earnings and the sum of the pay changes for each
category of employment provides an estimate of the net direct impact of compositional
changes in employment (Figure 1.21).
● There are substantial absolute shifts in some European countries from compositional
changes, especially from a lower incidence of full-time male employment.16
● However, the aggregate net direct impact of compositional changes on average pay of all
workers over time appears to be relatively moderate, despite differences in the hourly
pay rates of workers by gender and employment status.17 The net estimates imply that
compositional effects reduced the growth of average hourly (or weekly) pay in the
aggregate euro area and the United States by around 0.1% per annum on average over the
16. These compositional shifts may also help to account for the flattening of wage Phillips curves inrecent years (OECD, 2016b).
17. Compositional effects could also affect the change in total earnings (earnings per hour multipliedby the number of hours worked) depending on changes in the annual hours (or weeks) worked byeach category of employment. It may also be the case that the rising number of part-time andtemporary workers has reduced the bargaining power of full-time workers, and hence wagegrowth, and that there are stronger effects in some sub-periods within the sample used.
Figure 1.21. Compositional changes have had only modest net effectson the growth of average wages
Contributions to the overall change in average wages in selected economies (2006-14 in all EU countries and2008-16 in the United States)
Note: FT and PT refer to full-time and part-time respectively. The reference wage measure is average hourly pay in all EU economies andmedian weekly earnings in the United States. The EU data exclude public administration and enterprises with less than ten employees.Source: Eurostat, Structure of Earnings Survey; Bureau of Labor Statistics, Current Population Survey; and OECD calculations.
1 2 http://dx.doi.org/10.1787/888933630867
Euro area France Spain United StatesGermany Italy United Kingdom
-15
-10
-5
0
5
10
15
20
25
30
35% pts
-15
-10
-5
0
5
10
15
20
25
30
35% pts
PT wagesFT wagesMen PT employment
Women PT employmentMen FT employmentWomen FT employment
Aggregate earnings growth

1. GENERAL ASSESSMENT OF THE MACROECONOMIC SITUATION
OECD ECONOMIC OUTLOOK, VOLUME 2017 ISSUE 2 © OECD 2017 35
period shown.18 The effects in a number of individual euro area countries were larger, at
around 0.2% per annum on average, reflecting larger declines in the share of male
workers in full-time employment.
● Related estimates for Japan, where compositional changes in the structure of
employment have been relatively large and aggregate pay growth has been relatively
weak, suggest that the rise in the number of part-time employees may have held down
the growth of scheduled cash earnings by around ¼ percentage point per annum over
2015-16, and by between ½ and ¾ percentage point per annum over 2012-14 (Bank of
Japan, 2017).
Financial conditions remain accommodative but risks of sudden tightening persist
In many advanced economies, long-term government bond yields have remained low
since early May (when the assumptions for the last OECD Economic Outlook were set)
(Figure 1.22). In several European economies and Japan, between half and three-quarters of
government bonds still trade at negative yields. Continued low bond yields seem to reflect
investors’ expectations that policy interest rates will remain very low and that term premia
18. Average pay per hour in the euro area and median weekly earnings in the United States rose by16.9% and 14.9% between 2006-14 and 2008-16 respectively, implying average annual growth of 2%and 1.75% respectively.
Figure 1.22. Changes in bond yields, equity prices and exchange rates since early May
Note: Changes between 4 May and 23 November 2017. An increase in the nominal effective exchange rate implies its appreciation.Source: Thomson Reuters; OECD Exchange rate database; and OECD calculations.
1 2 http://dx.doi.org/10.1787/888933630886
-1 0 1 2 3
% pts
CanadaEuro area
ItalyGermany
MexicoFranceChina
United KingdomJapanIndia
United StatesIndonesia
BrazilSouth Africa
RussiaTurkey
A. 10-year government bond yields
-5 0 5 10 15 20 25
%
CanadaEuro area
ItalyGermany
MexicoFranceChina
United KingdomJapanIndia
United StatesIndonesia
BrazilSouth Africa
RussiaTurkey
B. Equity prices
-15 -10 -5 0 5 10
%
CanadaEuro area
ItalyGermany
MexicoFranceChina
United KingdomJapanIndia
United StatesIndonesia
BrazilSouth Africa
RussiaTurkey
C. Nominal effective exchange rates

1. GENERAL ASSESSMENT OF THE MACROECONOMIC SITUATION
OECD ECONOMIC OUTLOOK, VOLUME 2017 ISSUE 2 © OECD 201736
for government bonds will continue to be compressed in coming years. But this could
change as the normalisation of monetary policy advances, prompting investors to adjust
their expectations.19 Moreover, as central banks become net sellers of government bonds,
sovereign premia could also increase. In the euro area, long-term interest rates currently
better reflect differences in government indebtedness than did spreads prior to the crisis,
but sovereign premia could increase further in countries with high debt once the ECB stops
government bond purchases (Figure 1.23).
Equity prices have risen in the main advanced economies, in several cases to post-crisis
highs, helped by the broad-based upswing in global growth, higher corporate profits and,
in some countries, weaker currencies against the background of still low interest rates and
sustained risk-taking (Figures 1.22 and 1.24). However, the “improvement’’ may also reflect
vulnerability. In the United States and the euro area, price-to-earnings ratios exceed
historical averages, pointing to a potential overvaluation and risks of a future correction.
Moreover, in the United States, perceived risks of a large decline in the S&P 500 index, as
measured by the SKEW index, have risen.
Strong risk appetite is also evident in corporate bond markets in the euro area and the
United States,20 with spreads between high-yield corporate and government bond yields
remaining at levels close to recent lows in 2014, despite their recent pick-up (Figure 1.25),
and bond issuance remaining high (Figure 1.26). In the United States, non-financial
corporations have issued more than USD 0.7 trillion of bonds so far this year, and 2017 is
likely to be a third consecutive year of around USD 0.8 trillion (4.5% of GDP) issuance.
Moreover, there has been a further decline in the quality of covenants that protect the
19. For instance, if term premia were to increase to their pre-crisis levels in the United States, bondyields would go up by nearly 90 basis points, which studies show could result from the normalisationof the Federal Reserve's balance sheet (Bonis et al., 2017a, b). In addition, if policy interest rates in theUnited States were to evolve in line with FOMC median expectations rather than those implied infinancial market prices, the US 10-year yield would rise by around 60 basis points.
20. This is discussed further in Chapter 2.
Figure 1.23. Long-term bond yields in the euro area reflect differences in government debtmore closely than prior to the crisis
Note: Only OECD euro area member countries, excluding Greece. Government bond yields are annual averages. 2017 numbers refer to theOECD projections.Source: OECD Economic Outlook 102 database.
1 2 http://dx.doi.org/10.1787/888933630905
0 30 60 90 120 150 1800
1
2
3
4
5
0
1
2
3
4
520062017
10-
year
gov
ernm
ent b
ond
yiel
d, %
Gross government debt (Maastricht definition), % of GDP

1. GENERAL ASSESSMENT OF THE MACROECONOMIC SITUATION
OECD ECONOMIC OUTLOOK, VOLUME 2017 ISSUE 2 © OECD 2017 37
interests of holders of non-investment-graded bonds, including in the United States.21 The
share of non-investment-graded bonds in total corporate bond issuance has also been
rising since the financial crisis (Chapter 2).
Measures of implied volatility have declined to very low levels and indicators of
systemic stress remain subdued, but they may underestimate risks (Figure 1.27). Current
low levels of volatility indices are broadly in line with the low perceived uncertainty of
Figure 1.24. Equity market performance15-day moving average
1. Normalised values based on as long as possible historical averages expressed in standard deviations.2. The Chicago Board Options Exchange (CBOE) SKEW is an option-based measure of the perceived risk of 30-day ahead large (two or
more standard deviations) changes in returns of the S&P500. Numbers above 100 indicate a negative skew in the distribution(i.e. negative tail risk). Since the standard deviation varies over time, so does the size of expected equity price declines.
Source: Thomson Reuters; and OECD calculations.1 2 http://dx.doi.org/10.1787/888933630924
2013 2014 2015 2016 2017-1.5
-1.0
-0.5
0.0
0.5
1.0
1.5
2.0
United StatesEuro areaJapan
A. Price-to-earnings ratio¹
2013 2014 2015 2016 2017110
115
120
125
130
135
140
145
B. SKEW index²
21. Moody's US high-yield bond covenant quality measure was close to a record low in October, seeMoody's Investors Service, Global Credit Research, 14 November 2017.
Figure 1.25. Risk-taking in bond markets persists
1. EMBI stands for J.P. Morgan Emerging Market Bond Index.Source: Thomson Reuters; and OECD calculations.
1 2 http://dx.doi.org/10.1787/888933630943
2010 2011 2012 2013 2014 2015 2016 20172
3
4
5
6
7
8
9% pts
United StatesEuro area
A. Difference in yields between high-yieldcorporate and sovereign bonds
2010 2011 2012 2013 2014 2015 2016 2017100
200
300
400
500
600
700 % pts
AsiaEuropeLatin America
B. EMBI spreads for EMEs¹

1. GENERAL ASSESSMENT OF THE MACROECONOMIC SITUATION
OECD ECONOMIC OUTLOOK, VOLUME 2017 ISSUE 2 © OECD 201738
Figure 1.26. Gross issuance of bonds by non-financial corporations has been strongAnnual moving sum in per cent of annual GDP
1. Long-term bonds refer to bonds maturing in more than one year.Source: OECD Economic Outlook 102 database; US Federal Reserve; ECB; Japan Securities Dealers Association; and OECD calculations.
1 2 http://dx.doi.org/10.1787/888933630962
Figure 1.27. Volatility in financial markets has remained subdued15-day moving average of normalised values, in standard deviations
Note: The equity market volatility indices measure an expected symmetric range of movements in the main equity indices over next30 days. They are derived from options. The Merrill Lynch Option Volatility Estimate (MOVE) index and exchange rate volatility index areequivalents of the equity market volatility index for US Treasuries and exchange rates, respectively.1. The financial stress index is the Composite Indicator of Systemic Stress for the euro area and the St. Louis Fed Financial Stress Index
for the United States. Lower values of the indices imply less financial stress.Source: Thomson Reuters; and OECD calculations.
1 2 http://dx.doi.org/10.1787/888933630981
2004 2005 2006 2007 2008 2009 2010 2011 2012 2013 2014 2015 2016 20170.5
1.0
1.5
2.0
2.5
3.0
3.5
4.0
4.5
5.0
5.5 %
0.5
1.0
1.5
2.0
2.5
3.0
3.5
4.0
4.5
5.0
5.5 %
United StatesEuro area - long-term bonds¹Japan
2015 2016 2017-1.5
-1.0
-0.5
0.0
0.5
1.0
1.5
United StatesEuro areaJapan
A. Equity market volatility index
2015 2016 2017-2.0
-1.5
-1.0
-0.5
0.0
B. US MOVE index - bond yield volatility
2015 2016 2017-1.5
-1.0
-0.5
0.0
0.5
Major sevenEMEs
C. Exchange rate volatility index
2015 2016 2017-2.0
-1.5
-1.0
-0.5
0.0
0.5
1.0
United StatesEuro area
D. Financial stress index¹

1. GENERAL ASSESSMENT OF THE MACROECONOMIC SITUATION
OECD ECONOMIC OUTLOOK, VOLUME 2017 ISSUE 2 © OECD 2017 39
future economic growth, especially in the United States, suggesting perceptions of unusually
low risks in financial markets and the real economy (Figure 1.28). Financial market volatility
indices, however, tend to be strongly affected by actual volatility and are not necessarily good
predictors of future volatility. Prolonged low volatility, together with a low and flat yield curve,
tends to induce higher risk-taking and thus make the financial system more fragile (OFR, 2017).
Riskier exposures could be encouraged through lowering asset-return correlations, enticing
investors to diversify investments by buying riskier assets, and risk management practices
based on Value-at-Risk or volatility control.22 Such pro-cyclical strategies could amplify asset
price corrections and volatility if market sentiment suddenly changes.
22. Value-at-Risk and volatility control are methods to manage investment risks based on the recentvolatility of asset prices. With the Value-at-Risk method, investment positions are adjusted to limitthe potential loss based on a probability of the maximum potential loss during a given period,which is positively related to the volatility. With volatility control, the allocation between risky andsafe assets is dynamically adjusted so that the volatility of the total value of investment stays inline with a pre-determined benchmark.
Figure 1.28. Low volatility is broadly in line with the low perceived uncertaintyof future economic growth
Note: “Std dev” stands for standard deviation.Source: CBOE; Consensus Economics; and OECD calculations.
1 2 http://dx.doi.org/10.1787/888933631000
2002 2004 2006 2008 2010 2012 2014 20160
10
20
30
40
50
60
70
80
90
0.1
0.2
0.3
0.4
0.5
0.6
0.7
0.8
0.9
1.0 %
Equity market volatility indexStd dev of next year GDP forecast, in %
United States
2002 2004 2006 2008 2010 2012 2014 201610
20
30
40
50
60
70
80
0.1
0.2
0.3
0.4
0.5
0.6
0.7
0.8 %
Equity market volatility indexStd dev of next year GDP forecast, in %
Euro area
2002 2004 2006 2008 2010 2012 2014 201610
20
30
40
50
60
70
80
90
100
0.0
0.2
0.4
0.6
0.8
1.0
1.2
1.4
1.6
1.8 %
Equity market volatility indexStd dev of next year GDP forecast, in %
Japan

1. GENERAL ASSESSMENT OF THE MACROECONOMIC SITUATION
OECD ECONOMIC OUTLOOK, VOLUME 2017 ISSUE 2 © OECD 201740
Turbulence in equity markets may also be accentuated by increased index-linked
trading, used in particular by exchange-traded funds (ETFs). The assets under
management of ETFs have grown by 27% since the beginning of 2017 and have reached
USD 4.3 trillion globally (ETFGI, 2017), representing more than 5% of global market
capitalisation. The nature of ETFs, namely low transaction costs and high intraday
liquidity, has attracted investors to invest in such funds instead of the underlying assets.
However, when the underlying assets are less liquid than the ETFs, the funds can amplify
market volatility. Similarly, volatility could be heightened by investors in ETFs that are
driven by short-term returns. Demand from such investors usually evaporates during
market turmoil (Cella et al., 2013) and equity prices of companies included in the same
index tend to be strongly correlated during market turmoil (Da and Shive, 2014).
Financial conditions have tightened in China but eased in other large EMEs amid
continued risk-taking. In China, this primarily resulted from macro-prudential and
deleveraging measures, targeting in particular the shadow banking system. Nevertheless,
total social financing flows in relation to GDP have remained robust (Figure 1.29). In many
other EMEs, equity prices have increased and currencies have depreciated (Figure 1.22).
Moreover, in some economies, the monetary policy stance has been eased and longer-term
interest rates have declined, especially in India and Indonesia (Figure 1.22). Sovereign bond
yield spreads vis-à-vis US Treasuries have declined to or below the levels last seen in 2014
in Asian and European EMEs (Figure 1.25). Capital is reported to have continued to flow into
EMEs at a similar pace as in 2016, following short-lived capital outflows at the turn of the
year. The increased risk tolerance of global investors has also allowed sub-prime
sovereigns to issue debt at favourable rates. However, EMEs continue to be exposed to
vulnerabilities, relating to recent rapid credit growth, especially in China, the exchange
rate exposures of non-financial corporations and shifts in investors' sentiment (OECD,
2017c; Chapter 2).
Figure 1.29. Total social financing flows in China remain robust despite the tighteningof financial conditions
4-quarter moving sum of flows over 4-quarter moving sum of GDP
Source: OECD Economic Outlook 102 database; Thomson Reuters; and OECD calculations.1 2 http://dx.doi.org/10.1787/888933631019
Q1 Q2 Q3 Q4 Q1 Q2 Q3 Q4 Q1 Q2 Q3 Q4 Q1 Q2 Q32014 2015 2016 2017
0
5
10
15
20
25
30
35 %
0
5
10
15
20
25
30
35 %
Bank loansStocks of non-financial enterprisesCorporate bonds
Trust loansEntrusted loansTotal

1. GENERAL ASSESSMENT OF THE MACROECONOMIC SITUATION
OECD ECONOMIC OUTLOOK, VOLUME 2017 ISSUE 2 © OECD 2017 41
Policy measures need to catalyse a private sector responseIn advanced economies, the firming and broadening recovery and financial stability risks
call for a gradual normalisation of monetary policy, but to a varying degree across the main
areas. This should be accompanied by further rebalancing of the policy mix towards fiscal
policy changes and structural policy packages that strengthen potential output, building on the
welcome initiatives taken in a number of countries in the past year. The monetary policy
normalisation process will need to be calibrated against the financial market response,
realised and expected inflation, and the need to support growth. Fiscal policy easing in 2018
should be implemented as planned, but with an increased focus on measures that enhance
support for long-term supply potential and inclusive growth. A more active use of structural
measures is necessary to create the environment in which business investment will
strengthen to promote productivity growth, and thus the growth of real wages. Improved
potential output is essential to underpin fiscal sustainability and living standards in the longer
term. EMEs should adjust macroeconomic policies in line with macroeconomic developments,
address vulnerabilities related to the build-up in private sector indebtedness in view of
prospective tighter financial conditions in advanced economies (Chapter 2), and buttress the
structural underpinnings of longer-term growth. In all countries, measures are required to
ensure that the benefits of economic growth are more equally distributed within societies.
Monetary policy should be data driven, considering real, financial and price dynamics
Monetary authorities in the main advanced economies face the challenge of
calibrating policy stances against a backdrop of stronger near-term growth momentum
and narrowing economic slack, but not yet sufficiently strong inflationary pressures,
insufficient improvement in supply-side potential, and still-high political and economic
risks. Uncertainty about inflation dynamics and financial market developments calls for a
multiple indicator, data-driven strategy for normalising monetary policy. Identifying and
explaining the reasons for recently-subdued inflation rates will be key for central banks'
decisions and communication. If inflation is currently held down by forces which are
beyond the control of national central banks (like positive technological shocks, regulation
or global forces), it would in principle justify a delayed and slower withdrawal of monetary
policy stimulus than otherwise. However, given the already lengthy period of a very
expansionary monetary policy stance, this could aggravate mispricing of asset prices and
may not be warranted. In such a case, some undershooting of inflation targets may have to
be tolerated but should be clearly communicated as being related to exceptional
circumstances. By the same token, should inflation rise if non-linearities in the
relationship between labour markets, prices and wages emerge, an over-shooting of the
inflation objective should not engender a sharp response.
The large balance sheets of key central banks, following years of quantitative easing,
raise questions about the sequencing of decisions regarding central bank assets and policy
interest rates. The US Federal Reserve, after having stopped net asset purchases at end-2014,
has raised the policy rate gradually by 100 basis points since December 2015 and initiated a
plan to gradually scale back reinvestments of maturing securities in a predictable way.23 This
23. As of October 2017, principal payments from maturing securities are planned to be reinvested onlyif they exceed gradually rising caps (from USD 6 billion per month to USD 30 billion for Treasuriesand from USD 4 billion per month to USD 20 billion for agency debt and mortgage-backedsecurities (MBS); caps for agency debt and MBS may stop being binding before reaching themaximum cap (Federal Reserve Board, 2017; Federal Reserve Bank of New York, 2017).

1. GENERAL ASSESSMENT OF THE MACROECONOMIC SITUATION
OECD ECONOMIC OUTLOOK, VOLUME 2017 ISSUE 2 © OECD 201742
strategy has advantages and so far has not led to market disruptions. Effects of asset
reductions on financial conditions are likely to be more uncertain than those of policy rate
changes, if for no other reason that central banks have greater experience with using policy
rates (Bernanke, 2017). It would also be easier to reverse any rise in policy rates, compared
with an asset reduction, if growth were to moderate too quickly. The US normalisation
strategy may serve as a blueprint for the ECB and the Bank of Japan,24 which are still
increasing assets held, though they may decide on different modalities to reflect
area-specific circumstances.
The normalisation of monetary policy raises questions also about the ultimate size of
balance sheets and instrument use in the future (Inaba et al., 2015; Box 1.2). The authorities
can opt either for returning to the pre-crisis practice of controlling overnight interest rates
with small balance sheets or for using the interest rate on banks' reserves at the central
bank as a floor for market rates with large balance sheets, as in recent years. The floor
24. The ECB has already announced elements of a similar strategy, involving a reduction of assetpurchases and a commitment to keep interest rates low well past the end of asset purchases.
Box 1.2. Future monetary policy frameworks and the sizeof central banks’ balance sheets
Given extraordinary monetary policy stimulus in the aftermath of the 2008 financial crisis, the size ofmajor central banks’ balance sheets and their composition have changed significantly (figure below). In theprocess of policy normalisation, the balance sheets are likely to be reduced but their ultimate size willdepend primarily on the type of the future operational framework. The size of balance sheets will also beaffected by the demand for banknotes. This box discusses different operational frameworks and thepossible evolution of public demand for banknotes.
The size and composition of central banks' balance sheets have changed massivelyover the past decade
Note: “A“ stands for assets, “L“ stands for liabilities.Source: US Federal Reserve; European Central Bank; and Bank of Japan.
1 2 http://dx.doi.org/10.1787/888933630449
Dec. 2006 Oct. 20170
1
2
3
4
5
6USD trillion
9%
90%90%10%
14%
51%
35%
98%
2%
A L
A L
SecuritiesOther assets
Other liabilities + capitalBank reservesBanknotes
United States
Dec. 2006 Oct. 20170.0
0.5
1.0
1.5
2.0
2.5
3.0
3.5
4.0
4.5EUR trillion
30%15%
55%
100% 28%
45%
26%
52%
48%
A L
A L
Euro area
Dec. 2006 Oct. 20170
100
200
300
400
500
600JPY trillion
22%9%
69%
71%
29%
6%
75%
20%
88%
12%
A L
A L
Japan

1. GENERAL ASSESSMENT OF THE MACROECONOMIC SITUATION
OECD ECONOMIC OUTLOOK, VOLUME 2017 ISSUE 2 © OECD 2017 43
Box 1.2. Future monetary policy frameworks and the sizeof central banks’ balance sheets (cont.)
Overview of operational frameworks of monetary policy
The corridor system has become a dominant operational monetary policy framework since the Bank ofCanada first adopted it in 1994. The name derives from its feature of formulating a corridor of interest rates byputting a ceiling and a floor on short-term interest rates with standing lending and deposit facilities,respectively.1 In the corridor system, central banks provide short-term liquidity (reserve balances) to neutraliseaggregated liquidity imbalances of financial institutions, with liquidity distributed through the banking systemvia money markets. When liquidity provision is insufficient, short-term interest rates may go up to the ceiling,and vice versa. The corridor systems have been often combined with reserve requirements, helping stabiliseday-to-day fluctuations in market demand for reserve balances and making it easier for central banks to predictdemand.
A possible variant to the corridor system with still small reserve balances, not currently adopted by any majorcentral bank, is the zero-corridor system where financial institutions are always allowed to obtain enoughliquidity and to deposit all the excess liquidity at central banks’ target rates without penalty. Therefore,financial institutions do not have any incentive to maintain precautionary reserve balances and central banksdo not need to provide liquidity through market operations.
Another variant to the corridor system is the floor system. Under the floor system, central banks maintainshort-term interest rates at the floor rate by deliberately supplying ample reserves in excess of market demand.Central banks that have expanded their balance sheets in recent years have been effectively operating the floorsystem.
In terms of the size and fluctuations of reserves, balances are the largest under the floor system, with littleday-to-day fluctuations. In this framework, central banks can change the size of reserve balances withoutaffecting short-term interest rates. In contrast, balances are significantly smaller under the corridor andzero-corridor systems and fluctuations are usually bigger. Reserve balances are likely to be slightly larger underthe corridor system accompanied with reserve requirement arrangements than in the zero-corridor system.With the zero-corridor system, the size of reserve balances fluctuates with changes in demand from financialinstitutions.
Short-term market interest rates are best controlled in the zero-corridor and the floor systems. They mayfluctuate considerably in the corridor system unless central banks intervene in money markets intensively. Asa consequence, money market activity would be very limited under the floor system, in contrast to the corridorsystem. Well-functioning money markets are valuable for signalling liquidity and credit conditions. Under thezero-corridor system, allowing easy access to central banks’ standing facilities is likely to reduce the stigma ofusing central banks’ lending facilities. This is beneficial in case of market disruption, but may cause moralhazard in normal times.
Larger reserve balances under the floor system can contribute to financial stability. Ample reserves can workas a buffer in event of market liquidity shocks and could weaken, or crowd out, excessive short-term financingamong private sector participants by satisfying the demand for safe short-term assets (Greenwood et al., 2016).On the other hand, larger reserve balances, probably with a high amount of government debt holdings, mayinduce higher political pressure on central banks. This could be motivated, among other things, by largefluctuations in net interest income and possible financial losses, since changes in policy interest rates passthrough faster to the remuneration of reserve balances than to revenues from assets. These potential lossescould be minimised by keeping the maturity of central banks' government bond holdings short.
Each framework has advantages and disadvantages and each could serve in the future as the main operatingframework. The increasing focus on financial stability issues and currently-large balance sheets tend to favourthe floor system. Maintaining the floor system and the associated large holdings of government bonds bycentral banks would also avoid the potential instability in financial markets that might occur if central bankswere to reduce their balance sheets.
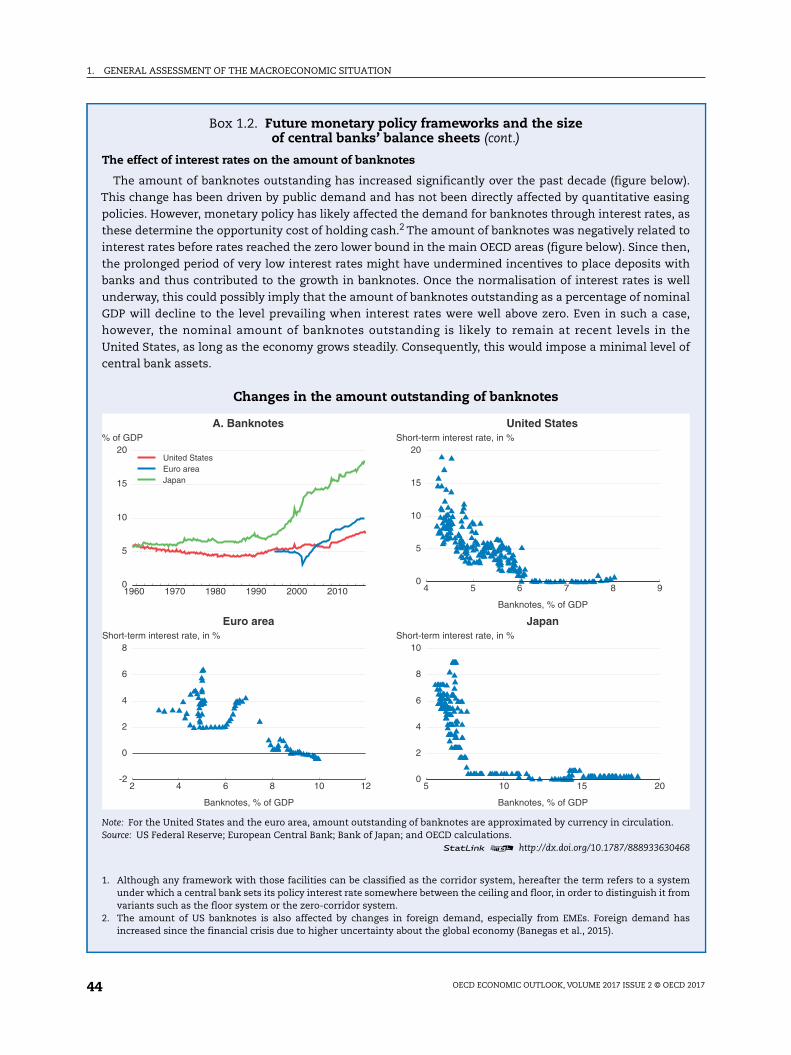
1. GENERAL ASSESSMENT OF THE MACROECONOMIC SITUATION
OECD ECONOMIC OUTLOOK, VOLUME 2017 ISSUE 2 © OECD 201744
Box 1.2. Future monetary policy frameworks and the sizeof central banks’ balance sheets (cont.)
The effect of interest rates on the amount of banknotes
The amount of banknotes outstanding has increased significantly over the past decade (figure below).This change has been driven by public demand and has not been directly affected by quantitative easingpolicies. However, monetary policy has likely affected the demand for banknotes through interest rates, asthese determine the opportunity cost of holding cash.2 The amount of banknotes was negatively related tointerest rates before rates reached the zero lower bound in the main OECD areas (figure below). Since then,the prolonged period of very low interest rates might have undermined incentives to place deposits withbanks and thus contributed to the growth in banknotes. Once the normalisation of interest rates is wellunderway, this could possibly imply that the amount of banknotes outstanding as a percentage of nominalGDP will decline to the level prevailing when interest rates were well above zero. Even in such a case,however, the nominal amount of banknotes outstanding is likely to remain at recent levels in theUnited States, as long as the economy grows steadily. Consequently, this would impose a minimal level ofcentral bank assets.
Changes in the amount outstanding of banknotes
Note: For the United States and the euro area, amount outstanding of banknotes are approximated by currency in circulation.Source: US Federal Reserve; European Central Bank; Bank of Japan; and OECD calculations.
1 2 http://dx.doi.org/10.1787/888933630468
1. Although any framework with those facilities can be classified as the corridor system, hereafter the term refers to a systemunder which a central bank sets its policy interest rate somewhere between the ceiling and floor, in order to distinguish it fromvariants such as the floor system or the zero-corridor system.
2. The amount of US banknotes is also affected by changes in foreign demand, especially from EMEs. Foreign demand hasincreased since the financial crisis due to higher uncertainty about the global economy (Banegas et al., 2015).
1960 1970 1980 1990 2000 20100
5
10
15
20% of GDP
United StatesEuro areaJapan
A. Banknotes
4 5 6 7 8 90
5
10
15
20Short-term interest rate, in %
United States
Banknotes, % of GDP
2 4 6 8 10 12-2
0
2
4
6
8Short-term interest rate, in %
Euro area
Banknotes, % of GDP
5 10 15 200
2
4
6
8
10Short-term interest rate, in %
Japan
Banknotes, % of GDP
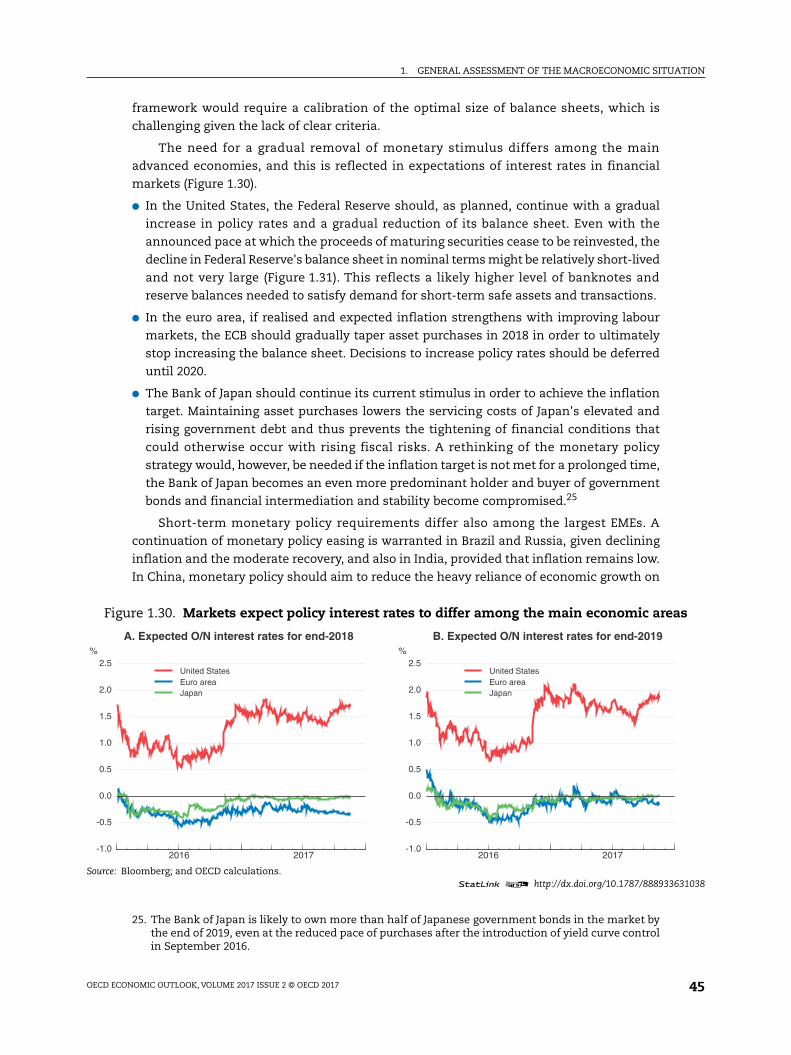
1. GENERAL ASSESSMENT OF THE MACROECONOMIC SITUATION
OECD ECONOMIC OUTLOOK, VOLUME 2017 ISSUE 2 © OECD 2017 45
framework would require a calibration of the optimal size of balance sheets, which is
challenging given the lack of clear criteria.
The need for a gradual removal of monetary stimulus differs among the main
advanced economies, and this is reflected in expectations of interest rates in financial
markets (Figure 1.30).
● In the United States, the Federal Reserve should, as planned, continue with a gradual
increase in policy rates and a gradual reduction of its balance sheet. Even with the
announced pace at which the proceeds of maturing securities cease to be reinvested, the
decline in Federal Reserve's balance sheet in nominal terms might be relatively short-lived
and not very large (Figure 1.31). This reflects a likely higher level of banknotes and
reserve balances needed to satisfy demand for short-term safe assets and transactions.
● In the euro area, if realised and expected inflation strengthens with improving labour
markets, the ECB should gradually taper asset purchases in 2018 in order to ultimately
stop increasing the balance sheet. Decisions to increase policy rates should be deferred
until 2020.
● The Bank of Japan should continue its current stimulus in order to achieve the inflation
target. Maintaining asset purchases lowers the servicing costs of Japan's elevated and
rising government debt and thus prevents the tightening of financial conditions that
could otherwise occur with rising fiscal risks. A rethinking of the monetary policy
strategy would, however, be needed if the inflation target is not met for a prolonged time,
the Bank of Japan becomes an even more predominant holder and buyer of government
bonds and financial intermediation and stability become compromised.25
Short-term monetary policy requirements differ also among the largest EMEs. A
continuation of monetary policy easing is warranted in Brazil and Russia, given declining
inflation and the moderate recovery, and also in India, provided that inflation remains low.
In China, monetary policy should aim to reduce the heavy reliance of economic growth on
25. The Bank of Japan is likely to own more than half of Japanese government bonds in the market bythe end of 2019, even at the reduced pace of purchases after the introduction of yield curve controlin September 2016.
Figure 1.30. Markets expect policy interest rates to differ among the main economic areas
Source: Bloomberg; and OECD calculations.1 2 http://dx.doi.org/10.1787/888933631038
2016 2017-1.0
-0.5
0.0
0.5
1.0
1.5
2.0
2.5 %
United StatesEuro areaJapan
A. Expected O/N interest rates for end-2018
2016 2017-1.0
-0.5
0.0
0.5
1.0
1.5
2.0
2.5 %
United StatesEuro areaJapan
B. Expected O/N interest rates for end-2019

1. GENERAL ASSESSMENT OF THE MACROECONOMIC SITUATION
OECD ECONOMIC OUTLOOK, VOLUME 2017 ISSUE 2 © OECD 201746
credit, thus targeting actions toward reducing the risks stemming from the significant
accumulation of corporate and local government debt. The challenge for the Chinese
authorities is to strike a balance between supporting demand and containing high risks to
financial stability.
Structural and fiscal initiatives are still needed to boost potential growth
The fiscal policy stance is being eased in the majority of advanced economies as
governments take advantage of the increase in the fiscal space offered by low borrowing
costs. In the median OECD economy, a fiscal easing of just over ½ per cent of GDP is
projected to occur over 2017-19, with the main boost in 2017 and 2018, after consolidation
of around ½ per cent of GDP over 2015-16 (Figure 1.32). Despite the expected easing in
many OECD countries, overall budget balances are projected to improve between 2017
and 2019, reflecting lower net interest payments and stronger cyclical momentum
(Figure 1.33). Government gross interest payments have already declined between 2011
and 2017, even in many OECD countries with rising debt and even on a net basis,
i.e. accounting for interest earnings on government financial assets (Figure 1.34).
How vulnerable are fiscal conditions to a rise in interest rates? Stylised simulations for
the largest advanced economies (excluding Japan) suggest that even a lasting increase in
10-year government bond yields of 1 percentage point compared with the current Economic
Outlook projections might worsen budget balances on average by only between 0.1% and
0.3% of GDP annually in the following three years.26 Moreover, these estimates do not take
Figure 1.31. Projections of the US Federal Reserve balance sheet
Notes: Figures for 2006-2016 are historical settled holdings. Smaller and larger liabilities projections are based, respectively, on the 25th
percentile and 75th percentile responses to a question about the size and composition of the Federal Reserve’s long-run balance sheet inthe New York Fed’s June 2017 Survey of Primary Dealers and Market Participants.Source: Federal Reserve Bank of New York; and OECD calculations.
1 2 http://dx.doi.org/10.1787/888933631057
2006 2007 2008 2009 2010 2011 2012 2013 2014 2015 2016 2017 2018 2019 2020 2021 2022 2023 2024 20250
1
2
3
4
5USD trillion
0
1
2
3
4
5 USD trillion
TreasuriesMBS & Agency debt
Larger liabilitiesMedian liabilitiesSmaller liabilities
26. The budget impact is calculated as the increase in interest payments that would occurcumulatively in the following three years if the long-end of the yield curve increases permanentlyby 1 percentage point, while the short-end remains unchanged compared with the baseline andthe yields in between adjust linearly. The increase in 10-year yields could be prompted by marketparticipants expecting higher policy interest rates, normalisation of term premia or higher fiscalrisk premia. These stylised calculations assume that higher interest rates have no effect onnominal growth and the primary balance and that the maturity structure of new debt issues is thesame as the remaining maturity of government debt as of October 2017. Higher interest rates areassumed not to be passed through to returns on government financial assets.

1. GENERAL ASSESSMENT OF THE MACROECONOMIC SITUATION
OECD ECONOMIC OUTLOOK, VOLUME 2017 ISSUE 2 © OECD 2017 47
into account two factors that might reduce the budget impact. First, in countries where
central banks hold a significant share of government debt, debt servicing costs are
effectively reduced as central banks' profits are ultimately transferred to governments.
Second, higher nominal growth would likely reduce the fiscal burden of higher interest
rates thanks to an improved primary balance and denominator effects.
Against the background of mildly expansionary fiscal policies, there is a need to
implement supply-side-enhancing measures to ensure that growth strengthens in a
Figure 1.32. The fiscal stance is expected to ease in many OECD countriesChange between 2016 and 2019 in the underlying primary balance, as a percentage of potential GDP
Source: OECD Economic Outlook 102 database; and OECD calculations.1 2 http://dx.doi.org/10.1787/888933631076
-3.0
-2.5
-2.0
-1.5
-1.0
-0.5
0.0
0.5
1.0
1.5
2.0 % pts
-3.0
-2.5
-2.0
-1.5
-1.0
-0.5
0.0
0.5
1.0
1.5
2.0 % pts
GB
R
ISL
SV
K
AU
S
JPN
IRL
NO
R
FR
A
CH
E
SW
E
ISR
OE
CD
CZ
E
PO
L
US
A
KO
R
ES
P
LTU
NZ
L
DN
K
EA
ITA
AU
T
CA
N
BE
L
DE
U
ES
T
PR
T
SV
N
HU
N
NLD
LVA
LUX
FIN
GR
C
Median tightening in OECD countries, 2015-16
Median easing in OECD countries, 2017-19
Tightening
Easing
Figure 1.33. Overall government budget balances are projected to improve in most OECD countriesChange between 2017 and 2019
Note: Excluding Greece and countries for which data are not available.Source: OECD Economic Outlook 102 database; and OECD calculations.
1 2 http://dx.doi.org/10.1787/888933631095
-1.0 -0.5 0.0 0.5 1.0 1.5 2.0-2.0
-1.5
-1.0
-0.5
0.0
0.5
1.0
Str
uctu
ral c
onso
lidat
ion,
% p
ts o
f pot
entia
l GD
P
Change in overall budget balance, % pts of GDP

1. GENERAL ASSESSMENT OF THE MACROECONOMIC SITUATION
OECD ECONOMIC OUTLOOK, VOLUME 2017 ISSUE 2 © OECD 201748
sustainable way, increases in incomes and living standards are shared broadly and public
finances are sustainable.
● These measures should involve hard, soft and remedial infrastructure investment, with the
mix differing across countries according to need, as such spending enhances longer-term
supply and adds to aggregate demand.27
● Countries should also aim to restructure their spending and tax policies towards a more
growth-friendly and inclusive mix, including through the tax and transfer system
(Cournède et al., 2013; Fournier and Johansson, 2016).
● Moreover, coherent packages of structural reforms are needed. These can enhance the
overall effectiveness of policies by raising their combined economic impact and helping
to ensure that their benefits are widely shared (OECD, 2017c). In particular, reforms to
reduce barriers to product market competition, either at home or from abroad, should be
accompanied by labour market measures. The latter can help vulnerable workers
transition to new jobs, as product market reforms may be associated with more frequent
transitions out of employment for less qualified and low-income workers (Cournède et
al., 2016) and may result in job losses concentrated in specific industries or geographical
locations (OECD, 2017c). Yet in recent years there has only been a limited packaging of
reforms. Policy efforts have been concentrated either in the labour market or product
markets, but very rarely in both areas (OECD, 2017b), despite the opportunities that exist
to combine measures to boost competition, either in domestic product markets or
through lower barriers to international trade and investment, with specific labour
reforms.
Figure 1.34. Government interest payments have declined despite rising debtin many OECD countries
Change from 2011 to 2017 as a per cent of GDP
Note: Excluding Greece and countries for which data are not available. The left hand side panel shows only countries with rising debtbetween 2011 and 2017.Source: OECD Economic Outlook 102 database; and OECD calculations.
1 2 http://dx.doi.org/10.1787/888933631114
-1.8
-1.6
-1.4
-1.2
-1.0
-0.8
-0.6
-0.4
-0.2
0.0 % pts
ES
TA
US
LUX
SV
KU
SA
FIN
NO
RJP
NG
BR
FR
AS
WE
KO
RC
AN
NLD
PR
TE
SP
EA
BE
LA
UT
PO
LIT
AH
UN
Gross interest paymentsNet interest payments
-2.5 -2.0 -1.5 -1.0 -0.5 0.0-40
-30
-20
-10
0
10
20
30
40
50 Change in gross debt, % pts
Change in gross interest payments, % pts
27. Stylised simulations show that several OECD countries could debt finance spending of this type,amounting to 0.5% of GDP, for 3-4 years on average and boost output without a deterioration indebt-to-GDP ratios in the long term (Mourougane et al., 2016).

1. GENERAL ASSESSMENT OF THE MACROECONOMIC SITUATION
OECD ECONOMIC OUTLOOK, VOLUME 2017 ISSUE 2 © OECD 2017 49
● Services sector reforms that tackle regulatory barriers, such as licenses and a lack of
recognition of qualifications, could help small and medium-sized enterprises scale up at
an earlier stage by entering international markets through digital platforms and
networks (OECD, 2017g). Simultaneous labour market reforms that soften the regulatory
burden of scaling up could help such companies achieve the full benefits of more open
and competitive services markets.
Bibliography
Adalet McGowan, M., D. Andrews and V. Millot (2017), “Insolvency Regimes, Zombie Firms and CapitalReallocation”, OECD Economics Department Working Papers, No. 1399, OECD Publishing, Paris. DOI:http://dx.doi.org/10.1787/5a16beda-en
Alesina, A., S. Ardagna, G. Nicoletti and F. Schiantarelli (2005), “Regulation and Investment”, Journal ofthe European Economic Association, 3(4), 791–825.
Auer, R. and A. M. Fischer (2010), “The Effect of Low-Wage Import Competition on U.S. InflationaryPressure”, Journal of Monetary Economics, 57(4), 491-503.
Banegas, A., R. Judson, C. Sims and V. Stebunovs (2015), “International Dollar Flows”, FRB InternationalFinance Discussion Paper, No. 1144. DOI: http://dx.doi.org/10.2139/ssrn.2664167
Bank of Japan (2017), Outlook for Economic Activity and Prices, July 2017.
Bernanke, B. (2017), “Shrinking the Fed’s balance sheet”, The Brookings Institution blog, January 26.
Bonis, B., J. Ihrig and W. Min (2017a), “The Effect of the Federal Reserve’s Securities Holdings on Longer-term Interest Rates”, FEDS Notes, Washington: Board of Governors of the Federal Reserve System,20 April, DOI: https://doi.org/10.17016/2380-7172.1977.
Bonis, B., J. Ihrig and W. Min (2017b), “Projected Evolution of the SOMA Portfolio and the 10-yearTreasury Term Premium Effect”, FEDS Notes, Washington: Board of Governors of the FederalReserve System, 22 September.
Broadbent, B. (2015), “Compositional Shifts in the Labour Market”, speech at Bank of Englandconference ‘Understanding the Great Recession: From Micro to Macro’, September.
Carey, D., J. Lester and I. Luong (2016), “Boosting Productivity Through Greater Small BusinessDynamism in Canada”, OECD Economics Department Working Papers, No. 1314, OECD Publishing,Paris. DOI: http://dx.doi.org/10.1787/5jlv23k891r8-en
Cella, C., A. Ellul and M. Giannetti (2013), “Investors’ Horizons and the Amplification of MarketShocks”, The Review of Financial Studies, 26(7), 1607–1648, Oxford University Press.
Cœuré, B. (2017), “Scars or Scratches? Hysteresis in the euro area”, speech at the International Centerfor Monetary and Banking Studies, Geneva, May 2017.
Cournède, B. et al., (2013), “Reconciling Fiscal Consolidation With Growth and Equity”, OECD Journal:Economic Studies, Vol. 2013/1. DOI: http://dx.doi.org/10.1787/eco_studies-2013-5jzb44vzbkhd
Cournède, B. et al., (2016), "Enhancing Economic Flexibility: What is in it for Workers?”, OECD EconomicPolicy Paper, No. 19, OECD Publishing, Paris. https://www.oecd.org/eco/Enhancing-economic-flexibility-what-is-in-it-for-workers.pdf
Da, Z. and S. Shive (2014), “Exchange Traded Funds and Asset Return Correlations”, Working Paper,Notre Dame University.
Daly, M. and B. Hobijn (2017), “Composition, Selection and Aggregate Real Wage Growth”, AmericanEconomic Review (Papers and Proceedings), 107(5), 349-52.
Deloitte (2014), CFO Survey: Looking Beyond The Clouds, Q3:2014 Survey, Deloitte Australia.
Deutsche Bundesbank (2015), “Slowdown in Growth in the Emerging Market Economies”, DeutscheBundesbank Monthly Report, July.
Döttling, R., G. Gutiérrez and T. Philippon (2017), “Is There An Investment Gap in Advanced Economies?If So, Why?”, paper presented at ECB Forum on Central Banking, Sintra, 2017.

1. GENERAL ASSESSMENT OF THE MACROECONOMIC SITUATION
OECD ECONOMIC OUTLOOK, VOLUME 2017 ISSUE 2 © OECD 201750
Égert, B. and P. Gal (2017), “The Quantification of Structural Reforms in OECD Countries: A NewFramework”, OECD Economics Department Working Papers, No. 1354, OECD Publishing, Paris. DOI:http://dx.doi.org/10.1787/2d887027-en
ETFGI (2017), “ETFGI Global ETF and ETP industry highlights”, etfgi.com, July.
Federal Reserve Bank of New York (2017), Projections for the SOMA Portfolio and Net Income. An update toprojections presented in the “Report on Domestic Open market Operations during 2016”, July.
Federal Reserve Board (2017), “Addendum to the Policy Normalization Principles and Plans”. https://www.federalreserve.gov/monetarypolicy/files/FOMC_PolicyNormalization.20170613.pdf
Fournier, J.M. (2015), “The Negative Effect of Regulatory Divergence on Foreign Direct Investment”,OECD Economics Department Working Papers, No. 1268, OECD Publishing, Paris. DOI: http://dx.doi.org/10.1787/5jrqgvg0dw27-en
Fournier, J.M. and Å. Johansson (2016), “The Effect of the Size and the Mix of Public Spending onGrowth and Inequality”, OECD Economics Department Working Papers, No. 1344, OECD Publishing,Paris. DOI: http://dx.doi.org/10.1787/f99f6b36-en
Gal, P. and A. Hijzen (2016), “The Short-Term Impact of Product Market Reforms: A Cross-Country FirmLevel Analysis”, OECD Economics Department Working Papers, No. 1311, OECD Publishing. DOI: http://dx.doi.org/10.1787/5jlv2jm07djl-en
Greenwood, R., S. Hanson and J. Stein (2016), “The Federal Reserve’s Balance Sheet as aFinancial-Stability Tool”, mimeo.
Haugh, D., et al. (2016), “Cardiac Arrest or Dizzy Spell: Why is World Trade So Weak and What canPolicy Do About It?”, OECD Economic Policy Papers, No. 18, OECD Publishing, Paris. DOI: http://dx.doi.org/10.1787/5jlr2h45q532-en
Inaba, K., R. O’Farrell, Ł. Rawdanowicz and A. K. Christensen (2015), “The Conduct of Monetary Policyin the Future: Instrument Use”, OECD Economics Department Working Papers, No. 1187, OECDPublishing, Paris. DOI: http://dx.doi.org/10.1787/5js4w293c46j-en
Krueger, A.B. (2017), “Where Have All the Workers Gone? An Inquiry into the Decline of the U.S. LabourForce Participation Rate”, Brookings Papers on Economic Activity, (forthcoming).
Lorenzoni, L., J. Millar, F. Sassi and D. Sutherland (2017), “Cyclical vs Structural Effects on Health CareExpenditure Trends in OECD Countries”, OECD Health Working Papers, No. 92, OECD Publishing,Paris. DOI: http://dx.doi.org/10.1787/be74e5c5-en
Millar, J. and D. Sutherland (2016), “Unleashing Private Sector Productivity in the United States”, OECDEconomics Department Working Papers, No. 1328, OECD Publishing, Paris. DOI: http://dx.doi.org/10.1787/5jlpq7zk4j30-en
Mourougane, A., et al. (2016), “Can an Increase in Public Investment Sustainably Lift EconomicGrowth?”, OECD Economics Department Working Papers, No. 1351, OECD Publishing, Paris. DOI: http://dx.doi.org/10.1787/a25a7723-en
Norman, D. (2016), “Lowering the Bar: Hurdle Rates”, US Manufacturers Alliance for Productivity andInnovation, April.
OECD (2015), “Lifting Investment for Higher Sustainable Growth”, OECD Economic Outlook, Volume 2015,Issue 1, OECD Publishing, Paris. DOI: http://dx.doi.org/10.1787/eco_outlook-v2015-1-en
OECD (2016a), OECD Economic Outlook, Volume 2016, Issue 2, OECD Publishing, Paris. DOI: http://dx.doi.org/10.1787/eco_outlook-v2016-2-en
OECD (2016b), OECD Employment Outlook 2016, Chapter 1, OECD Publishing, Paris. DOI: http://dx.doi.org/10.1787/empl_outlook-2016-en
OECD (2017a), Investing in Climate, Investing in Growth, OECD Publishing, Paris. DOI: http://dx.doi.org/10.1787/9789264273528-en
OECD (2017b), Economic Policy Reforms 2017: Going for Growth, OECD Publishing, Paris. DOI: http://dx.doi.org/10.1787/growth-2017-ec
OECD (2017c), OECD Economic Outlook, Volume 2017, Issue 1, OECD Publishing, Paris. DOI: http://dx.doi.org/10.1787/eco_outlook-v2017-1-en
OECD (2017d), OECD Economic Surveys: China 2017, OECD Publishing, Paris. DOI: http://dx.doi.org/10.1787/eco_surveys-chn-2017-en

1. GENERAL ASSESSMENT OF THE MACROECONOMIC SITUATION
OECD ECONOMIC OUTLOOK, VOLUME 2017 ISSUE 2 © OECD 2017 51
OECD (2017e), OECD Economic Surveys: India 2017, OECD Publishing, Paris. DOI: http://dx.doi.org/10.1787/eco_surveys-ind-2017-en
OECD (2017f), OECD Economic Surveys: Mexico 2017, OECD Publishing, Paris. DOI: http://dx.doi.org/10.1787/eco_surveys-mex-2017-en
OECD (2017g), Services Trade Policies and the Global Economy, OECD Publishing, Paris. DOI: http://dx.doi.org/10.1787/9789264275232-en
OECD (2017h), Entrepreneurship At A Glance 2017, OECD Publishing, Paris. DOI: http://dx.doi.org/10.1787/entrepreneur_aag-2017-en
OECD-WTO (2017), Nowcast TiVA Estimates: Methodology, OECD Publishing, Paris.
OFR (2017), “The Volatility Paradox: Tranquil Markets May Harbor Hidden Risks”, Markets Monitor,Second Quarter, Office of Financial Research, June 30.
Sharpe, S.A. and G.A. Suarez (2014), “Why Isn’t Investment More Sensitive to Interest Rates? Evidencefrom Surveys”, Federal Reserve Board Finance and Economic Discussion Series, No. 2014-002.
World Bank (2017), Global Economic Prospects: Weak Investment in Uncertain Times January 2017, WorldBank, Washington.
WTO (2017), Report to the Trade Policy Review Body from the Director-General on Trade-Related Developments,July, World Trade Organisation, Geneva.

1. GENERAL ASSESSMENT OF THE MACROECONOMIC SITUATION
OECD ECONOMIC OUTLOOK, VOLUME 2017 ISSUE 2 © OECD 201752
ANNEX A1
Policy and other assumptions underlying the projections
Fiscal policy settings for 2018 and 2019 are based as closely as possible on legislated tax
and spending provisions and are consistent with growth, inflation and wage projections.
Where government plans have been announced but not legislated, they are incorporated if
it is deemed clear that they will be implemented in a shape close to that announced. For
the United States, with the fiscal programme yet to be finalised, the projections assume an
increase in the underlying primary deficit of around ½ per cent of GDP in 2018, primarily
due to reduced taxes. Elsewhere, where there is insufficient information to determine
budget outcomes, underlying primary balances are kept unchanged, implying no
discretionary change in the fiscal stance; in euro area countries, the stated targets in
Stability Programmes are also used. In Japan, it is assumed that a consumption tax rise is
implemented in the fourth quarter of 2019.
Regarding monetary policy, the assumed path of policy interest rates represents the
most likely outcome, conditional upon the OECD projections of activity and inflation,
which may differ from the stated path of the monetary authorities.
● In the United States, the upper bound of the target federal funds rate is assumed to be
raised gradually to reach 2.75% in December 2019, up from the current level of 1.25%.
● In Japan, the overnight interest rate is assumed to be kept at -0.1% for the entire
projection period.
● In the euro area, the main refinancing rate is assumed to be kept at 0% and the deposit
interest rate at -0.4% until the end of 2019.
● In China, monetary policy is assumed to be neutral, with a tightening bias to address
financial stability risks and targeted easing to ease access to credit by small and
agriculture businesses.
● In India, the repo rate is assumed to be cut from the current level of 6% to 5.75% in
mid-2018 and then remain constant.
● In Brazil, the policy rate is assumed to be cut gradually from the current level of 7.5% to
7% by the end of 2019.
Although their impact is difficult to assess, the following quantitative easing
measures are assumed to be taken over the projection period, implicitly affecting long-
term interest rates. In the United States, it is assumed that the Federal Reserve reduces, as
announced, the stock of asset holdings as October 2017. In Japan, the Bank of Japan’s asset
purchases and yield curve control are assumed to last until the end of 2019, maintaining
the 10-year government bond yield at 0%. In the euro area, it is assumed that the ECB will

1. GENERAL ASSESSMENT OF THE MACROECONOMIC SITUATION
OECD ECONOMIC OUTLOOK, VOLUME 2017 ISSUE 2 © OECD 2017 53
gradually taper asset purchases in 2018, keeping long-term interest rates fairly constant
until mid-2018.
Structural reforms that have been implemented or announced for the projection period
are taken into account, but no further reforms are assumed to take place.
The projections assume unchanged exchange rates from those prevailing on 8
November 2017: one US dollar equals JPY 113.82, EUR 0.86 (or equivalently one euro equals
USD 1.16) and 6.63 renminbi.
The price of a barrel of Brent crude oil is assumed to remain constant at $60 throughout
the projection period. Non-oil commodity prices are assumed to be constant over the
projection period at their average levels from October 2017.
A technical assumption is made that the United Kingdom has a transition
arrangement with the European Union after formal exit in 2019, resulting in little
disruption to trade that year.
The cut-off date for information used in the projections is 23 November 2017.

From:OECD Economic Outlook, Volume 2017 Issue 2
Access the complete publication at:http://dx.doi.org/10.1787/eco_outlook-v2017-2-en
Please cite this chapter as:
OECD (2017), “General assessment of the macroeconomic situation”, in OECD Economic Outlook, Volume2017 Issue 2, OECD Publishing, Paris.
DOI: http://dx.doi.org/10.1787/eco_outlook-v2017-2-2-en
This work is published under the responsibility of the Secretary-General of the OECD. The opinions expressed and argumentsemployed herein do not necessarily reflect the official views of OECD member countries.
This document and any map included herein are without prejudice to the status of or sovereignty over any territory, to thedelimitation of international frontiers and boundaries and to the name of any territory, city or area.
You can copy, download or print OECD content for your own use, and you can include excerpts from OECD publications,databases and multimedia products in your own documents, presentations, blogs, websites and teaching materials, providedthat suitable acknowledgment of OECD as source and copyright owner is given. All requests for public or commercial use andtranslation rights should be submitted to [email protected]. Requests for permission to photocopy portions of this material forpublic or commercial use shall be addressed directly to the Copyright Clearance Center (CCC) at [email protected] or theCentre français d’exploitation du droit de copie (CFC) at [email protected].