CHAPTER 1 INTRODUCTION - IWAI
165
DPR for development of Lakhipur-Bhanga Stretch of Barak River for Shipping & Navigation Revised Final Report Page 1 CHAPTER 1 INTRODUCTION 1.1 PREAMBLE Rivers constitute an important means of transport in Eastern India comprising of North Eastern States, West Bengal and parts of Bihar. India embarked upon a large programme of agricultural and industrial production which was resulted in substantial increase in the movement of cargo traffic. In addition to the above, the change in economic policy and rapid increase in industrialization during the past and present decade created huge impact on existing traffic movement by various modes. Due to the surge in road traffic, Govt. of India focussed attention in widening and relaying of National Highways including construction of major time bound projects such as Golden Quadrilateral and other express corridors. In similar fashion, dedicated rail corridors for the movement of goods by rail are in the implementation stage by the Government. Hence, it is evident that all modes of transport need to be developed and the vital role which rivers can play in meeting the ever increasing transport needs for a faster economy could not be ignored. Water based transport is effective as generally speaking, operating costs of fuel are low and environmental pollution is lower than for corresponding volumes of movement by road, rail or air. A major advantage is that the main infrastructure “the waterway” – is often naturally available, which then has to be trained, maintained and upgraded. Transport over waterways is especially effective when the source and/or destination are waterfront locations. The potential for this mode of transport has been unquestioned over the years and it forms a significant fraction of ton-km of movement in countries across the world. It is reported that Inland Water Transport (IWT) movement constitute 20% and 32% in Germany and Bangladesh respectively. However, it is noted that IWT plays a very marginal part (0.15%) in India. Inflation is one of the important problems which the country is facing today in which transport cost of commodities is an important factor. Numerous
Transcript of CHAPTER 1 INTRODUCTION - IWAI

DPR for development of Lakhipur-Bhanga Stretch of Barak Riverfor Shipping & Navigation
Revised Final Report Page 1
CHAPTER 1
INTRODUCTION
1.1 PREAMBLE
Rivers constitute an important means of transport in Eastern India comprising of
North Eastern States, West Bengal and parts of Bihar. India embarked upon a large
programme of agricultural and industrial production which was resulted in substantial
increase in the movement of cargo traffic. In addition to the above, the change in
economic policy and rapid increase in industrialization during the past and present decade
created huge impact on existing traffic movement by various modes. Due to the surge in
road traffic, Govt. of India focussed attention in widening and relaying of National
Highways including construction of major time bound projects such as Golden Quadrilateral
and other express corridors. In similar fashion, dedicated rail corridors for the movement
of goods by rail are in the implementation stage by the Government. Hence, it is evident
that all modes of transport need to be developed and the vital role which rivers can play in
meeting the ever increasing transport needs for a faster economy could not be ignored.
Water based transport is effective as generally speaking, operating costs of fuel are
low and environmental pollution is lower than for corresponding volumes of movement by
road, rail or air. A major advantage is that the main infrastructure “the waterway” – is often
naturally available, which then has to be trained, maintained and upgraded. Transport over
waterways is especially effective when the source and/or destination are waterfront
locations.
The potential for this mode of transport has been unquestioned over the years and
it forms a significant fraction of ton-km of movement in countries across the world. It is
reported that Inland Water Transport (IWT) movement constitute 20% and 32% in
Germany and Bangladesh respectively. However, it is noted that IWT plays a very marginal
part (0.15%) in India. Inflation is one of the important problems which the country is
facing today in which transport cost of commodities is an important factor. Numerous

DPR for development of Lakhipur-Bhanga Stretch of Barak Riverfor Shipping & Navigation
Revised Final Report Page 2
studies have argued that Inland Waterways are per se a desirable and environmental
friendly mode of transport.
IWT is being more energy efficient in comparison with other modes of transport
which can help in reducing the transport cost and prices of commodities. For instance, it is
observed that a litre of fuel can transport cargo 20 km by road, 80 km by rail and around
100 km by water. Thus, IWT is the least energy consuming and energy efficient mode of
transportation in addition to many other inherent advantages. IWT generates more
employment per unit of investment in comparison with other forms of transportation.
Investments in this sector have not equalled those in rail in early years and road in more
recent times, there are proposals for investing in this sector.
Keeping in mind the various advantages of inland waterways such as cost
effectiveness, relative fuel efficiency and importance of mobility besides welfare and
development of remote countries, a number of countries are now taking initiatives to make
better use of the existing capacity and making investments in IWT. Several development
projects aimed at enhancement of IWT infrastructure and operations are underway in Asia
despite the recent declining trend in the usage of the region’s inland waterways.
1.2 IWT IN INDIA
Asia is generously endowed with navigable inland waterways. These waterways
can play a vital role in the economic development and welfare of inhabitants of rural
remote areas of this region by providing accessibility and transport at least cost.
Historically, at least on some geographical sectors, IWT has been a viable mode of
freight transport. Currently, five major waterways in the country have been designated as
National Waterways (NW). NW-1: Ganga-Bhagirathi-Hooghly system, NW-2: Brahmaputra
system in Assam, NW-3: West Coast canal system in Kerala, NW-4: Godavari - Krishna
rivers & Canals between Kakinada and Puduchery and NW-5 : Brahmani river & Mahanadi
delta system along with East Coast Canal. Commercially, the most important sector is the
small tidal riverine system in Goa comprising Zuari and Mandovi rivers and the Cumbarjua

DPR for development of Lakhipur-Bhanga Stretch of Barak Riverfor Shipping & Navigation
Revised Final Report Page 3
canal. A number of possibilities do exist in terms of in-principle navigable waterways, but
the ones that offer some potential (a mix of feasibility and some traffic possibilities) are the
riverine inlets along the coast, especially the ones near ports and some of the canal systems
as part of larger water resource development projects. A further possibility can conceivably
open up if and when the river interlinking project in the country is found viable.
The transportation of goods in an organised form is confined to West Bengal,
Assam, parts of North East region and Goa in India. The 7th Plan was an important
landmark in the development of IWT. The expenditure on this sector in the plan was Rs.
131. 85 crores which were more than the expenditure incurred right up to the end of 6th
plan. The following objectives were laid down in the 7th plan for development of IWT
sector:
Development of IWT in the regions where it enjoys natural advantage,
Modernisation of vessels and country crafts to suit local conditions, and
Improvement in the productivity of assets.
The Inland Waterway Authority has been set up which was a big step forward in
helping the accelerated development of IWT. India has about 14,500 km of inland
waterways network comprising of rivers, lakes and canals. A comprehensive look has been
given for effective and targeted revival and development of the inland water transport as a
system and conceptual projection was made in the Working Group Report for the 10th Plan
suggesting a total investment of about Rs. 5665 crores from the budgetary support, raising
of bonds by IWAI, private investments and external funding. However the approved plan
outlay was Rs. 903 crores.
As per 11th Plan, about 45 million tons of cargo (2.5 BTKM) is being moved annually
by IWT. Inland Waterways Authority of India (IWAI) was constituted in 1986 for the
development and regulation of inland waterways for shipping and navigation. However,
most waterways suffer from navigational inadequacies such as shallow waters, narrow
width, siltation, and bank erosion. Consequently, its operations are currently restricted to

DPR for development of Lakhipur-Bhanga Stretch of Barak Riverfor Shipping & Navigation
Revised Final Report Page 4
about 5200 km of major rivers and 485 km of canals suitable for mechanized craft
operations. At present, organized cargo transportation is spread over the Ganga River in
NW-1, the Brahmaputra River in NW-2 West Coast Canal in NW-3, and Goa and Mumbai
waterways. The States covered are Uttar Pradesh, Bihar, Jharkhand, and West Bengal under
NW-1; Assam under NW-2; and Kerala under NW-3. A number of private operators provide
their services in all the above NWs whereas the public sector Central Inland Water
Transport Corporation operates on NWs 1 and 2.
With global economy and the WTO regime, there would be greater movement of
goods to and fro. This had created a heavy pressure on the already burdened road and rail
transport systems. There is limit for expansion of rail and road capacity on account of
constraints available land, high cost and environmental factors. In these conditions, IWT
can play a supportive role for rail and road movement. The cost effectiveness of IWT can
be addressed from the fact that the development of 1 km of highway costs around 7 crores
whereas the same amount may be sufficient to develop around 50 km of waterways. There
are some hazardous commodities and Over Dimensional Cargo (ODC) which can not be
allowed to be transported on road. In view of the above constraints, the development of
IWT has been relevant in today’s context.
In view of the thrust given to IWT mode as explained above, IWAI has proposed to
take up the study to prepare Detail Project Report for development of Lakhipur – Bhanga
stretch of Barak River for Shipping and Navigation as per the scope of work elaborated in
the subsequent section.
DPR for development of Lakhipur-Bhanga Stretch of Barak Riverfor Shipping & Navigation
Revised Final Report Page 5
1.2.1 Early IWT History Developments in Assam
The first voyage to Assam was made by the vehicle Lucknow, under Captain Fox,
which left Calcutta on 16th September in 1860. Tea was in fact indigenous in Cachar, but it
was only brought to notice in 1855. In 1863 the India General (IG) therefore dispatched the
Agra on a voyage to Cachar. The Assam pioneers included three members of that family
George Williamson senior, George Williamson junior, Capt. J. H. Williamson and Capt.
Williamson. But in 1862 Capt. Williamson left IG and formed a rival concern, the New Rivers
Company.
On 5th October 1864 Calcutta was stricken by a cyclone of unpredicted violence,
most of the sailing vessels in port began hurriedly to take in all unnecessary canvas and
batten down hatches. There were 192 vessels excluding boats, at the time in port and most
of them were stranded and wrecked. Fortunately for the India General (IG), few of its
vessels were in Calcutta at the time and it suffered very little loss. The Oriental Steam
Navigation Company and the Commercial Navigation Company went out of business at
once. The Bengal Rivers Company got amalgamated with IG. In 1867, IG acquired 4
steamers, 9 flats and 2 hospital ships and at the same time the Ganges Company found
itself in financial difficulties and ceased to operate by selling 3 steamers and 2 flats to IG.
The only company now remaining is RS Company as a competitor to IG. In 1869 the fleet of
the IG consisted of 16 steamers, and 32 flats. But before that in 1864 Capt. C. J. Scott had
become the Secretary.
The withdrawal of the navigation from Allahabad route was because of two factors,
The East Indian Railway (1864) and the level of river in the dry season had fallen sufficiently
to make navigation difficult.
By the year 1873, the normal route for passengers to Assam or East Bengal from
Calcutta was by train to Goalundo and then by steamer. Capt. Scott was a man of great
energy and spirit of enterprise and in 1870, with the support of the Directors; he sought to
obtain a subsidy from the chief Commissioner of Burma for the establishment of a service
on the Irrawadi. After a long time Williamson left the RS Co. and in 1873 an equally

DPR for development of Lakhipur-Bhanga Stretch of Barak Riverfor Shipping & Navigation
Revised Final Report Page 6
important change took place in the management of the IG. Up to that date the company
had been managed by its directors and the Commander-Secretary, but in that year
management was entrusted to a Calcutta firm Schoene, Kilburn and Co.,
Developments made increasing demands on dockyard facilities and in 1879 the IG
took a lease of a plot of land three miles down the river from Garden Reach, known as Raja
Bagan. In 1879 RSN also began to augment its fleet and became a potentially serious rival
to the IG, but a more immediate threat came from the Eastern Bengal Railway Company’s
flotilla which conveyed goods from the East Bengal jute districts. In 1879 two river
companies petitioned parliament against the competition by public enterprise but before
any action was taken in 1880 the flotilla was withdrawn from Cachar.
Competition and Cooperation
By 1880 the RSN had increased its fleet to a level which enabled it to compete on
equal terms with the IG Company and the story of the next decade is one of the fluctuating
relations between the two companies. In 1874 Assam was separated from Bengal and
became a Chief Commissionership. The Assam Government was thus in a stronger position
to exert pressure and in 1880 it threatened to put on its own steamers for this service. But
IG resisted this pressure where RSN grasped the opportunity and entered into a contract by
which it undertook to establish a fast daily ‘single-handed’. In 1883 two river companies
came to “Joint Purse Agreement”
Outside competition came from the Assam Railways and Trading Company. The
Government of Assam agreed to make a subvention to such a project and in 1879 a
proposal to form the Assam Railways Company was mooted. In 1880 Benjamin Piercy a
railway engineer in England took interest in it and by 1884 the line to the coal fields was
completed. The carrying capacity of RSN and IG would be inadequate. Assam Railways and
Trading Company decided to have their own fleet which could also be used for the
transport of tea chests from Dibrugarh to Calcutta. In 1887 the RSN Company purchased
the fleet and the AR and T Company withdrew from the river. The IG declined to participate
in the purchase. In 1882 negotiations between the EB Railway and the IG resulted in what
was known as the Combined Service Agreement.

DPR for development of Lakhipur-Bhanga Stretch of Barak Riverfor Shipping & Navigation
Revised Final Report Page 7
Increased fleets naturally required a corresponding expansion of dockyard facilities
and in 1859 the IG was able to extend it by buying adjacent premises belonging to the
Bengal Coal Company. RSN also made a change in its dockyard arrangements. In 1865 one
David Ezra had sold to William Mackinnon a site at Garden Reach – a locality in which
wealthy European merchants of Calcutta had their weekend villas. In 1889 an agreement
provided first that on all services the Companies should have equal fleet and equal profits.
The Joint Steamer Companies and agreement between them was fully honoured. IG
Company constructed its first stern wheeler, the Nemotha, built by John King and Co. in
1888. IG repurchased a fleet for half a sale price which it had sold to the Irrawaddy Flotilla
Company a year before. There was also the fact that reduced coal consumption and the use
of flats carrying larger cargoes at the same draft of water as those of 1864, had modified
the economic factors which had led to the closure of the Ganges service. In 1897 its fleet of
about 12 steamers and launches was purchased by the Joint Companies and in 1897 they
opened a mail service between Narayanganj, Chandpur, Barisal and Khulna via the
Kaleegunga and Madhumatee. The Joint Purse Agreement which in 1889 had applied only
to main line and dispatch services. At the end of the century the whole constitution of the
IG was taken under control of London.
Throughout 19th century, transport infrastructure of the Sylhet District (in
Bangladesh) including Karimganj remained underdeveloped. As a result, trade flowed
mainly through waterways. Barak and its tributaries having links with the major rivers of
Bengal played the dominant role in transporting goods to Sylhet, Habiganj and Nabiganj
(the last two were important trade marts on the Kushiara branch of River Barak) and then
to other parts of Bengal. The steamers of the Eastern Bengal Railway Company used to ply
at frequent intervals between Goalandoi and Cachar. Initially, commodities were
transported from Lakhipur to Karimganj by country boat, then from Karimganj to Sylhet.
There were transit ghats for loading and unloading the goods and passengers on the river
banks. Bhairab Bazar, on the bank of river Meghna, was an important transit point for
Barak-Surma region and Bengal trade. In fact during 1880-1890 river borne trade of Assam
amounted to 50.1 per cent of her total imports from and 63.9 per cent of her total exports
to Bengal. Forty vessels from five to six hundred tons load each were exported annually
from Bengal to Assam, mainly with salt, betel and tobacco. The major import items were

DPR for development of Lakhipur-Bhanga Stretch of Barak Riverfor Shipping & Navigation
Revised Final Report Page 8
silk, muga, ivory and timber. This vibrant river borne trade gradually gave way to railways in
early 20th century.
The multi-modal connectivity of Karimganj with Sylhet remained in place even after
the partition of the country. The Indo-Bangladesh waterways via Karimganj district
remained operational till the Indo-Pakistan war of 1965. With the sealing of border
following the war, the volume of trade via waterways had declined. With the emergence of
Bangladesh, the cross border riverine trade was revived. Karimganj Inland Waterway
Terminal (IWT) was constructed in the late 1980’s by the Central Inland Water Transport
Corporation of India. Since, July 1999, it is being used throughout the year. Ferry service
from Karimganj is now an important channel for the export of coal and other tradable
commodities to Bangladesh.
Hence, IWT operation to North East was started long back and considered to be the
backbone of transportation of men and material to Bengal regions.
1.3 SCOPE OF WORK
Based on the above observation, the following scope of work has been proposed by
IWAI:
(1) To study/analyse (a) the Techno Economic Feasibility Study (TEFS) report prepared
by RITES in January, 1999; and (b) the hydrographic survey charts prepared by
IWAI during 1991 of this waterway.
(2) To collect and study/ analyze the available data/ reports for the past 20 years
regarding water level, discharge, velocity, bed and bank material, topographic data
etc. of Barak River from Tipaimukh dam site to Karimganj from various sources like
Central Water Commission (CWC), Brahmaputra Board, concerned State
Departments, National Remote Sensing Agency, Survey of India, Tipaimukh Dam
Authorities etc.
(3) To conduct Thalweg Survey (longitudinal hydrographic survey along deepest part of
navigation channel) from Tipaimikh dam site to Karimganj stretch of the river
during low water season (Jan/Feb), prepare the Thalweg charts in 1: 50,000 scale

DPR for development of Lakhipur-Bhanga Stretch of Barak Riverfor Shipping & Navigation
Revised Final Report Page 9
and identify the shoals (shallow areas) for 1.6 m, 2 m and 2.5 m depth below chart
datum.
(4) To undertake cross-section surveys from bank to bank (up to normal HFL) at 500 m
interval in the river stretch between Lakhipur and Bhanga during lean water season
(Jan/Feb) and prepare survey charts in 1:5,000 scale.
(5) To assess the discharge requirement for Least Available Depths (LAD) of 1.6 m, 2
m and 2.5 m below chart datum and availability of water for navigation during pre
and post Tipaimukh dam scenario. Give a separate chapter/section on this in the
report.
(6) To study the cargo potential for IWT mode through this waterway based on TEFS
Report – 1991 of RITES and to update it by conducting traffic O-D surveys as
required and give in detail the cargo that can be divertible to IWT mode upon
development of the waterway. Also provide traffic projections for time horizons of
5, 10 & 15 years. Give the origin and destination of each identified cargo along with
basis/source.
(7) Based on the data of river characteristics collected as per item (iii) above, sufficient
details as per the following may be provided:
A. Waterway development
a) Optimum dimension of the navigation channel which can be developed by
undertaking river conservancy work (dredging, bandalling), river training, bank
protection etc. Specifically give the requirement of dredging and bandalling (with
details of calculation) to provide and maintain navigation channel with LAD of 1.6
m, 2.0 m and 2.5 m all-round the year including details such as disposal of dredged
material etc.
b) Suggest the proposed Class of waterway in reference to IWAI (classification of
inland waterways in India) Regulation 2006, for horizontal and vertical clearances
for the cross structures such as bridges, cables etc.
c) Collect data & study the existing rail bridges, road bridges, foot bridges, power
cables etc crossing the river between Lakhipur and Karimganj and recommend
measures required to permit uninterrupted navigation along the river.

DPR for development of Lakhipur-Bhanga Stretch of Barak Riverfor Shipping & Navigation
Revised Final Report Page 10
B. IWT terminals
a) Based on the cargo potential and other considerations necessary for locating an IWT
terminal, provide extent of requirement of land for setting up of IWT terminals at
Silchar and Lakhipur. Study viable alternate sites for the same and suggest two
specific alternative sites for each, assigning first and second priorities. Collect details
of land ownership etc and give the same in the report with source and supporting
documents. Carryout preliminary topographic survey and give layout of plan for all
suggested locations clearly indicating all facilities e.g jetty, approach to jetty, bank
protection, covered and open storage, roads, office, sentry hut, boundary wall, bank
protection, bunkering facility, water facility, turning circle for IWT vessels location
of depth contours of 2m and 2.5m in the river near the terminal sites etc.
b) Study the provision of such requirements at existing terminals at Badarpur and
Karimganj, and suggest further improvement required.
c) Provide preliminary engineering design, and drawings for setting up of terminals
with related facilities including mechanical loading/ unloading at Silchar and
Lakhipur and augmentation/ improvement of existing facilities at Badarpur and
Karimganj. Also indicate the inter modal cargo transfer facilities required at these
terminals.
C. Navigation aids
a) Suggest in sufficient details, requirement of 24 hrs navigation facilities including
day marks, buoys with lights, lights on masts at banks, DGPS stations, buoy laying
vessels, rescue vessel etc., along with their dimensions/drawings and numbers with
justification.
b) Suggest types of communication facilities required on the cargo vessels etc

DPR for development of Lakhipur-Bhanga Stretch of Barak Riverfor Shipping & Navigation
Revised Final Report Page 11
D. Cargo vessels
a) Suggest economical size of cargo vessels for the cargo as assessed under item 3.
Work out details of the type of vessels, their number and cost. While suggesting the
design vessel, the requirement of transit through Bangladesh, particularly depth/
width availability in the Protocol routes, seasonality of movement etc., are to be
carefully considered.
b) It may be noted that cost of cargo vessels need not be included in the cost of
development of the waterway since it shall be assumed that the cargo vessels shall
be owned and operated by the private sector based on demand to be created by
developing the waterway as proposed in the DPR.
E. Other facilities
a) Suggest in adequate details, other required infrastructural facilities such as repair
facilities, fuel and fresh water bunkering, channel patrol, security, enforcement of
rules and regulations, pilotage, issue of navigation notices, navigation charts,
warnings, rescue and salvage, pollution control measures etc.
(8) To prepare preliminary engineering designs, the data about soil characteristics shall
be collected from the local sources based on the structures constructed nearby. In
addition, wherever required, consultant may obtain soil data through trial pits/plate
load test etc and preliminary design shall be based thereon.
(9) To assess the environmental impacts due to these development works and suggest
suitable environmental management plan (EMP) to mitigate the adverse impacts, if
any, including its cost. Only rapid EIA/EMP study is envisaged for which one
season data shall be sufficient. However, all necessary information should be given
in the report to enable IWAI to approach concerned authorities for getting
environmental clearance for undertaking the works proposed in the DPR, if so
required.
(10) To prepare cost estimates for the entire proposed infrastructure, including

DPR for development of Lakhipur-Bhanga Stretch of Barak Riverfor Shipping & Navigation
Revised Final Report Page 12
mechanical handling, and other allied facilities with proper justification that the
suggested solution is the optimum one.
(11) To provide estimated cost of annual recurring/maintenance works with sufficient
basis/justification.
(12) To prepare detailed time schedule for the whole project indicating the time
requirement of the various components of the project from inception till
commissioning. Suggestion shall also be given for executing the project in different
phases with spilt up of the works and the costs thereto, cargo potential and
EIRR/FIRR for each phase independently.
(13) To study and recommend necessary organizational structure and manpower required
for execution of the project and its maintenance thereafter.
(14) To study the existing freight and tariff structure for rail, road and IWT mode and
recommend a suitable freight structure for IWT together with its basis and subsidies,
if any, that may be necessary in the initial years.
(15) Suggest user charges for using the waterway, terminals and other infrastructural
facilities, which can be levied by IWAI on the operators/users without adversely
affecting the commercial viability of IWT operations.
(16) Suggest short and long-term measures, which will attract shippers to the IWT mode
on a continuing basis, including identification of industries that are / could be
located on banks.
(17) Workout Economic Internal Rate of Return (EIRR) considering the employment
generation, , fuel saving, saving in noise pollution and accidents, carbon credit
which can be earned, savings in repair and maintenance of roads, saving in land
acquisition etc compared to road and railways for the projected traffic potential by
IWT mode. Detailed working sheets should be given for this.

DPR for development of Lakhipur-Bhanga Stretch of Barak Riverfor Shipping & Navigation
Revised Final Report Page 13
(18) Workout Financial Internal Rate of Return (FIRR) for the following options:
a) For the operators – Considering the rate they can charge for transportation of the
goods by inland vessels and the user charge they shall pay to the IWAI.
b) For the IWAI - Based on user charges proposed to be levied by IWAI from the
operators for use of waterway, terminal etc.
c) To prepare the DPR covering all the above items and submit 15 copies.
DPR for development of Lakhipur-Bhanga Stretch of Barak Riverfor Shipping & Navigation
Revised Final Report Page 14
CHAPTER 2
DETAILS OF STUDY AREA AND SITUATIONAL ANALYSIS
2.1 INTRODUCTION
East India has many large and small rivers providing facilities for water transport
especially in its plain parts and in flat river valleys of the large rivers in hills. From the
ancient period until the roads were constructed, the rivers of Brahmaputra and Barak plains
were commonly used as the mode of transportation of goods and passengers. During the
British period, Brahmaputra river and Barak- Surma – Kushiyara - Meghna river systems
were extensively used for transport and trade between North-East (NE) India and Kolkatta
port. These rivers became important carriers of trade with the growth of tea industry.
It is estimated that NE region has about 1800 km of river routes that can be used by
streamers and large country boats. The inland water transport departments of both the
state and central governments have been trying to improve the water transport system in
the region. The river Brahmaputra has several small river ports like Sadiya, Dibrugarh,
Disangmukh, Neamati, Tezpur, Pandu-Guwahati, Jogighopa and Dhubri. There are more
than thirty pairs of ferry-ghats on river Brahmaputra transporting men and material besides
the above river ports. The River Barak has also small ports at Karimganj and Badarpur
along with ferry services at several places.
Besides, the major tributaries of Brahmaputra namely Lohit, Dhansiri and Subansiri,
rivers of Tripura namely Gumti and Haora, Tizu river in Nagaland, Kolodyne river in
Mizoram etc., are having good navigation potential. These rivers can be developed for
better utilization of both cargo and passenger transportation.

DPR for development of Lakhipur-Bhanga Stretch of Barak Riverfor Shipping & Navigation
Revised Final Report Page 15
2.2 PRESENT TRANSPORT NETWORK
North Eastern region of India comprises of seven states viz., Assam, Meghalaya,
Manipur, Tripura, Nagaland, Arunachal Pradesh and Mizoram as shown in Figure 2.1. This
region is connected by land with the rest of India through West Bengal. The surface
transport system for movement of cargo/passengers to and from the NE states consists of
road, rail and waterways. As far as cargo movement is concerned, most of the cargo
originates from Kolkata and terminates at Guwahati and vice-versa. From Guwahati, the
cargo gets distributed to various destinations of NE states. The transport links to states
particularly Mizoram, Tripura, Manipur and Nagaland are affected many times by floods,
landslides, blockages of roads and local agitations.
Figure 2.1 North East Region States

DPR for development of Lakhipur-Bhanga Stretch of Barak Riverfor Shipping & Navigation
Revised Final Report Page 16
2.2.1 RAILWAYS
Railway Transport in NE India has a traditional history. The construction of railway
line in Assam started during 1881 – 84 and yet the railway network in this region is not well
developed. At present about 2500 km of railway network is available accounting for a
density of 9 km of track per 1000 km2 of area. Only 1376 km of railway line are broad
gauge out of 2500 km and other remaining meter gauge tracks. As stated above, railway
line laying was started in the eastern part of Brahmaputra valley in the early 1880 by then
British Government and Companies. They constructed railway lines connecting tea, coal, oil
and timber producing areas with river ports on Brahmaputra and Barak River. The first
railway line was constructed between Dibrugarh – Sadia during 1882 – 1884 connecting
tea, timber, coal and oil producing areas of the present Tinsukia district with the river port
of Dibrugarh. This was followed by Jorhat provincial railway in 1885.
It was 1895 that the region was first linked with outside by constructing a line from
Eastern Bengal (presently Bangladesh) to Badarpur in Barak Valley. The railway line from
Guwahati to Lumding began construction in 1897 and Dhubri was linked with Calcutta in
1902. The hill section of railway linking Lumding of the Brahmaputra valley with Badarpur
of Barak valley across hill ranges of the North Cachar Hills district was constructed in 1903
through 37 number of tunnels with a length of 519 km.
Upper Assam was linked with Eastern Bengal with the completion of track between
Tinsukia and Lumding during 1904. Thus, it is seen that most of railway lines that are found
today in NE India were laid down 50 years back through Brahmaputra and Barak valley.
After Bangladesh partition, Assam link railway line was constructed via Siliguri station of
West Bengal with an establishment of Northeast Frontier Railways.

DPR for development of Lakhipur-Bhanga Stretch of Barak Riverfor Shipping & Navigation
Revised Final Report Page 17
2.2.2 ROADWAYS
Roadways are most important than others in NE India because they can reach even
isolated villages over the hills. In NE States, Assam has the longest length of roads in terms
of km. The total distance of all roads in Assam (including NH, PWD and other roads) is
40,342 km. The length of National Highway is 2841 km. As per Statistical Handbook of
Assam (2010), the road length per 100 km2 of Assam’s geographical area works out to 51.
In the Barak valley, the road system was earlier linked with Sylhet district (in Bangladesh).
But the partition of India adversely affected the transport and communication system of
Assam. National Highway 44 connects Agartala, Karimganj and Badarpur with Shillong via
Jowai. National Highway 53 links Silchar with Lakhipur and Jiribam in Manipur. The
following table 2.1 projects the National Highways connecting different places in PIA.
Table 2.1 National Highway Connecting PIA
Sl. No. National Highway From To Distance Passing thro’
1 44 Shillong Agartala 495 km Badarpur and
Karimganj
2 53 Badarpur Imphal 320 km Silchar, Lakhipur
and Jiribam
3 54 Silchar Tuipang 560 Aizwal, Silchar.
2.3 EXISTING WATERWAY NETWORK
Two waterway routes exist connecting NE state of Assam through the waterways in
Bangladesh as shown in Figure 2.2. Navigation through Bangladesh is governed by the
Protocol Agreement between India and Bangladesh. The first route is from Kolkata to
Guwahati (1439 km.) through River Brahmaputra and the second route is between Kolkata
and Karimganj (1233 km.) through River Kushiyara & Barak.

DPR for development of Lakhipur-Bhanga Stretch of Barak Riverfor Shipping & Navigation
Revised Final Report Page 18
Figure 2.2 Indo – Bangladesh Protocol Routes
2.4 BARAK RIVER SYSTEM
Barak river system is the second largest river system in the North Eastern Region. It
originates from south of Kohima in Nagaland near Nagaland - Manipur Border. After
traversing through Nagaland, Manipur and Assam, it splits at Bhanga into two streams
called Surma and Kushiyara. There two streams rejoin at Markuli in Bangladesh and
thereafter the river is called Meghna. Barak - Meghna river system has a total length of 900
km (origin to upstream Chandpur in Bangladesh). Out of this, 524 km is in India, 31 km on
Indo- Bangladesh Border and the rest is in Bangladesh. Out of 524 km in India, 403 km u/s
of Lakhipur is in the hilly terrain and is not navigable. Thus the navigable portion of Barak
River in India remains only 121 km as shown in Figure 2.3.

DPR for development of Lakhipur-Bhanga Stretch of Barak Riverfor Shipping & Navigation
Revised Final Report Page 19
The Barak River had been used as a waterway route for North- East Region since
long time. Regular cargo transportation between Kolkata / Haldia ports in West Bengal and
Karimganj/Badarpur terminals on Barak river in Assam used to take place till eighties and
ninetees. Even now some barges do ply in this route. The Kolkata- Karimganj route is
already a part of the Indo- Bangladesh Protocol on Inland Water Transport transit and
trade.
Barak River (Lakhipur - Bhanga) lies entirely in the State of Assam, the development
of Inland Water Transport (IWT) mode on this stretch will also serve the transportation
needs of Manipur, Mizoram and Tripura. The National Highway-53 connects Lakhipur and
Imphal, while NH-54 connects it with Aizwal and NH-44 connects Karimganj and Agartala.
Thus, development of river Barak shall provide an alternate connectivity to these states
with rest of India. At the moment, transport service in these States is rendered mainly by
road and rail. The goods are transported with extreme difficulty/ delay due to traffic
congestion and longer routes. The waterway has a distance advantage over rail and road
modes. Thus, development of the navigable stretch of Barak River shall therefore provide
vital alternate mode of transport to the region. It shall also provide port connectivity to a
vast area of north-east through the existing Indo-Bangladesh IWT & Trade Protocol Routes.
To assess the viability of navigation in the Karimganj - Lakhipur stretch of Barak
river, IWAI had carried out hydrographic survey during 1991. Thereafter, a Techno-
Economic Feasibility Study (TEFS) was also got conducted by IWAI through M/s RITES in
1998. TEF Study established the technical and commercial viability of navigation in the
Lakhipur - Karimganj stretch of Barak River and suggested various details of development of
fairway, terminal and navigational aids.

DPR for development of Lakhipur-Bhanga Stretch of Barak Riverfor Shipping & Navigation
Revised Final Report Page 20
Figure 2.3 Baseline Map showing Barak River System in Assam (Distance by River flow Route)
52 km58 km11km19 km
DPR for development of Lakhipur – Bhanga stretch of Barak River for shippingand Navigation
Revised Final Report Page 21
Based on the TEFS report, a proposal to declare the Lakhipur - Karimganj (140 km)
Stretch of river Barak in Assam as National Waterway was prepared and submitted to the
Government of India for consideration by IWAI. However, it was decided that the stretch
of Barak River between Karimganj and Bhanga was a common international boundary
between India and Bangladesh, it will be desirable to consider the declaration proposal
only for Lakhipur -Bhanga stretch of Barak river. The proposal to declare Lakhipur - Bhanga
stretch as National Waterway is in active consideration of the Government.
Since TEF report was prepared about 12 year back (1999), many data might have
undergone changes and it is not desirable that these may be used for execution of the
project without updation. Therefore, for taking up the developmental works for
declaration of the waterway as National Waterway, it becomes necessary to prepare a
Detail Project Report (DPR). Accordingly, M/s Larsen & Toubro Limited has been entrusted
by IWAI to prepare DPR for development of Lakhipur - Bhanga stretch of river Barak for
shipping and navigation vide work order No. IWAI/PL-9(2)/BARAK-DPR/2010 dated
06.01.2011.
2.5 PRELIMINARY SURVEY IN THE STUDY AREA
After getting acquainted with the TOR, preliminary survey was carried out to
familiarise with the actual field conditions. Consultant Team visited the study area from
Tipaimikh to Karimganj and planned for carrying out Hydrographic including longitudinal
section, Cross Section of Barak river and topographic survey for the proposed IWT terminals
at Silchar and Lakhipur. Existing CIWTC Terminals at Badarpur and Karimganj were studied
for proposing suitable improvements for loading and unloading of project cargo.
The present use of Barak River at Lakhipur for transportation of passenger and
goods is shown in Figure 2.4. Present flow condition of Barak River upstream of Bhanga is
shown in Figure 2.5 and IWT terminal presently available at Badarpur and Karimganj is
shown in Figure 2.6 and 2.9.

DPR for development of Lakhipur – Bhanga stretch of Barak River for shippingand Navigation
Revised Final Report Page 22
Figure 2.4 View of Barak River at Fullertol Ferryghat, Lakhipur
Figure 2.5 View of Barak River upstream of Bhanga

DPR for development of Lakhipur – Bhanga stretch of Barak River for shippingand Navigation
Revised Final Report Page 23
Figure 2.6 View of IWT Terminal at Badarpur
Figure 2.7 View of CIWTC Terminal at Karimganj during Flood

DPR for development of Lakhipur – Bhanga stretch of Barak River for shippingand Navigation
Revised Final Report Page 24
Figure 2.8 View of Cargo Handling Yard & Covered Storage Shed in CIWTC Terminal at
Karimganj
Figure 2.9 View of Gangway with Floating Pontoon arrangement in CIWTC Terminal at
Karimganj during lean season flow
DPR for development of Lakhipur – Bhanga stretch of Barak River for shippingand Navigation
Revised Final Report Page 25
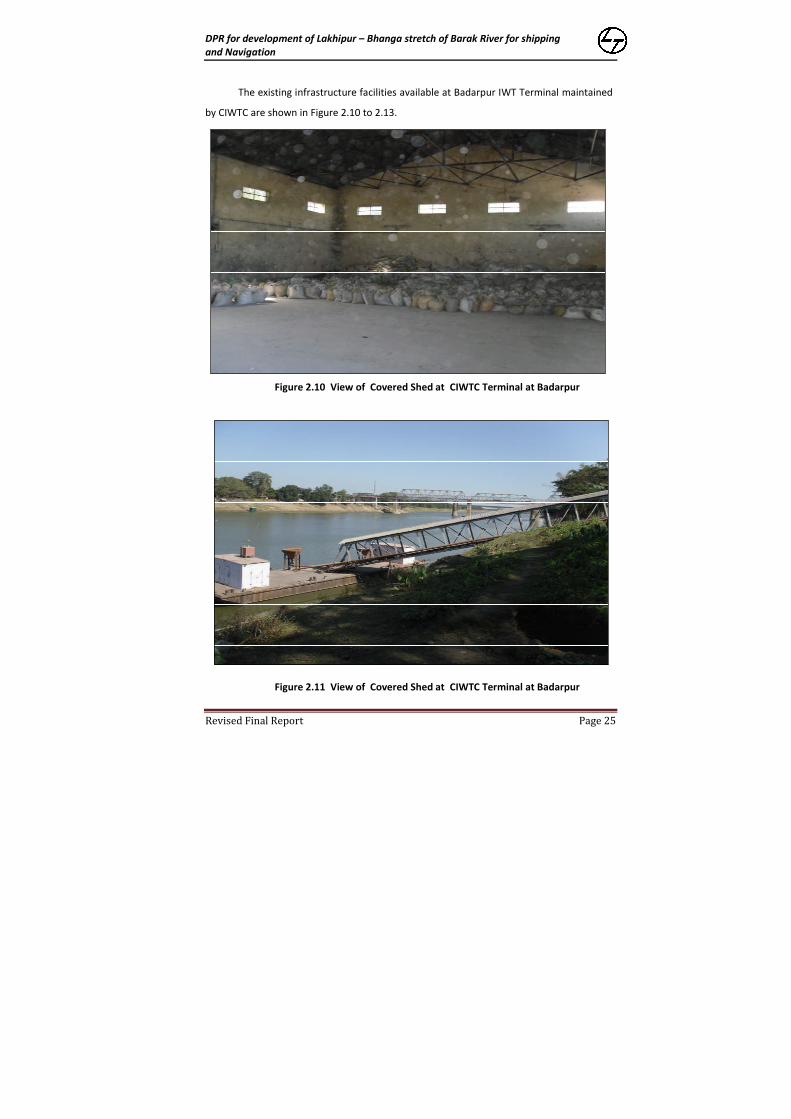
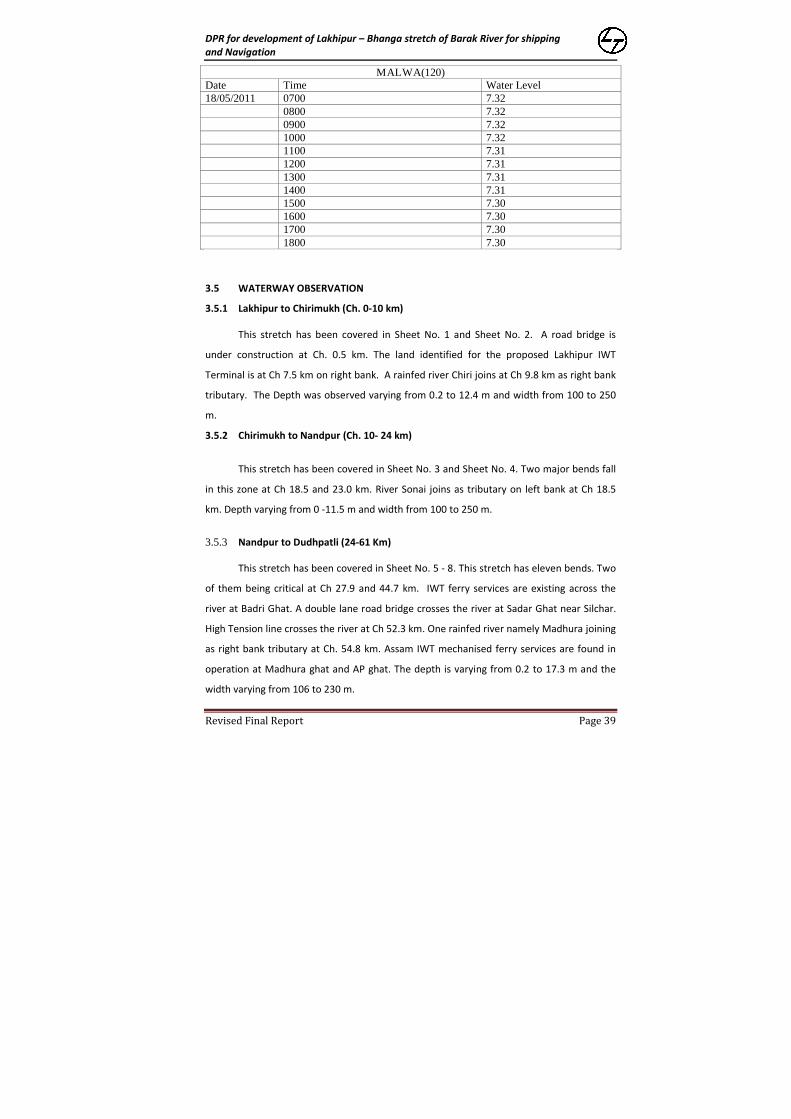
The existing infrastructure facilities available at Badarpur IWT Terminal maintained
by CIWTC are shown in Figure 2.10 to 2.13.
Figure 2.10 View of Covered Shed at CIWTC Terminal at Badarpur
Figure 2.11 View of Covered Shed at CIWTC Terminal at Badarpur

DPR for development of Lakhipur – Bhanga stretch of Barak River for shippingand Navigation
Revised Final Report Page 26
Figure 2.12 View of Gangway Arrangement in CIWTC Terminal at Badarpur
during Flood flow
Figure 2.12 View of Gangway Arrangement at CIWTC Terminal at Badarpur
during Flood flow
Figure 2.13 View of Admin Building in CIWTC Terminal at Badarpur

DPR for development of Lakhipur – Bhanga stretch of Barak River for shippingand Navigation
Revised Final Report Page 27
2.5.1 G&D Site Locations
Table 2.2 shows the locations of water level measurement gauges installed and
being measured by Central Water Commission. Figure 2.14 and 2.15 show the location of
CWC gauging station at Lakhipur and Annapurna Ghat, Silchar.
Table 2.2 G&D Site Locations
Figure 2.14 View of CWC Water level observation site at Lakhipur
S.No G&D Site Location Description of Landmark
1 Lakhipur Situated at the river bank at thegauge site of Central waterCommission near River Dale school,Lakhipur
2 Annapurna Ghat(A.P.Ghat)
On top of RCC pillar present in theentrance of Annapurna Mandir nearRailway goods yard, Silchar
3 Badarpur Ghat(B.P.Ghat)
Situated on top of the protectedmasonary structure in front of CWCsite office, Badarpur Ghat.

DPR for development of Lakhipur – Bhanga stretch of Barak River for shippingand Navigation
Revised Final Report Page 28
Figure 2.14 View of CWC Water level observation site location at A.P. Ghat
during Flood flow.

DPR for development of Lakhipur – Bhanga stretch of Barak River for shippingand Navigation
Revised Final Report Page 29
CHAPTER 3
DATA COLLECTION & HYDROGRAPHIC SURVEY
3.1 DATA COLLECTION
The following criterion was proposed for the data collection based on the review of
TEFS and field visit in addition of Thalweg and cross section survey in Barak River:
Thalweg survey in Barak River for the stretch between Tipaimikh and Karimganj with
one sounding line along the deepest part of the river.
Cross section survey at 500 m interval in Barak River for the stretch between
Lakhipur and Bhanga.
It was proposed to collect the hydraulic and hydrological data required for the
identification of navigable waterway through CWC, Assam State Public
Works/Irrigation/Water Resources Department, Tipaimikh dam authorities etc.
Traffic studies including vessel/fleet analysis
Preliminary design of Terminals at identified locations: Badarpur, Silchar and
Lakhipur.
Rapid EIA studies: Rapid EIA shall include the establishment of the Baseline
Environment Status in terms of Water, Sediment, Air and Noise. The samples
(Water, Air, Noise and Sediment) shall represent the entire area including the
impact due to cargo handling, shipping and navigation, dredging, constructions etc.
3.2 SECONDARY DATA COLLECTION
The following secondary and primary data were proposed and collected from
various Govt. Organisaitons/Departments as shown in Table 3.1.

DPR for development of Lakhipur – Bhanga stretch of Barak River for shippingand Navigation
Revised Final Report Page 30
Table 3.1 List of Secondary & Primary Data collected
SL. NO DATA TYPE SOURCE/AGENCY
1 Topographic information:cross-sections / longitudinalprofiles / Thalwegs
Collected from IWAI
2 Water levels – historical data CWC and Tipaimikh Dam authority. Request forproviding Barak River basin has been submitted byConsultant and the same was rejected with aninstruction to send the letter from IWAI. Hence,Chief Engineer, IWAI had written a letter withsecrecy undertaking to Chief Engineer, CWC,Shillong during the month of July 2011 requestinghydrological and hydraulic data for Barak Basin.The decision for providing the Data by CWC is stillpending with C.E., CWC, Shillong. Reminders havebeen sent through Director, IWAI, Guwahati officein this regard.
3 Water discharges – historicaldata (stage/dischargecurves)
4 Sediment data – samples ofbed material and suspendedmaterial –
5 Data pertaining todemographic particulars andlocal developments in studyarea
Collected from Govt. of Assam.
6 Goods Traffic flows byvarious transportationmodes such as rail, road andIWT
Collected from various Govt. Agencies such asRailways, Dy. Director, Economics & Statistics,Silchar, CIWTC Terminal at Karimganj in Assam,West Bengal and other NE states
7 Sample O-D survey and datacollection
Carried out with help from Addl. DeputyCommissioner, Cachar District, Govt. of Assam andother local agencies
8 Commodity wise statementof traffic including cementand coal movement etc.
Collected from various local agencies, trade unionsand other Private organisations
9 Traffic flows to proposedIWT Terminals at Lakhipur,Silchar and Badarpur
Interacted with Local agencies/DeputyCommissioner, Cachar and Karimganj Districtauthority.

DPR for development of Lakhipur – Bhanga stretch of Barak River for shippingand Navigation
Revised Final Report Page 31
3.2.1 Hydrological/Hydraulic Secondary Data Collection
Request for providing Water level, discharge, sedimentation observation,
currentmeter observation, etc., at G&D Stations observed by concerned Subdivisions
located at Lakhipur, AP Ghat and Badrapurghat of Megna Investigation Division, Central
Water Commission, Shillong has been submitted to Chief Engineer, CWC, Shillong during
the month of March 2011. Subsequently, CWC had informed the Consultant to request
IWAI to send official request letter along with necessary secrecy undertaking during June
2011. As per the advice of CWC, Consultant requested Chief Engineer, IWAI to provide a
letter for data request. The same has been submitted with CWC, Shillong in person
through Representative from O/o The Director, IWAI, Guwahati during July 2011. Several
reminders were also sent through IWAI, Guwahati office. The request submitted with CWC
is still pending for providing required data. Otherway, Consultant team was able to get
daily water level observation Gauging site at Lakhipur, AP Ghat and BP Ghat during the
period 2006 to 2010.
Meanwhile, Consultant Team have made a requisition to O/o The Chief Engineer,
Water Resources Department, Govt. of Assam for providing the above required data for
carrying out basic water availability study. Due to the continuous persuasion of the
Consultant Team, CE, WRD., Govt. of Assam has accorded his permission to provide the
data during August 2011 upon submission of standard secrecy undertaking from the
Consultant Side. The data was provided during first week of October 2011 by the
Concerned Additional Chief Engineer, Cachar & Hills Water Resources, Water Resources
Department, Govt. of Assam at Silchar has been used for analysis.
3.3 THALWEG AND CROSS SECTION SURVEY IN BARAK RIVER
Hydrographic survey was carried out in Barak River for the following three river
stretches.
(i) Tipaimikh to Lakhipur 98.6 Km(ii) Lakhipur to Bhanga 121.0 Km(iii) Bhanga to Karimganj 20 Km

DPR for development of Lakhipur – Bhanga stretch of Barak River for shippingand Navigation
Revised Final Report Page 32
Thalweg survey for the stretch between Tipaimikh and Karimganj with one sounding
line along the deepest part of the river and Cross section survey at 500 m interval in Barak
river for the stretch between Lakhipur and Bhanga was carried out. The details of the
survey and vessel used for carried out the survey are briefly in the following sections:
The detailed hydrographic survey was conducted as per GIHS Specification with GPS
Position fixing and with recording type Echosounder for sounding. The horizontal control
was made from the charts generated from satellite imageries of the corresponding river
stretches, suitably updated with prominent features from SOI Topo sheets. Suitable
method of traversing was adopted wherever satellite imageries are not available and charts
were updated. The vertical control was established with respect to sounding datum which
was established at all gauge stations. Datum values were recorded with respect to MSL.
Continuous sounding lines were run from bank to bank i.e., 0 m contour to 0 m
contour up to normal HFL at 500 m interval from Lakhipur to Bhanga in river Barak
(121 km) and survey charts were prepared in 1:5000 scale.
Single line longitudinal survey for the river stretch from downstream of proposed
Tipaimikh dam and Karimganj to identify the most suitable navigational channel.
Thalweg chart in 1:50000 scale was prepared showing the contours of 1 m, 1.5 m
and 2 m.
Every shoal having less than 2m depth below chart datum, rocky outcrops etc, are
indicated on the charts.
Water level at the time of survey, river bank and shoals in the during the traversing
were recorded.
Benchmarks were established by engraving on prominent objects like bridges,
culvert, nearby school etc., for future recovery. The same were connected by
levelling and levels were estabilished with respect to MSL at 10 km interval. The
accuracy of the levelling was corrected by connecting the levels to the Bench marks
available enroute established by CWC and Water Resources/ IWT departments of
Govt. of Assam.

DPR for development of Lakhipur – Bhanga stretch of Barak River for shippingand Navigation
Revised Final Report Page 33
All prominent objects and features along the river stretches are fixed on the charts
including existing rail bridges, road bridges foot bridges, power cables etc., which
are crossing the river between Lakhipur and Karimganj.
Horizontal and vertical dimensions with respect to HFL at all cross structures, power
cables, telephone cables etc. were collected and indicated on the chart.
Availability of berthing place if any and approach roads etc., were indicated on the
charts.
High bank lines are marked on the chart and permanent features up to 50 m
distance from high water line were collected and indicated on the charts.
Condition of the banks whether protected or unprotected are indicated on the
chart.
Topographic survey with 1m contour interval was carried out for the identified lands
at Lakhipur, Silchar, Badarpur, & Karimganj for the proposed construction of IWT
Terminals.
3.3.1 Conduct of Survey
One Hydrographic survey team under two number of Class I Hydrographic Surveyors
and one land survey team under another Hydrographic surveyor were employed for
conducting the field work.
3.3.2 Horizontal Control
Ground control was achieved by remote sensing techniques. Geo coded satellite
imageries for the area to be surveyed was obtained from National remote sensing agency
(NASA), Hyderabad by superimposing the satellite imageries on the SOI Topo sheet of the
survey area on a scale 1:50000. The Layout of the river was digitised and the distortion was
adjusted in accordance with real field data.
In the field, point to point measurement was done along the line of navigation and
each cross section was related to prominent objects in the chart. Cross sections are taken

DPR for development of Lakhipur – Bhanga stretch of Barak River for shippingand Navigation
Revised Final Report Page 34
at 500 m interval apart. The linear measurements and position fixing were done by Global
Positioning System. The width and cross section spot heights of existing waterway were
observed by using Trimble 5600 Total station. The cross sections were guided by transit
method using two flags.
3.3.3 Vertical Control
For determination of depth, Bathy 500 DF Echosounder was used. Sounding datum
was established by simultaneous water level observations at sounding site and Central
Water Commission Gauge station located at Lakhipur, A.P Ghat and Badarpur Ghat. The
Chart Datum (CD) was found out by applying range corrections at the reference station of
CWC.
3.3.4 Chart Datum
In case of a river, the bed profile along the length of river varies widely and
depended on many factors like discharge, river width, bed slope, soil properties, bank bed
etc. Therefore, low water line and bed profile do not maintain a constant relation along the
length of the river but varies in different stretches. Thus chart datum strictly cannot be
horizontal but will have to be sloped or stepped. Hence, the chart datum has been selected
as slopped having different gradient in different stretches which roughly matching LWL
above the bed profile.
3.3.5 Method Used For Finding Chart Datum
The lowest value of water level at the CWC stations was noted at CWC G&D stations
during the survey. Taking into account of 95% occurrence, the chart datum of the reference
CWC station adopted are:
Lakhipur : 13.25 m above MSL
A.P Ghat : 9.25 m above MSL
Badarpur Ghat: 7.00 m above MSL

DPR for development of Lakhipur – Bhanga stretch of Barak River for shippingand Navigation
Revised Final Report Page 35
Intermediate gauge stations were established at every 10 km interval. The water
levels related to MSL were observed at these gauges during survey. CD value for
intermediate stations was determined by interpolation technique. The difference in water
level and the CD at the known gauge station were applied to the observed water level to
obtain the local datum for sounding for that respective sub stretch applying respective
reduction factor. Actual soundings were reduced by applying this factor and are presented
in Table 3.2
Table 3.2 CD value for different gauge stations
Sl. No Name of Station Chainage from Lakhipur Chart Datum (above MSL)
1 Lakhipur 0 13.25
2 Chirimukh 10 12.59
3 Nandpur 20 11.92
4 Dhamli 30 11.25
5 Badri Ghat 40 10.59
6 Sadar Ghat 50 9.92
7 A.P Ghat 60 9.25
8 Chandapur 70 8.80
9 Raypur 80 8.35
10 Ganigram 90 7.90
11 Kalinagar 100 7.45
12 Badarpur Ghat 110 7.00
13 Malua 120 6.55
3.4 ESTABLISHMENT OF TBM
Temporary Bench marks (TBM) were established throughout the river stretch along
the high banks at an approximate interval of 10 km. These TBMs were connected to CWC
Benchmark at Lakhipur from where the survey was commenced. The levelling done for
connecting the TBMs were closed at available enroute CWC bench mark station and the
closing error thus obtained was distributed stretch wise. The BM value observed at CWC
Gauge site is presented in Table 3.3.

DPR for development of Lakhipur – Bhanga stretch of Barak River for shippingand Navigation
Revised Final Report Page 36
Table 3.3 List of CWC Gauging Site with BM Values
3.4.1 Establishment of Water level Gauges
In addition to the three CWC gauges, ten gauges were erected in between Lakhipur
and Bhanga. With respect to the datum values at three CWC gauges, the datum values of
erected gauges were found out by simple interpolation technique. The observed readings
taken during the survey are presented in Table 3.4.
Table 3.4 Observed Temporary Gauge Data
CHIRIMUKH (10 Km)
Date Time Water Level Date Time WaterLevel
04/05/2011 0700 15.41 05/05/2011 0700 1561
0800 15.41 0800 15.61
0900 15.42 0900 15.61
1000 15.42 1000 15.61
1100 15.43 1100 15.62
1200 15.43 1200 15.62
1300 15.44 1300 15.62
1400 15.44 1400 15.61
1500 15.45 1500 15.61
1600 15.46 1600 15.60
1700 15.47 1700 15.60
1800 15.48 1800 15.60
S.No G&D Site Location Description Value(aboveMSL)
1 Lakhipur Situated at the river bank at thegauge site of Central waterCommission near River Dale school,Lakhipur
27.091
2 Annapurna Ghat(A.P.Ghat)
On top of RCC pillar present in theentrance of Annapurna Mandir nearRailway goods yard, Silchar
21.565
3 Badarpur Ghat(B.P.Ghat)
Situated on top of the protectedmasonary structure in front of CWCsite office, Badarpur Ghat.
18.340

DPR for development of Lakhipur – Bhanga stretch of Barak River for shippingand Navigation
Revised Final Report Page 37
NANDPUR(20) DHAMLI(30)
Date Time Water Level Date Time Water Level
06/05/2011 0700 13.38 07/05/2011 0700 12.72
0800 13.38 0800 12.72
0900 13.37 0900 12.72
1000 13.37 1000 12.71
1100 13.35 1100 12.71
1200 13.33 1200 12.71
1300 13.30 1300 12.71
1400 13.29 1400 12.71
1500 13.29 1500 12.71
1600 13.28 1600 12.71
1700 13.28 1700 12.71
1800 13.27 1800 12.71BADRI GHAT(40)
Date Time Water Level Date Time Water Level08/05/2011 0700 12.91 09/05/2011 0700 12.71
0800 12.91 0800 12.690900 12.91 0900 12.691000 12.92 1000 12.671100 12.92 1100 12.651200 12.92 1200 12.641300 12.92 1300 12.611400 12.92 1400 12.601500 12.92 1500 12.601600 12.92 1600 12.591700 12.92 1700 12.571800 12.92 1800 12.54
SADAR GHAT(50)
Date Time Water Level09/05/2011 0700 11.67
0800 11.650900 11.641000 11.631100 11.601200 11.581300 11.581400 11.551500 11.531600 11.511700 11.491800 11.46

DPR for development of Lakhipur – Bhanga stretch of Barak River for shippingand Navigation
Revised Final Report Page 38
CHANDPUR(70)
Date Time Water Level Date Time Water Level12/05/2011 0700 9.68 13/05/2011 0700 9.64
0800 9.68 0800 9.640900 9.68 0900 9.641000 9.68 1000 9.641100 9.68 1100 9.641200 9.67 1200 9.631300 9.67 1300 9.631400 9.67 1400 9.631500 9.67 1500 9.631600 9.66 1600 9.631700 9.66 1700 9.621800 9.66 1800 9.62
RAYPUR(80)
Date Time Water Level Date Time Water Level13/05/2011 0700 9.10 14/05/2011 0700 8.89
0800 9.08 0800 8.890900 9.04 0900 8.881000 9.02 1000 8.871100 8.99 1100 8.871200 8.98 1200 8.861300 8.98 1300 8.851400 8.97 1400 8.841500 8.96 1500 8.831600 8.95 1600 8.821700 8.94 1700 8.811800 8.93 1800 8.81
GANIGRAM(90) KALINAGAR(100)Date Time Water Level Date Time Water Level15/05/2011 0700 8.68 16/05/2011 0700 7.71
0800 8.68 0800 7.720900 8.67 0900 7.731000 8.67 1000 7.731100 8.67 1100 7.741200 8.67 1200 7.751300 8.67 1300 7.781400 8.67 1400 7.781500 8.66 1500 7.801600 8.66 1600 7.811700 8.66 1700 7.821800 8.66 1800 7.82
DPR for development of Lakhipur – Bhanga stretch of Barak River for shippingand Navigation
Revised Final Report Page 39
MALWA(120)Date Time Water Level18/05/2011 0700 7.32
0800 7.320900 7.321000 7.321100 7.311200 7.311300 7.311400 7.311500 7.301600 7.301700 7.301800 7.30
3.5 WATERWAY OBSERVATION
3.5.1 Lakhipur to Chirimukh (Ch. 0-10 km)
This stretch has been covered in Sheet No. 1 and Sheet No. 2. A road bridge is
under construction at Ch. 0.5 km. The land identified for the proposed Lakhipur IWT
Terminal is at Ch 7.5 km on right bank. A rainfed river Chiri joins at Ch 9.8 km as right bank
tributary. The Depth was observed varying from 0.2 to 12.4 m and width from 100 to 250
m.
3.5.2 Chirimukh to Nandpur (Ch. 10- 24 km)
This stretch has been covered in Sheet No. 3 and Sheet No. 4. Two major bends fall
in this zone at Ch 18.5 and 23.0 km. River Sonai joins as tributary on left bank at Ch 18.5
km. Depth varying from 0 -11.5 m and width from 100 to 250 m.
3.5.3 Nandpur to Dudhpatli (24-61 Km)
This stretch has been covered in Sheet No. 5 - 8. This stretch has eleven bends. Two
of them being critical at Ch 27.9 and 44.7 km. IWT ferry services are existing across the
river at Badri Ghat. A double lane road bridge crosses the river at Sadar Ghat near Silchar.
High Tension line crosses the river at Ch 52.3 km. One rainfed river namely Madhura joining
as right bank tributary at Ch. 54.8 km. Assam IWT mechanised ferry services are found in
operation at Madhura ghat and AP ghat. The depth is varying from 0.2 to 17.3 m and the
width varying from 106 to 230 m.

DPR for development of Lakhipur – Bhanga stretch of Barak River for shippingand Navigation
Revised Final Report Page 40
3.5.4 Dudhpatli to Rani Ghat (Ch. 61- 77.7 km)
The river stretch has been covered in Sheet No. 09 - 10. River has more bends and
one of them is critical at Ch. 64.0 km. One rainfed river namely Jatinga joins as right bank
tributary at Ch 69.1 km. A single line rail bridge crosses the river at Ch 61.4 km. A double
line road bridge crosses the river at Ch. 75.6 km. Assam IWT mechanised ferry services are
found in operation at Jatinga Ghat. High tension line at Ch 61.6 km crosses the river. Depth
varying from 0.1 to 18.6m and width from 112 to 340 m.
3.5.5 Ranighat to Sripur (Ch. 77.7-97.2 km)
The river stretch has been covered in Sheet No. 11-12. River has two main bends at
Ch. 82 km and 91.5 km and the latter bend was observed as critical. A rainfed river namely
Ghagra joins as tributary at Ch 92.5 km in left bank. Assam IWT mechanised ferry service is
found in operation at Ch 86.21 km. Depth varying from 0.2 to 12.5 m and width from 120 to
240 m.
3.5.6 Sripur to Badarpur ( Ch. 97.2 -109 km)
The river stretch has been covered in Sheet No. 13-14. Two rainfed rivers namely
Katakhal and Dhaleswari joins as left bank tributaries at Ch 99.1 and 105.2 km respectively.
This stretch has mainly two bends at Ch 99.0 and 108 km respectively. A high tension
power line crosses the river at Ch. 109 km. Bank protection is provided at left bank at Ch.
99.3 to 99.9 km. Depth varying from 0.9 to 16.9 m and width from 130 to 250 m.
3.5.7 Badarpur to Maula (Ch. 109 - 120 km)
The river stretch has been covered in Sheet No. 15-16. A double lane road bridge
crosses the river at Ch 109.5 km. A Single line rail bridge crosses the river at Ch 110.2 km.
A bridge is under construction at Ch 110.25 km. Badarpur CIWTC terminal located at Ch.
110.8 km. A small rock outcrop was visible at middle of the channel at Ch. 115.4 km. Bank
protection was provided in left bank at Ch. 111.5 to 112.8 km. Two small bends were
observed at Ch. 116.5 and 118.9 km. Depth varying from 0.4 to 19.1m and width from 130
to 350 m.

DPR for development of Lakhipur – Bhanga stretch of Barak River for shippingand Navigation
Revised Final Report Page 41
3.6 GHATS
16 number of Ferry ghats exist along the stretch of the river for transportation of
passengers and materials across the river. Table 3.5 shows the list of Ferry service ghats
available in Barak river between Lakhipur- Bhanga and other ferry ghats are shown in
Drawing: 1000 enclosed.
Table 3.5 List of Ferry Service Ghats
Sl. No NAME OF GHATDISTANCE FROM
LAKHIPURREMARKS
(Type of Country vessel being used)
1 Fulertal Ghat 0 Mechanised/wooden Boat
2 Silghat 10.48 Mechanised/wooden Boat
3 Baskandi Ghat 13.7 Wooden Boat
4 Sonai Ghat 24.04 Wooden Boat
5 Sonabari Ghat 35.11 Mechanised/wooden Boat
6 Badri Ghat 41.21 Mechanised/wooden Boat
7 Sadar ghat 51.62 Wooden Boat
8 Madhura Ghat 54.72 Mechanised/wooden Boat
9 AP Ghat 57.38 Mechanised/wooden Boat
10 Bali Ghat 68.22 Wooden Boat
11 Jatinga Ghat 69.12 Mechanised/wooden Boat
12 Rani Ghat 75.61 wooden Boat
13 Raypur Ghat 80.18 Wooden Boat
14 Rajnagar ghat 86.21 Mechanised/wooden Boat
15 Badarpur ghat 110.51 Wooden Boat
16 Malua Ghat 119.14 Wooden
3.6.1 Ferry crossings
There are 8 number of mechanised ferry crossing stations existing in the river
stretch. These are operated by Assam Inland Water Transport department. In addition to
these, country crafts are found in operation at many places for both crossing the river and
carrying materials from place to place.
3.7 BEND
There are 3 number of critical bends observed in Lakhipur-Bhanga river stretch the
same are presented in Table 3.6.

DPR for development of Lakhipur – Bhanga stretch of Barak River for shippingand Navigation
Revised Final Report Page 42
Table 3.6 List of Critical Bends observed in Lakhipur – Bhanga stretch of Barak River
Sl.No Name of Place Chainage from Lakhipur Bend radius in Meter
01 Rangpur 44.8 240
02 Topkhana 64.0 200
03 Ganigram 91.5 300
3.8 BED SLOPE
The average slope of the river stretch from Lakhipur to Silchar is 1 in 14500 (i.e
6.89cm/km). The average slope of the river stretch from Silchar to Badarpur Ghat is 1 in
23288 (i.e 4.29 cm/km)
3.9 BRIDGES OBSERVED ACROSS WATERWAY
Major Railway and Road bridges were observed during the Hydrographic survey
carried out between Lakhipur and Bhanga. Table 3.7 shows the list of bridges along with
horizontal and vertical clearances available during flood seasons are presented.
Table 3.7 List of Bridges observed across Waterway
S.No.
LOCATION
DISTANCEFROM
LAKHIPUR INkm
TYPEHORIZONTALCLEARANCE
IN 'm'
VERTICALCLEARANCE
IN 'm' (aboveHFL)
1 Lakhipur 0
Bridge UnderConstruction (RailBridge connecting
Jiribam)
-
2 Silchar 52.31Double Lane RCC Road
Cantilever Arc TypeBridge
50.605 10.1
3 Masimpur 61.36Steel Rail
Bridge(Single Line)54.3 5.1
4 Ranighat 65.68Double Lane RCC Road
Bridge35 8.7
5 Badarpurghat 109.57Double Lane RCC Road
Bridge (TowardsShillong & Guwahati)
96.5 12.5
6 Badarpurghat 110.2Steel Rail
Bridge(Single Line)83.1 10.4
7Badarpur
Ghat110.25
Bridge UnderConstruction
-

DPR for development of Lakhipur – Bhanga stretch of Barak River for shippingand Navigation
Revised Final Report Page 43
3.10 LIST OF SHOALS/ROCK OUTCROP OBSERVED IN WATERWAY
The following are the details of shoals/rock outcrop observed during the
topographic and hydrographic survey carried out in Barak River.
Easting Northing Remark
Bhanga to Rajnagar
458414.49 2751470.34 Big Sand patch (of size app. 200 x 50 m) LHS
458783 2751581 Sand patch LHS
452930 2750031 Stone in between River
454872 2751382 Rock in between river
Rajnagar to Silchar
472800 2755294 island both side
480393 2745551 island in RHS
Silchar to Lakhipur
480399 2745546 Island LHS
482457 2741277 Island RHS
493433 2743861 Chirimukh river meets Barak on LHS
Lakhipur to Tipaimukh
503250.47 2740717.95 About 10mtr high stone in between river
508345.44 2721971.37 shallow Area
508290.11 2719586.63 sand patch left hand side
506708.90 2715290.14 sand patch left hand side
504369.45 2705365.88 Sand dune RHS
503862.27 2700948.73 Sand dune LHS
502107.74 2699440.63 Sand dune LHS
502593.20 2697375.66 Gravel dune RHS

DPR for development of Lakhipur – Bhanga stretch of Barak River for shippingand Navigation
Revised Final Report Page 44
501970.78 2695867 Gravel dune LHS
501717.04 2693371 Sand dune LHS
500703.84 2685449.73 Gravel dune RHS
501896.35 2680235.53 Marked Dam in Bank of River bank
502256.09 2680327.17 Meeting of two rivers at Tipaimukh
3.11 HYDROGRAPHIC CHARTS
Continuous sounding lines were run from bank to bank i.e., 0 m contour to 0 m
contour up to normal HFL at 500 m interval from Lakhipur to Bhanga in river Barak (121 km)
and survey charts were prepared in 1:5000 scale. Based on the cross section charts
prepared, deepest part of the channel was identified. The identified Thalweg was
continuously traversed with longitudinal survey with single line sounding. The soundings
were reduced to CD. The Hydrographic charts, both LS and CS lines were plotted for
1:50,000 and 1:5000 scales respectively as per terms of reference. The completed charts
are attached separately as Annexure to this report.

DPR for development of Lakhipur – Bhanga stretch of Barak River for shippingand Navigation
Revised Final Report Page 45
CHAPTER 4
TRAFFIC STUDIES
4.1 INTRODUCTION
Assam (Assamese অসম [Asom]), also Assam Valley and formerly the Assam Province
(during British India) is one of the most culturally and geographically distinct regions of the
country. Assam though one of the original provinces of British ruled Indian sub-continent
and present day India having its legislature that dates back to 1937, the present day Assam
had undergone numerous territory alignment changes with its state map being altered
highest number of times when compared to any other provincial level changes that has
happened in Independent India. Known for exquisite natural resources, geography and its
important role in India's freedom struggle, Assam has its capital as Dispur, a specialized city
circuit region located on the outskirts of its largest metropolis, Guwahati.
Assam is situated in the North East region of India bordering seven states viz.,
Arunachal Pradesh, Manipur, Meghalaya, Mizoram, Nagaland, Tripura and West Bengal and
two countries viz., Bangladesh and Bhutan. With a geographical area of 78,438 km2, about
2.4 % of country’s total geographical area provides shelter to 2.2 % population of the
Country. Most of the state’s population lives in the lush and verdant valleys of its two
major river systems in the 24 districts of the Brahmaputra valley and 3 districts of the Barak
valley. Less densely populated are the two hill districts of Karbi-Anglong and the North-
Cachar Hills, set in the low lying hills that separate the two valleys. For administrative and
revenue purposes, the state has 27 districts including Kamrup (Metro) district and four
districts under Bodoland Territorial Council (BTC) areas viz., Kokrajhar, Chirang and
Udalguri.
4.2 PROJECT INFLUENCE AREA
Barak River is the principal river of Cachar or Barak Valley and is also known as
Barokaro. The Barak River has a length of nearly 190 km in the Barak Valley. The Project
Influence Area (PIA) of the proposed development of Lakhipur- Bhanga stretch of Barak
River comprises three districts namely Cachar, Hailakandi and Karimganj, few districts of

DPR for development of Lakhipur – Bhanga stretch of Barak River for shippingand Navigation
Revised Final Report Page 46
Meghalaya, Manipur and Tripura. Total PIA of Cachar (3786 km2), Hailakandi (1327 km2)
and Karimganj (1809 km2) districts is 6922 km2.
4.3 DEMOGRAPHIC PROFILE OF PIA
According to Census of India (2011), the population of Assam stands at 3,11,69,272.
The decadal growth of the State’s population works out to 16.93 % during 2001-2011 as
against 17.64 % for the country as a whole.
The secondary data pertaining to demographic profile, socio-economic profile,
urbanisation, etc of the PIA were collected to bring out the socio-economic characteristics
in a broader way. Table 4.1 presents the demographic profile of PIA.
Table 4.1 Demograpahic Profile of PIA
Sl. No DistrictPopulation
Percentage DecadalGrowth Rate
PopulationDensity per
Sq.km
2011 2001 1991-01 2001-11 2011 2001
1 Cachar 17,36,319 14,44,921 18.89 20.17 459 382
2 Hailakandi 6,59,620 5,42,872 20.89 21.44 497 409
3 Karimganj 12,17,002 10,07,976 21.87 20.74 673 557
Source: Statistical Hand Book, Assam, 2010 and Census of India
4.3.1 Urbanisation and Occupational Structure
The extent of urbanisation is measures in terms of percentage of urban population
to total population. As per population census of 2001, the rural population of the state was
87% of the total population. All the 3 districts of Assam falling in the PIA have shown lower
urbanisation than the state level of 13 percent as per 2001 census.
The work force classification of population by economic activity according to the
result of population census 2001 reveals that out of total population, 85% were main
workers and 15 % were marginal workers. The distribution of main work force reveals that
major share is engaged in agriculture and allied activities. The total share of work force
employed as cultivators and agricultural labour. This shows that Assam state’s economy is
mainly agriculture based.

DPR for development of Lakhipur – Bhanga stretch of Barak River for shippingand Navigation
Revised Final Report Page 47
4.4 EXISTING PRIMARY TRAFFIC MODES
PIA vis-à-vis Barak Valley is served by all the three surface modes of transport ie.,
rail, road and IWT. The rail and road services are available nearly all through the year. But,
IWT services are operated between May and November. IWT services are stopped after
November because of insufficient Least Available Depth (LAD) for the movement of vessels.
IWT services are confined to cargo movement only from/to Kolkatta/Haldia through Indo-
Bangladesh Protocol Route. More number of country boats are operating on the stretch of
Tipaimukh to Karimganj transporting both passenger and goods traffic on short leads. This
short lead IWT movement is not considered because of its insignificant share in the total
traffic and difficulty in gauging the exact quantum of cargo being transported.
4.5 INLAND WATER TRANPORT IN BARAK VALLEY
IWT services on river Barak has a long history. Mechanised vessels were introduced
in the river as early as 1863 during British period. These vessels were used for transporting
men and material from/to Calcutta to the newly set up tea estates in Barak Valley. These
services from Calcutta to Silchar were operated by River Stream Navigation Company till
1965.
Large scale movement of passengers using IWT mode in the organised and
unorganised sectors. It is estimated that 30 million people are using the organised sector
and 20 million use unorganised sector every year in NW-2 and Barak valley.
Table 4.2 shows the total cargo movement through Protocol route. This includes
the portion of cargo diverted through NW-2. Indo-Bangladesh protocol transit and trade
was handed over by CIWTC to IWAI on 8th September 2003. Figure 4.1 shows the
development/progress of IWT cargo movement during 2003 to 2011 through Protocol
route.

DPR for development of Lakhipur – Bhanga stretch of Barak River for shippingand Navigation
Revised Final Report Page 48
Table 4.2 DETAILS OF CARGO MOVED THROUGH INDO-BANGLADESH PROTOCOLROUTES (YEAR 2003 TO JANUARY 2010)
YEAR TOTAL MOVEMENT (M.T.)
2003 220632
2004 322872.61
2005 555972.16
2006 753277.74
2007 889348.14
2008 884451.364
2009 1338659.135
2010 1496359.924
2011 (upto July) 1004375.592
Source: IWAI and CIWTC Records, Kolkatta
Figure 4.1 Progress of Cargo Movement through Protocol Routes

DPR for development of Lakhipur – Bhanga stretch of Barak River for shippingand Navigation
Revised Final Report Page 49
4.5.1 IWT Services in Barak River
IWT operation on Barak River is seasonal. Even prior to 1965, these services used to
be suspended for 2 to 3 months every year due to non-availability of Least Available Depth
(LAD). In general, vessels having draft of 1.85 m could ply between May and October from
Calcutta to Silchar. During lean periods, the cargo movement was also carried out involving
transhipment to smaller boats which were able to ply with draft of even less than 1 m.
Normally these services operated between Markuli and Silchar from Nov. to Feb every year.
Table 4.3 presents the total cargo carried from/to Karimganj and Badarpur terminals for the
year 2011 (till Dec). Table 4.4 presents the yearwise traffic handled from Badarpur and
Karimganj IWT terminals to/from Kolkatta/Haldia via. Bangladesh. Table 4.3 shows the
quantities of coal and fly ash despatched/received from/at Badarpur and Karimganj IWT
Terminals.
Table 4.3 VESSEL WISE CARGO MOVEMENT WITH VESSEL DIMENSION MOVED FROM KARIMGANJ ANDBADARPUR DURING 2011
Sl.No Name of vessels Dimensions in mCarrying
capacity (MT)
Cargo carried*
Up (Fly ash) DN (coal)
1 MV TLN 22 43.6X8.22X3.5 283.5 420 243
2 MV QUAMI 2 45.75X8.55X3.66 283.5 380 195
3 MV FARHAD 1 44.19X7.92X3.3 310 250 135
4 MV TLN 16 45.75X8.75X3.66 330 275 160
5 MV ALSIMIT 4 41.46X7.92X2.99 - 215 172
6 MV MARINE 7 42.68X8.54X2.9 - 190 0
7MV RABINDRANATH
TAGORE (IWAI)54.6X9.6X11 - 295 300
Source : CIWTC, Kolkatta
*Note: Data pertaining to total cargo carried to/from Badarpur/Karimganj was provided by
CIWTC, Kolkatta and the exact number of trips by vessels for carrying the cargo was not
provided.

DPR for development of Lakhipur – Bhanga stretch of Barak River for shippingand Navigation
Revised Final Report Page 50
Source : IWAI & CIWTC, Kolkatta – Produced with the permission of CIWTC & IWAI, Kolkatta.
Table 4.3 YEARWISE QUANTITY AND COMMODITY HANDLED & OF VESSELS DEPLOYED FROM KARIMGANJ & BADARPURDURING 2000-01 TO 2010-11
DETAILS
CIWTC IWAI BANGALADESH TOTAL
YearNo .ofVessel
Commodity QtyNo .ofVessel
Commodity QtyNo .ofVessel
Commodity QtyNo .ofVessel
Qty(MT)
2000-01 - - - - - - 31 coal 9205 31 9205
2001-02 3Detergent,
Bamboo 1264 - - - 49 coal 10540 52 11804
2002-03 1Detergent,
Poultry feed 458 - - - 49 coal 12746 50 13204
2003-04 - - - - - - 18 cement, coal 8001 18 8001
2004-05 6 cement 3327 1 cement 300 6Lime stone, Saly,
GI sheet 3136 13 6763
2005-06 - - - - - - - - - - -
2006-07 5 Fly ash 2 Edible oil 586 2 Fly ash 450 9 3694
2007-08 11E. oil, Fly ash,
Clinkere 4449 1 Edible oil 277 5 Fly ash, cement 3476 17 8202
2008-09 4 E.oil, Fly ash 2147 2 Bitumine,E.oil 744 - - - 6 2891
2009-10 5Cut, Bamboo, Fly
ash 2593 2Bamboo, fly
ash 500 4 Fly ash 2192 11 5285
2010-11 1 Food grains 550 2 Edible oil 659 1 Iron spares 590 4 1799
2011-12,upto Dec-
11' - - - 1 fly ash, coal 595 6 Fly ash, coal 2635 11 4072

DPR for development of Lakhipur – Bhanga stretch of Barak River for shippingand Navigation
Revised Final Report Page 51
4.6 Road Connectivity & Traffic Survey
PIA is well connected with road network. Presently road is the only mode available
throughout the year for goods and passenger traffic. Meter gauge railway network is
available in the PIA and the same is being under conversion into broad gauge. Although
major share of traffic is being handled by road transport to and from various parts of the
Country, but recorded information available at various Check Gates such as Srirampur
Check gate, Digorkhal check gate, etc., did not provide various streams of cargo movement.
The traffic which will likely be moved to through river Barak in the event of its being made
navigable, shall only be the diverted traffic from road transport. An attempt was made to
quantify the commoditywise Origin-Destination (OD) movement by road transport since no
representative recorded information is available with Transport Authority, Govt. of Assam.
It was observed that major share of traffic coming from various parts of the country
especially from outside by road.
North East cargo is coming to Guwahati, from where it is further despatched to
various destination in the North East including to PIA and to Manipur, Mizoram and Tripura.
The similar remarks will hold good for return traffic from North East. At selected check
gate, sample goods OD surveys were conducted for 28/48 hours. Loaded goods vehicle
were intercepted and information recorded through personal interview with the vehicle
crew. Details regarding the origin and destination of commodity carried and its weight
were collected from each goods carrier. The raw data collected through this survey has
been furnished as Annexure.
The commodity wise classification and processed data including traffic projection
are presented in the subsequent sections. It is noted that the OD survey has been
conducted during first week of July 2011. Monsoon rains were just commenced and the
same was affected the transportation of coal from Meghalaya. Hence, major coal
movement was not happened as expected. The cargo projection as per the earlier TEFS
report for barak river is presented in Table 4.4.

DPR for development of Lakhipur – Bhanga stretch of Barak River for shippingand Navigation
Revised Final Report Page 52
Table 4.4 Cargo Projection for River Barak
Sl. No CommodityTONNE KMS (Lakhs)
2001-02 2006-07 2011-12
1 Bamboo 39 55 75
2 Bamboo chips 96 151 220
3 Bamboo Products 60 89 125
4 Cement 1252 1496 1195
5Cement concreteProducts 10 15 22
6 Coal 626 999 1529
7 Edible Oil 46 81 127
8 Fertilizers 109 166 248
9 Iron & Steel 1559 1711 828
10 Iron Pipes 92 155 238
11 Machinery Parts 210 296 463
12 Other Misc. Cargo 149 181 220
13 Paper and goods 371 588 883
14 Household goods 18 22 26
15 Pulses 60 83 143
16 Rice 913 1374 2328
17 Rubber 51 77 122
18 Stone & Chips 310 434 620
19 Sugar 102 159 233
20 Tea & Coffee 82 129 205
21 Wheat and flour 20 30 50
22 Wood and Timber 22 38 57
Total 6197 8329 9957
4.6.1 Constituents of Commodity Group
The Origin-Destination (OD) survey of goods vehicles was conducted at Digorkhal
check gate located on Badarpur – Guwahati Road near Badarpur, which is the Barak valley
entry point for goods vehicles by road. The goods/commodities have been categorized in
different groups as given in Table 4.5.

DPR for development of Lakhipur – Bhanga stretch of Barak River for shippingand Navigation
Revised Final Report Page 53
Table 4.5 Commodity Group Categorization
ID No. Commodity Group Commodity
1 Cereals/ Cash Crops Wheat, Rice, Bajra, Jawar, Millets, Maize, Gram,
Pulses, sugarcane, cotton, Barley, Oil Seed, Tobacco,
dry chillies and others.
2 Chemicals Fertilizers, Wine, Beveage & Soft drinks, Acids, etc.
3 Perishable Commodities Fruit, Vegetables, Daily & Poultry Products, Fish and
Meat
4 Petrochemical products Petrol, Diesel, Kerosene and LPG
5 Livestock Animals, Oil cake and Bhusa
6 Construction Material &
Other Raw material
Sand, Stone, Bricks, Iron , Steel, Cement, Marble,
Stone slab, Hardware, Fitting & Fixtures, timber &
furniture items, machinery light & heavy, paper mill
raw material, etc.
7 Conventional fuels Coal and firewood
8 Minerals Lime stone, iron and copper ore, etc
9 Consumer and other
goods
Consumer goods, Appliances, Edible oil, refined oil,
paper products, Jute products, Tea, finished products
from Manipur, Mizorom and Tripura, etc.
10 Other Items Other minor goods and ODC Movement.
As a part of traffic survey, the total number of goods vehicles passing at the survey location
were counted and interviewed continuously for 3 days. The respective commodity and its
weight (in tonnes) were noted.
4.6.2 Goods Movement by Railways
Survey was carried out to assess the goods movement by railways. Table 4.6 to 4.11
show the commodity which is presently transported by railways.

DPR for development of Lakhipur – Bhanga stretch of Barak River for shippingand Navigation
Revised Final Report Page 54
Table 4.6 Inward Movement of Goods by Railway at Silchar Railway Station
Sl.
No
FY 2010-11 Commodity Tonnes
1 April Group 1:
Fertilizers, Cement, Bituminous
products
Group 2:
Vegetable: Potato
Group 3:
Salt, Rice, Wheat, Joguli, Plastic goods
Group 4:
Military Goods & Purchal
70807
2 May 12151
3 June 17782
4 July 48721
5 August 23930
6 September 26054
7 October 20820
8 November 40290
9 December 32777
10 January 13104
11 February 17040
12 March 22736
Total Movement/annum 3,46,212
Average Inward Movement/month 28851
Table 4.7 Outward Movement of Goods by Railway at Silchar Railway Station
Sl. No Commodity Tonnes/Month Destination
1 Cement 1000 Tripura
2 Stone andaggregates
1300 Tripura
3 Local Rice 200 Tripura
4 Tea 1000 Via Guwahati to Kolkatta & North
Average Outward 3300/month
Annual OutwardCargo
39,600/year

DPR for development of Lakhipur – Bhanga stretch of Barak River for shippingand Navigation
Revised Final Report Page 55
Table 4.8 Inward Movement of Goods by Railway at Karimganj Railway Station
Sl. No Commodity Tonnes/Month Origin
1 Sugar 2100 U.P. & North
2 Fertilizer 4200 Kolkatta
3 Salt 1200 Kolkatta/Gujarat
4 Potato 800 Via Guwahati from Kolkatta & U.P.
Average Inward 8300/month
Annual Inward Cargo 99,600/year
Table 4.9 Outward Movement of Goods by Railway from Karimganj Railway Station
Sl. No Commodity Tonnes/Month Destination
1 Fertiliser 500 Tripura
2 Stone and aggregates 650 Tripura
3 Local Rice 300 Tripura
4 Other local products/packed items 770 To Tripura
Average Outward 2220/month
Annual Outward Cargo 26,640/year
Table 4.10 Inward Movement of Goods by Railway at Badarpur Railway Station
Sl. No Commodity Tonnes/Month Origin
1 Sugar 1700 U.P. & North
2 Fertilizer 2800 Kolkatta
3 Salt 900 Kolkatta/Gujarat
4 Potato & Other raw materialfor paper mill
740 Via Guwahati from Kolkatta& U.P.
Average Inward 6140/month
Annual Inward Cargo 73,600/year

DPR for development of Lakhipur – Bhanga stretch of Barak River for shippingand Navigation
Revised Final Report Page 56
Table 4.11 Outward Movement of Goods by Railway at Silchar Railway Station
Sl. No Commodity Tonnes/Month Destination
1 Cement 2000 Tripura/Guwahati/Megalaya
2 Paper Products 1500 Guwahati/West Bengal
3 Local Rice 350 Tripura/Guwahati
4 Tea 700 Via Guwahati to Kolkatta & North
Average Outward 4550/month
Annual OutwardCargo
54,600/year
4.6.3 Goods Movement by Road
Survey was carried out to assess the goods movement by road. Table 4.12 shows
the commodities which are presently transported by road.
4.7 PROPOSED TRAFFIC TO IWT TERMINALS
Based on the various modes of divertable traffic, Karimganj IWT terminal will be
expected to cater to a whole range of traffic related to Karimganj district and Tripura state.
Badarpur terminal will attract traffic from Cement, Paper industries and coal transported
from Meghalaya. Fly ash from Haldia/Bangladesh would be the incoming cargo for cement
industries. Silchar being a re-distribution centre will handle traffic for Silchar district and
Manipur state. Lakhipur terminal is proposed to attract traffic for some parts of Silchar
district and Manipur State. Bamboo and products will be the return cargo from Lakhipur to
Badarpur Paper mills and further towards Bangladesh.
Based on the traffic studies, Terminal wise origin/terminating traffic which may be
diverted to IWT mode of transportation is proposed in Table 4.9. Practically the traffic
tonnage presented in Table 4.9 may not be available for IWT mode due to various
operational constraints including vessel availability, development of required infrastructure
with a time frame, draft availability, Protocol constraints etc. Hence, around 30 to 50 % this
traffic may be expected to be transported via IWT mode. It is also observed that full
potential of IWT mode can be achieved once the waterway is fully developed and other
protocol constraints addressed in the course of time.

DPR for development of Lakhipur – Bhanga stretch of Barak River for shippingand Navigation
Revised Final Report Page 57
Table 4.12 Commodity wise Cargo Movement by Road
Commodity Group Commodity
Inward Outward Inward Outward Inward Outward Inward Outward
Cereals/ Cash Crops
Wheat, Rice, Bajra, Jawar, Millets, Maize,
Gram, Pulses, sugarcane, cotton, Barley, Oil
Seed, Tobacco, dry chillies and others.
100800 70560 67200 47040 100800 70560 67200 47040
ChemicalsFertilizers, Wine, Beveage & Soft drinks, Acids,
etc.72000 50400 48000 33600 72000 50400 48000 33600
Perishable CommoditiesFruit, Vegetables, Daily & Poultry Products,
Fish and Meat43200 30240 28800 20160 43200 30240 28800 20160
Petrochemical products Petrol, Diesel, Kerosene and LPG 43200 30240 28800 20160 43200 30240 28800 20160
Livestock Animals, Oil cake and Bhusa 14400 10080 9600 6720 14400 10080 9600 6720
Construction Material & Other
Raw material
Sand, Stone, Bricks, Iron , Steel, Cement,
Marble, Stone slab, Hardware, Fitting &
Fixtures, timber & furniture items, machinery
light & heavy, paper mill raw material, etc.
100800 70560 67200 47040 100800 70560 67200 47040
Coal and firewood
Lime stone, iron and copper ore, etc
Consumer and other goods
Consumer goods, Appliances, Edible oil,
refined oil, paper products, Jute products, Tea,
finished products from Manipur, Mizorom and
Tripura, etc.
27000 18900 18000 0 27000 18900 18000 12600
Other Items Other minor goods and ODC Movement.
0 0
0
NOT CONSIDERED
Silchar (in tons) Badarpur(in tons) Lakhipur (in tons) Karimganj (in tons)
Conventional fuel, Minerals 198000108000 0 540000

DPR for development of Lakhipur – Bhanga stretch of Barak River for shippingand Navigation
Revised Final Report Page 58
Table 4.9 Terminal wise Divertable Traffic Cargo Projection
Sl. No TerminalOriginating
2011-12 2015-16 2020-21 2025-26
1 Lakhipur 3353 3787 4542 5392
2 Silchar 47957 62037 83144 108147
3 Badarpur 320210 429313 593360 788148
4 Karimganj 141127 185354 252904 334084
Sl. No TerminalTermination
2011-12 2015-16 2020-21 2025-26
1 Lakhipur 210658 216961 224840 232719
2 Silchar 273609 393577 589550 836646
3 Badarpur 47079 66398 97537 136444
4 Karimganj 200460 281002 409892 570131

DPR for development of Lakhipur – Bhanga stretch of Barak River for shippingand Navigation
Revised Final Report Page 59
CHAPTER 5
VESSEL SIZE ANALYSIS & STUDY
5.0 INTRODUCTION
The major principal parameters governing Inland Waterway Fleet designs are:
Terminal facilities and obstructions enroute,
Waterway characteristic like river course, depth of water, radius of bends,
current/velocities of water etc.,
Navigational aspects and improvements to navigation,
Cargo characteristic like type of cargo, quantum of cargo and distance of
transportation,
The vessel dimension like length, beam, moulded depth, minimum and maximum
draft,
Haulage distace
Physical constrains like clearance under bridges, navigation locks size etc., and
Capital, operation and maintenance cost.
5.1 FACTOR GOVERNING DESIGN PARAMETER
5.1.1 Cargo Characteristics
The cargo consist of construction material (cement, sand, stone, iron, steel etc.),
cereals/cash crops (wheat, rice, pulses, sugar, tea, etc.), livestock (animal, oil cake, etc.),
chemicals (fertilizer, wine etc.), mineral ore (coal, lime stone, iron etc.), others (consumer
goods, Jute, bamboo products, kirana/perchun appliances, edible oil, paper products etc.)
The volume of total cargo originating and terminating from different terminal is shown in
Traffic Studies chapter.
For quick movement of general cargo, it would be necessary that it stays for
minimum time in the loading/unloading terminals and not wait long time for vessels. To
achieve objective by selecting a craft size so that at least one craft moves every 5 days from
terminal towards destination.

DPR for development of Lakhipur – Bhanga stretch of Barak River for shippingand Navigation
Revised Final Report Page 60
5.1.2 Cargo Factors
The following cargo factors influence the design parameters:
Volume and nature of cargo i.e. the cargo mix to be transported,
Method of cargo handling facilities required or available,
Average lot size and length of Haul,
Balance of out and return cargo, and
Requirement for protection against weather.
5.1.3 Waterway and Other Features
The field investigations done in the total stretch of the river bring out the following
characteristic of the waterway which shall influence selection of the vessel for
transportation.
Variation in vertical clearance is available in majority of the bridges/crossings except
a railway bridge at Masimpur near to Silchar where around 4 to 5 m of vertical
clearance may only be available during floods.
River width all along the waterway available throughout the year. But width of
waterway in few places may not be sufficient for turning of vessels/ two way
operations during lean season. This could be achieved through periodical dredging.
Between Silchar and Badarpur, some shallow water depths are available and some
stretches sufficient navigational depth available.
Radius of bends.
Current velocities.
Hence, the waterway condition during lean season would dictate the selected vessel
to have shallow draft to ensure navigation all around the year.
5.1.4 Physical Constraints
To navigate the river, the existing structures for which vertical and horizontal
clearances are to be studied for effective vessel design on the water transport route.
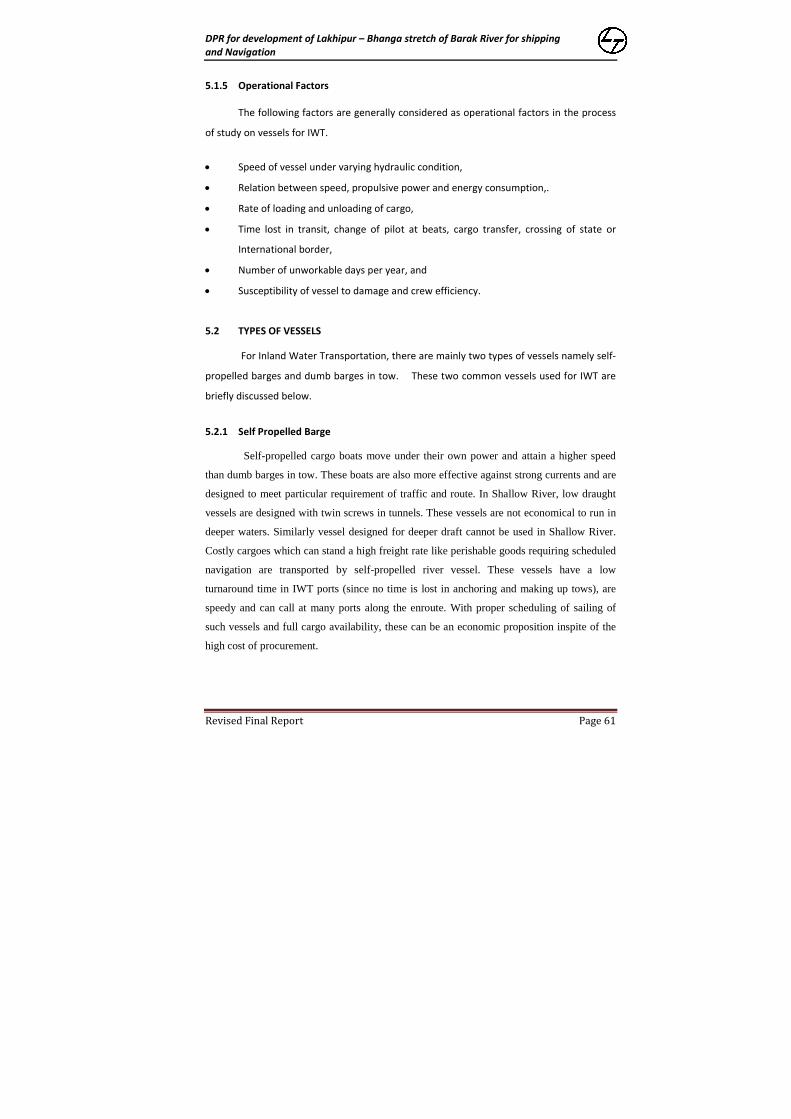
DPR for development of Lakhipur – Bhanga stretch of Barak River for shippingand Navigation
Revised Final Report Page 61
5.1.5 Operational Factors
The following factors are generally considered as operational factors in the process
of study on vessels for IWT.
Speed of vessel under varying hydraulic condition,
Relation between speed, propulsive power and energy consumption,.
Rate of loading and unloading of cargo,
Time lost in transit, change of pilot at beats, cargo transfer, crossing of state or
International border,
Number of unworkable days per year, and
Susceptibility of vessel to damage and crew efficiency.
5.2 TYPES OF VESSELS
For Inland Water Transportation, there are mainly two types of vessels namely self-
propelled barges and dumb barges in tow. These two common vessels used for IWT are
briefly discussed below.
5.2.1 Self Propelled Barge
Self-propelled cargo boats move under their own power and attain a higher speed
than dumb barges in tow. These boats are also more effective against strong currents and are
designed to meet particular requirement of traffic and route. In Shallow River, low draught
vessels are designed with twin screws in tunnels. These vessels are not economical to run in
deeper waters. Similarly vessel designed for deeper draft cannot be used in Shallow River.
Costly cargoes which can stand a high freight rate like perishable goods requiring scheduled
navigation are transported by self-propelled river vessel. These vessels have a low
turnaround time in IWT ports (since no time is lost in anchoring and making up tows), are
speedy and can call at many ports along the enroute. With proper scheduling of sailing of
such vessels and full cargo availability, these can be an economic proposition inspite of the
high cost of procurement.

DPR for development of Lakhipur – Bhanga stretch of Barak River for shippingand Navigation
Revised Final Report Page 62
5.2.2 Dumb Barge
Dumb barges are cheap and apart from being used for carriage of cargo, are also used
for storing, as floating warehouses or even as pontoon jetties. These vessels require very
little care and withstand rough handling. Small dumb barges do not normally have any
permanent crew and lie unattended. Transportation of cargo in dumb barges is a slow
process and there is normally no fixed schedule. Hence, bulk, unpacked and imperishable
cargo is transported in such barges which offer a low freight rate. In Europe and USA. river
transportation is normally carried in dumb barges in private sector.
5.2.3 Towing Arrangement
Dumb barges are grouped together to form flotilla which are towed by river tugs.
Three methods of towing have been used internationally depending upon channel depth and
width as well as the weather conditions experienced along the route. The following are the
general methods.
Towing astern,
Towing alongside, and
Push towing.
The first method, towing astern or pull towing has been used in European waters. A
long towline is paid out from the river tug (moving in front) to the foremost barges of the
flotilla. The flotilla may be made up of a number of rows of barges secured to each other or
held together by a tie line passed from barge to barge. Sometimes, barges may be tied to the
center barge alongside. In this system, the propeller race of the tug impinges on the front
thus increasing the resistance of the barge flotilla. Due to this, there can be an augmentation
of resistance as high as over 80% of the individual barge.. To reduce this increase in
resistance, a minimum length of towline equal to 1.25 times the length of the tug is
recommended. This increases the total length of tow considerably. Further, when the tow is
to take a turn, the radius of bend must be quite large. Therefore, this form of transportation is
good where only long straight stretches of waterway are available.

DPR for development of Lakhipur – Bhanga stretch of Barak River for shippingand Navigation
Revised Final Report Page 63
In towing alongside or abreast, one barge is secured fast to one side of the tug or two
barges are secured to either side of the tug. This is an efficient method of towing, the only
disadvantages being that the width of the waterway required should be more to
accommodate flotilla of twin barge width. The conventional method on the NW -1/river
Ganga in India has been towing abreast or side towing.
In push towing, flotilla, consisting of a number of barges arranged abreast and in
row, is formed by securing all the barges to one another tightly. The pusher tug pushes the
flotilla from behind. The propeller race does not affect resistance. Since all the barges and
tugs are close together, the incidence of increasing in resistance due to inference is
minimum. This system is prevalent in USA and is now being adopted in Europe and
elsewhere including India (eg. CIWTC) for its obvious advantages over pull towing. The
individual units of barges are normally full with rectangular bilge with/without end shapes.
5.2.4 Towing Tug
River tugs are designed and built as per particular requirements. The designs are
different for pull towing and push towing. In push towing, the foredeck is made square to
facilitate matching of barge end. Bollards and fairleads are mostly in the forward. In pull
towing, the mooring arrangements are astern and there is arrangement for paying out rope
(winch or capstan). Either of the tugs can be used for side towing by suitable provision of
bollards on their sides.
Various types of propulsion systems have been used on river/canals. The systems
most extensively used are paddle wheel propulsion, propulsion with other sophistication
such as multiple propellers and rudders, “Kort” nozzles, raised tunnels and rudder-propeller
propulsions.
The paddle wheel propulsion has disappeared since quite long from most of world
waterway although it offered good maneuverability, good stopping and backing abilities,
easy repair without dry docking and its suitability of use in shallow water with efficient
propulsion. The disadvantage which outweighed its advantages was heavier hull construction
with associated problems, big reduction gear and overall low efficiency.

DPR for development of Lakhipur – Bhanga stretch of Barak River for shippingand Navigation
Revised Final Report Page 64
The propeller propulsion system consisting of propellers and complete rudder system
comprising of normal rudder behind propellers and flanking rudder in the front of propellers
for reverse and stopping maneuvers is being widely used. In number of shallow draft vessels,
with this type of propulsion, Kort nozzles and raised tunnels have been provided with
propeller of lower diameter to get better efficient and thrust, provide protection to waterway
bottom and the banks and to protect the propeller from damage. However, construction is
difficult in case of tugs provide with Kort nozzle or tunnel.
The third type i.e. rudder propeller system was initially developed for motorizing
dumb barges and small vessels with ready-to-install unit but it has been developed for
propelling even the bigger size vessels. The advantage of this type is its high
maneuverability, simple installation without requiring floating dry docking facilities. The
disadvantages are lower efficiency as compared with system of fixed propeller with nozzles,
vulnerability of freely suspended propulsion arm and complicated machinery parts.
In pull towing, the propeller race of the tug impinges on the front barge thus
increasing considerably the resistance of the barge fleet. Moreover, pull towing requires
deployment of crew for steering the towed barges and has, in addition, the disadvantages of
being less maneuverable.
5.2.5 Push Tug
The important parameter for selection of the tug is the power requirement which
depends upon the displacement of tug and barges, the maximum dimension of the convoy,
current velocity, the parameters of waterway and the speed. Out of these factors speed
largely governs the power requirement. Researchers have suggested limiting value of speed
in shallow and narrow canals. In shallow water of unrestricted width, the economic speed in
m/s should be less than 2.5*√h where H is the depth of water. In narrow canals, economic
speed should be less than 1.2*√A/C for a blockage ratio of 5 (The ratio of wet canal cross
section to area of submerged mid ship section) where A and C are canal cross section and
canal perimeter respectively. The blockage ratio should not be less than 4.5 to prevent
erosion of canal bed and slopes caused due to return currents and waves. Thus the mid ship

DPR for development of Lakhipur – Bhanga stretch of Barak River for shippingand Navigation
Revised Final Report Page 65
cross section on this route should be less than 13.67 m2. The vessel speed on the above
consideration should not be higher than 6.12 knots/hr in river section and 2.68 knots/hr in
canal section. The power requirement of push tug has been based on the speed in river
section.
In push towing, barges are lashed together by wire ropes to form a single unit and
this, in turn, is lashed rigidly to the towing knees of the pusher tug. The tug working at the
rear can handle a fleet of barges at a greater speed and with greater control is possible in pull
towing operation. The tug is equipped with a set of steering and flanking (backing) rudders
which afford maximum control for forward, backward and sideward movements as are
required in restricted channels. For this reason, push towing has been recognized as the most
efficient. It requires 20% less power than pull towing for comparable loads.
5.2.6 Towed Flotilla v/s Self Propelled Vessel
The merits and demerits of both alternatives that will help in making final choice
are:
(i) In a towed flotilla, the cargo carrying unit and the engine unit are separate.
Therefore, they can be scheduled independent of each other and thus ensure
maximum transport efficiency. As the self-propelled vessels are expected to be
more economical over long lead, both the alternatives have to be compared for
cargo transportation.
(ii) In towing system when towing unit is down for engine survey, maintenance and
repair, the cargo units need not be down and can be moved with another available
towing unit, whereas in self-propelled barge system, one engine unit is always tied
up with cargo unit.
(iii) Flotilla can be formed with varying units of barges. Therefore, this system can adjust
to a fluctuating or uncertain transportation environment in an efficient manner.
This system efficient is much higher since only limited numbers of barge that can be
fully loaded are utilized. But this cannot be done for self-propelled vessels. If
regular cargo is available in sufficient quantity, transport efficiency of self-propelled
vessel can be more than flotilla.
(iv) Dumb barges are simply and less expensive to build and comparatively few towing
tugs are required to operate the flotilla combination. Self-propelled barges are

DPR for development of Lakhipur – Bhanga stretch of Barak River for shippingand Navigation
Revised Final Report Page 66
comparatively larger vessels and are more complex for building since the engine;
supporting bunkers and crew accommodation are to be housed. The procurement
price is generally 3 to 3.5 times that of a dumb vessel of same capacity.
(v) It is well known in naval architecture that long slender vessels experience less
resistance in motion. Well designed (ends properly shaped) dumb barges in flotilla
experience proportionately less resistance than single vessels. Two single units in
tandem experience 1.36 times the resistance of a single unit and a flotilla of 4
barges with two abreast in two rows experience 3.16 times the resistance of a
single unit. The average resistance per single barges in a flotilla can be taken as 0.75
times that of a single barge on its own. With this resistance there would be net
saving of 25% fuel, if barges are well designed and are moved in closely packed
flotillas as against self-propelled barges.
(vi) A dumb barge can remain unattended in voyage and need not house any crew
member. For a flotilla of 2 barges and one towing 4 crew members are sufficient.
But for 2 independent self-propelled vessels at least 8 crew members would be
required. Thus crew wage bill is reduced by half in case of towed system.
(vii) Maintenance for a flotilla system is easier and cheaper since barges are repaired
separately from tugs. Downtime due to repair is also reduced.
5.3 TRAFFIC
As per traffic studies, estimated traffic through 4 IWT terminals on Barak River are
as follows as per Table 4.4 which is represented here.
Terminal wise Origin /Destination of Traffic Cargo Projection
Sl. No TerminalOriginating
2001-02 2006-07 2011-12 2015-16 2020-21 2025-26
1 Lakhipur - - 3252 3787 4542 5392
2 Silchar - - 47957 62037 83144 108147
3 Badarpur - - 320210 429313 593360 788148
4 Karimganj - - 141127 185354 252904 334084

DPR for development of Lakhipur – Bhanga stretch of Barak River for shippingand Navigation
Revised Final Report Page 67
5.4 OPTIMAL VESSEL SIZE
Keeping in view the channel parameters and propulsion system as discussed above,
the following 300 tonnes of vessels are proposed for the proposed waterway.
300 tonnes vessel is recommended for channel 40 m wide x 1.6 m LAD and attract
private entrepreneurs to divert the traffic-load from rail/road sector and this vessel will
carry 300 tonnes when restricted draught D = 1.2m in lean season. The actual nos. of the
300 tonnes to start the IWT operation will depend on the availability of funds.
Principle particulars of these self-propelled vessels for operation on river are:
300 tonne vesselLength over all = 45.00 mBreadth = 8.00 mDraught = 1.20 mCargo capacity = 300 tonnes when 1.2m max draft.Propulsion system = Marine diesel engine with propeller 2 no’sOutput = 250 BHP
Sl. No TerminalTermination
2001-02 2006-07 2011-12 2015-16 2020-21 2025-26
1 Lakhipur - - 210658 216961 224840 232719
2 Silchar - - 273609 393577 589550 836646
3 Badarpur - - 47079 66398 97537 136444
4 Karimganj - - 200460 281002 409892 570131

DPR for development of Lakhipur – Bhanga stretch of Barak River for shippingand Navigation
Revised Final Report Page 68
CHAPTER 6
WATERWAY STUDIES & DEVELOPMENT
6.1 INTRODUCTION
In most of the countries where inland navigation is developed such as in Europe,
China, Russia etc., the waterways have been classified in different classes depending on
their physical characteristics and development potential in future. Generally, with larger
waterway dimensions bigger IWT vessels can operate resulting in lower shipping cost per
tonne of cargo as compared to the shipping cost of smaller vessels. One of the important
factors contributing to lower shipping cost by operation of bigger vessels is the
improvement in power to load ratio, i.e. capacity of cargo carrying per unit of engine
power. Hence, every waterway should be developed to larger dimensions (depth and width
of navigation channel) subject to the physical characteristics of the waterway. However, for
developing a waterway to larger dimensions (in other wards waterway of higher class)
additional investment would be required. Therefore, there would be an optimum waterway
class for a particular waterway whereby total cost to the system (i.e., increase in cost due
to development work vis-a-vis reduction in shipping cost) is minimum. This optimum
solution is required for each waterway and for this purpose classification of waterways
would facilitate planning for the optimum class of the waterway and its development.
6.2 HYDROGRAPHIC SURVEY
Hydrographic survey on river Barak was carried out from Tipaimukh to Karimganj
and the survey alignment is given in Figure 6.1. The details of survey equipment,
methodology and other observations were explained in Chapter 3 above. The single line
soundings were recorded in the deepest part of the river from Tipaimukh to Karimganj and
cross section at every 500 m intervals from Lakhipur to Bhanga. The results of the survey
and observations are used in this Chapter to perform waterway analysis.

DPR for development of Lakhipur – Bhanga stretch of Barak River for shippingand Navigation
Revised Final Report Page 69
Figure 6.1 Hydrographic survey alignment in Barak River

DPR for development of Lakhipur – Bhanga stretch of Barak River for shippingand Navigation
Revised Final Report Page 70
5.3 BARAK RIVER HYDROLOGY
Study of availability of navigational depths during different seasons in a year is
essentially required for planning waterway development. It was proposed to analyse the
historical water level and discharge data on the Barak river. The hydrological data such as
water level, discharge and sediment load observed at available gauging stations located at
Lakhipur, Annapurna Ghat (AP Ghat) and Badarpur Ghat (BP Ghat) were collected from
Central Water Commission, Water Resources Department, Govt. of Assam and other
related sources through official and other procedures.
6.3.1 Analysis of Hydrological Data
The monthly maximum and minimum water levels observed in the above
mentioned gauging stations during 2006 to 2010 were collected and presented in Table 6.1
to 6.3. Yearly maximum and minimum water levels observed in the above gauging stations
during the years 1976 to 2010 is also presented in Table 6.4 and graphically represented in
Figure 6.2 to 6.4.
Table 6.1 Monthly observed Water levels on Barak River at Lakhipur during 2006 -2010
OBSERVED WATER LEVEL DATA
Year 2006 2007 2008 2009 2010
Month Max Min Max Min Max Min Max Min Max Min
JAN 14.58 14.38 14.08 13.86 17.91 14.59 14.48 14.29 14.35 14.12
FEB 14.67 14.12 14.74 13.90 14.74 14.32 14.20 13.97 14.11 13.95
MAR 14.16 13.80 14.01 13.69 15.25 14.16 14.21 13.80 16.70 13.92
APR 14.98 13.74 17.65 13.61 15.18 13.93 15.41 13.91 21.01 14.64
MAY 21.57 13.87 21.19 14.48 15.21 13.74 14.95 13.98 22.53 16.81
JUN 24.52 17.14 25.15 15.89 22.43 14.50 19.72 14.57 - -
JUL 22.84 19.32 22.95 18.58 22.18 18.82 21.96 16.04 - -
AUG 20.14 16.71 25.14 17.70 24.20 20.38 23.30 18.41 - -
SEP 19.12 16.28 25.77 18.38 23.37 18.28 23.33 16.80 - -
OCT 19.14 15.08 22.55 16.84 21.32 16.22 21.15 15.88 - -
NOV 14.50 14.40 18.37 13.81 16.68 14.88 15.82 14.79 16.48 15.29
DEC 14.40 14.09 15.79 15.11 14.88 14.50 14.78 14.37 15.98 14.81
Source: CWC, Silchar

DPR for development of Lakhipur – Bhanga stretch of Barak River for shippingand Navigation
Revised Final Report Page 71
Table 6.2 Monthly observed Water levels on Barak River at AP Ghat during 2006-2010
OBSERVED WATER LEVEL DATA
Year 2006 2007 2008 2009 2010
Month Max Min Max Min Max Min Max Min Max Min
JAN 9.80 9.68 9.35 9.02 10.41 9.94 9.74 9.43 9.53 9.16
FEB 9.95 9.35 9.88 9.06 10.25 9.59 9.43 9.06 9.16 8.98
MAR 9.42 9.06 9.21 8.89 11.32 9.48 9.53 8.82 12.70 8.94
APR 11.80 9.01 14.22 8.79 11.20 9.40 12.28 8.41 17.73 10.27
MAY 18.09 9.31 17.70 9.90 12.55 9.35 11.07 9.38 18.45 12.97
JUN 20.64 14.19 20.84 12.39 18.17 11.48 15.22 10.65 20.69 16.34
JUL 18.90 16.16 18.95 14.86 18.16 15.93 17.39 12.20 19.38 16.56
AUG 16.80 12.75 20.62 14.09 19.85 17.26 19.48 15.42 19.50 16.18
SEP 15.31 12.32 21.37 15.50 19.58 15.13 19.06 12.93 20.34 17.76
OCT 15.04 15.49 18.40 12.47 17.40 11.90 16.88 11.47 20.45 14.65
NOV 10.48 9.74 14.03 11.17 13.10 10.32 11.48 10.06 11.92 10.57
DEC 9.70 9.37 11.13 10.32 10.30 9.75 10.04 9.54 11.28 9.86
Source: CWC, Silchar
Table 6.3 Monthly observed Water levels on Barak River at BP Ghat during 2006-2010
OBSERVED WATER LEVEL DATA
Year 2006 2007 2008 2009 2010
Month Max Min Max Min Max Min Max Min Max Min
JAN - - - - 8.13 7.78 7.70 7.39 7.27 6.87
FEB - - - - 8.07 7.47 7.38 7.02 6.86 6.73
MAR - - - - 9.17 7.35 7.27 6.86 10.60 6.57
APR - - - - 9.04 7.10 10.79 6.99 15.56 8.48
MAY - - - - 10.85 7.13 9.45 7.46 15.90 11.55
JUN - - - - 15.18 9.70 12.70 9.32 - -
JUL - - - - 15.32 13.81 14.85 10.27 - -
AUG - - - - 17.14 14.35 16.76 13.87 - -
SEP - - - - 17.04 13.09 16.05 11.01 - -
OCT - - - - 14.75 9.80 14.23 9.27 - -
NOV - - - - 10.76 8.30 9.18 7.85 10.28 10.78
DEC - - - - 8.28 7.70 7.82 7.22 9.48 7.92
Source: CWC, Silchar

DPR for development of Lakhipur – Bhanga stretch of Barak River for shippingand Navigation
Revised Final Report Page 72
Table 6.4 Yearly observed Water levels on Barak River at BP Ghat during 2006-2010
Year
Observed Water levels
Lakhipur AP Ghat BP Ghat
Max Min Max Min Max Min
1975 28.38 16.98 20.1 8.6 NA NA
1976 24.18 11.22 21.05 8.84 17.55 6.83
1977 22.36 11.04 19.78 8.69 17.07 6.56
1978 21.15 11.54 19.18 8.67 16.8 5.97
1979 23.26 10.88 20.87 8.89 17.59 5.89
1980 22.16 11.6 19.73 9.31 16.67 6.25
1981 23 11.84 20.23 9.47 17.04 6.75
1982 22.32 11.95 20.05 8.97 17.04 6.57
1983 26.06 11.86 20.64 8.86 17.44 7.01
1984 21.22 11.5 19.31 8.69 16.27 6.36
1985 24.18 11.82 21.45 9.06 18.04 6.79
1986 24.56 11.4 21.77 9.34 17.9 6.49
1987 22.08 12.16 19.47 9.47 17.05 7.09
1988 22.75 12.38 20.65 9.11 17.62 6.4
1989 25.6 11.8 21.84 8.88 18.13 6.45
1990 22.92 11.82 20.3 9.29 17.37 6.85
1991 24.46 11.6 21.57 9.25 18.17 6.85
1992 22.8 11.28 20.21 9.48 16.85 7.27
1993 22.76 10.74 20.62 9.5 18.07 7.02
1994 20.28 10.58 19.18 9.15 16.6 7.1
1995 20.4 9.85 19.64 8.58 16.72 6.58
1996 21.22 11.34 20.28 10.34 17.25 9.15
1997 22.56 10.08 21.03 9.09 17.7 7.46
1998 21.9 10.7 20.29 9.48 17.57 7.01
1999 20.8 9.7 19.76 8.74 16.87 6.83
2000 21.5 10.08 20.42 8.95 17.41 7.06
2001 22.94 11.73 20.54 8.8 17.52 6.97
2002 20.6 9.99 19.99 8.99 17.2 6.89
2003 20.8 9.85 19.81 8.93 17.23 6.85
2004 22.89 11.74 21.59 8.98 18.33 6.95
2005 22.88 11.75 19.09 9.13 16.18 7.27
2006 29.5 13.74 20.64 9.01 17.73 7.05
2007 25.77 13.61 21.37 8.79 18.48 6.71
2008 24.2 13.74 19.85 9.35 17.13 7.1
2009 23.33 13.8 19.48 11.07 16.76 6.86
2010 22.53 13.92 20.69 8.94 15.9 6.57
Source: CWC, Silchar

DPR for development of Lakhipur – Bhanga stretch of Barak River for shippingand Navigation
Revised Final Report Page 73
Figure 6.2 Water level variations in Barak River at Lakhipur
Figure 6.3 Water level variations in Barak River at AP Ghat
cu.m
/scu
.m/s
cu.m
/s

DPR for development of Lakhipur – Bhanga stretch of Barak River for shippingand Navigation
Revised Final Report Page 74
Figure 6.4 Water level variations in Barak River at AP Ghat
Based on the above water level observations, it observed that the variation of water
level between flood and lean flow period seem to be slightly on higher side. Based on the
above analysis, the following differences in water levels between maximum and minimum
values were observed for year 2006 – 2010. The result is presented in Table 6.5. From this
table, it is observed that low water levels are generally observed during Dec to March. The
water level in the river varies by an average of 11 m over a year from lean season to flood
season.
Table 6.5 Difference in Maximum and Minimum Water level observed
Location LakhipurA.P.Ghat(Silchar)
B.P.Ghat(Badarpur)
Maximum Water level 25.77 21.37 17.14
Minimum Water level 13.61 8.41 6.57
Difference 12.16 m 12.96 m 10.57 m

DPR for development of Lakhipur – Bhanga stretch of Barak River for shippingand Navigation
Revised Final Report Page 75
6.3.2 Analysis of Discharge Data
The yearly maximum and minimum discharge observed in the above mentioned
gauging stations during 1975 to 2000 were collected and presented in Table 6.6 to 6.8 and
graphically represented in Figure 6.5 to 6.7. From the discharge table, it was observed that
lean discharge of 21.17 m3/s at Lakhipur, 41 m3/s at AP Ghat and 47.93 m3/s at BP Ghat
were measured at gauging stations. This tendency of the water levels and discharges
during lean season are particularly important for planning the waterway development and
designing the IWT terminal facilities.
Table 6.6 Statement of Yearly Maximum and Minimum Discharge at Lakhipur
STATEMENT OF MAXIMUM & MINIMUM DISCHARGE
River: Barak SUB-DIVISION: Badarpur Inv. (F.C.) Sub-Div., Badarpur.
SITE: Lakhipur DIVISION: Cachar Investigation Division, Badarpur.
Year Max.Discharge (m3/s) DATE Min.Discharge (m3/s) DATE
1975 2362.84 28/7/75 87.73 12/4/75
1976 2156.14 25/7/76 211.54 3/3/76
1977 1825 4/7/77 359 26/12/77
1978 1430 5/8/78 317 24/3/78
1979 2641 14/9/79 92 23/11/79
1980 1724 27/6/80 45.3 23/2/80
1981 3084 10/9/81 123 31/12/81
1982 1847.35 5/7/82 109 18/2/82
1983 2064.15 20/6/83 98.69 19/2/83
1984 1928.94 30/6/84 56.4 3/4/84
1985 2522.87 21/6/85 82.14 16/3/85
1986 1750.28 11/10/86 96.75 24/2/86
1987 1968.72 7/9/87 74.59 3/4/87
1988 4302.13 21/8/88 159.99 16/2/88
1989 4799.68 10/8/89 121.81 20/3/89
1990 1363.58 13/7/90 85.57 5/2/90
1991 1836.52 11/5/91 88.58 29/3/91
1992 692.02 12/9/92 69.05 30/11/92
1993 2380.04 24/7/93 66.02 31/12/93
1994 507.74 16/8/94 31.69 31/12/94
1995 589.41 15/8/95 21.17 15/2/95
1996 860.54 18/8/96 83.59 26/10/96
1997 932.6 13/8/97 42.36 3/5/97
1998 966.21 10/6/98 88.2 30/12/98
1999 880.8 17/7/99 62.93 14/3/99
2000 916 9/9/2000 50.8 5/4/2000

DPR for development of Lakhipur – Bhanga stretch of Barak River for shippingand Navigation
Revised Final Report Page 76
Table 6.7 Statement of Yearly Maximum and Minimum Discharge at A.P.Ghat
STATEMENT OF MAXIMUM & MINIMUM DISCHARGE
River: Barak SUB-DIVISION: Badarpur Inv. (F.C.) Sub-Div., Badarpur.
SITE: A.P. Ghat DIVISION: Cachar Investigation Division, Badarpur.
Unit in cubic meter/Sec.
Year Max.Discharge DATE Min.Discharge DATE
1975 NA NA NA NA
1976 6165.89 15/6/76 86.93 28/2/76
1977 3743.7 28/6/77 97.23 28/3/77
1978 2320 5/8/78 85.54 18/4/78
1979 3583.78 13/9/78 82.41 29/4/79
1980 2786.9 8/6/80 123.33 31/12/80
1981 3229 9/9/81 82 31/12/81
1982 2559 6/7/82 90 1/1/82
1983 4143 30/8/83 41 6/1/83
1984 2829 20/5/84 58 1/4/84
1985 3391.77 20/6/85 86.1 16/3/85
1986 3417.82 10/10/86 66.41 28/3/86
1987 3107 31/7/87 120 31/12/87
1988 5279.78 21/8/88 770 11/4/88
1989 6282.64 2/8/89 84.75 22/3/89
1990 5012.06 18/8/90 93.44 22/3/90
1991 5801.95 10/5/91 106.7 25/3/91
1992 4721.14 17/10/92 141.71 18/3/92
1993 5244.63 23/7/93 135.4 14/2/93
1994 3363.15 16/8/94 103.43 7/3/94
1995 3075.45 15/8/95 88.09 29/3/95
1996 4335.45 18/8/96 44.01 1/5/96
1997 4821.45 13/7/97 129.44 3/5/97
1998 4010.01 27/8/98 180.2 17/2/98
1999 3551.02 18/7/99 105.51 2/5/99
2000 3766.46 9/9/2k 105.38 1/3/2k
2001 3341.56 8/6/01 105.33 28/4/01
2002 3219.5 16/8/02 106.73 26/3/02
2003 3179.67 14/6/03 114.94 12/04/03
2004 3788.4 22/7/04 114.52 10/3/04
2005 2765.75 28/8/05 131.44 5/3/05
2006 3770.4 14/06/06 122.25 3/4/06
2007 3763.9 11/9/07 105.59 19/3/07
2008 3038.1 1/9/08 115.22 4/5/08
Source: Brahmaputra Board, Guwahati
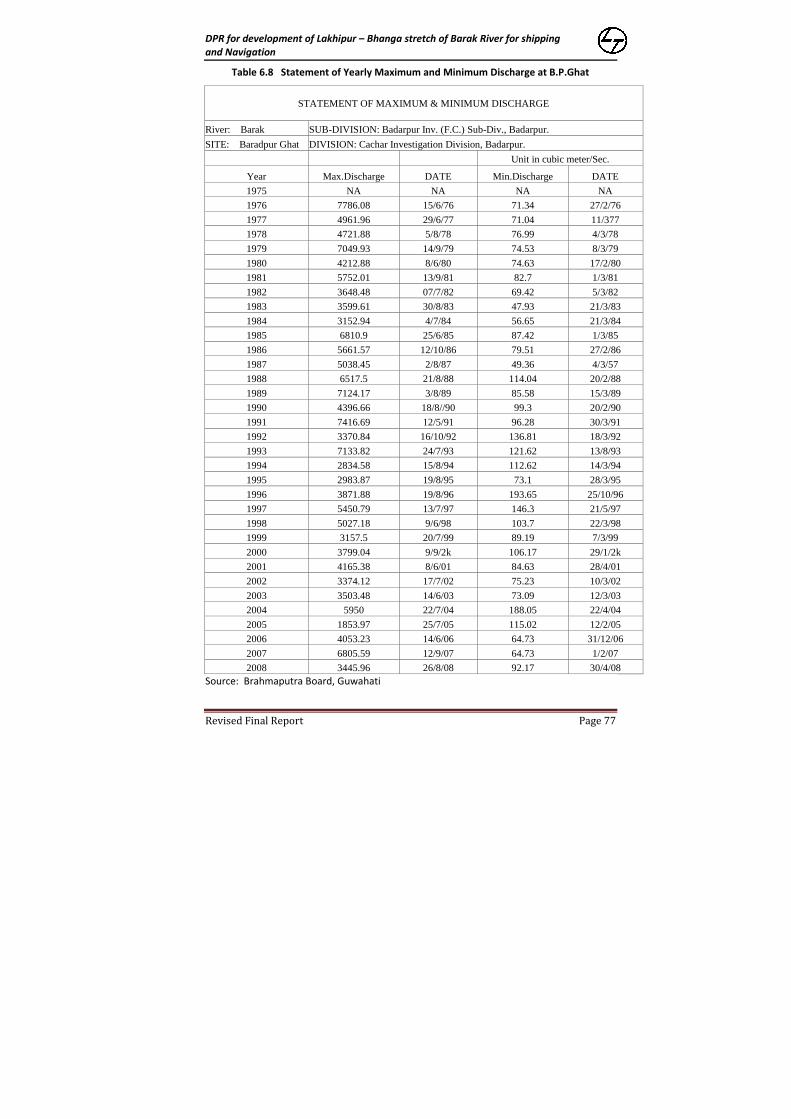
DPR for development of Lakhipur – Bhanga stretch of Barak River for shippingand Navigation
Revised Final Report Page 77
Table 6.8 Statement of Yearly Maximum and Minimum Discharge at B.P.Ghat
STATEMENT OF MAXIMUM & MINIMUM DISCHARGE
River: Barak SUB-DIVISION: Badarpur Inv. (F.C.) Sub-Div., Badarpur.
SITE: Baradpur Ghat DIVISION: Cachar Investigation Division, Badarpur.
Unit in cubic meter/Sec.
Year Max.Discharge DATE Min.Discharge DATE
1975 NA NA NA NA
1976 7786.08 15/6/76 71.34 27/2/76
1977 4961.96 29/6/77 71.04 11/377
1978 4721.88 5/8/78 76.99 4/3/78
1979 7049.93 14/9/79 74.53 8/3/79
1980 4212.88 8/6/80 74.63 17/2/80
1981 5752.01 13/9/81 82.7 1/3/81
1982 3648.48 07/7/82 69.42 5/3/82
1983 3599.61 30/8/83 47.93 21/3/83
1984 3152.94 4/7/84 56.65 21/3/84
1985 6810.9 25/6/85 87.42 1/3/85
1986 5661.57 12/10/86 79.51 27/2/86
1987 5038.45 2/8/87 49.36 4/3/57
1988 6517.5 21/8/88 114.04 20/2/88
1989 7124.17 3/8/89 85.58 15/3/89
1990 4396.66 18/8//90 99.3 20/2/90
1991 7416.69 12/5/91 96.28 30/3/91
1992 3370.84 16/10/92 136.81 18/3/92
1993 7133.82 24/7/93 121.62 13/8/93
1994 2834.58 15/8/94 112.62 14/3/94
1995 2983.87 19/8/95 73.1 28/3/95
1996 3871.88 19/8/96 193.65 25/10/96
1997 5450.79 13/7/97 146.3 21/5/97
1998 5027.18 9/6/98 103.7 22/3/98
1999 3157.5 20/7/99 89.19 7/3/99
2000 3799.04 9/9/2k 106.17 29/1/2k
2001 4165.38 8/6/01 84.63 28/4/01
2002 3374.12 17/7/02 75.23 10/3/02
2003 3503.48 14/6/03 73.09 12/3/03
2004 5950 22/7/04 188.05 22/4/04
2005 1853.97 25/7/05 115.02 12/2/05
2006 4053.23 14/6/06 64.73 31/12/06
2007 6805.59 12/9/07 64.73 1/2/07
2008 3445.96 26/8/08 92.17 30/4/08
Source: Brahmaputra Board, Guwahati

DPR for development of Lakhipur – Bhanga stretch of Barak River for shippingand Navigation
Revised Final Report Page 78
0
1000
2000
3000
4000
5000
6000
Max. Discharge
Min Discharge
Figure 6.6 Graph showing Discharge variation in Barak River at Lakhipur
Figure 6.6 Graph showing Discharge variation in Barak River at A.P.Ghat

DPR for development of Lakhipur – Bhanga stretch of Barak River for shippingand Navigation
Revised Final Report Page 79
Figure 6.7 Graph showing Discharge variation in Barak River at B.P.Ghat
Minimum Discharge Requirement
Considering the above minimum discharge available during the lean flow season,
the discharge available for 40 m x 1.6 m dredged channel was estimated. The lean
discharge of 21.17 m3/s at Lakhipur was compared with the actual discharge required for
the dredged channel and the calculations are given below:
Actual discharge available = 21.17 m3/s
Design discharge required = 31.3 m3/s
Hence required discharge for maintaining 1.6 LAD may not be available at Lakhipur
to Silchar reach during lean season. This analysis required to be performed based on daily
observed discharge at Lakhipur during detail engineering. The discharge from tributaries of
Barak river downstream of Lakhipur to Silchar need to be observed on daily basis and the
same is required to be analysed for checking the discharge availability for maintaining 1.6
m LAD during lean season.

DPR for development of Lakhipur – Bhanga stretch of Barak River for shippingand Navigation
Revised Final Report Page 80
Water carring capacity of dredged section (for Lakhipur – Silchar Stretch)
Consider the discharge
Discharge Q = 21.7cum/s
Type of channelNaturalstream
Manning's coefficient n = 0.025
Bed width B = 40m
Side slope (1v:nH) 5
Depth of flow 1.600m
Bed Elevation 0.000m
Water surfaceElevation 1.600m
Area of flow 76.800sqm
Wetted perimeter 56.317m
Hydraulic meandepth 1.364m
Bed slope 0.00007 1 in 14500
Q =1/nAR2/3 s1/2 31.373cum/s > 21.7
Difference in actual & estimateddischarge -9.673cum/s
Velocity of flow v = 0.408m/s
The lean discharge of 41 m3/s at AP Ghat was compared with the actual discharge
required for the dredged channel and the calculations are given below:
Actual discharge available = 41 m3/s
Design discharge required = 24.75 m3/s

DPR for development of Lakhipur – Bhanga stretch of Barak River for shippingand Navigation
Revised Final Report Page 81
Hence required discharge for maintaininag 1.6 LAD is available at Silchar to Bhanga
reach throughout the year. The calculation carried out for the same is presented below.
Water carring capacity of dredged section ( from Silchar to Bhanga stretch)Considering the discharge
Dischare Q = 41 Cum/s
Type ofchannel
Naturalstream
Manning'scoefficient n = 0.025
Bed width B = 40 m
Side slope(1v:nH) 5
Depth offlow 1.600 m
BedElevation 0.000 m
Water surfaceElevation 1.600 m
Area offlow 76.800 sqm
Wettedperimeter 56.317 m
Hydraulic meandepth 1.364 m
Bed slope 0.00004 1 in 23288
Q =1/nAR2/3 s1/2 24.755 cum/s < 41Difference in actual & estimateddischarge 16.245 cum/s
Velocityof flow v = 0.322 m/s
B1

DPR for development of Lakhipur – Bhanga stretch of Barak River for shippingand Navigation
Revised Final Report Page 82
6.3.3 Depths for Navigation
The reduced depths below the Chart datum were used to assess the navigation
depths and discussed in Chapter 3. These reduced depths below chart datum indicate that
these depths would be ensured even during dry season on long term basis.
6.4 WATERWAY DEVELOPMENT
The classification of waterways by Inland Waterway Authority of India is discussed
below:
Class I : Waterways with navigable channel of minimum depth 1.2 m, bottom width 30 m
(in case of rivers) and depth 1.5 m, bottom width 20 m (in case of canals) with minimum
radius at bends 300 m, minimum vertical clearance 4 m, and horizontal clearance between
piers 30 m, (in case of rivers) and 20 m, (in case of canals).
Class II: Waterways with navigable channel of minimum depth 1.4 m, bottom width 40 m,
(in case of rivers) and depth1.8 m, bottom width 30 m, (in case of canals) with minimum
radius at bends` 500m, in minimum vertical clearance 5 m, and horizontal clearance
between piers 40 m, (in case of rivers) and 30 m, (in case of canals).
Class III: Waterways with navigable channel of minimum depth 1.7m, bottom. Width 50,
m,_(incase of rivers) and depth 2.2 m bottom width 40 m, (in case of canals) with minimum
radius at bends 700m minimum. vertical clearance 7 m, and horizontal clearance between
piers 50 m, (in case of rivers) and 40 m, (in case of canals).
Class IV: Waterways with navigable channel of minimum depth 42.0 m, bottom width 50
m, (incase of rivers) and depth 2.5m, bottom width 50 m, (in case of canals) with minimum
radius at bends 800m, minimum vertical clearance 10 m, and horizontal clearance between
piers 50 m, (in case of rivers) and 50 m, (in case of canals).

DPR for development of Lakhipur – Bhanga stretch of Barak River for shippingand Navigation
Revised Final Report Page 83
Class IV (A): Waterways on rivers only with navigable channel of minimum depth 2.0 m,
bottom width 80 m, with minimum radius at bends 800 m, minimum vertical clearance 10
m, and horizontal clearance between piers 80 m.
Class V: Waterways with navigable channel of minimum depth 2.75m, bottom width 60 m,
(in case of rivers) and depth 3.5 m bottom width 60 m, (in case at canals) with minimum
radius at bends 900m, minimum vertical clearance 10 m, and horizontal clearance between
piers 60 m, (both in case of rivers and canals).
Class V (A): Waterways on rivers only with navigable channel of minimum depth 2.75 m,
bottom width 100 m, with minimum radius of bends 900 m, minimurrm vertical clearance
10 m, and horizontal clearance between piers 100 m.
On all the above cases:
a) Minimum depth of channel should be available for 95% of year.
b) Vertical clearance over the waterway should be available in at least central 75%
portion of each of the spans in entire width of the waterway during lean season.
The present classification of Inland Waterways in India by Inland Waterways Authority
of India is shown below in Table 6.9.

DPR for development of Lakhipur – Bhanga stretch of Barak River for shippingand Navigation
Revised Final Report Page 84
Table 6.9 Classification of Inland Waterways in India
Classificat.Of
Waterway
Tonnage(DWT) ofSPV (T)
Barge Units Minimum Dimensions of Navigational Radiusat Bend
(m)channel in lean season
Dimension ofsingle Barge
(LxBxD)(m)
Dimension ofBarge units
(LxBxD)(m)
Tonnageof Barge
units(DWT)
(T)
Rivers Canals
Depth(m)
Bottom.width
(m)
Depth(m)
Bottomwidth(m.)
I 100 32 x 5 x1.0 80x5x1.0 200 1.2 30 1.5 20 300
II 300 45x8x1.2 110 x 8 x 1.2 600 1.4 40 1.8 30 500
III 500 58 x 9 x1.5 141 x 9 x 1.5 1000 1.7 50 2.2 40 700
IV 1000 70x12.x1.8 170 x.12x1:8. 2000 2.0 50 2.5 50 800
V 1000 70 x 12 x1.8 170 x 24 x1.8 4000 2.0 80 800
VI 2000 86 x 14 x2.5 210 x 28 x 2.5 4000 2.75 60 3.5 60 900
Vll 2000 86 x 14 x2.5 210 x 28 x 2.5 8000 2.75 100 _ 900
Based on the study explained in Section 5.4 of Chapter 5 above and further to the
recommended classification of waterways by IWAI as per Table 6.9, the development of
waterway between the stretch from Lakhipur to Bhanga in River Barak is classified under
Class II Waterway.
6.4.1 Minimum clearance for cross structures
The vertical clearance of a bridge or any other cross structure comprises of the
height of the fixed points of an empty vessel (air draught above the Navigational High
Water Level (NHWL) plus overhead tolerance. The overhead tolerance is closely related to
the safety of the vessel passing through such structures and is determined by several
factors such as the wave variation, draught variation caused by vessels motion, back water
caused by piers, the errors of observed water level and vessel's draught etc.

DPR for development of Lakhipur – Bhanga stretch of Barak River for shippingand Navigation
Revised Final Report Page 85
Generally recommended overhead tolerances are:
For rivers in plains:
0.3 m for 100 / 300 T vessel
0.5 m for 500 11000 T vessel
1.0/1.5 m for 2000/3000 T vessel
For rivers in hilly:
0.5 m for 100/300 T vessel
And mountainous areas:
1.0 / 1.5 m for 500/3000 T vessel
For cross-structures like bridges, the horizontal clearance between piers have been
kept same as bottom width of the channel for river/canal to permit unhindered two-way
navigation.
For fixing vertical clearance, the calculation of Navigational High Water Level
(NHWL) is an important factor so as to reduce the cost of cross-structures without causing
unacceptable effect to the shipping operation. This has been defined as under:
Rivers: Highest flood level at a frequency of 5% in any year over a period of last twenty
years
Canals: The designed full supply level
As per Chinese Standards, minimum clearance of 11 m has been specified for
Waterway of 2000 tons capacity. However, in European classification, the minimum
specified vertical clearance is 9.1 m. IWAI / MOST have specified a clearance of 10.0 m for
1000 T/2000 T vessel; 7 m for 500 T vessel and 5 m for 300 T vessel.
6.5 FAIRWAY DESIGN
The basic parameters considered for the fairway design are:
Depth
Width
Side slopes
Bends

DPR for development of Lakhipur – Bhanga stretch of Barak River for shippingand Navigation
Revised Final Report Page 86
As explained above, as the classification of waterways in India is based on the
experience gained in various waterways, the characteristic features of the design
waterways based on studies carried out by IWAI are furnished below:
6.5.1 Depth of a Channel
The fairway depth should be good enough to ensure steerability of the vessel and to
prevent bottom feel. To meet this requirement, the minimum depth that is needed in a
channel would commonly be the sum of the draught (draft) of the vessel and other
tolerance factors. The tolerance factors to be considered are listed as:
Factor of keel clearance to avoid touching of the vessel to the ground and minimum
free water below the keel for maintaining control on maneuvering,
Wave tolerance for the heaving and pitching of the vessel due to wave motion,
Squat, increase of draft due to ship motion,
Tolerance for siltation and dredging,
Increase of draught due to trim and heaving due to unequal loading and steering
maneuver respectively, and
Tolerance for the change of draught during the transition from salt water to fresh
water.
The keel clearance factor is the prime concern of the all tolerance factors
considered. As per the standards laid down by German Code of practice (EAU 80), a 0.3 m
layer of water column below the keel of the loaded ship is sufficient for free
maneuverability of the vessel.
IWAI’s experience in inland waterways in India and sub-continent (Bangladesh and
Myanmar) shows that the under keel clearance for free maneuverability of the vessel varies
between 0.2 and 0.5 m depending upon the soil characteristics of the channel bed and
other parameters.

DPR for development of Lakhipur – Bhanga stretch of Barak River for shippingand Navigation
Revised Final Report Page 87
6.5.2 Width of a Channel
The total width of a navigation waterway (W) in general is expressed in terms of a
beam of a vessel (B). The design width for the proposed two-way navigation can be
obtained as:
W = BM+BM1 + C+2C1
Where
W = Navigation channel width for two-way navigation.
BM = Maneuvering zone for the design vessel which takes into account the
directional stability of vessel.
BMI = Maneuvering zone for the upcoming vessel which takes into account the
directional stability of vessel.
C = Width of separating zone.
CI = Width of the security area, between the maneuvering zone and the channel
side which is accounted for environmental and human factors including bank
suction.
Values recommended by various authorities for the above equation vary within
wide limits. Some of the recommended values are presented here:
BM = 1.3 B to 3.0 B
BM = BM1
C = 0.5 B to 1.0 B
C1 = 0.3 B to 1.5 B
Where B = Beam of a design vessel.
Based on the experience and recommendations of experts on Inland Waterways,
the factors considered for the present design are:

DPR for development of Lakhipur – Bhanga stretch of Barak River for shippingand Navigation
Revised Final Report Page 88
BM = 1.4 B
BM = BM1
C = 0.5 B
C1 = 0.5 B
The designed channel width = 1.8B+1.8B+0.5B+2x0.5B for two way navigation at
draft level = 5.1B. The bottom width of the channel for two-way navigation for the design
vessel can generally be considered as 5 x B
6.5.3 Slopes
The selection of slope is in accordance with the soil characteristics of the bed and
banks, width of the waterway etc. The adopted channel slope is 1:5
6.5.4 Width Allowance at Bends
In bends, the width of the fairway should be more than the width of the canal that
is designed for a straight reach to allow for a drift of the vessel in a curved portion of the
waterway. It means that the vessel occupies a greater width in bends than in a straight
stretch of the waterway. The drift of the vessel depends on the radius of the bend, the
speed of the vessel, wind forces, the flow pattern and the loading of the vessel.
The drift angle is larger for vessels traveling in the downstream than the upstream
direction. The drift angle is inversely proportional to the bend radius 'R', that is, the larger
the radius the smaller the value of drift angle. Unloaded ships normally subjected to more
drift and consequently take up a greater width in bends than loaded ships and therefore
the proposed allowance at the keel level of the unloaded ships is larger than the loaded
ships.
The guidelines for width allowance in bends proposed by Delft Hydraulics are
described in Table 6.10.

DPR for development of Lakhipur – Bhanga stretch of Barak River for shippingand Navigation
Revised Final Report Page 89
Table. 6.10 Guideline for width allowance at bends
Quality of the
cross-section
Minimum radius
permitted
At keel level of up
going loaded ship
At keel level of
down coming
unloaded ship.
Normal cross-
section
R/L = 6 0.5 L2 / R L2 / R
Narrow cross-
section
R/L = 4 0.5 L2 / R L2 / R
The norms for desirable bend radius as per Dutch guidelines are 4 L for narrow and
one-way sections and 6L for normal section (L - overall length of barge unit). The Chinese
norms for minimum bend radii are in the range of 4L to 5L. The proposed bend radii for the
present waterway are 5L.
The minimum radius of the adopted bend is 350 m. Wherever the radius of the
bend is less than 5 times of the length of the designed vessel i.e. 5x62.8 = 314, additional
widths are provided for free maneuverability of the vessel. The additional width provided in
the present fairway system for a designed vessel is:
Δ b = L2 / R = 62.82 / 314 = 12.56 m
As per the design criteria discussed above the channel dimensions for the proposed
waterway is presented in Table 5.11. It is proposed to fix the channel with 40 m base width
and side slope of 1:5 with LAD of 1.6 m. At bends, the proposed channel width would be 60
m with side slope of 1:5.

DPR for development of Lakhipur – Bhanga stretch of Barak River for shippingand Navigation
Revised Final Report Page 90
Table 6.11 Design channel dimension for various capacities of vessels
Channel 600 tons vessel 300 tons vessel 100 tons vesselBottom width 40 m 40 m 25 m
Depth below CD 2.0m 1.6m 1.2m
Side slopes 1:5 1:5 1:5
6.5.5 Dredging of Navigational Channel
The dredging quantities for the above design channel have been worked out based
on the bathymetric surveys carried out. The dredging quantities for the proposed 40 m
channel and 60 m channel at bends with side slope of 1:5 was worked out. The dredging
quantity was worked out with manual calculation as well as by software. Table 6.12
presents the dredging quantity for the proposed navigation channel in Barak River.
Table 6.12 Dredging Quantity for the proposed navigational channel
The dredging quantity was estimated using HyPack using the actual reduced
soundings as per CD. The centre line of the channel was considered as per the Longitudinal
sounding lines observed during the Thalweg survey connecting deepest part of the
navigational channel. Proper adjustments were carried out to fit the channel suitably in
such a way that dredging quantity shall be minimum using the deeper parts of the channel.
Due consideration was given for shoals identified during the survey. The sample
calcuations and results obtained for dredging estimation is presented below and in Table
6.13 and 6.14.
Sl.No Channel Dimenstion Dredging Quantity
1 Bottom Width = 40 m
Bottom width at bends = 60 m
LAD considered = 1.6 m
Side Slope = 1 in 5
2.6 Million m3

DPR for development of Lakhipur – Bhanga stretch of Barak River for shippingand Navigation
Revised Final Report Page 91
Figure 6.8 Sample Results of Dredging Calculation

DPR for development of Lakhipur – Bhanga stretch of Barak River for shippingand Navigation
Revised Final Report Page 92
Table 6.13 Detailed Breakup of Estimated Dredging Quantity
DETAILED BREAK UP OF DREDGING REQUIREMENT FOR LAKHIPUR TO BHANGA STRETHOF BARAK RIVER
SL.NO STRETCH AND CHAINAGE DETAILSQUANTITY(in cu.m)
QUANTITY(in Lakh
cu.m)
Implemen-tation
1 Lakhipur to Chirimukh (Ch: 0 to 10 km) 181320 1.81
Phase II
2 Chirimukh to Nandpur ( Ch: 0 to 20 km) 192001 1.92
3 Nandpur to Dhamali ( Ch: 20 to 30 km) 126080 1.26
4 Dhamali to Berenga(Ch: 30 to 40 km) 145552 1.46
5 Berenga to Silchar Bridge ( Ch: 40 to 50 km) 249931 2.50
6Silchar Bridge to Masimpur ( Ch: 50 to 60km) 239886 2.40
Phase I
7 Masimpur to Chandpur (Ch: 60 to 70 km) 254658 2.55
8 Chandpur to Raypur ( Ch: 70 to 80 km) 271927 2.72
9 Raypur to Ganirgram (Ch: 80 to 90 km) 252078 2.52
10 Ganirgram to Sripur ( Ch: 90 to 100 km) 276333 2.76
11Sripur to Badarpur Ghat (Ch: 100 to 110km) 198342 1.98
12Badarpur Ghat to Bhanga (Ch: 110 to 121km) 234898 2.35
Total (Rounded Off) 2623004 26.23
Table 6.14 Breakup of Estimated Dredging Quantity for Barak River Stretch
Sl.No
River StretchLength
(km)LAD (m)
BottomWidth ofChannel(m) with
side slope1 in 5
DredgingQuantity
( cum)
Cost( at Rs.
250/cum)
Cost inCr.
Numberof Shoalsobserved
(BothMajor &Minor)
1Lakhipur -Silchar 52 1.6 40 m 894883.26 223720815 22
11
2Silchar -Badarpur 58 1.6 40 m 1294879.85 323719963 32 17
3Badarpur toBhanga 11 1.6 40 m 433341.90 108335475 11 3
TOTAL 121 2623105.01 655776253 65 31

DPR for development of Lakhipur – Bhanga stretch of Barak River for shippingand Navigation
Revised Final Report Page 93
6.5.6 Selection of dredging equipment
The capital dredging is usually carried out with a cutter-suction dredger whereas
maintenance dredging will be carried out with a trailing suction hopper dredger. There. are
various types of dredgers available in the market viz., suction dredger, bucket dredger, grab
dredger, backhoe / dipper dredger, water injection dredger, pneumatic dredger etc. While
most of these dredgers are ideally suit for sea conditions to dredge harbour and approach
channels, the selection of a dredger for inland waterway is rather critical due to various
mobility factors, seasonal variation of water levels (floods/dry season) and shallow depths.
The cutter suction dredgers having conventional centrifugal pumps or modern jet
pumps will be more effective to dredge out the material. In a cutter-suction dredger or
CSD, the suction tube has a cutter head at the suction inlet, to loosen the bed and transport
it to the suction mouth. The cutter can also be used for hard consolidated type of bed. The
dredged soil is usually sucked up by a wear resistant centrifugal pump and discharged
through a pipe line or to barge.
Alternately the modern amphibious cutter suction dredger is also suitable for the
Barak waterway. The amphibious dredger can be road transportable, able to unload itself
from the truck/lorry and can dredge rivers/canals having depths of 2.0 to 3.0 m. These
dredgers can walk into the river and even in dry .portions of the river during lean period.
The dredgers can also be disassembled for transportation to other locations. These
dredgers are indigenously available in India. Specifications of typical dredging equipment
suitable to the Barak waterway are indicated below:
• Length overall 20 m• Width 4.1 m• Dredging depth 6m• Suction pipe 325 mm• Discharge pipe 300 mm• Installed capacity 350 kw• Cutter power 50 kw• H.P 500 BHP• Draft 1 m• Rated output with 500 m pipe line 200 cu m / hour

DPR for development of Lakhipur – Bhanga stretch of Barak River for shippingand Navigation
Revised Final Report Page 94
The low draft amphibious dredgers with bucket arrangement to remove the
material are also ideally suitable. Specifications of typical amphibious bucket dredger are
given below:
• Length overall 9.5 m• Beam 2.5 m• Dredging depth 2.75 m over stern• Draft 0.5 m• Weight 7.5 MT• BHP 63 BHP• Reach 7 m• Bucket capacity 200 litres.
In the case of bucket dredger, hopper tugs/barges are required to transport the
material to disposal grounds. The type of dredging effort (either floating or mobile shore
based) will, however, depend on the detailed investigations on the availability of
indigenous equipment, disposal area, and environmental impact.
6.6 AIDS TO NAVIGATION
The navigation channel goes on shifting due to changes in river morphology
depending on season with untrained river like Barak. On this kind of waterway, one of main
problem is safety and ease of traffic. This can be achieved by providing proper marking to
indicate where it is safe to navigate and where shallows, snags etc., exist. The channel
marking is also very important for the safety and speed of navigation since the current
velocity is much lower in the inner bends of a curved channel than the outer bend. If
proper markings are provided, ships/vessel sailing upstream will take the inner bends with
relatively less head current, thus making better speed. The ship sailing downstream in the
outer bend will get the advantage of current. The main approach of the problem of making
of shifting nature of navigable channel is to have the simple marks which could be shifted
easily with less manpower and equipment.
As per the international convention, the aids to navigation are a device external to a
craft, designed to assist in determination of position of the craft or a safe course or to warn
of dangers. Whereas, navigational aids are the equipment on board a ship.

DPR for development of Lakhipur – Bhanga stretch of Barak River for shippingand Navigation
Revised Final Report Page 95
6.6.1 Proposed aids to navigation system on river Barak
The system and different type of navigation marks proposed are given as follows:
Lateral marks, to mark the left and right sides of the navigation route to be followed
by navigator.
Bifurcation marks, to mark the middle ground between the navigation channel,
bifurcated channel and isolated dangers in the middle of the navigational channel.
Shore marks
Bank wise marks, to indicate the channel at point where it approaches a
bank.
Crossing marks, to indicated crossing and alignment of the channel from one
bank to another
Marks of prohibited areas, to indicate no permission of entry.
Sound signal marks, to indicate use of horning or other sound signals.
Marks for traffic control, to control up bound or down bound vessel in one way or
sequence passage or to prohibit navigation.
Marks on bridges, to indicate the passage through bridges.
Depth indicator marks, to indicate shallow areas ahead in the navigation channel.
Width indicator marks, to indicate the narrow stretches ahead in the navigational
channel.
River training marks, to indicate the ongoing river training works in the river to the
navigators.
The terms used as left and right shall respectively mean to the left and to the right
of an observer facing downstream.
The typical schematic sketches of the aids to navigation/navigational marks
proposed to be erected in river Barak can be seen in the following figures.
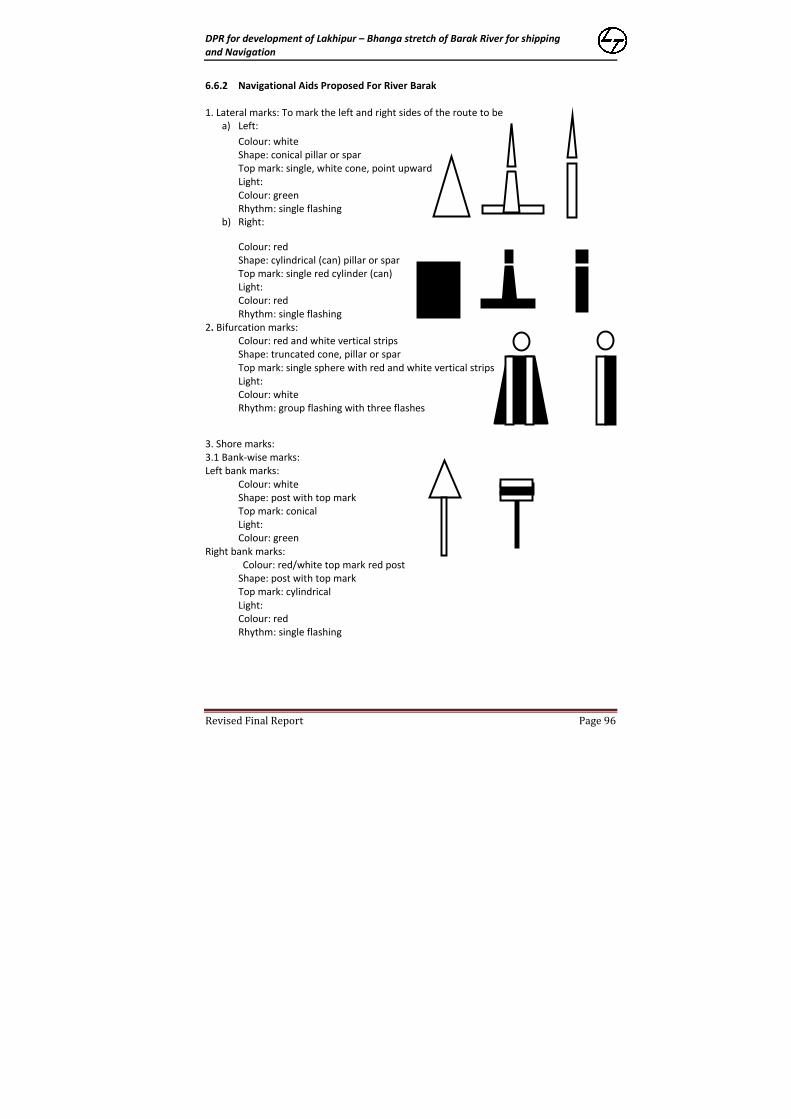
DPR for development of Lakhipur – Bhanga stretch of Barak River for shippingand Navigation
Revised Final Report Page 96
6.6.2 Navigational Aids Proposed For River Barak
1. Lateral marks: To mark the left and right sides of the route to bea) Left:
Colour: whiteShape: conical pillar or sparTop mark: single, white cone, point upwardLight:Colour: greenRhythm: single flashing
b) Right:
Colour: redShape: cylindrical (can) pillar or sparTop mark: single red cylinder (can)Light:Colour: redRhythm: single flashing
2. Bifurcation marks:Colour: red and white vertical stripsShape: truncated cone, pillar or sparTop mark: single sphere with red and white vertical stripsLight:Colour: whiteRhythm: group flashing with three flashes
3. Shore marks:3.1 Bank-wise marks:Left bank marks:
Colour: whiteShape: post with top markTop mark: conicalLight:Colour: green
Right bank marks:Colour: red/white top mark red post
Shape: post with top markTop mark: cylindricalLight:Colour: redRhythm: single flashing

DPR for development of Lakhipur – Bhanga stretch of Barak River for shippingand Navigation
Revised Final Report Page 97
4. Crossing marks:
To indicate crossing & alignment of the channel from one bank another.Left bank:
Colour: white top mark, black post.Shape: post with top markTop mark: two squares facing upstream & downstreamLight:Colour: whiteRhythm: Morse code “A”
Right bank:Colour: red top mark, red/white post.
Shape: post with top markTop mark: two squares facing upstream & downstreamLight:Colour: whiteRhythm: Morse code “N”
5. Marks of prohibited areas: To indicate no permission of entry.Colour: white with red border and slant,
hape: circularLight:
Colour: green
Rhythm: quick flashing light.6 Marks on bridges: TO indicated passage through bridges.
No pass pass7. Sound signal marks: To indicated use of horning or other sound signal.
Colour: white board with black horn figure.Shape: hexagonLight:Colour: greenRhythm: quick flashing light.

DPR for development of Lakhipur – Bhanga stretch of Barak River for shippingand Navigation
Revised Final Report Page 98
8. Marks for traffic control: TO up bound or down bound vessels in one way or sequentialpassage or to prohibit navigations. In one way or sequential passage navigations.
up bound down bound
9. Depth indication marks:To indicate the shallow areas or whereDepth of water limited
Depth of water limited
10. Width indicator marks: TO indicate the areas where theWidth of channel Limited

DPR for development of Lakhipur – Bhanga stretch of Barak River for shippingand Navigation
Revised Final Report Page 99
11. River training marks: To indicate the areas where
The river training worksViz. Bandallling etc.
Are in progress to the navigator.
These aids to navigation are to be provided along the river at various locations as per detailengineering study.
Shoals/sand chars:
The aids to navigation have to be provided at various shoals present in river Barak
which creates hazards to safe navigation to vessel/ship plying in the river. The details of
some prominent shoals that are encountered during navigation in the navigation channel of
river have to be property marked for early warning to the navigator are listed in the
Chapter 3.

DPR for development of Lakhipur – Bhanga stretch of Barak River for shippingand Navigation
Revised Final Report Page 100
CHAPTER 7
TERMINAL PLANNING
7.1 MASTER PLAN AND DESIGN OF IWT TERMINAL
The terminal planning and design includes selection of suitable sites in the vicinity
of cargo potential considering all the relevant technical variables such as choosing the type
of berthing facility and providing of covered/open storage facility, cargo handling systems
and other ancillary facilities required for efficient terminal operation. Based on the
projected traffic, the selection of various facilities was planned. The cost estimate
including capital and operating costs was planned for each of the proposed system
considering the design. These above aspects are briefly explained in the following
subsequent sections.
7.2 PLANNING CONSIDERATIONS
The terminal facilities proposed for this project shall include the following:
(i) Berthing Facilities for vessels
(ii) Cargo Storage Facilities
(iii) Cargo Handling Facilities
(iv) Other ancillary Facilities
7.2.1 Terminal Facilities
The type of cargo handling system required at the terminal is generally dependant
on the type of cargo, the annual volume required to be handled and the size of the vessels.
The various type of cargo foreseen to be handled at the proposed IWT Terminals are
primarily grouped into:
(i) Incoming Cargo, and
(ii) Outgoing Cargo.

DPR for development of Lakhipur – Bhanga stretch of Barak River for shippingand Navigation
Revised Final Report Page 101
These above two groups are further subdivided into bulk, bagged and other
miscellaneous general cargo for the purpose of planning the cargo handling equipment.
The quantum and other cargo compositions are finalised based on the traffic study carried
out and described in the above chapters. The same are classified as below:
Bulk Cargo - Construction materials such as Sand, stone, bricks, Marble, Iron steel,
Machinery – Light, Heavy and ODC, Mineral Ore such as coal, lime stone, iron, fly
ash, copper ore etc., bamboo, etc.
Bagged Cargo - Cement, Fertilizer, wine and beverages, acids, cereals, cash crops,
wheat, rice, Bajra, gram, pulses, cotton, etc.
Misc. General Cargo – Consumer goods, animals, oil cake, edible oil, refined oil,
paper products, jute products, etc.
7.2.2 Basic Assumption for IWT Terminal Planning
The following simple basic assumptions were considered for the purpose of IWT
terminal planning:
(i) Terminal facilities are planned for the initial traffic projected for base year 2012-13
and shall be expanded in the subsequent development phase upto the planned
year 2026-27. System is planned that any additions to the facility will be possible
for handling future traffic. Terminal facilities are planned and can be expanded to
the ultimate traffic projected for the year 2026-27.
(ii) Based on the water level data analysis, the designed master plan has been
considered available for berth operation of 300 days per year.
(iii) Average time required for to and fro movement from anchorage to berth, berthing
time and other formalities is considered as 1 to 2 hour per vessel.
(iv) Storage capacities provided at the facility will be adequate to guarantee loading
and unloading of cargo during disruption of traffic.
(v) Maximum truck size assumed is 10 Tonnes pay load.
(vi) All bulk cargo which is not affected by weather will be stored in open stock pile.
(vii) The storm water drain proposed at the terminal shall discharge into the river

DPR for development of Lakhipur – Bhanga stretch of Barak River for shippingand Navigation
Revised Final Report Page 102
7.3 IDENTIFICATION OF IWT TERMINALS
Site selection is the most important as it decides the investment for establishing the
terminal facilities. Hence proper consideration has been given to select the most optimum
location which will minimise the capital investment and other recurring cost during
operation. The selection of suitable site was carried out with the view of following
considerations:
Water availability near the terminal land throughout the year especially during lean
season,
Stable river channel with sufficient depth,
Favourable hydraulic conditions for berthing and cargo handling,
Availability of terminal land for infrastructure, cargo storage and handling,
Traffic potential and cargo characteristics, and
Navigational safety.
7.3.1 Proposed Terminal Locations
As per the TOR, it was proposed to identify suitable location for construction of IWT
Terminal for loading/unloading of cargo at Lakhipur, Silchar and Badarpur. It was evident
that CIWTC has been operating terminals at Badarpur and Karimganj. Hence it was decided
to develop new terminals at Lakhipur, Silchar and the existing terminals at Badarpur and
Karimganj are proposed to be upgraded with modern facilities.
7.3.2 IWT Terminal at Lakhipur
The land identified as per TEFS study report at Lakhipur was at Fullertol Ferryghat.
During the site visit and further investigations, it has been observed that the proposed land
near Fullertol ferry ghat was occupied with permanent habitations. Hence suitable sites
were identified in and around Lakhipur having connectivity to main road. The following 3
lands presented in Table 7.1 were identified at Lakhipur for selecting a suitable site for the
proposed IWT Terminal.

DPR for development of Lakhipur – Bhanga stretch of Barak River for shippingand Navigation
Revised Final Report Page 103
Table 7.1 Land identified for Lakhipur IWT Terminal
Sl.
No
Location at Barak River Terminal Locations Remarks
1 Land identified atHmarkhawlien upstream ofFullertol Ferryghat. Located500 m from NH 53.1 km approx. of katcha roadneeds to be developed.
Located at Right Bank ofBarak River havingstable river bank withrock outcrop.
Suitable Land for IWTTerminal. Land isbeing used by nearbyPrimary School. Forestcover needs to beremoved for jetty andgangway approach.1.5 km of road needsto be widened whichpasses throughhabitation area.
2 Identified at Sapermoyna,downstream of Lakhipur Ferryghat on the way to Old SilcharRoad. Presently land identifiedis being used for Agriculturalpurposes. Entire land needsto be acquired from PrivateParties. 1 km of new roadneeds to be developed.
Located at Right Bank ofBarak river having stableriver bank and waterflow. Approx. 3 kmaway from mainLakhipur – Silchar roadjunction.
Suitable land for IWTTerminal. Agriculturaland Private Land.Entire land area needsto be acquired. 0.5 kmof new road needs tobe laid and another 3km of Old Silchar Roadrequired to bewidened. This roadpasses throughLakhipur market area.
3 Identified at Talalgram, 5 kmdownstream of Lakhipur-Silchar main road junction.Presently the land is used foragriculture. Part of the land ispatta land which needs to beprocured.
Located at Right bank ofbarak river. Havingstable bank and nothaving flow throughoutthe year. Hence, thisland may not be usefulfor IWT terminalplanning.
Land is located onconcave side of rivermeandering. Hence,this land is not suitablefor locating a terminal.
The Terminal land as per above table is presented in Figure 7.1 to 7.2. The location
of land identified at Hmarkhawlien, Lakhipur has been presented in separate location maps
attached subsequently in this Chapter for easy reference and identification. Land identified
at Hmarkhawlien upstream of Fullertol Ferryghat is recommended for proposed IWT
Terminal at Lakhipur considering the proximity to National Highway 53 which connects
Imphal, Manipur.
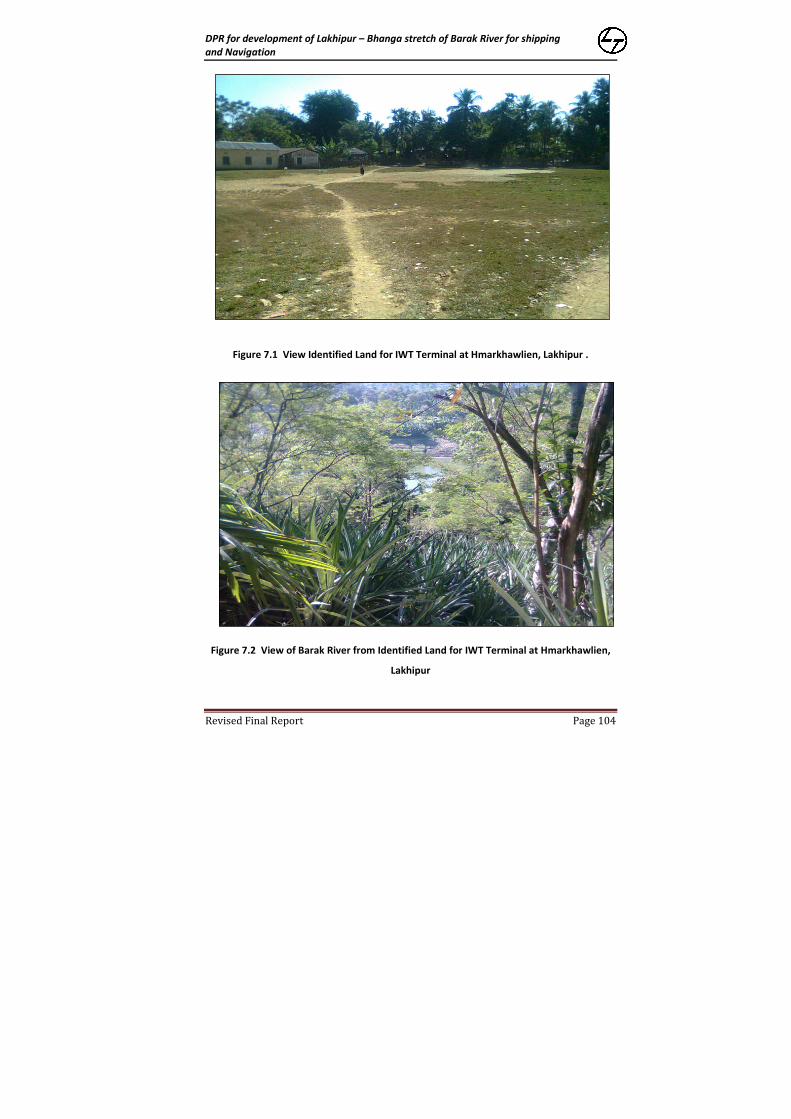
DPR for development of Lakhipur – Bhanga stretch of Barak River for shippingand Navigation
Revised Final Report Page 104
Figure 7.1 View Identified Land for IWT Terminal at Hmarkhawlien, Lakhipur .
Figure 7.2 View of Barak River from Identified Land for IWT Terminal at Hmarkhawlien,
Lakhipur
DPR for development of Lakhipur – Bhanga stretch of Barak River for shippingand Navigation
Revised Final Report Page 105
The location of the identified land at Lakhipur for proposed IWT terminal was
surveyed and the survey drawing is enclosed as Annexure.
7.3.3 IWT Terminal at Silchar
The land identified for setting up of IWT Terminal at Silchar is under control of Govt.
of Mizoram and CIWTC covered godown exists. The area has been surveyed and the
feasibility of setting up of a new terminal was studied. Another suitable land was also
identified downstream of Masimpur, near Silchar for setting up of IWT Terminal. This land
is located 15 km outside of Silchar Town and hence it was not considered. Hence, the land
at Silchar under CIWTC name is proposed to be the suitable site for setting up of IWT
Terminal.
Lakhipur & Silchar IWT Terminals are proposed to be constructed with the
following infrastructure facilities for operation.
(i) Steel Gangway approximately 3 m wide and 50 m in length resting on a floating
pontoon. The detailed engineering & design of gangway arrangement shall be
carried out during the construction stage. The preliminary layout shown in
Annexure drawing is proposed for the DPR purposes only.
(ii) Administration Building and Bank protection arrangement,
(iii) Covered Storage Shed/Transit Shed,
(iv) Open storage area ,
(v) Security Shed,
(vi) Fort lift Trucks(3T capacity), Pay loaders & Dumper tracks, and
(vii) Weight bridge, Watch and ward, Compound wall, Fire fighting arrangement,
Electrical & PH Facilities including DG.
DPR for development of Lakhipur – Bhanga stretch of Barak River for shippingand Navigation
Revised Final Report Page 106
7.3.4 Upgrading Badarpur and Karimganj Terminals
As far as Badarpur and Karimganj IWT Terminals, the existing infrastructure facilities
available at CIWTC Terminals may be utilised with further expansion/modification plan.
The Consultant proposes modification of existing CIWTC Terminal at Badarpur and
Karimganj and master plan for all the proposed IWT terminals and prepared and attached
as Drawings.
7.3.5 Badapur IWT Terminal
Badarpur IWT Terminal has the following infrastructure facilities for operation. The
following components are available at the terminal.
(i) Steel Gangway approximately 2.5 m wide and 30 m in length resting on a floating
pontoon
(ii) Administration Building (Admin Building)
(iii) Covered Storage Shed/Transit Shed ( 1 No)
(iv) Open storage area
(v) Security Shed and Staff quarters
(vi) Shed for crane
(vii) Shed for Electrical & Mechanical Maintenance.
(viii) Service road of approximately 4 m width and 50 m length connecting terminal with
NH 44.
Based on the detail survey, it was observed that Badarpur IWT Terminal is well
connected with NH 44 - Shillong to Agartala via Badarpur and Karimganj. Further, the
Silchar-Badarpur-Lumding broad gauge railway line is planned to be completed by
December 2013 and the Badarpur Railway Station shall be declared as full-fledged railway
subdivision with all modern facilities under Northeast Frontier Railway.

DPR for development of Lakhipur – Bhanga stretch of Barak River for shippingand Navigation
Revised Final Report Page 107
This railway line branches at Badarpur and proceeding further to Agartala. Hence,
Badarpur IWT Terminal can well be developed as a Multi Model Transport Hub having
proximity to Rail, Road and IWT modes of Transportation. As per the above discussion, it is
proposed to connect the Badarpur IWT terminal with the adjacent railway line.
The proposed upgradation of Badarpur IWT Terminal shall act as a hub for the
proposed waterway development in Barak River between Lakhipur and Karimganj stretch.
The proposed railway line connectivity to the nearby Badarpur Rail Line and Badarpur
Railway station is shown in Figure 7.3.
7.3.6 Upgrading Infrastructure Facilities at Badarpur & Karimganj Terminals
Further to the detailed study, the existing infrastructure at Badarpur Terminal are
observed to be not suited for developing a multi model transport hub connecting all
modes of transport. Hence, the following facilities are proposed in this report and
necessary block cost estimate is considered. Similar facilities are also proposed for
upgrading the existing facilities at Karimganj terminal.
(i) Basic facilities for Admin Building including Furniture and Fixures,
(ii) Widening of Approach Pavement connecting NH 44,
(iii) Gangway and Floating Pontoon renovation,
(iv) Renovation of Bank protection and covered shed,
(v) Cranes with 5T capacity(10cycles/hr,18m outreach,
(vi) Fort lift Trucks(3T capacity), Pay loaders & Dumper tracks, and
(vii) Weight bridge, Watch and ward, Compound wall, Fire fighting arrangement,
Electrical & PH Facilities including DG.

DPR for development of Lakhipur – Bhanga stretch of Barak River for shippingand Navigation
Revised Final Report Page 108
Figure 7.3 Proposed Railway Line Connectivity from Badarpur IWT Terminal
7.4 TERMINAL PLANNING
Based on the above consideration, traffic projections, terminal planning
requirements and equipment required for cargo handling, Lakhipur and Silchar IWT
terminals have been planned with the following components. The master plan prepared
for the proposed Lakhipur IWT Terminal for Land identified as No. 1 and 2 (from Table 7.1)
is enclosed herewith as Drawings in the subsequent pages.

DPR for development of Lakhipur – Bhanga stretch of Barak River for shippingand Navigation
Revised Final Report Page 109
7.4.1 Issues in Fixing the Appropriate Level for Approach Gangway
Based on the analysis and observation from the water level data, there is a
difference in level of 11 to 12 m compared to the lowest and highest flood levels. This high
difference in water levels had yielded a high slope in gangway arrangement which
questions the use of gangway arrangement for round the year operation of proposed IWT
Ports. Hence, two alternative preliminary options were designed and presented in the
drawings.
7.5 PORT INFRASTRUCTURE DESIGN
The terminal has been proposed with suitable mooring facilities, fire fighting water
line, water supply pipeline, power line for shore connection to barges, fenders etc.
Preliminary planning and master plan are proposed in the DPR stage and further detailed
engineering of the various terminal structures including civil and mooring facilities shall be
done based on detailed site specific investigation as per the relevant IS codes. It is
envisaged and proposed that to the extent possible, all shore/river bank based buildings /
godown are prefabricated, pre-engineered type conforming to the best standards in vogue
in logistic / supply chain industry.
As per the standards of IWT terminal logistics, the following infrastructure facilities
are proposed for the proposed terminal at Lakhipur and Silchar.
(a) Covered godown, and
(b) Ancillary buildings like office + customs station + security area + stores + enclosures
for utilities like generator, water supply/firefighting systems, etc., are considered
respectively and suitably planned.
The spaces mentioned as (a) and (b) above consist of different units are planned
and are shown in Annexure “Drawings”.
The Master Plan and Layout showing the different infrastructure facilities required
for proposed IWT Terminal are given in Annexure “Drawings”.

DPR for development of Lakhipur – Bhanga stretch of Barak River for shippingand Navigation
Revised Final Report Page 110
CHAPTER 8
PROJECT COST
8.1 CAPITAL COST
The project cost estimates for development of IWT system including O&M of the
system have been worked out. The cost estimates for development of the system are
considered as Capital cost while for operation of the system is termed as maintenance or
operating cost.
8.2 CAPITAL AND OPERATING COST
The capital costs have been worked out primarily for development of various
structures towards construction of Gangway arrangement, ground levelling works, office
complex, storage sheds, pavements, public health arrangements, electrical, fire fighting,
etc., manufacturing/procurement of new vessels as per the traffic projections and as per
the design criteria were considered. Capital dredging has been envisaged during project
inception stage since adequate depths are not available for the round the year navigation
and the river was silted up over the years. Since siltation is a recurring phenomenon, a
provision has been made in the O&M cost towards maintenance of channel. The dredged
channel needs to be identified with channel marking for which Aids to navigation has been
proposed suitably. Operating cost estimate is essential to run the system developed. The
O&M cost of the systems have been considered. Table 8.1 to 8.4 provide Capital Cost of
various project components and other section gives O& M staff requirement.
8.3 BASIS OF COST
The basis of cost estimates worked out as per following:
(i) Standard Schedule of Rates 2010-11 of PWD, Govt. of Assam considered for various
works;
(ii) Market surveys and enquires
(iii) Judgement based on Consultant’s Experience
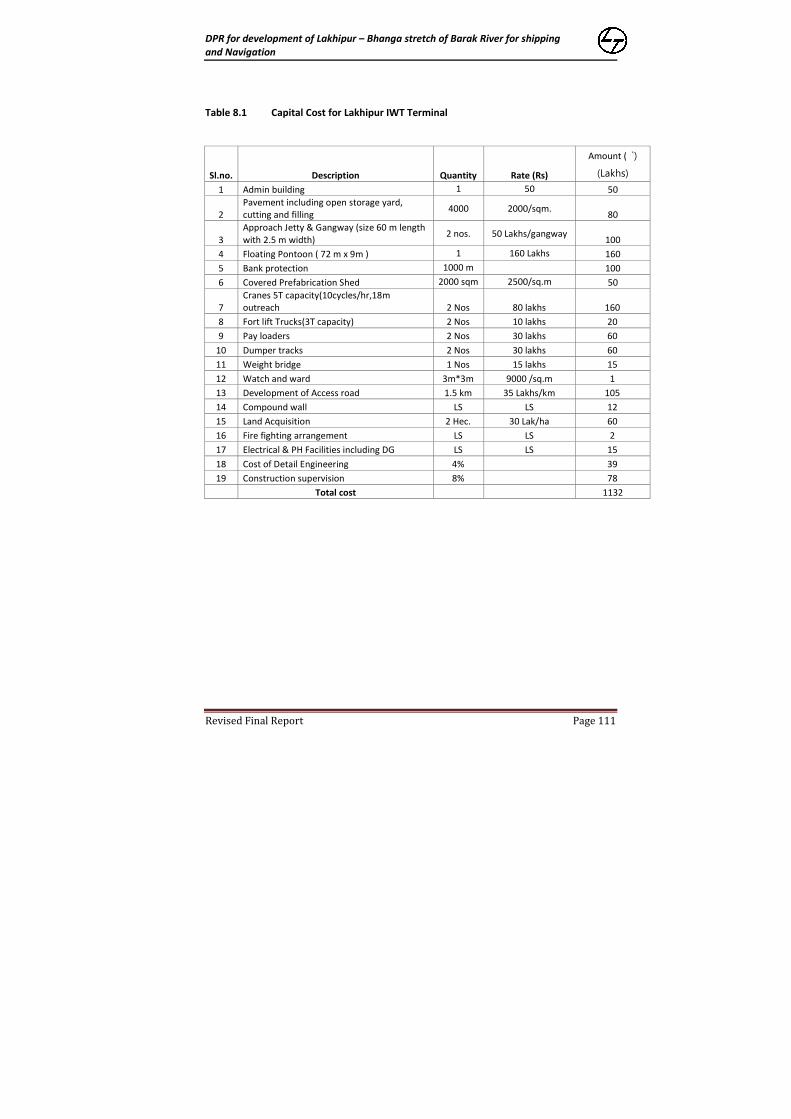
DPR for development of Lakhipur – Bhanga stretch of Barak River for shippingand Navigation
Revised Final Report Page 111
Table 8.1 Capital Cost for Lakhipur IWT Terminal
Sl.no. Description Quantity Rate (Rs)
Amount ( `)
(Lakhs)
1 Admin building 1 50 50
2Pavement including open storage yard,cutting and filling
4000 2000/sqm.80
3Approach Jetty & Gangway (size 60 m lengthwith 2.5 m width)
2 nos. 50 Lakhs/gangway100
4 Floating Pontoon ( 72 m x 9m ) 1 160 Lakhs 160
5 Bank protection 1000 m 100
6 Covered Prefabrication Shed 2000 sqm 2500/sq.m 50
7Cranes 5T capacity(10cycles/hr,18moutreach 2 Nos 80 lakhs 160
8 Fort lift Trucks(3T capacity) 2 Nos 10 lakhs 20
9 Pay loaders 2 Nos 30 lakhs 60
10 Dumper tracks 2 Nos 30 lakhs 60
11 Weight bridge 1 Nos 15 lakhs 15
12 Watch and ward 3m*3m 9000 /sq.m 1
13 Development of Access road 1.5 km 35 Lakhs/km 105
14 Compound wall LS LS 12
15 Land Acquisition 2 Hec. 30 Lak/ha 60
16 Fire fighting arrangement LS LS 2
17 Electrical & PH Facilities including DG LS LS 15
18 Cost of Detail Engineering 4% 39
19 Construction supervision 8% 78
Total cost 1132

DPR for development of Lakhipur – Bhanga stretch of Barak River for shippingand Navigation
Revised Final Report Page 112
Table 8.2 Capital Cost for Silchar IWT Terminal
Sl.no. Description Quantity Rate (Rs)
Amount ( `)
(Lakhs)
1 Admin building 1 50 50
2Pavement including open storage yard,cutting and filling
4000 2000/sqm.80
3Approach Jetty & Gangway (size 60 m lengthwith 2.5 m width)
2 nos. 50 Lakhs/gangway100
4 Floating Pontoon ( 72 m x 9m ) 1 160 Lakhs 160
5 Bank protection 1000 m 100
6 Covered Prefabrication Shed 2000 sqm 2500/sq.m 50
7Cranes 5T capacity(10cycles/hr,18moutreach 2 Nos 80 lakhs 160
8 Fort lift Trucks(3T capacity) 2 Nos 10 lakhs 20
9 Pay loaders 2 Nos 30 lakhs 60
10 Dumper tracks 2 Nos 30 lakhs 60
11 Weight bridge 1 Nos 15 lakhs 15
12 Watch and ward 3m*3m 9000 /sq.m 1
13 Widening of Access road 1 km 35 Lakhs/km 35
14 Demolition of existing buildings LS 50
15 Compound wall LS LS 12
16 Land Acquisition 1 Hec. 60 Lak/ha 60
17 Fire fighting arrangement LS LS 2
18 Electrical & PH Facilities including DG LS LS 15
19 Cost of Detail Engineering 4% 41
20 Construction supervision 8% 81
Total cost 1152

DPR for development of Lakhipur – Bhanga stretch of Barak River for shippingand Navigation
Revised Final Report Page 113
Table 8.3 Capital Cost for Improvement of Badarpur IWT Terminal
Sl.no. Description Quantity Rate (Rs)
Amount ( `)
(Lakhs)
1Basic facilities for Admin Building includingFurniture and Fixures, improvement
1 2020
2 Approach Pavement LS LS 20
3Gangway and Floating Pontoon renovationRenovation
2 nos. 25 Lakhs25
4 Bank protection 1000 m LS 100
5 Covered Shed Renovation LS LS 2
6Cranes 5T capacity(10cycles/hr,18moutreach 2 Nos 80 lakhs 160
7 Fort lift Trucks(3T capacity) 2 Nos 10 lakhs 20
8 Pay loaders 2 Nos 30 lakhs 60
9 Dumper tracks 2 Nos 30 lakhs 60
10 Weight bridge 1 Nos 15 lakhs 15
11 Watch and ward 0 0 0
12 Widening of Access road 100 m 10 10
13 Demolition of existing buildings LS 0
14 Compound wall LS LS 12
15 Land Acquisition LS. 10
16 Fire fighting arrangement LS LS 2
17 Electrical & PH Facilities including DG LS LS 3
Total cost 519

DPR for development of Lakhipur – Bhanga stretch of Barak River for shippingand Navigation
Revised Final Report Page 114
Table 8.4 Capital Cost for Improvement of Karimganj IWT Terminal
Sl.no. Description Quantity Rate (Rs)
Amount ( `)
(Lakhs)
1Basic facilities for Admin Building includingFurniture and Fixures, improvement
1 2020
2 Approach Pavement LS LS 20
3 Gangway and Floating Pontoon renovation 2 nos. 25 Lakhs/each 50
4 Bank protection 1000 m LS 100
5 Covered Shed Renovation LS LS 2
6Cranes 5T capacity(10cycles/hr,18moutreach 2 Nos 80 lakhs 160
7 Fort lift Trucks(3T capacity) 2 Nos 10 lakhs 20
8 Pay loaders 2 Nos 30 lakhs 60
9 Dumper tracks 2 Nos 30 lakhs 60
10 Weight bridge 1 Nos 15 lakhs 0
11 Watch and ward 0 0 0
12 Widening of Access road 100 m 10 10
13 Demolition of existing buildings LS 0 0
14 Compound wall LS LS 0
15 Land Acquisition LS. 0
16 Fire fighting arrangement LS LS 2
17 Electrical & PH Facilities including DG LS LS 3
Total cost 507
8.3.1 Capital Cost Estimate For Dredging
Fairway Development has been estimated as follows:
Dredging (Rs in Cr)
Capital dredging @ Rs 250/ cu.m for 26 lakh cu.m - 65.00Navigational Aids, 200 Lights at 14,000/ light - 0.28
Cost of Vessels
1 Unit of Cutter suction dredger- 1 X Rs. 17.50 Cr - 17.50
( with tugs and work boats)
1 Survey Launch 1X Rs.2 Cr - 2.00
1 Inspection cum multipurpose boat 1 x Rs0.50 cr - 0.50
Total - 85.28 Cr.

DPR for development of Lakhipur – Bhanga stretch of Barak River for shippingand Navigation
Revised Final Report Page 115
8.3.2 Estimate For Annual Maintenance
A) Dredging
Considering annual Maintenance Dredging quantity of 10% of capital dredging (say 2.6
Lakhs cu.m)
(Rs in lakhs)
Running Charges for survey launch @ Rs18 Lakhs per annum = 18 .00
Running Charges for dredgers @ Rs 51 Lakhs/ CSD = 51.00
Running charge for inspection boat @ Rs9 Lakhs per annum = 9.00
Manning Charges @Rs 25 lakhs/ CSD x 1 + @ Rs7 lakhs/ survey
launch x 1 + @ Rs 5 Lakhs/ inspection boat x 1 = 37.00
Total = Say Rs 115 lakhs
B) Navigational aids
i) Channel marking
Erection- 200 marks @ Rs.395/- per mark = 0.79
Maintenance – 200 x 6 months x Rs.458/ = 5.50
ii) Night navigation with country boats fitted with lights
Erection 150 nos x Rs4058/- = 6.09
Maintenance 150 nos x 12 months x Rs4058/- = 73.05
Total = 85.43 Say Rs.86 lakhs
C) Terminals.
@ Rs. 15 lakhs per terminal p.a., the annual maintenance charge for 3 terminals will be Rs.
45 lakhs.
Say Rs 45 lakhs
D) Office
Manpower = 50.00
Office = 20.00
Total 70.00 Say Rs 70 lakhs
Total O&M Cost = 316 Lakhs/year

DPR for development of Lakhipur – Bhanga stretch of Barak River for shippingand Navigation
Revised Final Report Page 116
Table 8.5 O& M Staff Requirement
Sl. No Description Quantity
1 crane operation 2
2 Fort lift truck operator 2
3 Pay loader operator 2
4 Dumper truck operator 2
5 Electrical supervisor 2
6 Weigh bridge operator 2
7
Maintenance staff
Mechanical 2
Electrical 2
Civil 2
Skilled 3
unskilled 3
8
Office staff
Terminal manager/Supervisor 1
Clerical staff 2
9 Security staff 3
Total 30
8.3 TOTAL COST
The total cost of the project was estimated vide capital cost for construction of IWT
Terminals, cost towards waterway development and O&M charges taking as 2011-12 as
base year.
Table 8.6 Total Estimated Cost at 2012 Price
Sl. No Item Description Cost (in Cr)
1 Capital Cost
Development of IWT Terminal atLakhipur
11.32
Development of IWT Terminal atSilchar
11.52
Upgrading existing IWT Terminalat Badarpur
5.17
Upgrading existing IWT Terminalat Karimganj
5.07
Dredging & cost of vessels 85.28
Development of Railway lineconnectivity to Badarpur Terminalfor around 4 km length
5.00
Total Capital Cost 123.36
2 O&M Maintenance cost 3.16

DPR for development of Lakhipur – Bhanga stretch of Barak River for shippingand Navigation
Revised Final Report Page 117
8.4 PROPOSED ORGANISATION STRUCTURE OF MAINTENANCE & MANAGEMENT OFBARAK WATERWAY DEVELOPMENT
The proposed development of Barak River waterway between Lakhipur to Bhanga
shall be developed and maintained by a separate Project Management Unit (PMU) under
the jurisdiction of Director, Inland Waterways Authority of India, Guwahati. The
development of this water is planned in two phases and the same is elaborated in the
subsequent sections. The proposed PMU organisation structure is presented in Figure 8.1.
8.5 PROJECT SCHEDULE
The time schedule for construction activities of the project is considered as three
years. The proposed project schedule is presented below. The capital cost of the project
shall be incurred in phases during the construction period and the same is presented in
Figure 8.2 and 8.3 as approved by EFC.
8.6 EFC RECOMMENDATION ON PROJECT IMPLEMENTATION
Based on the Draft Final Report submitted for the development of Lakhipur-
Bhanga stretch of Barak River for shipping & navigation, EFC recommended the following
implementation schedule to develop the waterway in two phases.
Phase-I:
Development of Bhanga- Silchar (70 km) stretch with upgradation of existing
terminals at Karimganj & Badarpur and provision for floating terminal at Silchar.
Phase-II:
Development of Silchar- Lakhipur (51 km) stretch with setting up of new terminals
at Silchar & Lakhipur after making assessment on a realistic basis of the potential of
cargo in the upstream stretch.

DPR for development of Lakhipur – Bhanga stretch of Barak River for shippingand Navigation
Revised Final Report Page 118
MANPOWER REQUIREMENT(Total Number of Posts – 11*)
ORGANISATION STRUCTURE OF PROJECT MONITORING UNIT (PMU)
*Note: 11 Posts to be created and supporting staff to be engaged on contract/outsourcing basis.
Figure 8.1 Organisation Structure of Project Management Unit (PMU)
IWAI, HEAD OFFICE, NOIDA
DIRECTOR, IWAI, GUWAHATI
DEPUTY DIRECTOR, IWAI, SILCHAR
Assistant Director(2 Nos)Nos)
Asst. Hydrograhic Surveyer
Jr. Hydrograhic Surveyer
Jr. Accounts Officer
Accounts AssistantTechnical Assistant(2 Nos)
Assistant Director
Technical Assistant

DPR for development of Lakhipur – Bhanga stretch of Barak River for shippingand Navigation
Revised Final Report Page 119
Sl. No Activities 2nd Year 3rd Year
2 Fairway Development between Bhanga to Silchar
(a) Upgrading Karimganj and Badarpur Terminals
Railway Connectivity Planning & Land Acquisition
(b) Setting up of Floating Terminal at Silchar
(b) Procurement of Hardware & Other Equipments
1st Year
1 Setting up of PMU Office at Silchar
(a) Capital Dredging
Note: Activity includes captial dredging, navigational aides, construction of terminals, supply of dredger, survey launch,
inspection vessel to be completed in 36 months from the date of award of work by PMU followed by Maintenance and
Management
3 Procurement & Installation of Navigational Aids
4 Setting up of IWT Terminals
Figure 8.2 Phase I – Implementation Schedule for Development of Barak Waterway

DPR for development of Lakhipur – Bhanga stretch of Barak River for shippingand Navigation
Revised Final Report Page 120
Sl. No Activities 2nd Year
1 Fairway Development between Silchar to Lakhipur
(a) Construction of Silchar Terminal
(b) Construction of Lakhipur Terminal
1st Year
(a) Capital Dredging
(b) Railway Connectivity to Badarpur Terminal
Note: Activity includes captial dredging, navigational aides, construction of terminals to be completed in 24
months from the date of award of work by PMU followed by Maintenance and Management
2 Procurement & Installation of Navigational Aids
3 Setting up of IWT Terminals
Figure 8.3 Phase II – Implementation Schedule for Development of Barak Waterway
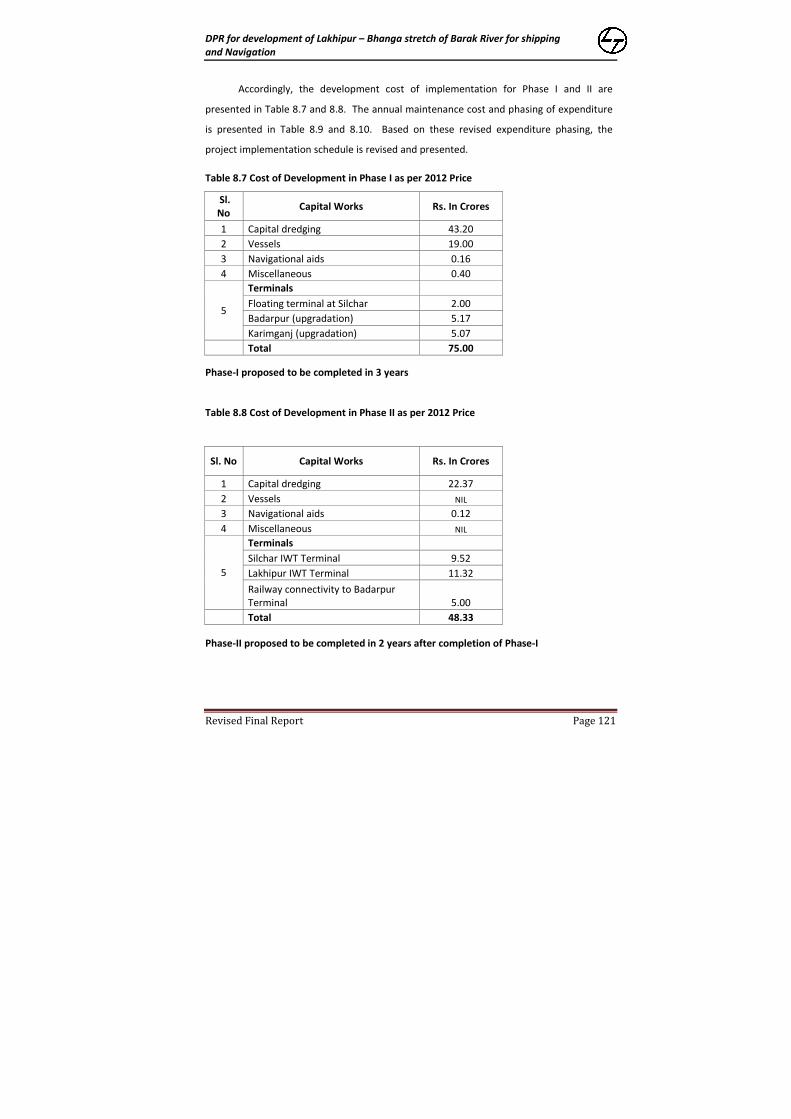
DPR for development of Lakhipur – Bhanga stretch of Barak River for shippingand Navigation
Revised Final Report Page 121
Accordingly, the development cost of implementation for Phase I and II are
presented in Table 8.7 and 8.8. The annual maintenance cost and phasing of expenditure
is presented in Table 8.9 and 8.10. Based on these revised expenditure phasing, the
project implementation schedule is revised and presented.
Table 8.7 Cost of Development in Phase I as per 2012 Price
Sl.No
Capital Works Rs. In Crores
1 Capital dredging 43.20
2 Vessels 19.00
3 Navigational aids 0.16
4 Miscellaneous 0.40
5
Terminals
Floating terminal at Silchar 2.00
Badarpur (upgradation) 5.17
Karimganj (upgradation) 5.07
Total 75.00
Phase-I proposed to be completed in 3 years
Table 8.8 Cost of Development in Phase II as per 2012 Price
Sl. No Capital Works Rs. In Crores
1 Capital dredging 22.37
2 Vessels NIL
3 Navigational aids 0.12
4 Miscellaneous NIL
5
Terminals
Silchar IWT Terminal 9.52
Lakhipur IWT Terminal 11.32
Railway connectivity to BadarpurTerminal 5.00
Total 48.33
Phase-II proposed to be completed in 2 years after completion of Phase-I

DPR for development of Lakhipur – Bhanga stretch of Barak River for shippingand Navigation
Revised Final Report Page 122
Table 8.9 Annual Maintenance Cost as per 2012 Price
Sl. No Description of work Cost in Rs. Crore
1 Maintenance Dredging 1.15
2 Navigational Aids 0.86
3 Terminals 0.45
4 Manpower & Office 0.70
Total 3.16
Table 8.10 Phasing of Expenditure for Phase - I
Sl. No YEAR Rs. Crores
1 2013-14 15.00
2 2014-15 25.00
3 2015-16 35.00
Total 75.00
Balance amount of Rs 48.30 crores will be spend in 2 years after completion of Phase I.

DPR for development of Lakhipur – Bhanga stretch of Barak River for shippingand Navigation
Revised Final Report Page 123
CHAPTER 9
COST BENEFIT ANALYSIS
9.1 INTRODUCTION
The cost benefit analysis and economic analysis is carried out to gauge the viability
of the investment on the proposed development of Inland water Transport (IWT) on the
identified river stretches duly taking into account the various benefits likely to accrue to the
IWT users as well as the different types of stakeholders in the project influence area.
Further, in economic analysis project costs and benefits are assessed from the point of view
of the economy. This chapter presents methodology inputs and result of economic
appraisal as per the base year traffic forecasts during the design life of the project.
9.2 APPROACH AND METHODOLOGY
The inland waterways with all the proposed improvement /development have been
be considered for studying the cost and benefit. In this methodology, while the cost of with
the project scenario (i.e. capital, replacement, maintenance cost of channel and terminal
and capital and operating cost of vessels) represents the project cost. . These project costs
and benefits have been worked out for each yea of the project life and discounted to arrive
at economical internal rate of return (EIRR). The cost and benefit streams have been
worked out for 30 years commencing from the year 2012-13. While the first three year
relate to construction period, the remaining 27 year represent project economic life or
operating year. In the last year of operation, due credit is given to the residual value of the
assets. In case of the economic life of an asset is less than 30 years, its replacement cost is
provided in the year in which it is due.
In economic appraisal, all the project costs and benefits are expressed in their
economic terms (or in terms cost of resource consumption) rather than financial/market
prices which are used in financial appraisal. This is because the market/financial prices of a
commodity/services do not reflect their true value to the economy due to market
distortions traceable to administered prices, taxes, subsidies, etc. another important factor
in economic appraisal is the discount rate (or cut-off rate) used for discounting future
economic cost and benefit of the project to their present value. The discount rate

DPR for development of Lakhipur – Bhanga stretch of Barak River for shippingand Navigation
Revised Final Report Page 124
represents opportunity cost of capital in economic appraisal.
9.3 FINANCIAL AND ECONOMIC APPRAISAL
Based on the traffic forecast presented, the following project cost and benefits
have been considered for financial and economic appraisal.
9.4 PROJECT COST AND BENEFITS
Various items of project cost for the IWT alternative included incremental
expenditure are:
The development of infrastructure facilities (waterway and terminal) and their
operation and maintenance (O&M),
Acquiring vessels and their annual O&M costs and
User cost-mainly cost of additional handling and local haulage at both (originating as
well as terminating) IWT terminal.
The project benefits comprise the cost of next best alternative foregone (in this case
road transport) in case the project is taken up. Details of project costs and benefits are as
under.
9.4.1 Project Costs
a) Capital cost
s.no Costcategory
Detailed item of cost
1 Waterway 1.1 Land acquisition
1.2 Dredging and equipment
1.3 Aids to navigation
2 Terminal 2.1 Civil works including land acquisition
2.2 Mechanical handling facilities
2.3 Miscellaneous
A summary picture of the capital costs and their phasing for the Barak river stretch
considered for financial and economical appraisal.

DPR for development of Lakhipur – Bhanga stretch of Barak River for shippingand Navigation
Revised Final Report Page 125
Table 9.1 Capital cost estimates for IWT development for Barak River
s.no Name of riverCapital cost (in Cr. )
Totalcost 2012-13 2013-14 2014-15 2020-21 2025-26
1 Waterway 85.28 35 30 20.28 --- ---
2 Terminal 38.08 25 6.73 6.35 --- ---
Total 123.36 60 36.73 26.63 ------ ---
A summary of the percentage share of capital cost on waterway, terminal and vessel
is given in table 9.2
Table 9.2 Percentage composition of capital cost for IWT development for Barak River
waterway Terminal Total
69 % 31 100.00%
b) Operating mad maintenance (O&M) costs:
These costs refer to various items of costs that are required for maintenance and
operation of the capital assets referred to above. By nature, these costs are recurring in
nature and are estimated on annual basis. Major items of the O&M costs are:
manpower
repair& maintenance
fuel& consumables
over heads
The assumptions and parameter estimates underlying the O&M costs for vessels
and terminals are presented cost chapter. Summary estimates of O&M costs are given in
table 9.3. As the construction period is 3 years, operating cost will be incurred from 2012-
13.

DPR for development of Lakhipur – Bhanga stretch of Barak River for shippingand Navigation
Revised Final Report Page 126
Table 9.3 Summary 0f Estimated O&M Costs
Sl. No yearO& M Cost/year
in Lakh
1 2012-13 316.00
2 2013-14 331.80
3 2014-15 348.39
4 2015-16 365.81
5 2016-17 384.10
6 2017-18 403.30
7 2018-19 423.47
8 2019-20 444.64
9.4.2 Project benefits
The introduction of the IWT will yield tangible and non-tangible saving due to
equivalent reduction in road traffic and certain socio-economic benefits. These include
saving in road construction and maintenance, vesicle operation costs, travel time and other
socio-economic benefits of travel time, better accessibility, better comfort and quantity of
life, increase in mobility etc.
The direct and indirect benefits of the project are following
Reduced road stress.
Better accessibility to facilities in the influence area.
Economic stimulation in the micro region of the infrastructure.
Increased business opportunities.
Overall increased mobility.
Facilitating better planning and up-gradation of influence area.
Saving in vehicle operating costs of buses and other vehicles that are using the
existing transport network after the IWT is introducing due to decongestion effect
on road stress.
Saving in time of passenger of existing mode3s, because of reduced congestion on
road.
Saving on account of reduction of vehicular pollution.

DPR for development of Lakhipur – Bhanga stretch of Barak River for shippingand Navigation
Revised Final Report Page 127
For the purpose of the study only saving in vehicle operating cost of moving goods
by road vehicles has been considered.
As indicated earlier, the project benefits comprise the total cost of moving the same
by next best alternative (i.e. road transport in the present case) in case the IWT is not
developed on the identified river stretches. The cost of moving the project IWT traffic by
road for normal commodity movement in state highway of two lanes is considered Rs.
2.5/ton per km. The same cost has been considered for the economic analysis.
9.5 ECONOMIC & FINANCIAL INTERNAL RATE OF RETURN (E& FIRR)
The revenue has been worked out by considering the traffic of commodity
movement by IWT as Rupees one per ton per km. The cost and revenue streams of financial
analysis are presented in table 9.5. The FIRR for the river stretches of IWT system is
worked. This analysis shows that the project is financially viable on the basis of tariff of
commodities traffic alone.
Table 9.5 FIRR for IWT for Barak River
S.no YearCapital
cost ( INLAKHS)
Additionalcost (inLakhs)
O&Mexpenses(in Lakhs)
Total outflow
Estimatedtraffic
( Lak. Ton)
Revenuegenerationin IWT ( in
Lakhs)
Net cashflow
(financial)
1 2012-13 6000 316.00 6316.00 -6316.00
2 2013-14 3673 363.40 4036.40 -4036.40
3 2014-15 2663 417.91 3080.91 -3080.91
4 2015-16 480.60 480.60 497741 4977.41 4496.81
5 2016-17 552.69 552.69 522628 5226.28 4673.59
6 2017-18 635.59 635.59 548759 5487.59 4852.00
7 2018-19 730.93 730.93 576197 6553.72 5822.79
8 2019-20 840.57 840.57 605007 6881.40 6040.84
9 2020-21 3000 966.65 3966.65 635257 7225.47 3258.82
10 2021-22 1111.65 1111.65 667020 7586.75 6475.10
11 2022-23 1278.40 1278.40 700371 7966.08 6687.69
12 2023-24 1470.16 1470.16 902307.6 9023.08 7552.92
13 2024-25 1690.68 1690.68 947423 9474.23 7783.55
14 2025-26 1944.28 1944.28 994794 9947.94 8003.66
15 2026-27 2235.92 2235.92 1044534 10445.34 8209.42
16 2027-28 3000 2571.31 5571.31 1096761 10967.61 5396.29
17 2028-29 2957.01 2957.01 1204684.4 12046.84 9089.84
FIRR 27.73%

DPR for development of Lakhipur – Bhanga stretch of Barak River for shippingand Navigation
Revised Final Report Page 128
9.6 ECONOMICAL INTERNAL RATE OF RETURN (EIRR)
Based on the traffic forecasts, estimated project costs and benefits in economic
cost terms, cost and benefits streams have been worked out for the entire project life
including 3 years of construction period for Barak river stretch. The cash detail of cost and
benefit streams of economic analysis is presented in table 9.6. The EIRRs and IRR are
theoretically same since the economic benefits are intangible benefits considering the local
socio-economic conditions for the Barak river stretch of IWT system.
Table 9.6 EIRR FOR IWT FOR BARAK RIVER
S.no YearCapital
cost ( INLAKHS)
Additionalcost
O&Mexpenses(in
Lakhs)
Estimatedtraffic (InLak ton)
Revenuegenerationin IWT ( in
Lakhs)
Saving inroad
transport
Net cashflow
(economic)
1 2012-13 6000 316.00 -6316.00
2 2013-14 3673 363.40 -4036.40
3 2014-15 2663 417.91 -3080.91
4 2015-16 480.60 497741 4977.41 2488.70 6985.52
5 2016-17 552.69 522628 5226.28 2613.14 7286.73
6 2017-18 635.59 548759 5487.59 2743.80 7595.80
7 2018-19 730.93 576197 5761.97 2880.99 7912.03
8 2019-20 840.57 605007 6050.07 3025.04 8234.54
9 2020-21 3000 966.65 635257 6352.57 3176.29 5562.21
10 2021-22 1111.65 667020 6670.20 3335.10 8893.66
11 2022-23 1278.40 700371 7003.71 3501.86 9227.17
12 2023-24 1470.16 902308 9023.08 4511.54 12064.46
13 2024-25 1690.68 947423 9474.23 4737.11 12520.67
14 2025-26 1944.28 994794 9947.94 4973.97 12977.63
15 2026-27 1044534 10445.34 5222.67 15668.01
16 2027-28 3000 1096761 10967.61 5483.80 13451.41
17 2028-29 1204684 12046.84 6023.42 18070.27
EIRR 38%

DPR for development of Lakhipur – Bhanga stretch of Barak River for shippingand Navigation
Revised Final Report Page 129
CHAPTER 10
RAPID ENVIRONMENTAL IMPACT ASSESSMENT
10.1 INTRODUCTION
Rapid Environmental Impact Assessment (REIA) is used to determine the type and
level of effects an existing facility is having or a proposed project would have on its natural
environment. Its objectives include:
(i) To decide if the effects are acceptable or have to be reduced for continuation of
the facility or proceeding with the proposed project,
(ii) To design/implement appropriate monitoring, mitigation, and management
measures,
(iii) To propose acceptable alternatives, and
(iv) To prepare an Environmental Management Plan (EMP).
The adequacy of an EIA is based on the extent to which the environmental impacts
can be identified, evaluated, and mitigated. An EIA is a standard requirement for projects
requiring a major change in land use or those which are to be located in environmentally
sensitive areas.
Assam is located between 24°08' N - 27°59' N latitude and 89°42' E- 96° 01' E
longitude covering an area of 78, 523 km2. Arunachal Pradesh, Nagaland, Manipur,
Mizoram, Meghalaya, West Bengal, Bangladesh and Bhutan surround it. The State of Assam
consists of 24 districts for administration. The geology has endowed the state with many
hills and rivers. These have tremendous influence on the soil quality, drainage pattern,
landuse, vegetation pattern, population pattern, culture, etc.

DPR for development of Lakhipur – Bhanga stretch of Barak River for shippingand Navigation
Revised Final Report Page 130
The state can be divided into three distinctive geographic parts. The first one being
the long and narrow Brahmaputra valley or Assam valley. The river Brahmaputra flows
from East to West for about 700 km within the state and has great role in the land
formation, hydrology, ecology, population distribution, culture and economy of the valley
and the state. The Barak, another largest river of the state has created the Barak Valley in
the southern end of the state. Barail range and Karbi Plateau has separated these two river
systems.
Cachar district of Assam is located in the central part of the Barak valley on southern
part of Assam. It is bounded by 24° 22' N and 25° 8' N Latitudes and 92° 24' E and 93° 15'E
Longitudes and covers an area of 365 km2.
10.2 GEOLOGY AND GEOGRAPHY
Physiographically, the area consists of hilly terrain surrounded by the border on all
sides with bowl shaped synclinal valley elongated towards south. The main river system is
Barak River with its tributaries in the North and South. Other tributaries are Madhera, Chiri,
Jatinga, Kalain and Seema.
Geologically, the district can be divided into two major groups, i.e. unconsolidated
deposits comprising alluvial deposits of Sub-Recent to Recent age and semi-consolidated
Tertiary deposits of Bhaban, Bokabil, Girujan/ Tipam, Dupitila and Dihing formations of
Miocene to Pliocene age. The alluvial deposits containing in the central parts mainly
comprises of sand, silt and clay with gravel and occasional coal bands. The semi-
consolidated rocks are exposed in the form of hillocks comprising shale, sandstone,
ferruginous sandstone, mottle clay, pebble bed and boulder beds etc.
10.2.1 Geomorphology and Soil Type
The area consists of resistant structural hills in the borders with an elongated valley
in the central part. The general trend of the hills is NE-SW. Structural features like hog’s
back and steep escarpments are commonly present. The valley area comprises of low land
with swamps and alluvial flat land. The southern part has number of field depressions and

DPR for development of Lakhipur – Bhanga stretch of Barak River for shippingand Navigation
Revised Final Report Page 131
these are permanent water bodies commonly known as ‘beel’.
The soil of the district varies from alluvial to lateritic in nature. Texture is generally
clayey loam to clay. The pH ranges from 4.5 to 6.0. The river line tracts are found to be
loamy to sandy loamy in nature. The hilly tracts are covered by lateritic soil.
10.3 RAINFALL AND CLIMATE
The district receives heavy annual rainfall of the tune of 3,874.5 mm. The maximum
rainfall occurs during monsoon period between May to August. The district experiences a
sub-tropical and humid climate. The temperature varies from 120 C in winter to 350 C in
summer. The humidity varies from 32% to maximum of 98% during July and October.
The estimated Annual replenishable ground water resources are 2239.21 Mm3
against net annual ground water draft of 32.65 Mm3. The projected demand for domestic
and industrial use of ground water upto 2025 is only 52.46 Mm3. The stage of ground water
development in the district is only 2%.
10.4 TOPOGRAPHY
The two major floodplains, viz., Chatla and Shonbeel are in the catchments of
Ghagra and Singla rivers, respectively. These rivers are tributaries of River Barak. The
topography comprises extensive low-lying areas with numerous small hillocks strewn in
between. The human habitations are confined to these hillocks.
10.4.1 Vegetation
The floodplains originally had rich vegetation with Barringtonia acutangula as the
dominant species. This tree can withstand prolonged water logging and is a common
swamp forest species in this region. Large scale removal of this species was initiated in the
1960-70s and now a few patches remain. The other common trees include Lagerstroemia
flosreginae and Vitex spp. Reeds such as Erianthus raveneae and Phragmites karka are also
found.

DPR for development of Lakhipur – Bhanga stretch of Barak River for shippingand Navigation
Revised Final Report Page 132
10.5 POPULATION
As per 2001 census, the population of the district is 14,44,921 and the density of
population is 382 persons per sq. km. The percentage of literacy is 67.82. As per land
record, the district has total cultivable area of 1,175.26 ha. Net area sown is 1,154.89 ha
and current fallow is 60.73 ha. The district is much occupied by marshy land.
One of the major ethnic groups in the Barak Valley floodplains, especially Chatla and
Shonbeel, are the Kaivartas, a fisher-cultivator community. The property regime in the
floodplains is also unique: when it is covered with water in the monsoon, it is treated as a
‘Common Property Regime’ (CPR) with community fishing rights. However, after the water
recedes, the land reverts to a ‘Private Property Regime’ (PPR) with restoration of individual
property rights. The other floodplains are inhabited by a plethora of Hindu and Muslim
communities who also earn their livelihood through fishing and agriculture.
10.6 PRIMARY SECTOR
Barak Valley derives its name from River Barak that along with its tributaries drains
its 6922 sq. km in area south of the Borail range of mountains in the state of Assam, North
East India. The valley comprises the three districts of Cachar, Hailakandi and Karimganj and
is bounded by the North Cachar Hills district of Assam and the state of Meghalaya to the
north, the state of Manipur and Mizoram to the east and south respectively and the state
of Tripura and the Sylhet district of Bangladesh to the west.
DPR for development of Lakhipur – Bhanga stretch of Barak River for shippingand Navigation
Revised Final Report Page 133
The area are under different types of wetlands in the Barak Valley districts of
Cachar, Hailakandi and Karimganj. The total wetland area is 13737.5 ha which in turn
represents about 14 % of the total natural wetland area in the state of Assam. It may also
be seen that seasonally inundated floodplains are the most important type of wetlands in
this area. Together they are known to comprise 42.75 % of the total area under floodplain
wetlands in the State of Assam, although Barak Valley comprises a mere 8.8 % of the total
geographic area of Assam. Thus, these floodplain ecosystems play a significant role in the
economy of these three districts in terms of their overriding importance as repositories of
fish, as habitats for resident and migratory birds, for storing excess flood water and for
supplying irrigation water to nearby fields in the dry season. Chatla in Cachar and Shonbeel
in Karimganj district are the two major floodplain wetlands of Barak Valley. While Chatla
has an area of around 10 km2, Shonbeel is the largest floodplain wetland in Assam having
an area of 15 km2. Besides these two, the other important floodplains include the Jabda
and Lucca Haors in Cachar, Bakri Haor in Hailakandi and Anair Haor in Karimganj district.
The floodplains are locally called Haors or Beels.
10.7 FLOODPLAIN ECONOMY
Barak Valley experiences a subtropical monsoonic climate with an annual rainfall
ranging between 2500-3300 mm. About 80-85 % of this rainfall occurs during the months of
April/May-September/October. December and January are normally the driest months.
Pre-monsoon rains often accompanied by thunder and hail occur in April-May and the
monsoon arrives in early June and continues till September, although heavy rains may also
occur in October. The seasonal pattern of rainfall and its variations from year to year
govern the flood pulse and determine the extent and duration of inundation of the
floodplains by the overflowing river waters. These in turn have profound effects on both
capture fishery and agriculture in the floodplains. Heavy pre-monsoon rains may cause
early floods in April-May when excess river water inundates the floodplains and destroys
the ripening summer rice that is harvested in April. For example, between 1996 and 2005,
heavy pre-monsoon rains in 1996, 2000 and 2004 inflicted severe damage on the crops,
thereby causing economic distress to the farmers. Severe hailstorms during this season can
also have adverse effects.

DPR for development of Lakhipur – Bhanga stretch of Barak River for shippingand Navigation
Revised Final Report Page 134
10.7.1 Agriculture
Econony of Karimganj district is agrarian in character with as much as 60% of the
active workforce engaged in cultivation. Together with Farming, Livestock, Fishery, Forestry
etc, the Primary sector of economy engages a total of 68% of active workforce. But the net
area sown at around 35% of the total land area has remained more or less stagnant for
years due to low rate of multiple cropping, which again, is the result of poor irrigation
facility, even though the district is fed by three perennial rivers, large swamps and
watersheds. As a consequence, the productivity is rather low. For example, in 1997-98,
winter Rice - the main farm product - registered a productivity of 1,759 Kg/Ha. Sugarcane,
areca nut, vegetables etc are also significant farm products. Sugarcane production in 1995-
96 was put at 121,355 M.T. while areca nut production was 1,083 M.T. Other cultivated
crops are large in variety, but low in quantity having little marketable surplus. Leaving 30%
of total land area under forest, the remaining 35% is either barren, fallow or uncultivable
wasteland.
The late arrival of the monsoon is during the early June and the rainfall is more or
less evenly distributed over July-September, successive flood pulses inundate the
floodplains, resulting in the entry of a large number of potamodromous (fishes that migrate
from the river to the floodplains) species of fishes, and the consequent boom in fish
capture and trade. In contrast, less than average rainfall during July-September, such as
that in 2003 and 2005, resulted in reduced fish catch and brought in economic depression.
Adequate rains in September-early October is also vital for agriculture, as in the absence of
rain, the ground becomes too hard and dry, hampering the sowing of rice seeds in
November and the planting of saplings in January. Thus inundation of the floodplain till
early or mid-October is necessary for both fishery and agriculture.
Farmers growing summer rice do not use any synthetic fertilizers. They depend on
the natural fertility of the soil which gets replenished annually by alluvial deposits brought
in by the floodwater. It was also noted that the consumption of NPK in Assam as a whole is
very low (6.9 kg/ha) compared to the national average (67.1 kg/ha), and it is still lower in
Barak Valley.
DPR for development of Lakhipur – Bhanga stretch of Barak River for shippingand Navigation
Revised Final Report Page 135
From the month of October, water recedes from the floodplains and the land is
exposed barring a few depressions where some water is retained till about January. These
depressions are often called beels, although this term may be rather loosely used to denote
the whole floodplain as well. The cultivable land is now prepared for agriculture- mostly for
growing summer or boro rice. Private property rights are now re-established in the
floodplain.
However, the major constraint for agriculture is the scarcity of water. In the absence
of any irrigation facilities, the farmers face great difficulty in procuring water. Only those
plots located in the lowest elevations in the floodplain have easy access to water-filled
depressions or small natural water channels that they can impound to obtain water.
Plots in the middle and upper layers of the floodplain suffer from acute water
scarcity. Pumping up water from distant sources is both costly and cumbersome and can be
afforded by few. Thus a paradoxical situation exists where the lower plots have better
access to water but are exposed to a greater risk of inundation by pre-monsoon floods in
April that would destroy the crop. In contrast, the middle and upper plots are relatively safe
from pre-monsoon floods, but are constrained by the scarcity of water in winter.
The situation has worsened over the years as deforestation in the catchments of the
feeder streams and rivers, especially in the hills, has led to soil erosion and deposition of silt
in the watercourses that drain the floodplains. The floodplain lakes that used to retain
water in the dry season have also become progressively shallower due to silt deposition
and/or due to reclamation for agriculture.
Water scarcity has reached such a state that many floodplain farmers, especially
those having land in the middle and upper zones, are converting their land into ‘semi-
natural’ fisheries. Fishes enter these impoundments along with floodwater and are trapped
inside. They are then allowed to grow through the monsoon. The fishes mostly thrive on
natural food in the systems, although some farmers provide some supplementary feeds,
and may also release some additional carp fries or fingerlings. These fishes are harvested in
the post-monsoon and winter. Thus the farmers are desperately trying to earn their

DPR for development of Lakhipur – Bhanga stretch of Barak River for shippingand Navigation
Revised Final Report Page 136
livelihood by opting for fisheries in place of agriculture. Some farmers in the middle and
upper elevations have started growing winter rice, locally called shail or shali, which grows
through the monsoon and is harvested in December.
However, they are also totally dependent on good monsoon rains, failing which the
plants suffer from water stress during October-November. To cope with this problem, some
farmers apply a thin layer of urea in November to enhance maturation of the paddy and try
to save the crop.
The absence of effective and sustainable water resource management in the
floodplains of Barak Valley has led to the pauperization of the fisher-cultivators in this area.
On the one hand, over-fishing has depleted the natural stock and prevented its
regeneration, leading to serious decline in fish density and the size of fishes in the catch. To
counter this, the fishers have gone on reducing the mesh size of the nets to capture small
fishes. This in turn has further depleted the fish stock. On the other hand, agriculture has
also suffered due to water scarcity. The impoverished condition of the floodplain farmers is
reflected in the low per capita income in Chatla and Shonbeel floodplains.
Many farmers including their family members have started migrating to the nearby
cities to find work in construction sites, as rickshaw pullers and as other petty labour. Those
who can afford have opted for small trade. It is indeed deplorable that the womenfolk who
being proficient in weaving, made fish nets, produced dried fish, and husked rice in a fairly
prosperous and largely non-monetized economy, are now compelled to work as manual
labours. It may be seen that a large section of the people are still dependent on fishing and
farming, although a considerable proportion have gone for wage labour in the dry season
instead of farming. However, in the monsoon, they still engage in fishing in the common
property fishing area as it is not only a means for livelihood, but integrated into their
culture. The situation has been exacerbated by the decrease in landholding size, which is
much lower than the Barak Valley average. The productivity of summer rice is also
somewhat low, ranging from c 700-1150 kg/ha against a Barak Valley figure of 1180-1970
kg during 1991-2000.

DPR for development of Lakhipur – Bhanga stretch of Barak River for shippingand Navigation
Revised Final Report Page 137
10.7.2 Plantation
Among plantation crops, Tea and Rubber are the major ones with the turnover of
the former being 77 Lakh Kg. and the latter, about 1 Lakh Kg. The total land area under 27
tea gardens in the district is about 25,000 Hectares, although only about one-third of this
land is under actual tea plantation. Rubber plantation in the district is relatively new and
occupies only a fraction of the land under tea plantation. Most of tea and almost whole of
the rubber output is exported to other states/countries.
10.7.3 Fishing
Karimganj District has huge potential for fishery, being endowed with a large
number of rivers, swamps, ponds and other natural water bodies. There are 49 registered
beels covering a total area of 4,420 Hectares and about 23,535 smaller ponds and lakes
covering another 3,545 Hectares. Besides, there are 7 river based fisheries in operation.
Total Fish production in the district in 1997-98 was 8372.97 M.T. Besides, about 176.338
Million fry and fingerlings were also produced in the same year. In spite of this, the district
is far from being self-sufficient in fish production, particularly, owing to the huge
consumption of the item. Large quantities of fish is imported from distant states of Uttar
Pradesh, Andhra Pradesh and also neighbouring country of Bangladesh.
10.7.4 Farming
Livestock and Poultry occupy an important place in the rural economy and also act
as household assets. Cattle, buffalo, goat, sheep, pig etc are the most common livestock
animals while hen and duck comprise the poultry birds. However, egg production is very
much deficient and therefore imported from other states in large quantity.
10.7.5 Forestry
Timber, Bamboo, Cane, Stone, Sand are the major forest products of the district.
The district has about 54 thousand hectares of forest area covering almost 30% of the total

DPR for development of Lakhipur – Bhanga stretch of Barak River for shippingand Navigation
Revised Final Report Page 138
area. The forests are rich in various costly timbers like teak, sundi, gamari etc. Huge
quantity of bamboo is harvested and supplied regularly to paper mill in the neighbouring
Hailakandi District. However, in the last few years, restrictions have been imposed on
cutting of trees to prevent large scale deforestation and as a result, timber production has
gone down considerably.
10.8 SECONDARY SECTOR
There is no large or medium scale industry in the district except cement and paper
factories. The only sugar mill located at Chargola near Ratabari is closed for more than a
year. A number of industries like textiles, polythene etc. set up in the Badarpur Industrial
Estates a few years back have mostly closed down due to infra-structural problems. All
existing industries in the district are in the small or cottage sector. Tea processing, Food
Products, Bamboo & Cane Products, Saw & Plywood, Weaving etc. are the industries
comprising the entire Secondary Sector of economy. Cane furniture, mats, decoration
pieces manufactured in the cottage industries of Karimganj are supplied to all over India
and are in great demand all over.
10.8.1 Oil & Natural Gas exploration
Oil and Natural Gas Corporation (ONGC) has been engaged in exploration works at
several drilling sites in the district. There are indications of large reserve of natural gas in
the region. Already natural gas is being drilled on commercial basis from one drill site at
Adamtilla in Patharkandi Block. A small gas-turbine based power station with an installed
capacity of 15 MW has been set up at that location by DLF Corporation to generate and
distribute eletricity, which has been functioning for the last 3 years.
10.8.2 Tertiary Sector
The Tertiary Sector of Economy is a key sector constituted by:
Construction (engaging 2.30% of Active Workforce),
Trade & Commerce (9%),
Transport & Communication (3.30%),
Other Services (11.50%)

DPR for development of Lakhipur – Bhanga stretch of Barak River for shippingand Navigation
Revised Final Report Page 139
10.8.3 Trade & Commerce
As per general Census held in 2001 and 2010, around 9% of the active workforce in
Karimganj district is engaged in trade and commerce. Before independence, Karimganj
towm was an important centre for trade and commerce in the entire region due to good
communication links both by rail and by steamer services through what is now Bangladesh.
Direct trade links with Calcutta snapped after partition of the land in 1947 and gradually
the importance of Karimganj as a trading centre also lost its glory. The direct rail service
was totally stopped and the steamer service continued in a limping manner. Presently the
rail link through Badarpur-Lumding-Guwahati-New Jalpaiguri/Siliguri is the only railway link,
albeit a very long one, connecting Karimganj to the rest of the country. Similarly, the
national highway through Badarpur-Shillong-Guwahati is the only viable road link available.
In view of the immense importance of this road link on the entire economy of this region,
the road has been considerably improved, making it more stable, wider and fewer
landslides prone.
Karimganj has to has to depend on the supply from rest of India for most of the
items of daily need, such as food grains, spices, sugar and other food items, textiles &
garments, construction materials, automobiles & auto-parts, stationery items and so on.
The supply of Kerosene, Petrol, diesel, L.P.G., paper etc comes from other parts of Assam.
Among the export items, tea, bamboo & bamboo products, cane & cane products,
forest products like timber & stone, areca nut (betelnut) are the major ones. Internal trade
in the district has been seriously hampered by very bad road conditions, border area
restrictions on trade, low productivity of agricultural sector, poverty of mass population
keeping down demand, low credit disbursement from banks and so on.
However, international trade with Bangladesh has picked up considerably in the
recent years and promises to grow further. At present a large number of items like food
items, fruits, coal and other products of daily use, mostly sourced from outside the district
are exported to Bangladesh through two border points in Karimganj. While Kalibari Ghat on
River Kushiara in Karimganj town is utilised for supplying goods by boats and small

DPR for development of Lakhipur – Bhanga stretch of Barak River for shippingand Navigation
Revised Final Report Page 140
steamers, Sutarkandi border point - about 12 Km away from Karimganj Town is extensively
used for direct road transportation of export items.
An International Trading Centre and Free Trade Zone in Sutarkandi is proposed to
be set up raising great expectations about a new boost to the local economy. Last year,
exports worth about Rs. 50 Crores were carried out through Karimganj Border, which
resulted in considerable foreign exchange earnings.
According to exporters based in Karimganj, given some diversification of traded
goods, a little tax inducements from Government, improvement of roads and other infra-
structure, the volume of border trade can go up manifold from its present level. Apart from
the current products like coal, foodgrains, spices, sugar, fruits and vegetables etc - which
are sourced from outside, many other locally available items like paper, bamboo, stone etc
may have large export potential.
10.8.4 Problems and Prospects
The district suffers from lack of infra-structure and poor communication facilities.
The main sector of economy - agriculture - is primitive in nature with poor productivity. In
the other sectors too, lack of entrepreneurship, low credit-deposit ratio, erratic electricity,
unusable roads during monsoon, periodic floods etc. have stifled development.
High population density (457 per Sq.Km in 1991, 475 in 2001) - which is second
highest in the entire North-East, puts additional pressure on the limited cultivable land. The
problems of transport can be overcome by developing the water ways that shall serve as
the crucial route for trade and commerce.
10.9 WATER QUALITY
Minor drinking water supply schemes in most of the Barak Valley floodplains are
available, including Chatla and Shonbeel. There are very few borewells and these are

DPR for development of Lakhipur – Bhanga stretch of Barak River for shippingand Navigation
Revised Final Report Page 141
mostly located on the outer fringes, near main roads or markets. Inside the floodplains,
people obtain water for drinking and other domestic purposes from river/dugwells. In
Chatla and Shonbeel, around 60 and 67 per cent respectively, of these dugwells are in the
form of shallow and turbid mud holes, while the rest (40 and 33%, respectively) are paved.
Table 10.1 Location of Water Samples taken in River Barak
Enumeration of faecal coliforms in both borewells and dugwells reveal that only
19.6 % of these drinking water sources have less than 10 faecal coliform CFUs (colony
forming units) and may therefore be considered safe to consume. Another 13 per cent have
moderate contamination, having 11-100 CFU faecal coliforms. However, 28.3 and 39.1 % of
the sources have between 101-1000 and more than 1000 CFU faecal coliforms. Only some
of the borewells have low contamination, while all the dugwells sampled are contaminated
to varying degrees. As a result of such heavy and widespread contamination, incidences of
diarrhea are very common in the floodplain villages. Location of water samples taken in
Barak river is shown in Table 10.1 and Table 10.2 shows the water quality parameters
observed for the samples collected.
S.NO. LOCATION LATITUDE LONGITUDE
1 Lakhipur Bridge 22°47'22.8"N 93°00'51.96"E
2 Kushipur 24°47'36.73"N 92°57'14.14"E
3 Silchar Road Bridge 24°49'50.50"N 92°48'18.19"E
4 Rail bridge east of silchar 24°51'6.05"N 92°46'24.71"E
5 Rani Ghat 24°54'1.94"N 92°42'36.55"E
6 Badarpur 24°52'32.65"N 92°35'0.84"E
7 Banga 24°52'47.17"N 92°30'34.21"E
8 Karimganj 24°52'32.03"N 92°21'43.07"E

DPR for development of Lakhipur – Bhanga stretch of Barak River for shippingand Navigation
Revised Final Report Page 142
Table 10.2 Water Quality Parameter For River Barak
PHYSICAL
Sample number 1 2 3 4 5 6 7 8
Colour Silty Silty / Clear Silty Clear Silty Clear Silty Clear
E.C. (μmhos/cm) 208 171 74 127 0 54 69 147
Odour NIL NIL NIL NIL NIL NIL NIL NIL
pH 8.50 8.50 7.22 7.68 6.30 6.85 7.03 7.55
TDS (mg/L) 400 320 205 163 40 68 46 100
Temperature (deg C) 31.7 32.6 26.7 21.8 23.0 18.0 26.0 20.7
Turbidity (NTU) 28.90 6.70 205.0 2.94 1.30 0.20 - -
CHEMICAL
Calcium (mg/L) 27.52 39.9 12.54 21.40 0.29 6.28 12.9 14.98
Chloride (mg/L) 16.00 21.08 39.80 11.29 3.02 2.01 8.50 12.78
Carbonate (mg/L) 0.30 2.40 0.03 0.48 0.00 0.00 0.00 1.33
Bi-carbonate (mg/L) 67.99 111.8 35.35 61.68 9.52 41.48 41.48 61.25
Potassium (mg/L) 1.84 4.25 1.06 1.64 0.40 0.60 1.12 4.22
Magnesium (mg/L) 9.29 40.52 5.26 7.87 0.11 0.40 4.65 7.25
Sodium (mg/L) 4.90 8.15 3.65 5.18 0.90 2.80 3.86 7.39
Sulphate (mg/L) - - - - - - - -
Amm. nitrogen
mg/L
- - - - - - - -
Nitrite+Nitrate (mg/L) - - - - - - - -
Phosphate (mg/L) - - - - - - - -
BOD (mg/L) - - - - - - - -
COD (mg/L) - - - - - - - -
Iron (mg/L) - - - - - - - -
Boron (mg/L) - - - - - - - -
Flouride (mg/L) <0.05 <0.05 <0.05 <0.05 <0.05 <0.05 <0.05 <0.05
CHEMICAL INDICES
Hardness-Ca
(as CaCO3/L) (mg/L)
0.00 0.00 - - - - - -
Total hardness
(as CaCO3/L)
72.63 98.00
SAR(-) - - - - - - -

DPR for development of Lakhipur – Bhanga stretch of Barak River for shippingand Navigation
Revised Final Report Page 143
10.9.1 Biota
River Barak is the second largest river of northeast India. It has a number of
tributaries such as Jiri, Chiri, Madhura, Jatinga, Harang and others on its north and Sonai,
Ghagra, Katakhal, Dhaleswari, etc. on its south bank. Downstream of Badarpurghat, the
river itself bifurcates into two branches, viz., Surma and Kushiara to subsequently flow into
Bangladesh and form a part of the Meghna river system.
Enhanced retention of water is also expected to attract migratory birds that earlier
used to flock to these areas in large numbers in the winter, but whose numbers have
severely declined in the recent years. These include several threatened species such as
Baer’s Pochard (Aythya baeri), Gadwall (Anas strepera), Bar Headed Goose (Anser indicus),
Geylag Goose (Anser anser), Brahminy Duck (Tadorna ferruginea) and others. Besides
bringing about biodiversity conservation, this could also open up the prospects for eco-
tourism and provide gainful employment to the local people in various ways.
An integrated forest restoration and soil conservation in the hills as well as in the
lowlands along with proper management practices in micro-watershed development and
land use planning to prevent silt deposition in water courses. Special efforts should be
made to restore the Barringtonia acutangula forests in the floodplains in order to enhance
water and nutrient retention as well as to attract the potamodromous fishes in larger
numbers to the floodplains because of increased allochthonous food resources. In the
domestic front, microbiologically safe water could be provided through rainwater
harvesting in the rainy season and solar water purification in the dry, sunny days. An
impending ecological, economic and socio-cultural crisis in the Barak Valley floodplains can
only be averted by well-concerted efforts on several fronts with adoption of measures that
should ideally spring from the bottom rather than being imposed from the top.

DPR for development of Lakhipur – Bhanga stretch of Barak River for shippingand Navigation
Revised Final Report Page 144
10.9.2 Molluscs
Benthic macroinvertebrates are common inhabitants of lakes and streams where
they are important in moving energy through food webs. These organisms usually inhabit
bottom substrates for at least part of their life cycle; and they are large enough to be
retained by a mesh size of 200- 500 μm.
A total of 16 (sixteen) taxa were recorded in the eight sampling sites during the
period of study. The molluscan community was represented by two classes, viz.,
Gastropoda and Bivalvia. Gastropoda was represented by two orders, viz., Mesogastropoda
and Basommatophora; three families; six genera; and thirteen species. Class Bivalvia also
had two orders, viz., Unionida and Veneroidea; two families; and three genera with one
species each.
Among the gastropod species, Brotia costula episcopalis ( Lea) was the most
ubiquitous, being present in 7 of the 8 sampling sites. Bellamya crassa (Benson) and Thiara
(Tarebia) granifera (Lamark) also had a fairly wide distribution, as they were recorded at 8
and 7 sites, respectively. On the contrary, Bellamya bengalensis f. typica (Lamark),
Paludomus (P) conica kopilliensis Nevill., and Thiara (Thiara) scabra (Mueller) were found in
2 sites, and Brotia (Antimelania) costula (Rafinesque), Paludomus (P) conica (Gray) and
Indoplanorbis exustus (Deshayes) in 3 sites only. Between these two extremes, species like
Bellamya dissimilies (Mueller) and Paludomus (P) ornatus Benson were recorded in 5 sites
each, while those like Thiara (Melanoides) tuberculata (Mueller) and Lymnaea
(Pseudosuccinea) acuminate f. typical (Lamark) were present in 4 sites each.
The bivalve fauna was less rich with 3 species only. Of these, Lamellidens marginalis
(Lamark) was the most common. The other two species, viz., Parreypsia favidens (Benson)
was encountered in 2 sites, while Corbicula striatella Deshayes was recorded in a single
site. Among the stenoecoeus species, the gastropod Paludomus (P) conica kopilliensis Nevill
was found to be confined to station 1 on river Chiri, a tributary of R. Barak, and station 2
near Kashipur. Till these areas, the river is not much impacted by human interference, at

DPR for development of Lakhipur – Bhanga stretch of Barak River for shippingand Navigation
Revised Final Report Page 145
least in terms of entry of urban sewage.
This perhaps reflects the pollution sensitive nature of this species. Similarly,
Corbicula striatella (Deshayes ) was found only at station 5 on R. Ghagra. This south bank
tributary of R. Barak that forms the extensive Chatla floodplain wetland does not have any
major urban centres in its catchment and mainly flows through tea garden areas. It is,
therefore, relatively free from the adverse effects of large volumes of untreated sewage.
Activities like stone and sand quarrying are also negligible in this area.
The distributional pattern of Bellamya bengalensis f. typica (Lamark) is interesting as
it is found in R. Barak at Kashipur, which is a relatively unimpacted site, and in R. Kushiara
at Karimganj, which is highly impacted due to the entry of untreated urban sewage, but not
in any other site. Similarly, Parreypsia favidens (Benson) was recorded only at station 4,
which is on R. Barak near Sadarghat at Silchar, and in R. Ghagra (station 5), which is a
relatively undisturbed site.
Thiara (Thiara), scabra (Mueller) was only recorded at station 4 and station 5. It can
probably be suggested that this species may be a pollution tolerant one that thrives only at
organically enriched stretches of rivers. R. Barak at Silchar near Sadarghat (station 4)
harboured a high molluscan diversity in terms of number of taxa. Higher biodiversity in the
midstream might have occurred due to a broad meander of the river.
Among the different sites, the diversity of mollusca was found to be low in R.
Katakhal as well as R. Barak at Katakhal because of severe and extensive bank erosion
which resulted in sedimentation of the river bed adversely affecting the benthic
communities. Thus it is obvious that both gastropod and bivalve communities found to
inhabit the different sites on R. Barak and its tributaries are represented by a range of
species with differential response to habitat degradation.

DPR for development of Lakhipur – Bhanga stretch of Barak River for shippingand Navigation
Revised Final Report Page 146
10.9.3 Flora
Indian flora fluctuates from the Western Himalayan and Assamese, from the species
of the Indus Plain to those of the gangetic plain, from the Deccan and Malabari to the
vegetation of the Andamans. The floral treasure ranges from the Alpine to the temperate
thorn, from the coniferous to the evergreen, from scrubs to deciduous forests, from thick
tropical jungles to cool temperate woods.
The Western Himalayan biosphere is bouncy with Chirpine and other conifers
deodar, blue pine, spruce, silver fir, and junipers. The Eastern Himalayan region consists of
oaks, laurels, maples, rhododendrons, alder, and birch and dwarf willows. The Assam
region is full of evergreen forests with lots of bamboo and tall grasses.
10.10 ENVIRONMENTAL IMPACT ASSESSMENT
Generally the development of waterways causes various environmental problems
which may have effects on land, water and air. The main activity which would cause the
effects are dredging, ship traffic and infrastructure development.
10.10.1 Impact of movement of barges
From the analysis of the projected traffic, it has to be presumed that no hazardous /
toxic materials are proposed to be transported. Edible oil to an extent of 12000 tonnes and
fertilizer to an extent 21000 tonnes per annum will form part of the cargo and this to be
catagorised hazardous material due to its inflammable and poisonous nature. Spillages of
oil may occur due to accidents and this would pose a problem from an environmental
angle. In the past it has been observed that such spillages have caused on the surface of
water which has adversely affected the aquatic and terrestrial ecology of the river.
Therefore burning spilled oil will not be the solution for oil removal.

DPR for development of Lakhipur – Bhanga stretch of Barak River for shippingand Navigation
Revised Final Report Page 147
Burning of oil will also cause air pollution problems due to emission of carbon
monoxide (CO), sulphur di oxide (SOX), particulate matter, Hydro Carbons (HC) and smoke
in the area. Therefore to overcome these problems, skimming boats are recommended and
oil removal traps are suggested. Bacterial/ biological method could be tried for oil removal.
The handling of chemicals, cement and other materials may cause water and air
pollution problems near the food grains, pulses, coal, edible oil, iron/steel, cement, jute,
fertilizers, provisions& household goods, forest products, paper & paper goods, machinery
& parts, stone boulders and chips and other miscellaneous commodities.
These materials will be lifted and transported from vessels to storage area
manually/ mobile cranes, trucks. It is recommended that these materials should not fall in
the water or suspended in the air.
10.10.2 Impacts of dredging on the river environment
In gravel bed rivers there are permanent features which remain stable over a range
of flows; for example, pools, riffles, point bars, floodplains and bankside vegetation.
Dredging the channel bed with a mechanical digger usually destroys, or at least disrupts,
these features, creating a more uniform, less stable and less diverse environment.
The suspended sediment load and turbidity of a river are increased during the
removal of bed or bank material and as a consequence other water quality characteristics,
such as temperature, are affected. The effects may persist for some distance downstream.
Settling out of the material in suspension will alter the composition of the substrate. It has
to be noted that in the river Barak there is high amount of suspended material and this may
slightly rise. The effect of the rise in suspended material has to be studies in detail. This has
to involve studies in water quality for all the four seasons.
Deposition of dredged material on the bankside effectively creates a barrier
between the floodplain and the river. In addition, this material may be eroded and washed
back into the river if left unconsolidated. So proper protective measures has to be made to
secure that there will not be flooding and also subsequently there shall be an effective
barrier to prevent the rivers flooding during the monsoons.

DPR for development of Lakhipur – Bhanga stretch of Barak River for shippingand Navigation
Revised Final Report Page 148
The loss and alteration of natural habitats caused by dredging operations can have
ecological impacts, in short term. But the flora-fauna studies imply that it will not be the
case for long term. It has to be noted that the fishing grounds may get affected due to the
movement of barges as the area under fishing now will be used for the barge traffic.
10.10.3 Impacts of dredging on in-stream biota
River Barak is the largest river in north east part of India (length 900 km). The
project is 140.25 km from Karimganj to Lakhipur. Most part of the river bed consists of clay
and mixed sand and in some stretches rock out crops are visible. As the hydrographic
survey revealed available depth from 0.2 to 18.6 m with some stretches of visible rock out
crops river conservancy works viz bandalling and dredging have been recommended at this
stage.
The dredging of river might cause many effects due to re-suspension of dredged
material. These effects are higher concentration of toxic substances in water; reduce
available oxygen levels and sunlight penetration. These effects might have further impacts
on bathymetry of river, river fisheries, eutrophication and food resources. The dredged
material should be disposed off on appropriate sites which have to be identified through
field surveys as the part of the river will be dredged at the identified points, the resultant
effect on the river water quality will not be significant. In view of the above in order to
keep the environment free from pollution by the dredged soil, it is recommended that
these soils be disposed off in low lying areas adjoining the river course providing city areas
or any other areas without creating environmental degradation.
10.10.4 Fish
Due to the availability of fresh water in river Barak, a number of fish species are
found in the river. Part of the river water will be utilized for the purpose in a navigation
channel. This channel could not be utilized for fisheries purposes due to vessel traffic. The
fish will migrate to other streams. However other portion of the river could be used for
fisheries purpose. The navigation would have insignificant effect on fishery development in
river Barak.

DPR for development of Lakhipur – Bhanga stretch of Barak River for shippingand Navigation
Revised Final Report Page 149
Apart from the above mentioned, pollution substrate removal will inevitably affect
spawning, which takes place in gravel substrates and juvenile fish which inhabit the
substrate. Substrate siltation is the settling of fine sediment on to the substrate. This is
known to affect the spawning, incubation and emergence of certain fish species. Fine
sediment can reduce the suitability of gravels for spawning and as a habitat for young fish
by:
Reducing the inter-gravel flow and therefore the oxygen supply, and increasing the
temperature in the gravel
Infilling the interstitial spaces and thus trapping eggs and young fish;
Reducing cover and food source for mature fish; females may be prevented from
digging and laying eggs.
Increased turbidity reduces light penetration and therefore primary productivity,
which has a knock-on effect throughout the food chain. Most fish species will migrate
under increased turbidity conditions and many will have a reduced capacity to find and
capture prey.
Channel morphology alteration can have a number of impacts on local fish
populations:
Disturbance of bank vegetation or the substrate removes cover and shade; this
makes fish more susceptible to predators, and increases light penetration and
hence water temperature, which will cause fish to migrate;
Loss of sites in gravel substrates are usually situated at the upstream end of
riffles/downstream end of pools, where there is a downward movement of water;
Reduction in areas of shelter from high velocity flows.
10.10.5 Macroinvertebrates
Species such as mayflies (Ephemeroptera), caddisflies (Trichoptera) and stoneflies
(Plectoptera) are adapted to live in crevices beneath and between stones, particularly in
riffle areas. The presence of silt on stones is capable of reducing invertebrate abundances
for prolonged periods. The major impacts of siltation are to increase species mortality and
to alter community structure by:

DPR for development of Lakhipur – Bhanga stretch of Barak River for shippingand Navigation
Revised Final Report Page 150
Blocking interstitial spaces, causing oxygen-depletion and hence species mortality;
Coating stones and thereby reducing the number of attachment points for larvae
and reducing their feeding success;
Allowing alternate benthic species to survive in preference to attachment species;
Reducing interstitial volume available to invertebrates.
Suspended sediment and turbidity increases will:
Reduce primary productivity, thus reducing the amount of energy available to
macroinvertebrates and organisms higher up the food chain;
Tend to induce invertebrate drift, thus reducing instream benthos populations in
the dredged reach and possibly also downstream;
Clog the food filtering and trapping apparatus of stream insects.
There is limited information on the physical habitat requirements of macro
invertebrates, but shallower water depth will favour some species due to the associated
increase in temperature.
10.10.6 Other wildlife
No forest is destroyed either due to navigation or establishment of port facilities.
Reduced primary productivity and reduced invertebrate and fish populations can affect
local mammal and bird populations which rely on these sources of food.
Material deposited on the river banks affects the hydrological continuity which
exists between the river channel and the floodplain. Dredging may tend to disturb or
destroy suitable feeding and nesting sites of birds.
Amphibians may lose habitat diversity and spawning areas, though drying out may
also eliminate predatory fish such as pike (Esox lucius).
10.10.7 Vegetation
River wetland plants are able to survive in a range of habitats. Some aquatic plants,
such as bladderworts (Utricularia), prefer slow-flowing or stagnant deep water; others,
such as narrow-leaved water parsnip (Berula erecta), favour fast-flowing shallow water. On
the river banks, species like pendulous sedge (Carex pendula) inhabit the area above the
water-level, while others, including small-sweet grass (Glycerine declinata), prefer

DPR for development of Lakhipur – Bhanga stretch of Barak River for shippingand Navigation
Revised Final Report Page 151
submerged conditions. Dredging operations can physically disturb, or remove entirely, any
vegetation situated instream or upon the banks. Spraying of herbicides, such as glyphosate,
will drastically reduce plant species diversity and, while reducing the number of certain
problem species, it can have a knock-on effect upon fauna and other plant life.
10.11 REHABILITATION
There will be some impact on the settlements due to the construction of new
terminals with suitable infrastructural facilities. It is estimated that the land required for
the major terminals will be of the order of 2.5 hectares. Some acquisition of land may also
become necessary, but no serious problems of deforestation or displacement of human
dwellings or settlements are anticipated. So also no serious disturbance of the natural
habitats for flora and fauna is anticipated.
10.12 ALTERNATIVE APPROACHES AND RECOMMENDATIONS
The impacts of dredging work can be minimised by a number of techniques. Bank
stabilisation and cover can be improved at water-level by the placement of temporary log
or board overhangs, artificial metal or fibreglass overhangs, tree or brush retards and
riprap. These may be used in conjunction with the re-vegetation of deposited material on
the bankside. The structures can then be removed when the banks become stable and
cover is re-established.
Deposition of dredged material should be away from the channel edge to limit
damage to streamside habitats. This also allows a degree of flooding to occur on the
floodplain, thereby creating opportunities for wet grassland, scrub/wet woodland,
wetlands and seasonally grazed rough grass. Where possible, biotechnical engineering for
example geotextiles may be used to help stabilise the material and aid re-colonisation.
Other possibilities include: drying and spreading the spoil over adjacent land, which can
improve soil fertility in some cases, but may also smother important flora and habitats;
excavating a trench and infilling it with spoil, thus minimising disturbance to agriculture and
the local environment; dumping off-site is possible but expensive, using spoil to create
artificial wetlands.

DPR for development of Lakhipur – Bhanga stretch of Barak River for shippingand Navigation
Revised Final Report Page 152
If rip-rap is used for bank stabilisation, it must extend below the toe of the
underwater slope of the bank to prevent undercutting. The structure can also be covered
by soil and re-planted to improve habitat diversity and aesthetic value.
Re-creation of morphological diversity can be achieved by re-instating the pool-riffle
sequence. This is possible with careful use of instream deflectors and boulders to
encourage areas of scour and deposition. Morphological characteristics similar to those
prior to excavation should be created, particularly with regard to the substrate
The use of settling ponds and bunds creates a pool of slow-flowing water, allowing
sift and sand to settle out. Although this reduces the downstream impacts during dredging
works, the dredged reach does not benefit, and there may be further downstream impacts
once the bunds are removed.
Disturbance can be minimised if mechanical excavators work from one bank. If the
channel is too wide, the digger must work within the channel. Disruption can be minimised
by diverting the river down one side of the channel and dredging the other side while it is
'dry. This can be used for the areas where the depth is less and has the prospect to be
developed as the main channel for transport. During flood the old channel can also act as
flood overflow stream. Smaller plant equipment generally limits the level of impact on
bankside and instream habitats.
Selective scrub and vegetation removal is preferable to total clearance. Similarly,
sensitive spraying of herbicide can be achieved. The removed vegetation should be stored
and replaced on unconsolidated banks, or native species re-planted. This should be timed
to allow the vegetation to take root. If the channel margins are left untouched, a small
amount of marginal vegetation and undredged bed will allow more rapid recolonisation.
Ultimately, implementation of mitigation techniques involves a trade-off between
their lesser impacts and those of a more serious nature arising from dredging within the
active channel. All work should be timed to avoid sensitive periods in the life-cycles of
instream and riparian flora and fauna. For example, salmonids use gravels for spawning in
the autumn, egg incubation in the winter and emergence of young fish in the spring.

DPR for development of Lakhipur – Bhanga stretch of Barak River for shippingand Navigation
Revised Final Report Page 153
There is a dearth of empirical information relating to the effects of dredging
operations on Indian rivers. The monitoring of future works would assist in drawing up
further management guidelines aimed at reducing environmental impacts. There remains
the need for a more strategic, catchment-based and environmentally sensitive approach to
river maintenance.
10.13 PROBABLE AREAS OF COMBINED EFFECT DUE TO DEVELOPMENT OF WATER WAYS
Upper catchment – pristine
This picture shows a typical upper catchment stream in a healthy condition. Many of
the features (vegetation, rocks, the pool shape and slope) seen in this picture show how a
wide variety of animal and plant life (biodiversity) are supported in this type of
environment.
It’s also a good idea to think about what features resulting from human impacts on
our waterways are not present in this picture (for example, vegetation removal, stock
access and discharges).
Trees
The amount and location of vegetation (particularly trees) along waterway edges
fulfils a number of functions (listed below) which help support other plant and animal life in
waterways.
Root structures provide bank stability (erosion control).
This in turn improves water clarity due to stable soils not crumbling into the water.
Clearer water enables aquatic prey and predators to see, navigate or hide.
Shade from tree foliage lowers temperatures. High temperatures interfere with
oxygen water uptake and the instream temperature range influences animal
distribution. For example, if the temperature is too high (greater than 25 °C) then
animals become stressed and die.
Trees provide a habitat for animals living in and around the stream. What places can
you see in the picture which would provide a home for these animals?
Trees can be a food source for animals in and around the stream. For example, the
branches lying in the stream.
Different layers of vegetation at different levels combined with vegetation stability

DPR for development of Lakhipur – Bhanga stretch of Barak River for shippingand Navigation
Revised Final Report Page 154
help prevent weeds, floral plant pests, leaves and debris clogging up the area and
affecting native plant growth.
Decaying matter provides another food source and contributes to the chemical
balance of the soil.
Tree canopies block rain, reducing run-off from surrounding land use.
Bird life diversity is improved due to birds spreading seeds which increase new
growth of native trees and shrubs.
Areas with a large number of trees also have a beneficial effect on the water cycle,
including oxygen release (photosynthesis) and increasing the release/loss of water
vapour to the atmosphere as moisture evaporates from tree foliage.
Rocks (substrate)
Rocks of various sizes provide shade/shelter/protection for fauna.
Erosion control is created by less mobile instream rocks and large rocks which
provide bank stability. Rock composition also influences erosion rate and chemical
balance of the water.
The gaps between rocks provide habitat space and rock variety influences flow
patterns in the water (slow, medium, fast), creating a choice of different habitats.
Exposure to light and atmospheric moisture affects the amount of
mosses/liverworts and algal cover present. These organisms are a food source for
some of the animals living in and around the stream.
Water flow
Water flow is affected by the meandering nature of channel – how wide it is and its
twists and turns. These channel characteristics offer many different niche options
for aquatic life. For example, rapids (riffle), running water areas and calmer pool
environments provide a number of different habit options for aquatic fauna.
Typically streams have V-shaped channels (not visible in these pictures). This
influences water speed and the level of stream bank erosion.
The slope or gradient of the stream determines run off speed (visible as rapids or
‘riffles’) which enables oxygen uptake in the water.
Natural high rainfall events. Water coming into and being retained in the upper

DPR for development of Lakhipur – Bhanga stretch of Barak River for shippingand Navigation
Revised Final Report Page 155
catchment influences the time taken for peak water levels to be reached. These
water levels also influence the rate at which water subsides further downstream.
Poor use of the land (for example, widespread tree removal, inappropriate culvert
installation) can lead to increased erosion and flood risks to land and property
below.
Other factors
A large buffer zone between waterway and its surrounding land use provides a good
natural filter of nutrients.
Controlling or eradicating animal pests such as possums, ferrets and stoats helps to
establish and maintain populations of mainly ground-dwelling native birds. There is
also less risk of diseases being passed on (for example, Bovine Tuberculosis).
The steep gradient restricts people’s access to the upper reaches of the stream,
lessening the chance of human activities impacting on the area.
10.13.1 Middle catchment – moderate impact
This picture shows how biodiversity has been affected in some way by human
activity which has changed the natural features of the stream (for example, farming). It is
important to distinguish these effects from natural processes.
Trees
Fewer trees around this stream means less shade and a rise in instream
temperature. There is also more available light, increasing the growth of algae and
other organisms that live attached to underwater surfaces.
Fewer overhanging trees means less fallen debris for as a food source for animals in
and around the stream. The soil’s chemical balance is affected and there are few
shaded habitat areas.
The water clarity is slightly less than that of the pristine stream. This is because
there is a greater flow of water moving through the channel, stirring up mud and
increasing the amount of suspended sediment in the water.
The rolling hills in the background are an example of how geographical features can
increase the chances of runoff with contaminants ultimately ending up in the
stream.

DPR for development of Lakhipur – Bhanga stretch of Barak River for shippingand Navigation
Revised Final Report Page 156
The exotic (non-native) forest in the background demonstrates land uses which
aren’t ‘environmentally’ suited to dairy herd or dry stock grazing and represent a
quick ‘remedy’ to land stabilisation (particularly near headwaters).
A buffer zone showing riparian planting between land use and the water
demonstrates the value of blocking nutrients from runoff (particularly Phosphorus
which is bound up in sediment). The plants along the banks of the stream take up
the nutrients instead outside the instream environment.
The banks are still stable as the hardy grasses are able to withstand high water
levels yet still bind the soil together.
Rocks
Rocks in this section of the stream are smaller in size in comparison with the pristine
catchment, due to natural abrasion. However channel alteration can influence flows
which in turn affects the natural erosion rate.
Most rocks are of similar sizes, limiting the variety of instream habitats.
The habitat is less stable because smaller rocks are more mobile.
Water Flow
There is greater water flow in the stream at this catchment level due to other
streams flowing into it (tributary contribution). This leads to higher erosive energy
along the streambanks, threatening stability.
Some twists in the stream’s path (‘meanders’) are still apparent, providing variable
habitat to animals in fast, slow, deep and shallow flow areas. Discuss how animals
also adapt to these conditions, for example, mayflies and stoneflies that thrive in
fast flows have flattened bodies.
Nutrient and sediment runoff into the stream is increased by the number of
contributing tributaries within the catchment, particularly by those not protected
from runoff themselves.
Other Factors
Note that dairy stock is fenced off from the stream, preventing effluent getting
directly into the waterway.

DPR for development of Lakhipur – Bhanga stretch of Barak River for shippingand Navigation
Revised Final Report Page 157
Waterways which are surrounded by land easily accessed by people can suffer from
the effects of related activities. For example, nearby houses, roading, quarrying,
water extractions (irrigation), water discharges (treated effluent systems) and the
possible introduction of plant and animal pests such as mosquito fish and rats.
10.13.2 Lower catchment – high impact
This last picture shows features common to rivers (not streams) nearing the coast.
This river contains a large volume of water from all contributing tributaries. High
flows can have flooding risks for urban areas nearby. Flooding issues to consider
include stopbanks and flood gates.
The lower land gradient results in water lying around for significant amounts of
time. Consider how flooding issues relate to land use considerations.
This river’s water is murkier than that of the other two catchments. This is caused
by the change in substrate (mainly sand/silt substrate) which is highly mobile.
There are less trees and shrubs on the banks, increasing water temperature and
instream productivity.
Inherited problems (from upstream tributaries), for example, sediment load from
upstream erosion and high number of discharges to water.
This picture also highlights the importance of wetland type flora to birds and native
fish species.
Stock exclusion is also depicted and the flatter nature of the land contour has
implications for runoff.
Water velocity and possible tidal (saline) effects may affect river fauna and flora.
Discuss flood prevention measures (flood gates, spill-ways and stop banks) (not
visible in this picture).
Discuss how native fish migration can be assisted. For example, clear passage
throughout the waterway allows fish to get through to the upper catchment while
perched culverts hinder them.
Increased recreational use can affect a river, stirring up sediment and disturbing
animals and plants in and around the river area.
Flow characteristics are very similar – mainly ‘run’ type flow.
DPR for development of Lakhipur – Bhanga stretch of Barak River for shippingand Navigation
Revised Final Report Page 158
10.13.3 Advantages of the proposed project
Development of inland water transport has to be encouraged considering the
comparative advantage over other means of transport. It is an established fact that it
requires less power to move an equivalent tonnage on waterways and that a barge has the
lowest relative dead weight and minimum functional resistance.
One horse power can move 150kg on road, 500kg on rail and 4000kg on water. A
recent study on water transport has established that the fuel consumption per ton km for
water transport is 0.0056 liter of HSD and that of rail and road is 0.01 and 0.4 liter
respectively. Thus water transport has a clear margin over all other mode of transport in
terms of energy consumption and is therefore very efficient in fuel consumption. It has to
be appreciated that fuel consumption for water transport will be comparatively less in
relation to transport by rail or road. This will mean an overall reduction of pollution apart
from being a general economic benefit to the nation. Apart from fuel saving, the air
pollution will be reduced significantly in the region due to change in the mode of
transportation from surface to water navigation. This will have a positive impact on the
quality of air and consequently on the environment.
However certain pollutants such as CO, NOX, HC and SPM emitted from engine
exhaust will increase in and around the river. It is therefore proposed to use control devices
at the exhaust pipe such as after burners, catalytic converters exhaust gas diluter/
recirculators etc., to avoid air pollution problems from handling of materials appropriate
chute are recommended from ship to storage.
10.13.4 Conclusions and recommendations.
Taking into consideration all environmental aspects involved for development of
IWT from Karimganj to Lakhipur, there is not much room for any significant negative impact
as per the following:

DPR for development of Lakhipur – Bhanga stretch of Barak River for shippingand Navigation
Revised Final Report Page 159
There would be considerable reduction of pollution from vehicular traffic when
inland water transport is developed to take over a major portion of the road traffic.
There would be considerable savings in cost of fuel foreign exchange in so much as
water transport is quite energy saving.
The conservancy measures required for development of navigation do not cause
any permanent changes in the river regime, nor would it interfere with other
activities and schemes proposed to achieve other objectives.
DPR for development of Lakhipur – Bhanga stretch of Barak River for shippingand Navigation
Revised Final Report Page 160
CHAPTER-11
CONCLUSION AND RECOMMENDATIONS
11.1 GENERAL
The viability of Island Water Transport project for introduction of navigation on any
waterway can be judged by both technically and commercially. The technical viability of
the project can be assessed based on availability of discharges to maintain navigable depth
in a design channel suitable to ply design vessel. The commercial viability of the project
can be gauged based on traffic potential and its growth over the project period and return
on investment made besides several others socio-economic benefits such as employment
generation, poverty alleviation in rural areas and so on. The recommendation for
implementation of the project is based on the trade-off between costs to be incurred and
benefits derived.
11.2 STRATEGIC JUSTIFICATION
IWT is an all-weather and reliable mode of transport, which is not only cost
effective and environment friendly but also best suited for bulk goods, Over Dimensional
Cargo (ODC) and hazardous cargo. The Inland Water Transit and Trade Protocol (IWT&T)
Routes connect Karimganj on Barak with Haldia and Kolkatta.
Navigation upstream of Karimganj is not being done on all-year-round-basis, as the
river does not have adequate depth. Once the waterway is declared as National
Waterway, existing terminals at Karimganj and Badarpur on Barak River can be used
effectively and the Barak River can be further developed up to Lakhipur for movement of
cargo by IWT mode.

DPR for development of Lakhipur – Bhanga stretch of Barak River for shippingand Navigation
Revised Final Report Page 161
11.2.1 Distance Advantage over Other Modes of Transportation to NE Region
As the proposed stretch is in Assam, its development will cater to the
transportation requirement of Manipur, Mizoram, Nagaland, Tripura and Arunachal
Pradesh also. The development of river Barak would provide an alternate connectivity to
these States, which are dependent on only road/rail connectivity passing through the
narrow ‘chicken neck’ at Siliguri.
Generally between an origin and destination, the river routes have longer length
compared to road and rail. However, in case of south Assam and adjoining States of NER,
the river distance between Kolkatta and various stations on Barak River through
Bangladesh waterways under IWT & T Protocol is less than the rail and road routes which
pass through the Chicken Neck bypassing Bangladesh. Comparison of such distances is
given below.
Transport Mode Road (in km) Rail (in km) IWT (in km)
From Kolkatta to
Karimganj 1488 1384 1110
Badarpur 1468 1363 1140
Silchar 1498 1393 1199
Lakhipur 1531 NA 1250
11.2.2 Alternate Mode of Transport
At the moment, transport service is rendered mainly by road and rail transport in
the influence zone of the project area. The goods are transported with extreme
difficulty/delay due to traffic congestion and longer road routes. The waterway also has a
distance advance over rail and road modes. Thus, this development will provide vital
alternate mode of transport to this NE region.

DPR for development of Lakhipur – Bhanga stretch of Barak River for shippingand Navigation
Revised Final Report Page 162
11.2.3 Port- hinterland Connectivity
The proposed waterway shall provide port-connectivity to a vast area of north-east
through the existing Indo-Bangladesh Protocol Route.
11.2.4 Environment Friendly and Safe Mode
The IWT mode being more fuel efficient and less polluting than road
transportation, increase in transportation by this mode shall help in reduced air pollution,
noise pollution, besides being safer. It is also best suited for transportation of bulk goods,
ODC and hazardous cargo.
11.3 SYNOPSIS OF THE STUDY AND ANALYSIS
The following sections summarize the outcome of studies carried out in technical
and financial aspects.
11.3.1 Traffic Study
The traffic survey conducted in hinterland of river Barak have shown that about 12
lakhs tonne of the traffic has been identified for movement in the base year (2012-13) and
the projected traffic for the year 2025-26 will be around 30 lakhs tonnes through Lakhipur,
Silchar, Badarpur and Karimganj IWT Terminals. Inland Water Transport terminals are
recommended at two locations viz, Lakhipur and Silchar and the existing termianls at
Badarpur and Karimganj are proposed for upgradation to handle the projected traffic on a
more conservative side.

DPR for development of Lakhipur – Bhanga stretch of Barak River for shippingand Navigation
Revised Final Report Page 163
11.3.2 Thalweg Survey & Hydrology Study
The hydrographic survey and hydrological investigation carried out on river Barak
for a length of about 121 km from from Lakhipur to Bhanga have revealed that the
waterway is feasible for navigation for about 300 days in a year (80% of the days per
annum) till Silchar and 240 days till Lakhipur based on the discharge study for the dredged
channel. The design channel recommended for development is with LAD of 1.6m, bottom
width 40 m which is suitable to ply 300 tons vessel.
11.3.3 Development Cost and Cost-Benefit Analysis
The capital cost for development of the system components of the project viz.,
development of the design waterway, construction of IWT terminals and procurement of
vessels has been worked out as Rs 123.36 crores and the estimated operating cost per
annum is Rs 3.16 crores for the base year 2012-13.
The cost benefits analysis and financial internal rate of return (FIRR) on investment
have revealed that the returns on the project are encouraging. However, the economic
internal rate of return (EIRR) on the project is worked out as 27.73 %. The economic
appraisal and the resultant EIRR clearly indicate that investment on development of IWT
on Barak River will be economically viable thorough the cut of rate is 12% as set out by the
planning commission considering the inherent advantages of IWT mode of transport. The
results need to be interpreted and used with care especially because of the various non-
quantifiable benefits of IWT.
The consideration of the project for implementation may be viewed from the point
to the fact that if investment are made in the development of IWT-a fuel efficient mode,
the associated cost of moving the projected traffic volumes by IWT instead of road
transport would cost less to the economy thorough the preferred opportunity cost of
capital as set out by the Planning Commission, Government of India is 12%, the following
advantages of IWT need to be given due weightage while taking appropriate investment

DPR for development of Lakhipur – Bhanga stretch of Barak River for shippingand Navigation
Revised Final Report Page 164
decisions.
Higher unit capacity per unit fuel consumption of IWT vis-à-vis road.
Pollution levels created by IWT for moving a unit quantity are much less when
compared to road.
IWT is almost accident free.
Further the Barak waterway can be developed as international waterway since the
river also traverse in Bangladesh territory. From this angle, the bilateral trade between
India and Bangladesh would be further strengthened for which certain traffic has already
been identified and considered in the study. Another important aspect need to be
considered is that the Barak River will also become a feeder waterway to National
Waterway No.2 once developed.
In the context of ever increasing fuel demand in the transport sector, mainly road
transport which is least fuel efficient, there is pressing need to promote fuel efficient
modes like IWT and recommend measures to increase its share in the total freight
movement. This will go a long way in containing energy demand and saving scarce foreign
exchange reserves.
In the light of the above, it is recommended that the Barak waterway should be
developed for IWT operations by Inland Waterway Authority of India, the apex body for
development of waterway in India. The integrated Barak waterway with National
Waterway 2 may further enhance its viability. Given the above, it is recommended that the
IWT systems should be taken up for development of local/regional economy as this mode
has great potential in terms of employment generation and other socio-economic
developments in North Eastern States of India.

DPR for development of Lakhipur – Bhanga stretch of Barak River for shippingand Navigation
Revised Final Report Page 165