Chapter 1 Graphs and Functions...37. The coordinates of the midpoint are: (,) ,121 2 22 3544, 22 80,...
125
1 Copyright © 2016 Pearson Education, Inc. Chapter 1 Graphs and Functions Section 1.1 1. 0 2. ( ) 5 3 8 8 −− = = 3. 2 2 3 4 25 5 + = = 4. 2 2 2 11 60 121 3600 3721 61 + = + = = Since the sum of the squares of two of the sides of the triangle equals the square of the third side, the triangle is a right triangle. 5. 1 2 bh 6. true 7. x-coordinate or abscissa; y-coordinate or ordinate 8. quadrants 9. midpoint 10. False; the distance between two points is never negative. 11. False; points that lie in quadrant IV will have a positive x-coordinate and a negative y-coordinate. The point ( ) 1, 4 − lies in quadrant II. 12. True; 1 2 1 2 , 2 2 x x y y M + + = 13. b 14. a 15. (a) quadrant II (b) x-axis (c) quadrant III (d) quadrant I (e) y-axis (f) Quadrant IV 16. (a) quadrant I (b) quadrant III (c) quadrant II (d) quadrant I (e) y-axis (f) x-axis 17. The points will be on a vertical line that is two units to the right of the y-axis.
Transcript of Chapter 1 Graphs and Functions...37. The coordinates of the midpoint are: (,) ,121 2 22 3544, 22 80,...
1 Copyright © 2016 Pearson Education, Inc.
Chapter 1 Graphs and Functions
Section 1.1
1. 0
2. ( )5 3 8 8− − = =
3. 2 23 4 25 5+ = =
4. 2 2 211 60 121 3600 3721 61+ = + = = Since the sum of the squares of two of the sides of the triangle equals the square of the third side, the triangle is a right triangle.
5. 12
bh
6. true
7. x-coordinate or abscissa; y-coordinate or ordinate
8. quadrants
9. midpoint
10. False; the distance between two points is never negative.
11. False; points that lie in quadrant IV will have a positive x-coordinate and a negative y-coordinate. The point ( )1, 4− lies in quadrant II.
12. True; 1 2 1 2,2 2
x x y yM + + =
13. b
14. a
15. (a) quadrant II (b) x-axis (c) quadrant III (d) quadrant I (e) y-axis
(f) Quadrant IV
16. (a) quadrant I (b) quadrant III (c) quadrant II (d) quadrant I (e) y-axis (f) x-axis
17. The points will be on a vertical line that is two units to the right of the y-axis.

Chapter 1: Graphs and Functions
2 Copyright © 2016 Pearson Education, Inc.
18. The points will be on a horizontal line that is three units above the x-axis.
19. 2 21 2
2 2
( , ) (2 0) (1 0)
2 1 4 1 5
d P P = − + −
= + = + =
20. 2 21 2
2 2
( , ) ( 2 0) (1 0)
( 2) 1 4 1 5
d P P = − − + −
= − + = + =
21. 2 21 2
2 2
( , ) ( 2 1) (2 1)
( 3) 1 9 1 10
d P P = − − + −
= − + = + =
22. ( )2 21 2
2 2
( , ) 2 ( 1) (2 1)
3 1 9 1 10
d P P = − − + −
= + = + =
23. ( )( )( )
221 2
22
( , ) (5 3) 4 4
2 8 4 64 68 2 17
d P P = − + − −
= + = + = =
24. ( )( ) ( )
( )
2 21 2
2 2
( , ) 2 1 4 0
3 4 9 16 25 5
d P P = − − + −
= + = + = =
25. ( )2 21 2
2 2
( , ) 6 ( 3) (0 2)
9 ( 2) 81 4 85
d P P = − − + −
= + − = + =
26. ( ) ( )2 21 2
2 2
( , ) 4 2 2 ( 3)
2 5 4 25 29
d P P = − + − −
= + = + =
27. ( )221 2
2 2
( , ) (6 4) 4 ( 3)
2 7 4 49 53
d P P = − + − −
= + = + =
28. ( ) ( )2 21 2
2 2
( , ) 6 ( 4) 2 ( 3)
10 5 100 25
125 5 5
d P P = − − + − −
= + = +
= =
29. 2 21 2
2 2 2 2
( , ) (0 ) (0 )
( ) ( )
d P P a b
a b a b
= − + −
= − + − = +
30. 2 21 2
2 2
2 2 2
( , ) (0 ) (0 )
( ) ( )
2 2
d P P a a
a a
a a a a
= − + −
= − + −
= + = =
31. ( 2,5), (1,3), ( 1,0)A B C= − = = −
( )
( )
( )
2 2
2 2
2 2
2 2
2 2
2 2
( , ) 1 ( 2) (3 5)
3 ( 2) 9 4 13
( , ) 1 1 (0 3)
( 2) ( 3) 4 9 13
( , ) 1 ( 2) (0 5)
1 ( 5) 1 25 26
d A B
d B C
d A C
= − − + −
= + − = + =
= − − + −
= − + − = + =
= − − − + −
= + − = + =
Verifying that ∆ ABC is a right triangle by the Pythagorean Theorem: [ ] [ ] [ ]
( ) ( ) ( )
2 2 2
2 2 2
( , ) ( , ) ( , )
13 13 26
13 13 2626 26
d A B d B C d A C+ =
+ =
+ ==
The area of a triangle is 12
A bh= ⋅ . In this
problem,

Section 1.1: The Distance and Midpoint Formulas
3 Copyright © 2016 Pearson Education, Inc.
[ ] [ ]1 ( , ) ( , )21 113 13 132 213 square units2
A d A B d B C= ⋅⋅
= ⋅ = ⋅⋅
=
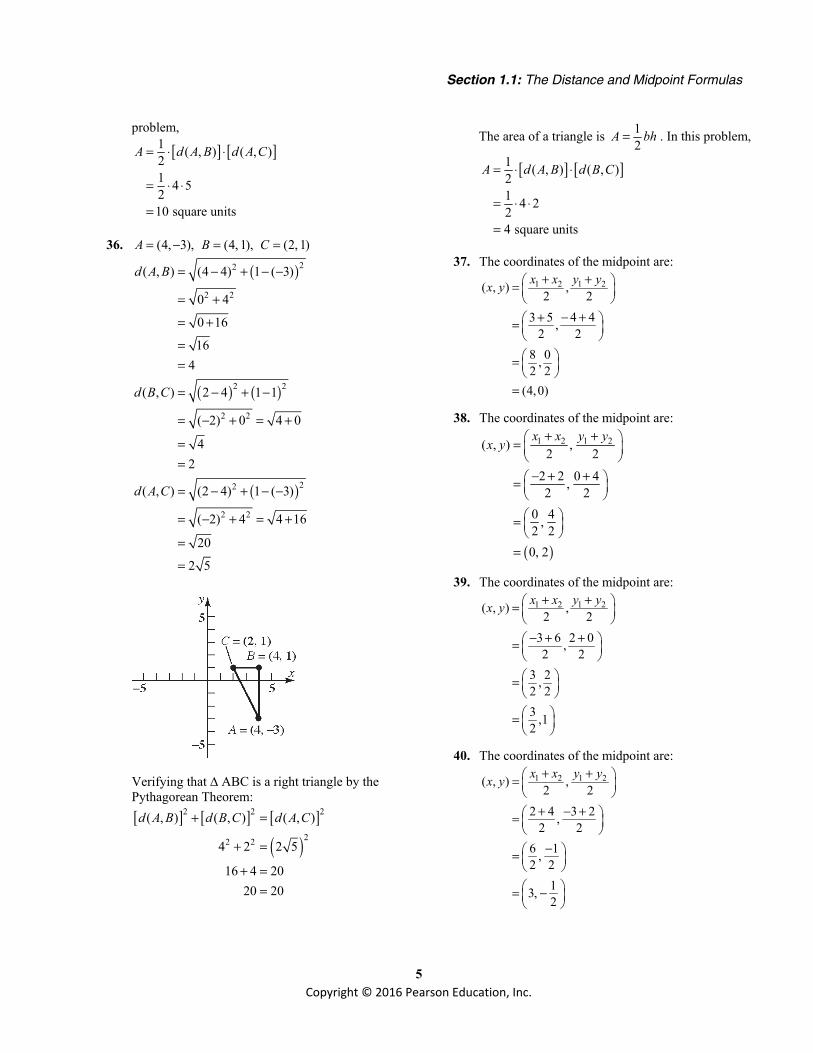
32. ( 2, 5), (12, 3), (10, 11)A B C= − = = −
( )
( )
( )
2 2
2 2
2 2
2 2
2 2
2 2
( , ) 12 ( 2) (3 5)
14 ( 2)
196 4 200
10 2
( , ) 10 12 ( 11 3)
( 2) ( 14)
4 196 200
10 2
( , ) 10 ( 2) ( 11 5)
12 ( 16)
144 256 40020
d A B
d B C
d A C
= − − + −
= + −
= + =
=
= − + − −
= − + −
= + =
=
= − − + − −
= + −
= + ==
Verifying that ∆ ABC is a right triangle by the Pythagorean Theorem: [ ] [ ] [ ]
( ) ( ) ( )
2 2 2
2 2 2
( , ) ( , ) ( , )
10 2 10 2 20
200 200 400400 400
d A B d B C d A C+ =
+ =
+ ==
The area of a triangle is 12
A bh= . In this
problem,
[ ] [ ]1 ( , ) ( , )21 10 2 10 221 100 2 100 square units2
A d A B d B C= ⋅ ⋅
= ⋅ ⋅
= ⋅ ⋅ =
33. ( 5,3), (6,0), (5,5)A B C= − = =
( )
( )
( )
2 2
2 2
2 2
2 2
2 2
2 2
( , ) 6 ( 5) (0 3)
11 ( 3) 121 9
130
( , ) 5 6 (5 0)
( 1) 5 1 25
26
( , ) 5 ( 5) (5 3)
10 2 100 4
104
2 26
d A B
d B C
d A C
= − − + −
= + − = +
=
= − + −
= − + = +
=
= − − + −
= + = +
=
=
Verifying that ∆ ABC is a right triangle by the Pythagorean Theorem: [ ] [ ] [ ]
( ) ( ) ( )
2 2 2
2 2 2
( , ) ( , ) ( , )
104 26 130
104 26 130130 130
d A C d B C d A B+ =
+ =
+ ==
The area of a triangle is 12
A bh= . In this

Chapter 1: Graphs and Functions
4 Copyright © 2016 Pearson Education, Inc.
problem,
[ ] [ ]1 ( , ) ( , )21 104 2621 2 26 2621 2 26226 square units
A d A C d B C= ⋅ ⋅
= ⋅ ⋅
= ⋅ ⋅
= ⋅ ⋅
=
34. ( 6, 3), (3, 5), ( 1, 5)A B C= − = − = −
( )
( )
( )
2 2
2 2
2 2
2 2
2 2
2 2
( , ) 3 ( 6) ( 5 3)
9 ( 8) 81 64
145
( , ) 1 3 (5 ( 5))
( 4) 10 16 100
116 2 29
( , ) 1 ( 6) (5 3)
5 2 25 4
29
d A B
d B C
d A C
= − − + − −
= + − = +
=
= − − + − −
= − + = +
= =
= − − − + −
= + = +
=
Verifying that ∆ ABC is a right triangle by the Pythagorean Theorem:
[ ] [ ] [ ]
( ) ( ) ( )
2 2 2
2 2 2
( , ) ( , ) ( , )
29 2 29 145
29 4 29 14529 116 145
145 145
d A C d B C d A B+ =
+ =
+ ⋅ =+ =
=
The area of a triangle is 12
A bh= . In this
problem,
[ ] [ ]1 ( , ) ( , )21 29 2 2921 2 29229 square units
A d A C d B C= ⋅ ⋅
= ⋅ ⋅
= ⋅ ⋅
=
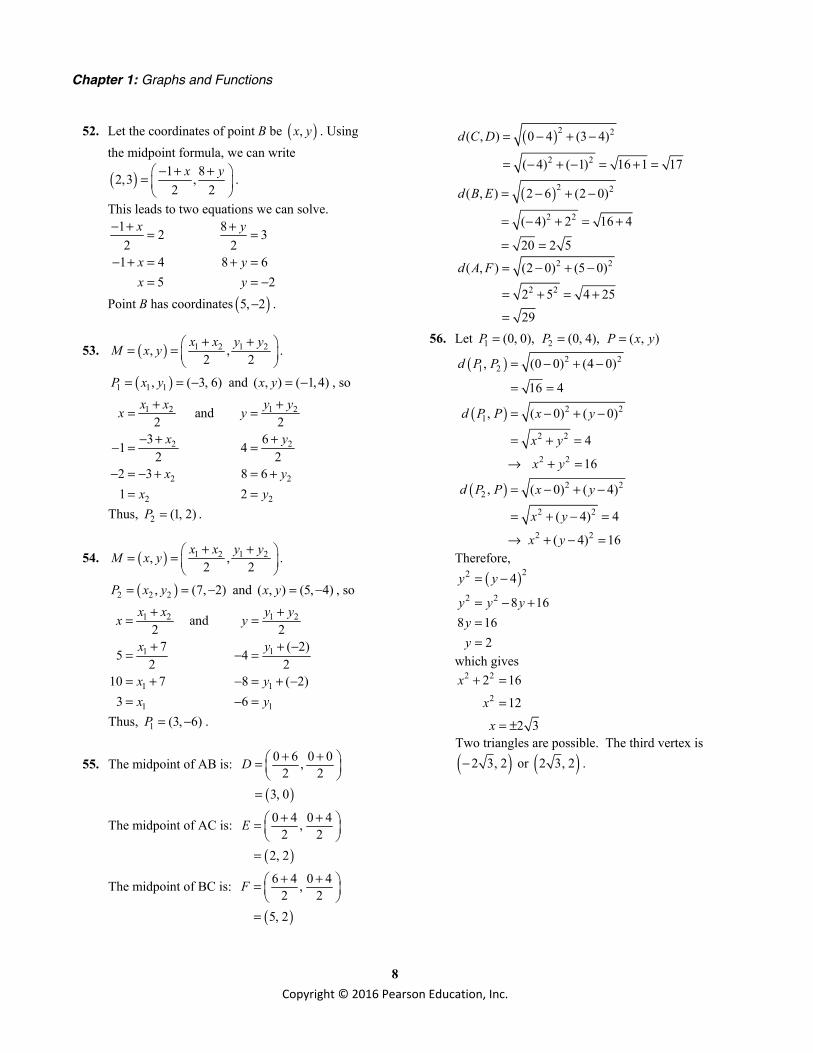
35. (4, 3), (0, 3), (4,2)A B C= − = − =
( )
( ) ( )
( )
22
2 2
2 2
2 2
22
2 2
( , ) (0 4) 3 ( 3)
( 4) 0 16 0
164
( , ) 4 0 2 ( 3)
4 5 16 25
41
( , ) (4 4) 2 ( 3)
0 5 0 25
255
d A B
d B C
d A C
= − + − − −
= − + = +
==
= − + − −
= + = +
=
= − + − −
= + = +
==
Verifying that ∆ ABC is a right triangle by the Pythagorean Theorem: [ ] [ ] [ ]
( )
2 2 2
22 2
( , ) ( , ) ( , )
4 5 41
16 25 4141 41
d A B d A C d B C+ =
+ =
+ ==
The area of a triangle is 12
A bh= . In this
Section 1.1: The Distance and Midpoint Formulas
5 Copyright © 2016 Pearson Education, Inc.
problem,
[ ] [ ]1 ( , ) ( , )21 4 5210 square units
A d A B d A C= ⋅ ⋅
= ⋅ ⋅
=
36. (4, 3), (4, 1), (2, 1)A B C= − = =
( )
( ) ( )
( )
22
2 2
2 2
2 2
22
2 2
( , ) (4 4) 1 ( 3)
0 4
0 16
164
( , ) 2 4 1 1
( 2) 0 4 0
42
( , ) (2 4) 1 ( 3)
( 2) 4 4 16
20
2 5
d A B
d B C
d A C
= − + − −
= +
= +
==
= − + −
= − + = +
==
= − + − −
= − + = +
=
=
Verifying that ∆ ABC is a right triangle by the Pythagorean Theorem: [ ] [ ] [ ]
( )
2 2 2
22 2
( , ) ( , ) ( , )
4 2 2 5
16 4 2020 20
d A B d B C d A C+ =
+ =
+ ==
The area of a triangle is 12
A bh= . In this problem,
[ ] [ ]1 ( , ) ( , )21 4 224 square units
A d A B d B C= ⋅ ⋅
= ⋅ ⋅
=
37. The coordinates of the midpoint are: 1 2 1 2( , ) ,
2 24 43 5 ,
2 28 0,2 2
(4,0)
x x y yx y + + =
− ++ = =
=
38. The coordinates of the midpoint are:
( )
1 2 1 2( , ) ,2 2
2 2 0 4,2 2
0 4,2 20, 2
x x y yx y + + =
− + + = =
=
39. The coordinates of the midpoint are: 1 2 1 2( , ) ,
2 23 6 2 0,2 2
3 2,2 23 ,12
x x y yx y + + =
− + + = = =
40. The coordinates of the midpoint are: 1 2 1 2( , ) ,
2 22 4 3 2,
2 26 1,2 2
13,2
x x y yx y + + =
+ − + =
− = = −

Chapter 1: Graphs and Functions
6 Copyright © 2016 Pearson Education, Inc.
41. The coordinates of the midpoint are: 1 2 1 2( , ) ,
2 24 6 3 1,
2 2210 ,
2 2(5, 1)
x x y yx y + + =
+ − + =
− =
= −
42. The coordinates of the midpoint are: 1 2 1 2( , ) ,
2 24 2 3 2,2 2
2 1,2 2
11,2
x x y yx y + + =
− + − + =
− − = = − −
43. The coordinates of the midpoint are: 1 2 1 2( , ) ,
2 20 0,
2 2
,2 2
x x y yx y
a b
a b
+ + =
+ + = =
44. The coordinates of the midpoint are: 1 2 1 2( , ) ,
2 20 0,
2 2
,2 2
x x y yx y
a a
a a
+ + =
+ + = =
45. The x coordinate would be 2 3 5+ = and the y coordinate would be 5 2 3− = . Thus the new point would be ( )5,3 .
46. The new x coordinate would be 1 2 3− − = − and the new y coordinate would be 6 4 10+ = . Thus the new point would be ( )3,10−
47. a. If we use a right triangle to solve the problem, we know the hypotenuse is 13 units in length. One of the legs of the triangle will be 2+3=5. Thus the other leg will be:
2 2 2
2
2
5 13
25 169
14412
b
b
bb
+ =
+ =
==
Thus the coordinates will have an y value of 1 12 13− − = − and 1 12 11− + = . So the points
are ( )3,11 and ( )3, 13− .
b. Consider points of the form ( )3, y that are a
distance of 13 units from the point ( )2, 1− − .
( ) ( )
( ) ( )
( ) ( )
2 22 1 2 1
2 2
2 2
2
2
3 ( 2) 1
5 1
25 1 2
2 26
d x x y y
y
y
y y
y y
= − + −
= − − + − −
= + − −
= + + +
= + +
( )
( )( )
2
22 2
2
2
13 2 26
13 2 26
169 2 26
0 2 1430 11 13
y y
y y
y y
y yy y
= + +
= + +
= + +
= + −= − +
11 011
yy
− ==
or 13 013
yy
+ == −
Thus, the points ( )3,11 and ( )3, 13− are a
distance of 13 units from the point ( )2, 1− − .
48. a. If we use a right triangle to solve the problem, we know the hypotenuse is 17 units in length. One of the legs of the triangle will be 2+6=8. Thus the other leg will be:
2 2 2
2
2
8 17
64 289
22515
b
b
bb
+ =
+ =
==
Thus the coordinates will have an x value of 1 15 14− = − and 1 15 16+ = . So the points are ( )14, 6− − and ( )16, 6− .

Section 1.1: The Distance and Midpoint Formulas
7 Copyright © 2016 Pearson Education, Inc.
b. Consider points of the form ( ), 6x − that are
a distance of 17 units from the point ( )1, 2 .
( ) ( )
( ) ( )( )( )
2 22 1 2 1
22
22
2
2
1 2 6
2 1 8
2 1 64
2 65
d x x y y
x
x x
x x
x x
= − + −
= − + − −
= − + +
= − + +
= − +
( )
( )( )
2
22 2
2
2
17 2 65
17 2 65
289 2 65
0 2 2240 14 16
x x
x x
x x
x xx x
= − +
= − +
= − +
= − −= + −
14 014
xx
+ == −
or 16 016
xx
− ==
Thus, the points ( )14, 6− − and ( )16, 6− are a
distance of 13 units from the point ( )1, 2 .
49. Points on the x-axis have a y-coordinate of 0. Thus, we consider points of the form ( ),0x that are a
distance of 6 units from the point ( )4, 3− .
( ) ( )
( ) ( )
( )
2 22 1 2 1
2 2
22
2
2
4 3 0
16 8 3
16 8 9
8 25
d x x y y
x
x x
x x
x x
= − + −
= − + − −
= − + + −
= − + +
= − +
( )2
22 2
2
2
2
6 8 25
6 8 25
36 8 25
0 8 11
( 8) ( 8) 4(1)( 11)2(1)
8 64 44 8 1082 2
8 6 3 4 3 32
x x
x x
x x
x x
x
= − +
= − +
= − +
= − −
− − ± − − −=
± + ±= =
±= = ±
4 3 3x = + or 4 3 3x = − Thus, the points ( )4 3 3,0+ and ( )4 3 3,0− are
on the x-axis and a distance of 6 units from the point ( )4, 3− .
50. Points on the y-axis have an x-coordinate of 0. Thus, we consider points of the form ( )0, y that
are a distance of 6 units from the point ( )4, 3− .
( ) ( )
( ) ( )
2 22 1 2 1
2 2
2 2
2
2
4 0 3
4 9 6
16 9 6
6 25
d x x y y
y
y y
y y
y y
= − + −
= − + − −
= + + +
= + + +
= + +
( )2
22 2
2
2
2
6 6 25
6 6 25
36 6 25
0 6 11
( 6) (6) 4(1)( 11)2(1)
6 36 44 6 802 2
6 4 5 3 2 52
y y
y y
y y
y y
y
= + +
= + +
= + +
= + −
− ± − −=
− ± + − ±= =
− ±= = − ±
3 2 5y = − + or 3 2 5y = − −
Thus, the points ( )0, 3 2 5− + and ( )0, 3 2 5− −
are on the y-axis and a distance of 6 units from the point ( )4, 3− .
51. a. To shift 3 units left and 4 units down, we subtract 3 from the x-coordinate and subtract 4 from the y-coordinate. ( ) ( )2 3,5 4 1,1− − = −
b. To shift left 2 units and up 8 units, we subtract 2 from the x-coordinate and add 8 to the y-coordinate. ( ) ( )2 2,5 8 0,13− + =
Chapter 1: Graphs and Functions
8 Copyright © 2016 Pearson Education, Inc.
52. Let the coordinates of point B be ( ),x y . Using the midpoint formula, we can write
( ) 1 82,3 ,2 2
x y− + + =
.
This leads to two equations we can solve. 1 22
1 45
x
xx
− + =
− + ==
8 32
8 62
y
yy
+ =
+ == −
Point B has coordinates ( )5, 2− .
53. ( ) 1 2 1 2, ,2 2
x x y yM x y + + = =
.
( )1 1 1, ( 3, 6)P x y= = − and ( , ) ( 1,4)x y = − , so
1 2
2
2
2
231
22 31
x xx
x
xx
+=
− +− =
− = − +=
and 1 2
2
2
2
264
28 62
y yy
y
yy
+=
+=
= +=
Thus, 2 (1, 2)P = .
54. ( ) 1 2 1 2, ,2 2
x x y yM x y + + = =
.
( )2 2 2, (7, 2)P x y= = − and ( , ) (5, 4)x y = − , so
1 2
1
1
1
275
210 7
3
x xx
x
xx
+=
+=
= +=
and 1 2
1
1
1
2( 2)4
28 ( 2)6
y yy
y
yy
+=
+ −− =
− = + −− =
Thus, 1 (3, 6)P = − .
55. The midpoint of AB is:
( )
0 6 0 0,2 2
3, 0
D + + =
=
The midpoint of AC is:
( )
0 4 0 4,2 2
2, 2
E + + =
=
The midpoint of BC is:
( )
6 4 0 4,2 2
5, 2
F + + =
=
( )2 2
2 2
( , ) 0 4 (3 4)
( 4) ( 1) 16 1 17
d C D = − + −
= − + − = + =
( )2 2
2 2
( , ) 2 6 (2 0)
( 4) 2 16 4
20 2 5
d B E = − + −
= − + = +
= =
2 2
2 2
( , ) (2 0) (5 0)
2 5 4 25
29
d A F = − + −
= + = +
=
56. Let 1 2(0, 0), (0, 4), ( , )P P P x y= = =
( )
( )
( )
2 21 2
2 21
2 2
2 2
2 22
2 2
2 2
, (0 0) (4 0)
16 4
, ( 0) ( 0)
4
16
, ( 0) ( 4)
( 4) 4
( 4) 16
d P P
d P P x y
x y
x y
d P P x y
x y
x y
= − + −
= =
= − + −
= + =
→ + =
= − + −
= + − =
→ + − =
Therefore, ( )22
2 2
4
8 168 16
2
y y
y y yyy
= −
= − +==
which gives 2 2
2
2 16
12
2 3
x
x
x
+ =
=
= ±
Two triangles are possible. The third vertex is
( ) ( )2 3, 2 or 2 3, 2− .
Section 1.1: The Distance and Midpoint Formulas
9 Copyright © 2016 Pearson Education, Inc.
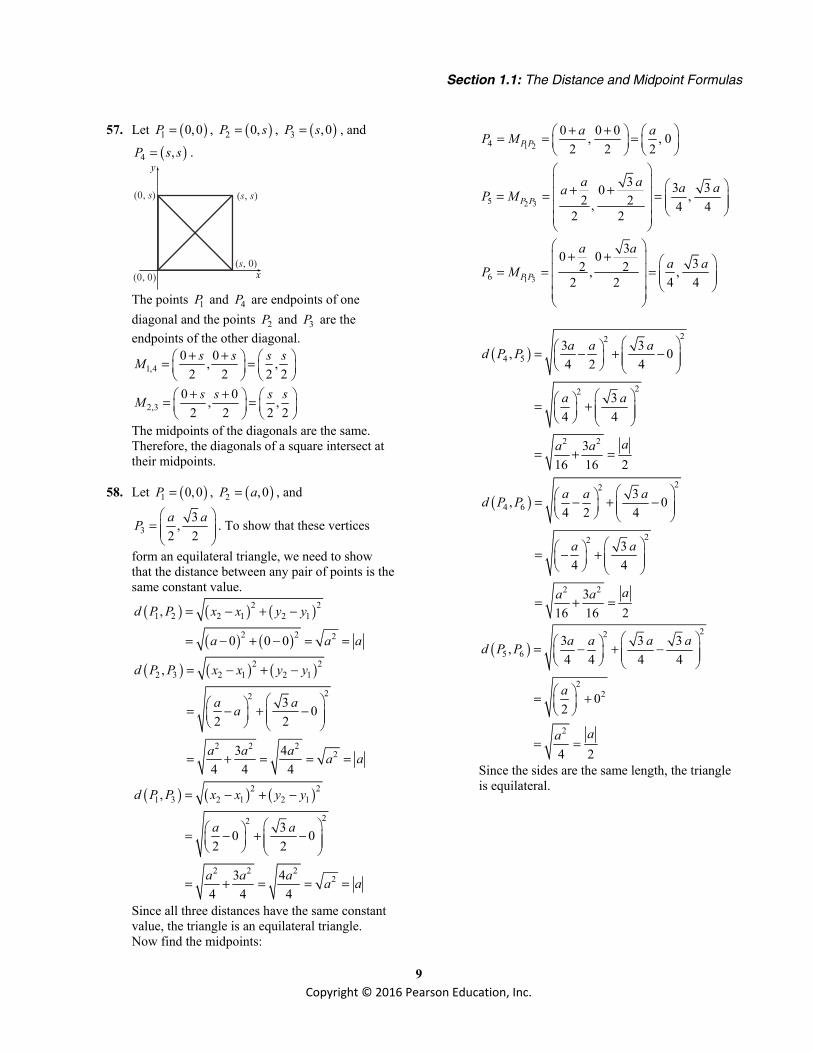
57. Let ( )1 0,0P = , ( )2 0,P s= , ( )3 ,0P s= , and
( )4 ,P s s= . y
x
(0, )s
(0, 0)( , 0)s
( , )s s
The points 1P and 4P are endpoints of one diagonal and the points 2P and 3P are the endpoints of the other diagonal.
1,40 0, ,
2 2 2 2s s s sM + + = =
2,30 0, ,
2 2 2 2s s s sM + + = =
The midpoints of the diagonals are the same. Therefore, the diagonals of a square intersect at their midpoints.
58. Let ( )1 0,0P = , ( )2 ,0P a= , and
33,
2 2a aP
=
. To show that these vertices
form an equilateral triangle, we need to show that the distance between any pair of points is the same constant value.
( ) ( ) ( )
( ) ( )
2 21 2 2 1 2 1
2 2 2
,
0 0 0
d P P x x y y
a a a
= − + −
= − + − = =
( ) ( ) ( )2 22 3 2 1 2 1
22
2 2 22
,
3 02 2
3 44 4 4
d P P x x y y
a aa
a a a a a
= − + −
= − + −
= + = = =
( ) ( ) ( )2 21 3 2 1 2 1
22
2 2 22
,
30 02 2
3 44 4 4
d P P x x y y
a a
a a a a a
= − + −
= − + −
= + = = =
Since all three distances have the same constant value, the triangle is an equilateral triangle. Now find the midpoints:
1 2
2 3
1 3
4
5
6
0 0 0, , 02 2 2
3 3 30 ,2 2, 4 42 2
30 0 32 2, ,2 2 4 4
P P
P P
P P
a aP M
a a a aaP M
a aa aP M
+ + = = = + + = = =
+ + = = =
( )22
4 5
22
2 2
3 3, 04 2 4
34 4
316 16 2
a a ad P P
a a
aa a
= − + −
= +
= + =
( )22
4 6
22
2 2
3, 04 2 4
34 4
316 16 2
a a ad P P
a a
aa a
= − + −
= − +
= + =
( )22
5 6
22
2
3 3 3,4 4 4 4
02
4 2
a a a ad P P
a
aa
= − + −
= +
= =
Since the sides are the same length, the triangle is equilateral.

Chapter 1: Graphs and Functions
10 Copyright © 2016 Pearson Education, Inc.
59. 2 21 2
2 2
( , ) ( 4 2) (1 1)
( 6) 0
366
d P P = − − + −
= − +
==
( )2 22 3
2 2
( , ) 4 ( 4) ( 3 1)
0 ( 4)
164
d P P = − − − + − −
= + −
==
2 21 3
2 2
( , ) ( 4 2) ( 3 1)
( 6) ( 4)
36 16
52
2 13
d P P = − − + − −
= − + −
= +
=
=
Since [ ] [ ] [ ]2 221 2 2 3 1 3( , ) ( , ) ( , )d P P d P P d P P+ = ,
the triangle is a right triangle.
60. ( )2 21 2
2 2
( , ) 6 ( 1) (2 4)
7 ( 2)
49 4
53
d P P = − − + −
= + −
= +
=
( )2 22 3
2 2
( , ) 4 6 ( 5 2)
( 2) ( 7)
4 49
53
d P P = − + − −
= − + −
= +
=
( )2 21 3
2 2
( , ) 4 ( 1) ( 5 4)
5 ( 9)
25 81
106
d P P = − − + − −
= + −
= +
=
Since [ ] [ ] [ ]2 221 2 2 3 1 3( , ) ( , ) ( , )d P P d P P d P P+ = ,
the triangle is a right triangle. Since ( ) ( )1 2 2 3, ,d P P d P P= , the triangle is
isosceles. Therefore, the triangle is an isosceles right
triangle.
61. ( ) ( )2 21 2
2 2
( , ) 0 ( 2) 7 ( 1)
2 8 4 64 68
2 17
d P P = − − + − −
= + = + =
=
( )2 22 3
2 2
( , ) 3 0 (2 7)
3 ( 5) 9 25
34
d P P = − + −
= + − = +
=
( ) ( )2 21 3
2 2
( , ) 3 ( 2) 2 ( 1)
5 3 25 9
34
d P P = − − + − −
= + = +
=
Since 2 3 1 3( , ) ( , )d P P d P P= , the triangle is isosceles.
Since [ ] [ ] [ ]2 2 21 3 2 3 1 2( , ) ( , ) ( , )d P P d P P d P P+ = ,
the triangle is also a right triangle. Therefore, the triangle is an isosceles right
triangle.
62. ( ) ( )2 21 2
2 2
( , ) 4 7 0 2
( 11) ( 2)
121 4 125
5 5
d P P = − − + −
= − + −
= + =
=
( )2 22 3
2 2
( , ) 4 ( 4) (6 0)
8 6 64 36
10010
d P P = − − + −
= + = +
==
( ) ( )2 21 3
2 2
( , ) 4 7 6 2
( 3) 4 9 16
255
d P P = − + −
= − + = +
==
Since [ ] [ ] [ ]2 2 21 3 2 3 1 2( , ) ( , ) ( , )d P P d P P d P P+ = ,
the triangle is a right triangle.

Section 1.1: The Distance and Midpoint Formulas
11 Copyright © 2016 Pearson Education, Inc.
63. Using the Pythagorean Theorem: 2 2 2
2
2
90 90
8100 8100
16200
16200 90 2 127.28 feet
d
d
d
d
+ =
+ =
=
= = ≈
90
9090
90
d
64. Using the Pythagorean Theorem: 2 2 2
2 2
60 60
3600 3600 7200
7200 60 2 84.85 feet
d
d d
d
+ =
+ = → =
= = ≈
60
6060
60
d
65. a. First: (90, 0), Second: (90, 90), Third: (0, 90)
(0,0)
(0,90)
(90,0)
(90,90)
X
Y
b. Using the distance formula:
2 2
2 2
(310 90) (15 90)
220 ( 75) 54025
5 2161 232.43 feet
d = − + −
= + − =
= ≈
c. Using the distance formula: 2 2
2 2
(300 0) (300 90)
300 210 134100
30 149 366.20 feet
d = − + −
= + =
= ≈
66. a. First: (60, 0), Second: (60, 60) Third: (0, 60)
(0,0)
(0,60)
(60,0)
(60,60)
x
y
b. Using the distance formula:
2 2
2 2
(180 60) (20 60)
120 ( 40) 16000
40 10 126.49 feet
d = − + −
= + − =
= ≈
c. Using the distance formula: 2 2
2 2
(220 0) (220 60)
220 160 74000
20 185 272.03 feet
d = − + −
= + =
= ≈
67. The Focus heading east moves a distance 30t after t hours. The truck heading south moves a distance 40t after t hours. Their distance apart after t hours is:
2 2
2 2
2
(30 ) (40 )
900 1600
250050 miles
d t t
t t
tt
= +
= +
==
d40t
30t
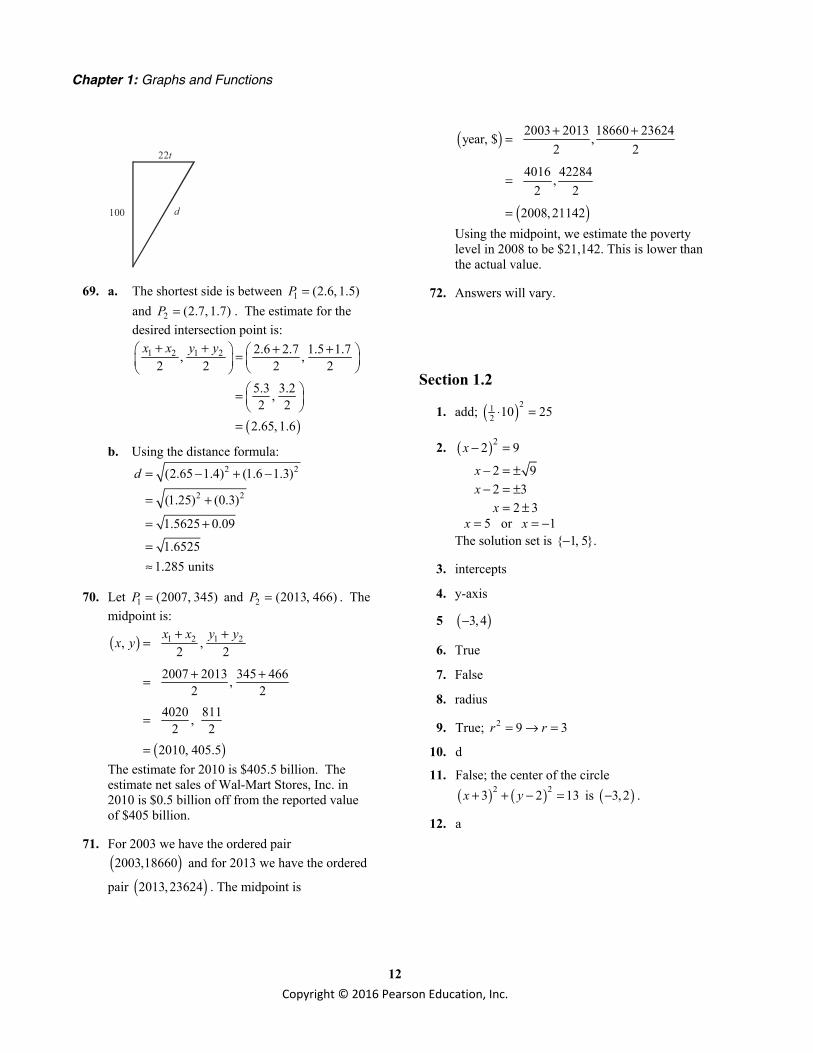
68. 15 miles 5280 ft 1 hr 22 ft/sec1 hr 1 mile 3600 sec
⋅ ⋅ =
( )22
2
100 22
10000 484 feet
d t
t
= +
= +
Chapter 1: Graphs and Functions
12 Copyright © 2016 Pearson Education, Inc.
100
22t
d
69. a. The shortest side is between 1 (2.6, 1.5)P = and 2 (2.7, 1.7)P = . The estimate for the desired intersection point is:
( )
1 2 1 2 2.6 2.7 1.5 1.7, ,2 2 2 2
5.3 3.2,2 2
2.65, 1.6
x x y y+ + + + = =
=
b. Using the distance formula: 2 2
2 2
(2.65 1.4) (1.6 1.3)
(1.25) (0.3)
1.5625 0.09
1.65251.285 units
d = − + −
= +
= +
=≈
70. Let 1 (2007, 345)P = and 2 (2013, 466)P = . The midpoint is:
( )
( )
1 2 1 2, ,2 2
2007 2013 345 466,2 2
4020 811, 2 2
2010, 405.5
x x y yx y
+ + =
+ + =
=
=
The estimate for 2010 is $405.5 billion. The estimate net sales of Wal-Mart Stores, Inc. in 2010 is $0.5 billion off from the reported value of $405 billion.
71. For 2003 we have the ordered pair ( )2003,18660 and for 2013 we have the ordered
pair ( )2013,23624 . The midpoint is
( )
( )
2003 2013 18660 23624year, $ ,2 2
4016 42284,2 2
2008,21142
+ + =
=
=
Using the midpoint, we estimate the poverty level in 2008 to be $21,142. This is lower than the actual value.
72. Answers will vary.
Section 1.2
1. add; ( )212 10 25⋅ =
2. ( )22 9
2 92 3
2 3
x
xx
x
− =
− = ±− = ±
= ±
5 or 1x x= = − The solution set is { 1, 5}.−
3. intercepts
4. y-axis
5 ( )3,4−
6. True
7. False
8. radius
9. True; 2 9 3r r= → =
10. d
11. False; the center of the circle ( ) ( )2 23 2 13x y+ + − = is ( )3,2− .
12. a

Section 1.2: Graphs of Equations in Two Variables; Circles
13 Copyright © 2016 Pearson Education, Inc.
13. 4y x x= − 40 0 0
0 0= −=
41 1 1
1 0= −≠
44 (2) 2
4 16 2
= −
≠ −
The point (0, 0) is on the graph of the equation.
14. 3 2y x x= − 30 0 2 0
0 0= −=
31 1 2 1
1 1= −≠ −
31 1 2 1
1 1− = −− = −
The points (0, 0) and (1, –1) are on the graph of the equation.
15. 2 2 9y x= + 2 23 0 99 9
= +=
2 20 3 90 18
= +≠
2 20 ( 3) 90 18
= − +≠
The point (0, 3) is on the graph of the equation.
16. 3 1y x= + 32 1 18 2
= +≠
31 0 11 1
= +=
30 1 10 0
= − +=
The points (0, 1) and (–1, 0) are on the graph of the equation.
17. 2 2 4x y+ = 2 20 2 4
4 4+ =
=
2 2( 2) 2 48 4
− + =≠
( ) ( )2 22 2 4
4 4
+ =
=
( )(0, 2) and 2, 2 are on the graph of the
equation.
18. 2 24 4x y+ = 2 20 4 1 4
4 4+ ⋅ =
=
2 22 4 0 44 4
+ ⋅ ==
( )22 122 4 4
5 4
+ =
≠
The points (0, 1) and (2, 0) are on the graph of the equation.
19. 2y x= + x-intercept: y-intercept:
0 22
xx
= +− =
0 22
yy
= +=
The intercepts are ( )2,0− and ( )0, 2 .
20. 6y x= − x-intercept: y-intercept: 0 66
xx
= −=
0 66
yy
= −= −
The intercepts are ( )6,0 and ( )0, 6− .
21. 2 8y x= + x-intercept: y-intercept:
0 2 82 8
4
xxx
= += −= −
( )2 0 88
yy
= +=
The intercepts are ( )4,0− and ( )0,8 .
Chapter 1: Graphs and Functions
14 Copyright © 2016 Pearson Education, Inc.
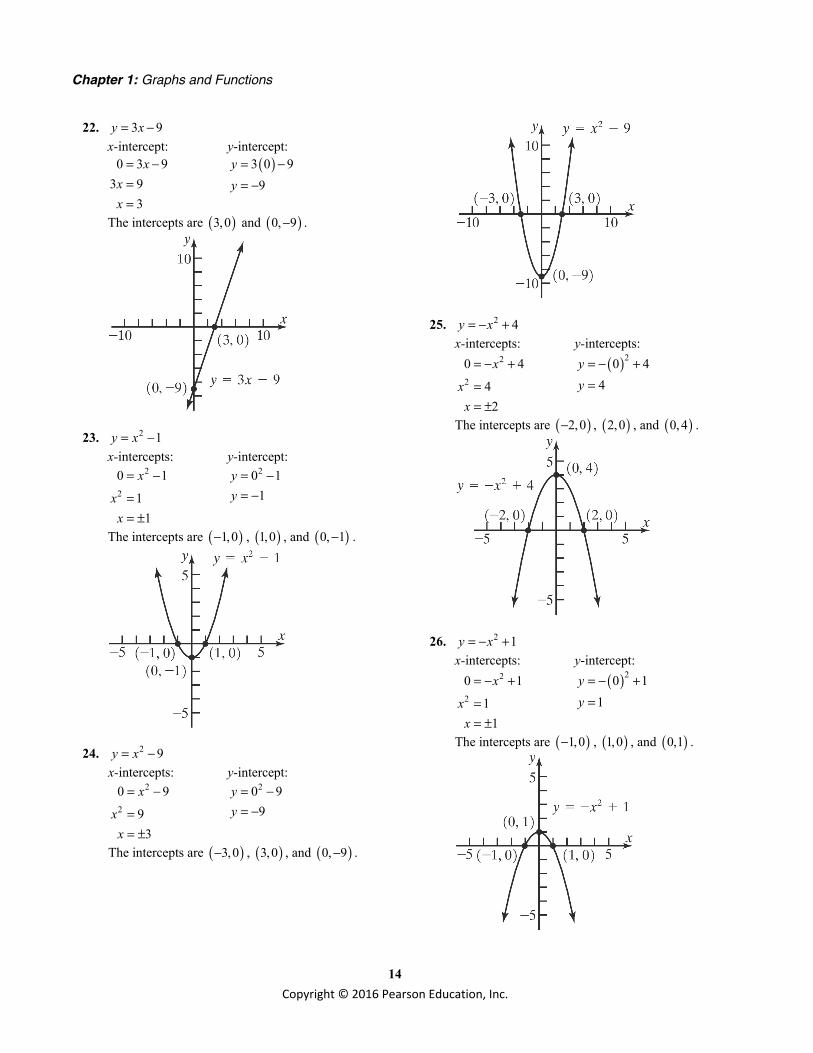
22. 3 9y x= − x-intercept: y-intercept:
0 3 93 9
3
xxx
= −==
( )3 0 99
yy
= −= −
The intercepts are ( )3,0 and ( )0, 9− .
23. 2 1y x= − x-intercepts: y-intercept:
2
2
0 1
11
x
xx
= −
== ±
20 11
yy
= −= −
The intercepts are ( )1,0− , ( )1,0 , and ( )0, 1− .
24. 2 9y x= − x-intercepts: y-intercept:
2
2
0 9
93
x
xx
= −
== ±
20 99
yy
= −= −
The intercepts are ( )3,0− , ( )3,0 , and ( )0, 9− .
25. 2 4y x= − + x-intercepts: y-intercepts:
2
2
0 4
42
x
xx
= − +
== ±
( )20 44
yy
= − +=
The intercepts are ( )2,0− , ( )2,0 , and ( )0, 4 .
26. 2 1y x= − + x-intercepts: y-intercept:
2
2
0 1
11
x
xx
= − +
== ±
( )20 11
yy
= − +=
The intercepts are ( )1,0− , ( )1,0 , and ( )0,1 .
Section 1.2: Graphs of Equations in Two Variables; Circles
15 Copyright © 2016 Pearson Education, Inc.
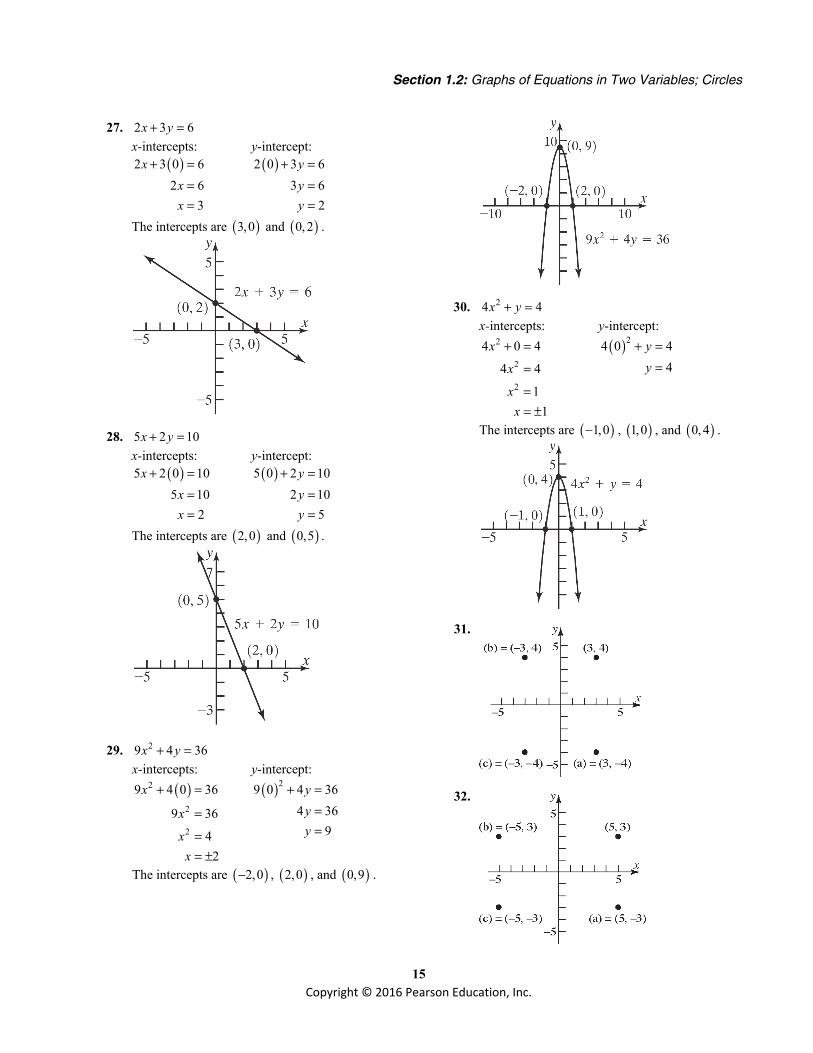
27. 2 3 6x y+ = x-intercepts: y-intercept:
( )2 3 0 62 6
3
xxx
+ ===
( )2 0 3 63 6
2
yyy
+ ===
The intercepts are ( )3,0 and ( )0, 2 .
28. 5 2 10x y+ =
x-intercepts: y-intercept: ( )5 2 0 105 10
2
xxx
+ ===
( )5 0 2 102 10
5
yyy
+ ===
The intercepts are ( )2,0 and ( )0,5 .
29. 29 4 36x y+ = x-intercepts: y-intercept:
( )2
2
2
9 4 0 36
9 36
42
x
x
xx
+ =
=
== ±
( )29 0 4 364 36
9
yyy
+ ===
The intercepts are ( )2,0− , ( )2,0 , and ( )0,9 .
30. 24 4x y+ = x-intercepts: y-intercept:
2
2
2
4 0 4
4 4
11
x
x
xx
+ =
=
== ±
( )24 0 44
yy
+ ==
The intercepts are ( )1,0− , ( )1,0 , and ( )0, 4 .
31.
32.

Chapter 1: Graphs and Functions
16 Copyright © 2016 Pearson Education, Inc.
33.
34.
35.
5
−5
y
5−5
(a) = (5, 2)
(b) = ( 5, 2)− −
(c) = ( 5, 2)−
(5, −2)
36.
37.
38.
39.
40.
41. a. Intercepts: ( )1,0− and ( )1,0
b. Symmetric with respect to the x-axis, y-axis, and the origin.
42. a. Intercepts: ( )0,1
b. Not symmetric to the x-axis, the y-axis, nor the origin
43. a. Intercepts: ( )2 0,π− , ( )0,1 , and ( )2 ,0π
b. Symmetric with respect to the y-axis.
44. a. Intercepts: ( )2,0− , ( )0, 3− , and ( )2,0
b. Symmetric with respect to the y-axis.
45. a. Intercepts: ( )0,0
b. Symmetric with respect to the x-axis.
Section 1.2: Graphs of Equations in Two Variables; Circles
17 Copyright © 2016 Pearson Education, Inc.
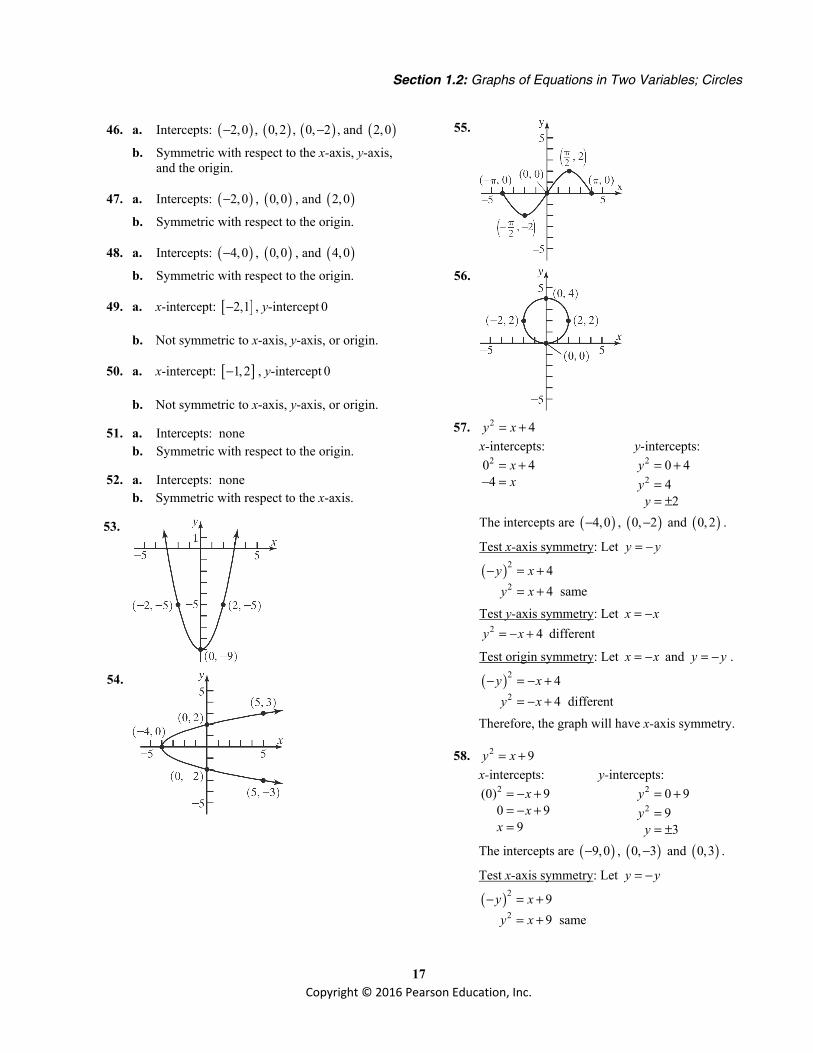
46. a. Intercepts: ( )2,0 ,− ( )0,2 , ( )0, 2 ,− and ( )2,0
b. Symmetric with respect to the x-axis, y-axis, and the origin.
47. a. Intercepts: ( )2,0− , ( )0,0 , and ( )2,0
b. Symmetric with respect to the origin.
48. a. Intercepts: ( )4,0− , ( )0,0 , and ( )4,0
b. Symmetric with respect to the origin.
49. a. x-intercept: [ ]2,1− , y-intercept 0
b. Not symmetric to x-axis, y-axis, or origin.
50. a. x-intercept: [ ]1,2− , y-intercept 0
b. Not symmetric to x-axis, y-axis, or origin.
51. a. Intercepts: none b. Symmetric with respect to the origin.
52. a. Intercepts: none b. Symmetric with respect to the x-axis.
53.
54.
55.
56.
57. 2 4y x= +
x-intercepts: y-intercepts: 20 44
xx
= +− =
2
20 44
2
yyy
= +== ±
The intercepts are ( )4,0− , ( )0, 2− and ( )0, 2 .
Test x-axis symmetry: Let y y= −
( )2
244 same
y xy x
− = += +
Test y-axis symmetry: Let x x= − 2 4y x= − + different
Test origin symmetry: Let x x= − and y y= − .
( )2
244 different
y xy x
− = − += − +
Therefore, the graph will have x-axis symmetry.
58. 2 9y x= + x-intercepts: y-intercepts:
2(0) 90 9
9
xx
x
= − += − +=
2
20 99
3
yyy
= +== ±
The intercepts are ( )9,0− , ( )0, 3− and ( )0,3 .
Test x-axis symmetry: Let y y= −
( )2
299 same
y xy x
− = += +

Chapter 1: Graphs and Functions
18 Copyright © 2016 Pearson Education, Inc.
Test y-axis symmetry: Let x x= − 2 9y x= − + different
Test origin symmetry: Let x x= − and y y= − .
( )2
299 different
y xy x
− = − += − +
Therefore, the graph will have x-axis symmetry.
59. 3y x= x-intercepts: y-intercepts:
300
xx
==
3 0 0y = =
The only intercept is ( )0,0 .
Test x-axis symmetry: Let y y= − 3 differenty x− =
Test y-axis symmetry: Let x x= − 3 3 differenty x x= − = −
Test origin symmetry: Let x x= − and y y= − 3 3
3 same
y x x
y x
− = − = −
=
Therefore, the graph will have origin symmetry.
60. 5y x= x-intercepts: y-intercepts:
300
xx
==
5 0 0y = =
The only intercept is ( )0,0 .
Test x-axis symmetry: Let y y= − 5 differenty x− =
Test y-axis symmetry: Let x x= − 5 5 differenty x x= − = −
Test origin symmetry: Let x x= − and y y= − 5 5
5 same
y x x
y x
− = − = −
=
Therefore, the graph will have origin symmetry.
61. 2 9 0x y+ − = x-intercepts: y-intercepts:
2
2
9 0
93
x
xx
− =
== ±
20 9 09
yy
+ − ==
The intercepts are ( )3,0− , ( )3,0 , and ( )0,9 .
Test x-axis symmetry: Let y y= − 2 9 0 differentx y− − =
Test y-axis symmetry: Let x x= −
( )2
2
9 0
9 0 same
x y
x y
− + − =
+ − =
Test origin symmetry: Let x x= − and y y= −
( )2
29 09 0 different
x yx y
− − − =− − =
Therefore, the graph will have y-axis symmetry.
62. 2 4 0x y− − = x-intercepts: y-intercept:
2
20 4 0
42
xxx
− − === ±
20 4 04
4
yyy
− − =− =
= −
The intercepts are ( )2,0− , ( )2,0 , and ( )0, 4− .
Test x-axis symmetry: Let y y= −
( )2
24 04 0 different
x yx y− − − =
+ − =
Test y-axis symmetry: Let x x= − ( )2
24 04 0 same
x yx y
− − − =− − =
Test origin symmetry: Let x x= − and y y= −
( ) ( )2
24 04 0 different
x yx y
− − − − =+ − =
Therefore, the graph will have y-axis symmetry.
63. 2 29 4 36x y+ = x-intercepts: y-intercepts:
( )22
2
2
9 4 0 369 36
42
xxxx
+ ==== ±
( )2 2
2
2
9 0 4 364 36
93
yyyy
+ ==== ±
The intercepts are ( )2,0− , ( )2,0 , ( )0, 3 ,− and
( )0,3 .
Section 1.2: Graphs of Equations in Two Variables; Circles
19 Copyright © 2016 Pearson Education, Inc.
Test x-axis symmetry: Let y y= −
( )22
2 29 4 36
9 4 36 samex y
x y+ − =
+ =
Test y-axis symmetry: Let x x= − ( )2 2
2 29 4 36
9 4 36 samex yx y
− + =+ =
Test origin symmetry: Let x x= − and y y= −
( ) ( )2 2
2 29 4 36
9 4 36 samex y
x y− + − =
+ =
Therefore, the graph will have x-axis, y-axis, and origin symmetry.
64. 2 24 4x y+ = x-intercepts: y-intercepts:
2 2
2
2
4 0 4
4 4
11
x
x
xx
+ =
=
== ±
( )2 2
2
4 0 4
42
y
yy
+ =
== ±
The intercepts are ( )1,0− , ( )1,0 , ( )0, 2− , and
( )0, 2 .
Test x-axis symmetry: Let y y= −
( )22
2 2
4 4
4 4 same
x y
x y
+ − =
+ =
Test y-axis symmetry: Let x x= − ( )2 2
2 2
4 4
4 4 same
x y
x y
− + =
+ =
Test origin symmetry: Let x x= − and y y= −
( ) ( )2 2
2 2
4 4
4 4 same
x y
x y
− + − =
+ =
Therefore, the graph will have x-axis, y-axis, and origin symmetry.
65. 3 27y x= − x-intercepts: y-intercepts:
3
3
0 27
273
x
xx
= −
==
30 2727
yy
= −= −
The intercepts are ( )3,0 and ( )0, 27− .
Test x-axis symmetry: Let y y= − 3 27 differenty x− = −
Test y-axis symmetry: Let x x= − ( )3
3
27
27 different
y x
y x
= − −
= − −
Test origin symmetry: Let x x= − and y y= −
( )3
3
27
27 different
y x
y x
− = − −
= +
Therefore, the graph has none of the indicated symmetries.
66. 4 1y x= − x-intercepts: y-intercepts:
4
4
0 1
11
x
xx
= −
== ±
40 11
yy
= −= −
The intercepts are ( )1,0− , ( )1,0 , and ( )0, 1− .
Test x-axis symmetry: Let y y= − 4 1 differenty x− = −
Test y-axis symmetry: Let x x= − ( )4
4
1
1 same
y x
y x
= − −
= −
Test origin symmetry: Let x x= − and y y= −
( )4
4
1
1 different
y x
y x
− = − −
− = −
Therefore, the graph will have y-axis symmetry.
67. 2 3 4y x x= − − x-intercepts: y-intercepts:
( )( )20 3 4
0 4 14 or 1
x xx x
x x
= − −= − += = −
( )20 3 0 44
yy
= − −= −
The intercepts are ( )4,0 , ( )1,0− , and ( )0, 4− .
Test x-axis symmetry: Let y y= − 2 3 4 differenty x x− = − −
Test y-axis symmetry: Let x x= − ( ) ( )2
2
3 4
3 4 different
y x x
y x x
= − − − −
= + −
Test origin symmetry: Let x x= − and y y= −
( ) ( )2
2
3 4
3 4 different
y x x
y x x
− = − − − −
− = + −
Chapter 1: Graphs and Functions
20 Copyright © 2016 Pearson Education, Inc.
Therefore, the graph has none of the indicated symmetries.
68. 2 4y x= + x-intercepts: y-intercepts:
2
2
0 4
4no real solution
x
x
= +
= −
20 44
yy
= +=
The only intercept is ( )0,4 .
Test x-axis symmetry: Let y y= − 2 4 differenty x− = +
Test y-axis symmetry: Let x x= − ( )2
2
4
4 same
y x
y x
= − +
= +
Test origin symmetry: Let x x= − and y y= −
( )2
2
4
4 different
y x
y x
− = − +
− = +
Therefore, the graph will have y-axis symmetry.
69. 23
9xy
x=
+
x-intercepts: y-intercepts:
230
93 0
0
xx
xx
=+
==
( )2
3 0 0 090 9
y = = =+
The only intercept is ( )0,0 .
Test x-axis symmetry: Let y y= −
23 different
9xy
x− =
+
Test y-axis symmetry: Let x x= − ( )
( )2
2
3
93 different
9
xy
xxy
x
−=
− +
= −+
Test origin symmetry: Let x x= − and y y= − ( )
( )2
2
2
3
93
93 same
9
xy
xxy
xxy
x
−− =
− +
− = −+
=+
Therefore, the graph has origin symmetry.
70. 2 42
xyx−=
x-intercepts: y-intercepts: 2
2
2
402
4 0
42
xx
x
xx
−=
− =
== ±
( )
20 4 42 0 0
undefined
y − −= =
The intercepts are ( )2,0− and ( )2,0 .
Test x-axis symmetry: Let y y= − 2 4 different2
xyx−− =
Test y-axis symmetry: Let x x= −
( )( )
2
2
42
4 different2
xy
x
xyx
− −=
−
−= −
Test origin symmetry: Let x x= − and y y= −
( )( )
2
2
2
42
42
4 same2
xy
x
xyx
xyx
− −− =
−
−− =−
−=
Therefore, the graph has origin symmetry.

Section 1.2: Graphs of Equations in Two Variables; Circles
21 Copyright © 2016 Pearson Education, Inc.
71. 3
2 9xy
x−=
−
x-intercepts: y-intercepts: 3
2
3
09
00
xx
xx
−=−
− ==
3
20 0 0
90 9y −= = =
−−
The only intercept is ( )0,0 .
Test x-axis symmetry: Let y y= − 3
2
3
2
9
different9
xyx
xyx
−− =−
=−
Test y-axis symmetry: Let x x= −
( )( )
3
2
3
2
9
different9
xy
x
xyx
− −=
− −
=−
Test origin symmetry: Let x x= − and y y= −
( )( )
3
2
3
2
3
2
9
9
same9
xy
x
xyx
xyx
− −− =
− −
− =−
−=−
Therefore, the graph has origin symmetry.
72. 4
51
2xy
x+=
x-intercepts: y-intercepts:
4
5
4
1021
xx
x
+=
= −
( )
4
50 1 1
02 0 undefined
y += =
no real solution There are no intercepts for the graph of this
equation. Test x-axis symmetry: Let y y= −
4
51 different
2xy
x+− =
Test y-axis symmetry: Let x x= −
( )( )
4
5
4
5
1
2
1 different2
xy
x
xyx
− +=
−
+=−
Test origin symmetry: Let x x= − and y y= −
( )( )
4
5
4
5
4
5
1
2
12
1 same2
xy
x
xyx
xyx
− +− =
−
+− =−
+=
Therefore, the graph has origin symmetry.
73. 3y x=
74. 2x y=

Chapter 1: Graphs and Functions
22 Copyright © 2016 Pearson Education, Inc.
75. y x=
76. 1yx
=
77. If the point ( ), 4a is on the graph of 2 3y x x= + , then we have
( )( )
2
2
4 3
0 3 40 4 1
a a
a aa a
= +
= + −= + −
4 04
aa
+ == −
or 1 01
aa
− ==
Thus, 4a = − or 1a = .
78. If the point ( ), 5a − is on the graph of 2 6y x x= + , then we have
( )( )
2
2
5 6
0 6 50 5 1
a a
a aa a
− = +
= + += + +
5 05
aa
+ == −
or 1 01
aa
+ == −
Thus, 5a = − or 1a = − .
79. Center = (2, 1)
2 2
Radius distance from (0,1) to (2,1)
(2 0) (1 1) 4 2
=
= − + − = =
Equation: 2 2( 2) ( 1) 4x y− + − =
80. Center = (1, 2)
2 2
Radius distance from (1,0) to (1,2)
(1 1) (2 0) 4 2
=
= − + − = =
Equation: 2 2( 1) ( 2) 4x y− + − =
81. Center = midpoint of (1, 2) and (4, 2)
( ) ( )1 4 2 2 52 2 2, , 2+ += =
( )2
2
52Radius distance from , 2 to (4,2)
5 9 34 (2 2)2 4 2
=
= − + − = =
Equation: 2
25 9( 2)2 4
x y − + − =
82. Center = midpoint of (0, 1) and (2, 3)
( )0 2 1 3, 1, 22 2+ + = =
( )
( )2 2
Radius distance from 1,2 to (2,3)
2 1 (3 2) 2
=
= − + − =
Equation: ( )2 21 ( 2) 2x y− + − =
83. 2 2 2( ) ( )x h y k r− + − = 2 2 2
2 2
( 0) ( 0) 2
4
x y
x y
− + − =
+ =
General form: 2 2 4 0x y+ − =
Section 1.2: Graphs of Equations in Two Variables; Circles
23 Copyright © 2016 Pearson Education, Inc.
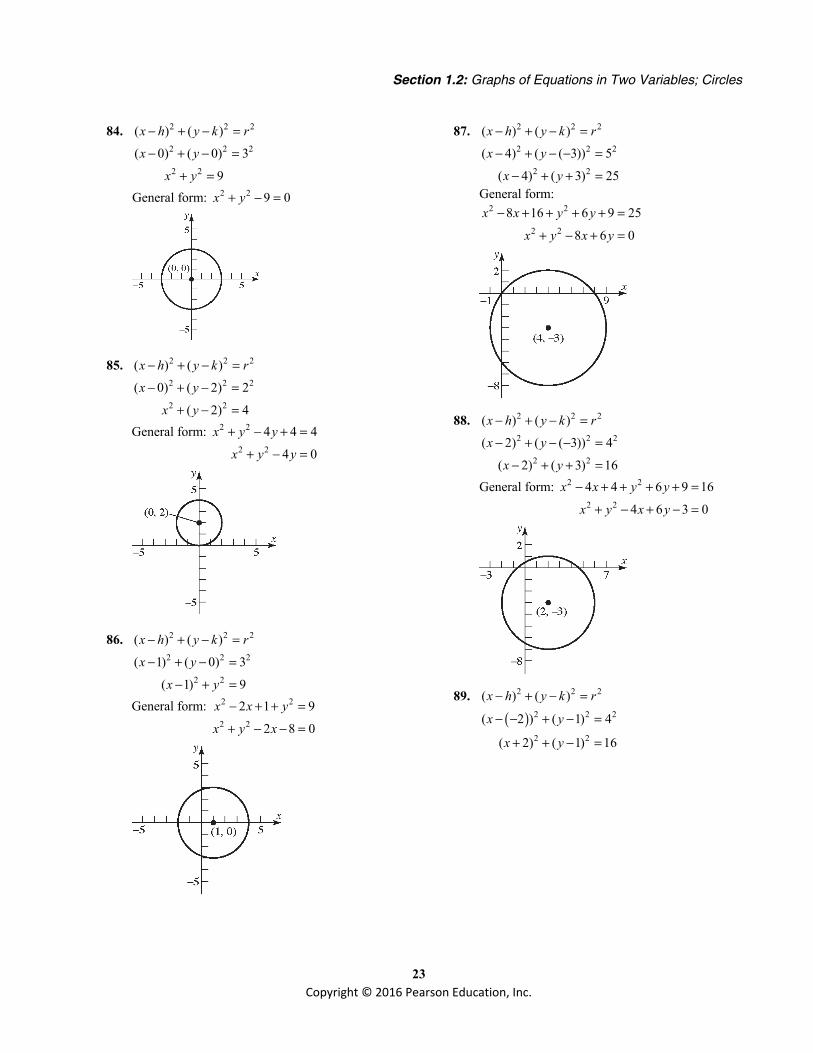
84. 2 2 2( ) ( )x h y k r− + − = 2 2 2
2 2
( 0) ( 0) 3
9
x y
x y
− + − =
+ =
General form: 2 2 9 0x y+ − =
85. 2 2 2( ) ( )x h y k r− + − = 2 2 2
2 2
( 0) ( 2) 2
( 2) 4
x y
x y
− + − =
+ − =
General form: 2 2
2 2
4 4 4
4 0
x y y
x y y
+ − + =
+ − =
86. 2 2 2( ) ( )x h y k r− + − = 2 2 2
2 2
( 1) ( 0) 3
( 1) 9
x y
x y
− + − =
− + =
General form: 2 2
2 2
2 1 9
2 8 0
x x y
x y x
− + + =
+ − − =
87. 2 2 2( ) ( )x h y k r− + − = 2 2 2
2 2
( 4) ( ( 3)) 5
( 4) ( 3) 25
x y
x y
− + − − =
− + + =
General form: 2 2
2 2
8 16 6 9 25
8 6 0
x x y y
x y x y
− + + + + =
+ − + =
88. 2 2 2( ) ( )x h y k r− + − = 2 2 2
2 2
( 2) ( ( 3)) 4
( 2) ( 3) 16
x y
x y
− + − − =
− + + =
General form: 2 2
2 2
4 4 6 9 16
4 6 3 0
x x y y
x y x y
− + + + + =
+ − + − =
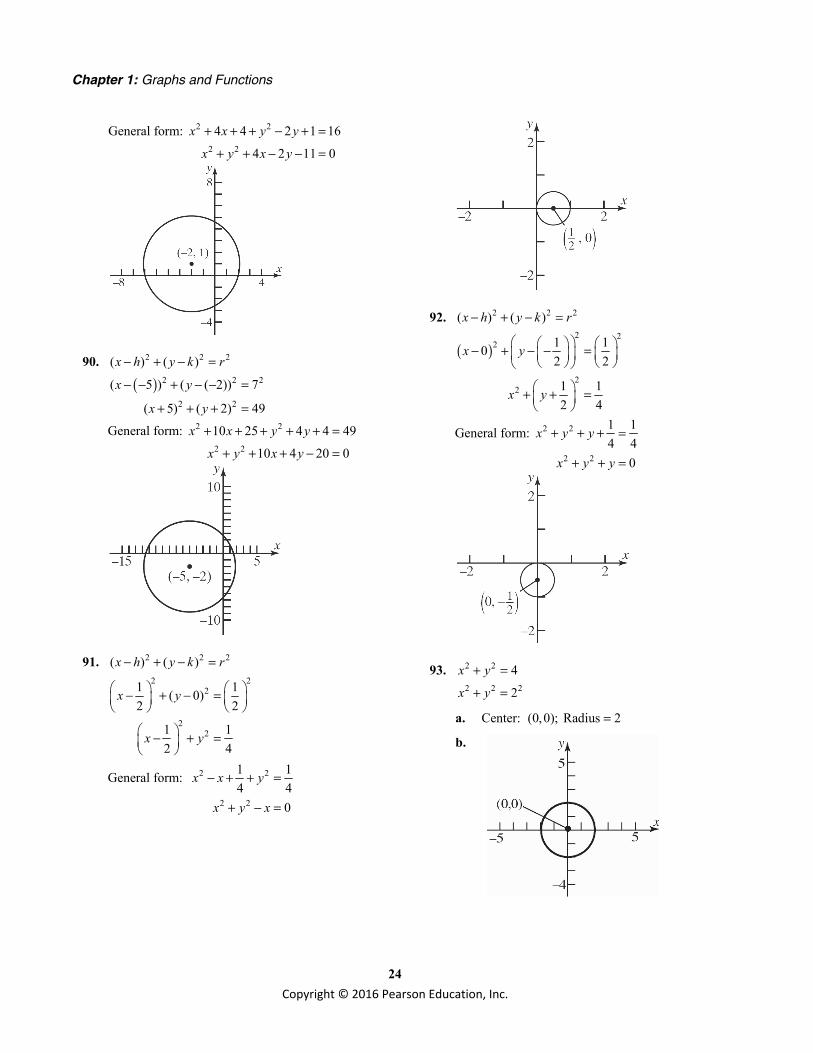
89. 2 2 2( ) ( )x h y k r− + − =
( ) 2 2 2
2 2
( 2 ) ( 1) 4
( 2) ( 1) 16
x y
x y
− − + − =
+ + − =
Chapter 1: Graphs and Functions
24 Copyright © 2016 Pearson Education, Inc.
General form: 2 2
2 2
4 4 2 1 16
4 2 11 0
x x y y
x y x y
+ + + − + =
+ + − − =
90. 2 2 2( ) ( )x h y k r− + − =
( ) 2 2 2
2 2
( 5 ) ( ( 2)) 7
( 5) ( 2) 49
x y
x y
− − + − − =
+ + + =
General form: 2 2
2 2
10 25 4 4 49
10 4 20 0
x x y y
x y x y
+ + + + + =
+ + + − =
91. 2 2 2( ) ( )x h y k r− + − = 2 2
2
22
1 1( 0)2 2
1 12 4
x y
x y
− + − =
− + =
General form: 2 2
2 2
1 14 4
0
x x y
x y x
− + + =
+ − =
92. 2 2 2( ) ( )x h y k r− + − =
( )2 2
2
22
1 102 2
1 12 4
x y
x y
− + − − =
+ + =
General form: 2 2
2 2
1 14 4
0
x y y
x y y
+ + + =
+ + =
93. 2 2 4x y+ = 2 2 22x y+ =
a. Center: (0,0); Radius 2=
b.
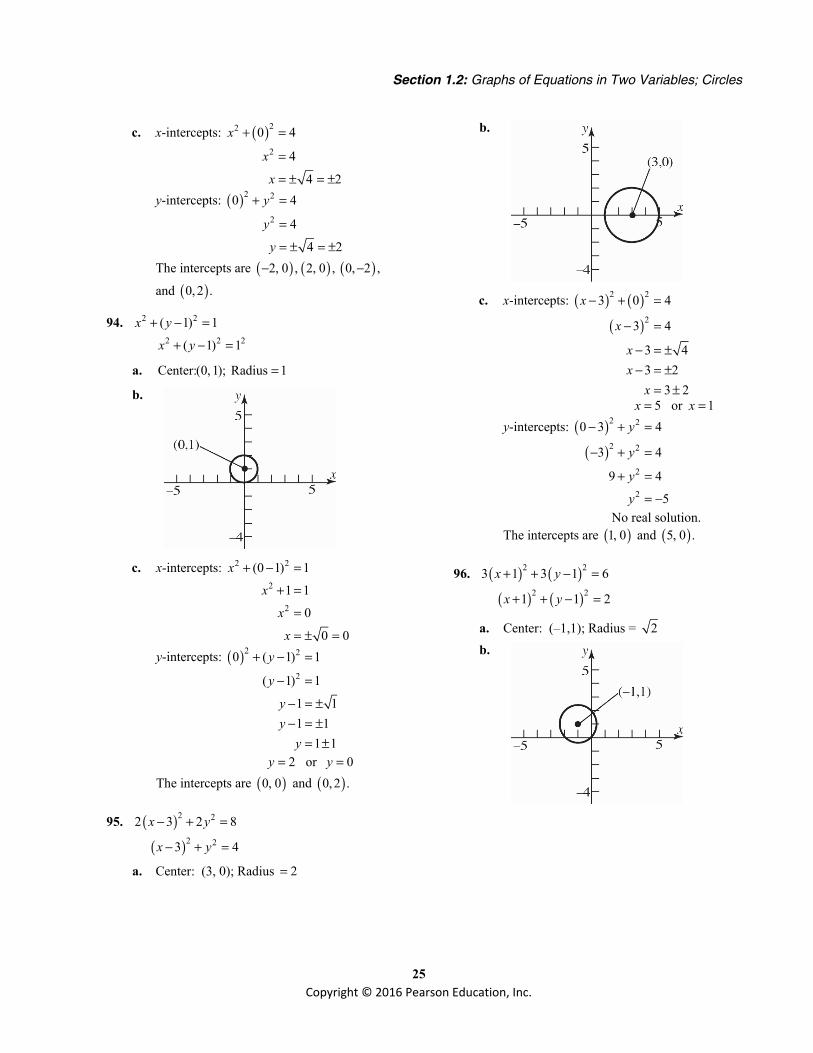
Section 1.2: Graphs of Equations in Two Variables; Circles
25 Copyright © 2016 Pearson Education, Inc.
c. x-intercepts: ( )22
2
0 4
4
4 2
x
x
x
+ =
=
= ± = ±
y-intercepts: ( )2 2
2
0 4
4
4 2
y
y
y
+ =
=
= ± = ±
The intercepts are ( ) ( )2, 0 , 2, 0 ,− ( )0, 2 ,−
and ( )0, 2 .
94. 2 2( 1) 1x y+ − = 2 2 2( 1) 1x y+ − =
a. Center:(0, 1); Radius 1=
b.
c. x-intercepts: 2 2
2
2
(0 1) 1
1 1
0
0 0
x
x
x
x
+ − =
+ =
=
= ± =
y-intercepts: ( )2 2
2
0 ( 1) 1
( 1) 1
1 11 1
1 1
y
y
yy
y
+ − =
− =
− = ±− = ±
= ±
2 or 0y y= = The intercepts are ( )0, 0 and ( )0,2 .
95. ( )2 22 3 2 8x y− + =
( )2 23 4x y− + =
a. Center: (3, 0); Radius 2=
b.
c. x-intercepts: ( ) ( )( )
2 2
2
3 0 4
3 4
3 43 2
3 2
x
x
xx
x
− + =
− =
− = ±− = ±
= ±
5 or 1x x= = y-intercepts: ( )
( )
2 2
2 2
2
2
0 3 4
3 4
9 4
5
y
y
y
y
− + =
− + =
+ =
= −
No real solution. The intercepts are ( )1, 0 and ( )5, 0 .
96. ( ) ( )2 23 1 3 1 6x y+ + − =
( ) ( )2 21 1 2x y+ + − =
a. Center: (–1,1); Radius = 2 b.
Chapter 1: Graphs and Functions
26 Copyright © 2016 Pearson Education, Inc.
c. x-intercepts: ( ) ( )( ) ( )
( )( )
2 2
2 2
2
2
1 0 1 2
1 1 2
1 1 2
1 1
1 11 1
1 1
x
x
x
x
xx
x
+ + − =
+ + − =
+ + =
+ =
+ = ±+ = ±
= − ±
0 or 2x x= = − y-intercepts: ( ) ( )
( ) ( )( )( )
2 2
2 2
2
2
0 1 1 2
1 1 2
1 1 2
1 1
1 11 1
1 1
y
y
y
y
yy
y
+ + − =
+ − =
+ − =
− =
− = ±− = ±
= ±
2 or 0y y= = The intercepts are ( ) ( )2, 0 , 0, 0 ,− and ( )0,2 .
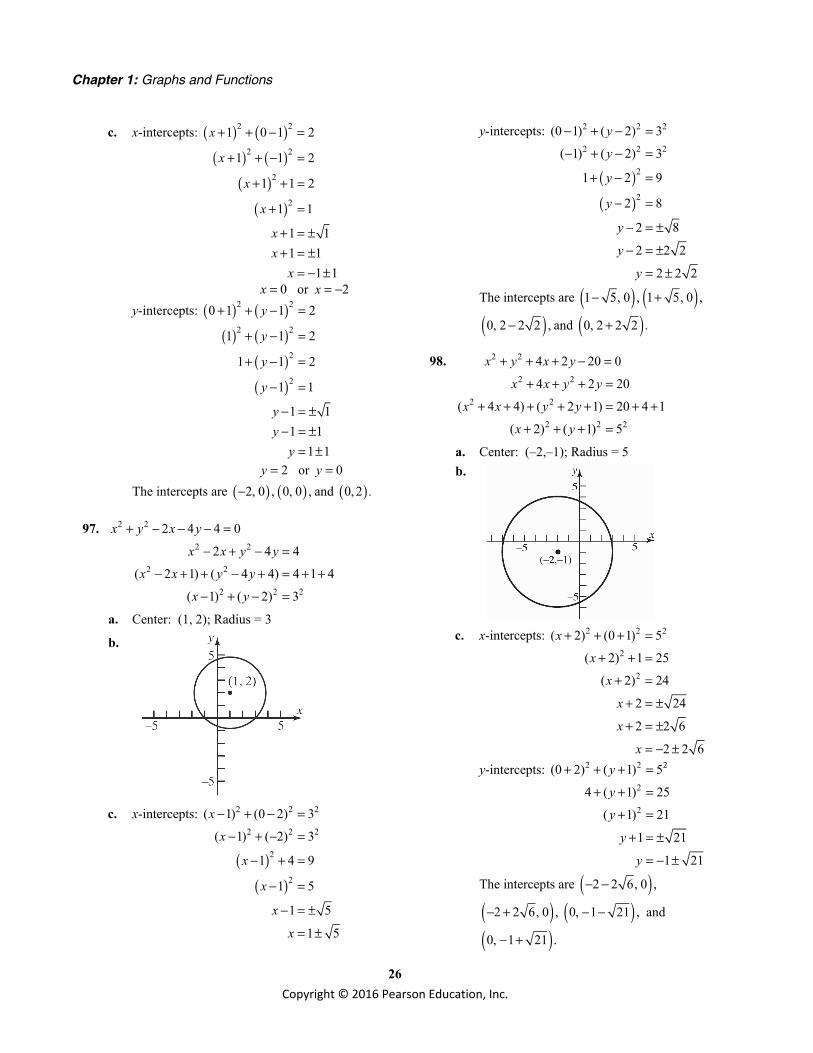
97. 2 2 2 4 4 0x y x y+ − − − = 2 2
2 2
2 2 2
2 4 4
( 2 1) ( 4 4) 4 1 4
( 1) ( 2) 3
x x y y
x x y y
x y
− + − =
− + + − + = + +
− + − =
a. Center: (1, 2); Radius = 3
b.
c. x-intercepts:
( )( )
2 2 2
2 2 2
2
2
( 1) (0 2) 3
( 1) ( 2) 3
1 4 9
1 5
1 5
1 5
x
x
x
x
x
x
− + − =
− + − =
− + =
− =
− = ±
= ±
y-intercepts:
( )( )
2 2 2
2 2 2
2
2
(0 1) ( 2) 3
( 1) ( 2) 3
1 2 9
2 8
2 8
2 2 2
2 2 2
y
y
y
y
y
y
y
− + − =
− + − =
+ − =
− =
− = ±
− = ±
= ±
The intercepts are ( ) ( )1 5, 0 , 1 5, 0 ,− +
( )0, 2 2 2 ,− and ( )0, 2 2 2 .+
98. 2 2 4 2 20 0x y x y+ + + − = 2 2
2 2
2 2 2
4 2 20
( 4 4) ( 2 1) 20 4 1
( 2) ( 1) 5
x x y y
x x y y
x y
+ + + =
+ + + + + = + +
+ + + =
a. Center: (–2,–1); Radius = 5 b.
c. x-intercepts: 2 2 2
2
2
( 2) (0 1) 5
( 2) 1 25
( 2) 24
2 24
2 2 6
2 2 6
x
x
x
x
x
x
+ + + =
+ + =
+ =
+ = ±
+ = ±
= − ±
y-intercepts: 2 2 2
2
2
(0 2) ( 1) 5
4 ( 1) 25
( 1) 21
1 21
1 21
y
y
y
y
y
+ + + =
+ + =
+ =
+ = ±
= − ±
The intercepts are ( )2 2 6, 0 ,− −
( )2 2 6, 0 ,− + ( )0, 1 21 ,− − and
( )0, 1 21 .− +
Section 1.2: Graphs of Equations in Two Variables; Circles
27 Copyright © 2016 Pearson Education, Inc.
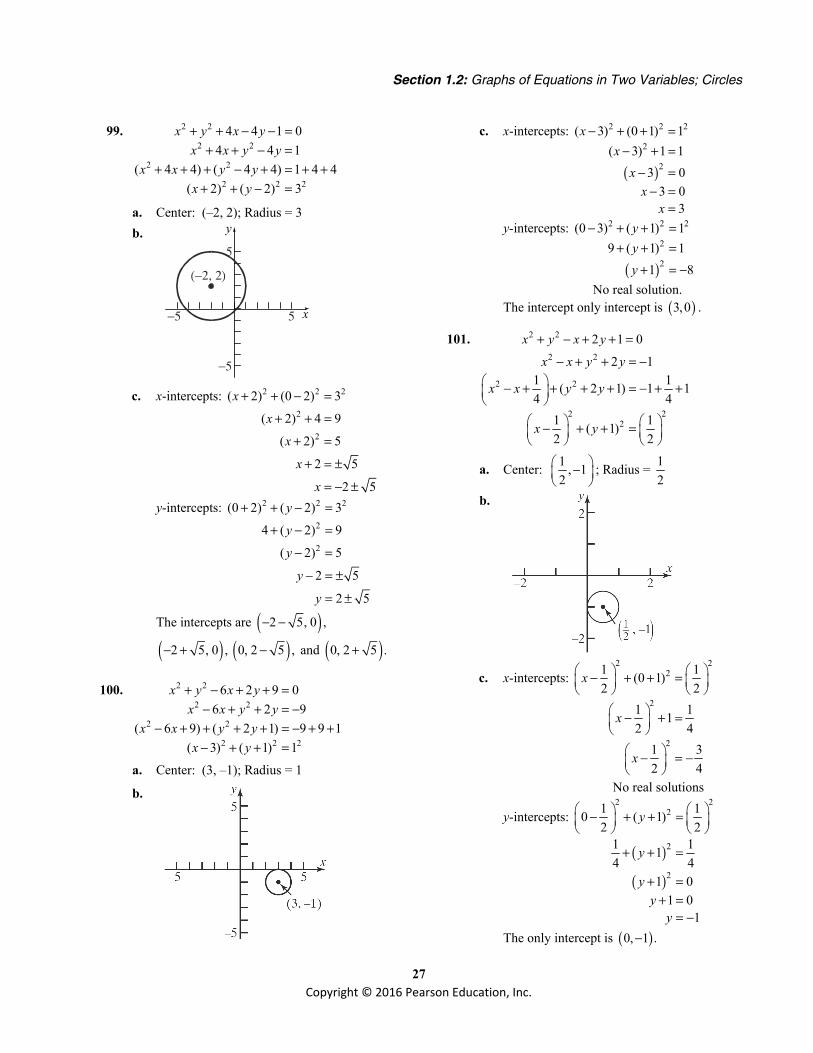
99. 2 2
2 2
2 2
2 2 2
4 4 1 04 4 1
( 4 4) ( 4 4) 1 4 4( 2) ( 2) 3
x y x yx x y y
x x y yx y
+ + − − =+ + − =
+ + + − + = + ++ + − =
a. Center: (–2, 2); Radius = 3 b. y
x−5 5
5
−5
(−2, 2)
c. x-intercepts: 2 2 2
2
2
( 2) (0 2) 3
( 2) 4 9
( 2) 5
2 5
2 5
x
x
x
x
x
+ + − =
+ + =
+ =
+ = ±
= − ±
y-intercepts: 2 2 2
2
2
(0 2) ( 2) 3
4 ( 2) 9
( 2) 5
2 5
2 5
y
y
y
y
y
+ + − =
+ − =
− =
− = ±
= ±
The intercepts are ( )2 5, 0 ,− −
( )2 5, 0 ,− + ( )0, 2 5 ,− and ( )0, 2 5 .+
100. 2 2
2 2
2 2
2 2 2
6 2 9 06 2 9
( 6 9) ( 2 1) 9 9 1( 3) ( 1) 1
x y x yx x y y
x x y yx y
+ − + + =− + + = −
− + + + + = − + +− + + =
a. Center: (3, –1); Radius = 1
b.
c. x-intercepts:
( )
2 2 2
2
2
( 3) (0 1) 1( 3) 1 1
3 03 0
3
xx
xx
x
− + + =− + =
− =− =
=
y-intercepts:
( )
2 2 2
2
2
(0 3) ( 1) 19 ( 1) 1
1 8
yyy
− + + =+ + =
+ = −
No real solution. The intercept only intercept is ( )3,0 .
101. 2 2 2 1 0x y x y+ − + + = 2 2
2 2
2 22
2 11 1( 2 1) 1 14 4
1 1( 1)2 2
x x y y
x x y y
x y
− + + = − − + + + + = − + +
− + + =
a. Center: 1 , 12
−
; Radius = 12
b.
c. x-intercepts: 2 2
2
2
2
1 1(0 1)2 2
1 112 4
1 32 4
x
x
x
− + + =
− + =
− = −
No real solutions
y-intercepts:
( )
( )
2 22
2
2
1 10 ( 1)2 2
1 114 4
1 01 0
1
y
y
yy
y
− + + =
+ + =
+ =+ =
= −
The only intercept is ( )0, 1 .−

Chapter 1: Graphs and Functions
28 Copyright © 2016 Pearson Education, Inc.
102. 2 2
2 2
2 2
2 22
1 02
12
1 1 1 1 14 4 2 4 4
1 1 12 2
x y x y
x x y y
x x y y
x y
+ + + − =
+ + + =
+ + + + + = + +
+ + + =
a. Center: 1 1,2 2
− −
; Radius = 1
b.
c. x-intercepts: 2 2
2
2
2
1 10 12 2
1 1 12 4
1 32 4
1 32 2
1 32
x
x
x
x
x
+ + + =
+ + =
+ =
+ = ±
− ±=
y-intercepts: 2 2
2
2
2
1 10 12 2
1 1 14 2
1 32 4
1 32 2
1 32
y
y
y
y
y
+ + + =
+ + =
+ =
+ = ±
− ±=
The intercepts are 1 3
2, 0 ,− −
1 3
2, 0 ,− +
1 3
20, ,− −
and 1 3
20, .− +
103. 2 2
2 2
2 2
2 2
2 2 2
2 2 12 8 24 0
6 4 12
6 4 12
( 6 9) ( 4 4) 12 9 4
( 3) ( 2) 5
x y x y
x y x y
x x y y
x x y y
x y
+ − + − =
+ − + =
− + + =
− + + + + = + +
− + + =
a. Center: (3,–2); Radius = 5
b.
c. x-intercepts:
( )( )
2 2 2
2
2
( 3) (0 2) 5
3 4 25
3 21
3 21
3 21
x
x
x
x
x
− + + =
− + =
− =
− = ±
= ±
y-intercepts:
( )( )
2 2 2
2
2
(0 3) ( 2) 5
9 2 25
2 162 4
2 4
y
y
yy
y
− + + =
+ + =
+ =+ = ±
= − ±
2 or 6y y= = −
The intercepts are ( )3 21, 0 ,− ( )3 21, 0 ,+
( )0, 6 ,− and ( )0, 2 .
104. a. 2 22 2 8 7 0x y x+ + + = 2 2
2 2
2 2
2 2
22 2
2 8 2 77427( 4 4) 42
1( 2)2
2( 2)2
x x y
x x y
x x y
x y
x y
+ + = −
+ + = −
+ + + = − +
+ + =
+ + =
Center: (–2, 0); Radius = 22

Section 1.2: Graphs of Equations in Two Variables; Circles
29 Copyright © 2016 Pearson Education, Inc.
b.
c. x-intercepts: ( )
( )
22
2
1( 2) 02122
12222
222
2
x
x
x
x
x
+ + =
+ =
+ = ±
+ = ±
= − ±
y-intercepts: 2 2
2
2
1(0 2)2142
72
y
y
y
+ + =
+ =
= −
No real solutions.
The intercepts are 22 , 02
− −
and
22 , 0 .2
− +
105.
( )
2 2
2 2
2 2
2 2 2
2 8 2 04 0
4 4 0 42 2
x x yx x y
x x yx y
+ + =+ + =
+ + + = ++ + =
a. Center: ( )2,0− ; Radius: 2r =
b.
c. x-intercepts: ( ) ( )
( )
2 2 2
2
2
2 0 2
( 2) 4
2 42 2
2 2
x
x
xx
x
+ + =
+ =
+ = ±+ = ±
= − ±
0 or 4x x= = − y-intercepts: ( )2 2 2
2
2
0 2 2
4 4
00
y
y
yy
+ + =
+ =
==
The intercepts are ( )4, 0− and ( )0, 0 .
106.
( )
2 2
2 2
2 2
22
3 3 12 04 0
4 4 0 4
2 4
x y yx y y
x y y
x y
+ − =+ − =
+ − + = +
+ − =
a. Center: ( )0, 2 ; Radius: 2r =
b.
c. x-intercepts: ( )22
2
2
0 2 4
4 4
00
x
x
xx
+ − =
+ =
==
y-intercepts: ( )( )
22
2
0 2 4
2 4
2 42 2
2 2
y
y
yy
y
+ − =
− =
− = ±− = ±
= ±
4 or 0y y= = The intercepts are ( )0, 0 and ( )0, 4 .
Chapter 1: Graphs and Functions
30 Copyright © 2016 Pearson Education, Inc.
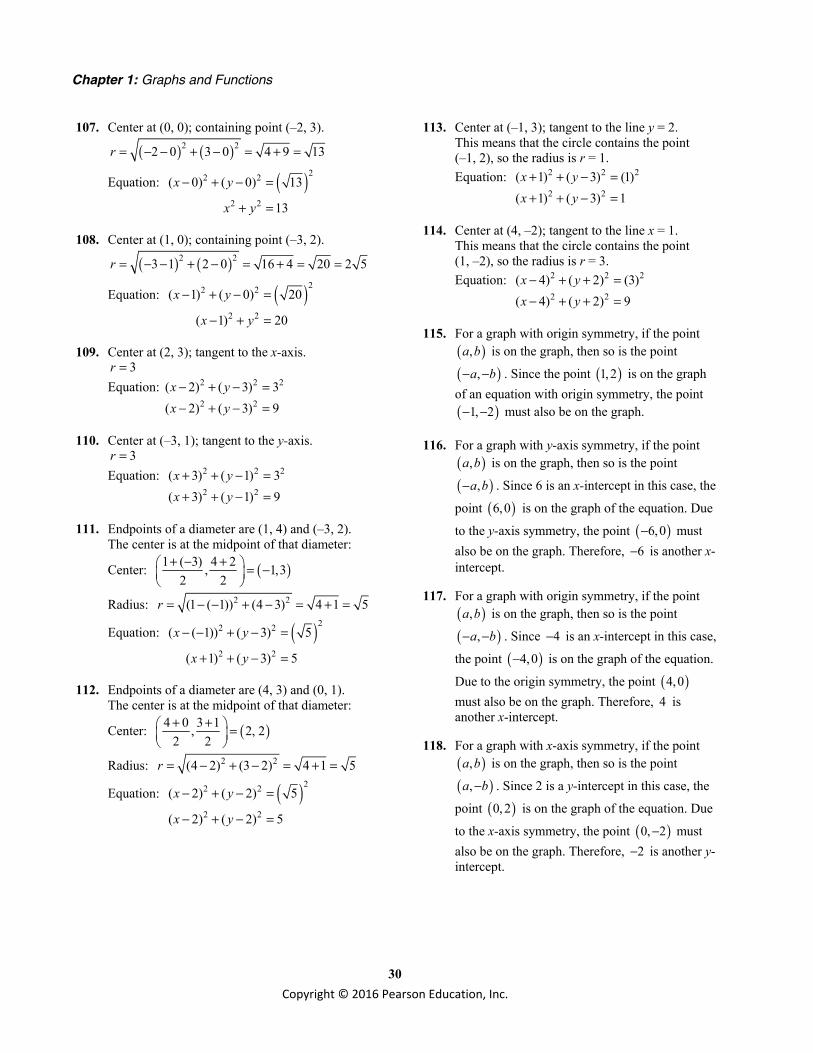
107. Center at (0, 0); containing point (–2, 3).
( ) ( )2 22 0 3 0 4 9 13r = − − + − = + =
Equation: ( )22 2
2 2
( 0) ( 0) 13
13
x y
x y
− + − =
+ =
108. Center at (1, 0); containing point (–3, 2).
( ) ( )2 23 1 2 0 16 4 20 2 5r = − − + − = + = =
Equation: ( )22 2
2 2
( 1) ( 0) 20
( 1) 20
x y
x y
− + − =
− + =
109. Center at (2, 3); tangent to the x-axis. 3r =
Equation: 2 2 2
2 2
( 2) ( 3) 3( 2) ( 3) 9x yx y
− + − =− + − =
110. Center at (–3, 1); tangent to the y-axis. 3r =
Equation: 2 2 2
2 2
( 3) ( 1) 3( 3) ( 1) 9x yx y
+ + − =+ + − =
111. Endpoints of a diameter are (1, 4) and (–3, 2). The center is at the midpoint of that diameter:
Center: ( )1 ( 3) 4 2, 1,32 2
+ − + = −
Radius: 2 2(1 ( 1)) (4 3) 4 1 5r = − − + − = + =
Equation: ( )22 2
2 2
( ( 1)) ( 3) 5
( 1) ( 3) 5
x y
x y
− − + − =
+ + − =
112. Endpoints of a diameter are (4, 3) and (0, 1). The center is at the midpoint of that diameter:
Center: ( )4 0 3 1, 2, 22 2+ + =
Radius: 2 2(4 2) (3 2) 4 1 5r = − + − = + =
Equation: ( )22 2
2 2
( 2) ( 2) 5
( 2) ( 2) 5
x y
x y
− + − =
− + − =
113. Center at (–1, 3); tangent to the line y = 2. This means that the circle contains the point (–1, 2), so the radius is r = 1. Equation: 2 2 2
2 2
( 1) ( 3) (1)( 1) ( 3) 1x yx y
+ + − =+ + − =
114. Center at (4, –2); tangent to the line x = 1. This means that the circle contains the point (1, –2), so the radius is r = 3. Equation: 2 2 2
2 2
( 4) ( 2) (3)( 4) ( 2) 9x yx y
− + + =− + + =
115. For a graph with origin symmetry, if the point ( ),a b is on the graph, then so is the point
( ),a b− − . Since the point ( )1,2 is on the graph of an equation with origin symmetry, the point ( )1, 2− − must also be on the graph.
116. For a graph with y-axis symmetry, if the point ( ),a b is on the graph, then so is the point
( ),a b− . Since 6 is an x-intercept in this case, the
point ( )6,0 is on the graph of the equation. Due
to the y-axis symmetry, the point ( )6,0− must also be on the graph. Therefore, 6− is another x-intercept.
117. For a graph with origin symmetry, if the point ( ),a b is on the graph, then so is the point
( ),a b− − . Since 4− is an x-intercept in this case,
the point ( )4,0− is on the graph of the equation.
Due to the origin symmetry, the point ( )4,0 must also be on the graph. Therefore, 4 is another x-intercept.
118. For a graph with x-axis symmetry, if the point ( ),a b is on the graph, then so is the point
( ),a b− . Since 2 is a y-intercept in this case, the
point ( )0, 2 is on the graph of the equation. Due
to the x-axis symmetry, the point ( )0, 2− must also be on the graph. Therefore, 2− is another y-intercept.

Section 1.2: Graphs of Equations in Two Variables; Circles
31 Copyright © 2016 Pearson Education, Inc.
119. a. ( )22 2 2 2x y x x y+ − = + x-intercepts:
( )( ) ( )
( )
( )
22 22 2
22 2
4 3 2 2
4 3
3
0 0
2
2 0
2 0
x x x
x x x
x x x x
x x
x x
+ − = +
− =
− + =
− =
− =
3 0 or 2 00 2
x xx x
= − == =
y-intercepts:
( )( ) ( )
( )
( )
22 22 2
22 2
4 2
4 2
2 2
0 0 0
0
1 0
y y
y y
y y
y y
y y
+ − = +
=
=
− =
− =
2 2
2
0 or 1 00 1
1
y yy y
y
= − == =
= ±
The intercepts are ( )0,0 , ( )2,0 , ( )0, 1 ,−
and ( )0,1 .
b. Test x-axis symmetry: Let y y= −
( )( ) ( )
( )
22 22 2
22 2 2 2 same
x y x x y
x y x x y
+ − − = + −
+ − = +
Test y-axis symmetry: Let x x= −
( ) ( )( ) ( )
( )
22 22 2
22 2 2 2 different
x y x x y
x y x x y
− + − − = − +
+ + = +
Test origin symmetry: Let x x= − and y y= −
( ) ( ) ( )( ) ( ) ( )
( )
22 2 2 2
22 2 2 2 different
x y x x y
x y x x y
− + − − − = − + −
+ + = +
Thus, the graph will have x-axis symmetry.
120. a. 216 120 225y x= − x-intercepts:
( )2
2
2
16 120 0 225
16 22522516
no real solution
y
y
y
= −
= −
= −
y-intercepts: ( )216 0 120 225
0 120 225120 225
225 15120 8
xx
x
x
= −= −
− = −−= =−
The only intercept is 15 ,08
.
b. Test x-axis symmetry: Let y y= −
( )2
2
16 120 225
16 120 225 same
y x
y x
− = −
= −
Test y-axis symmetry: Let x x= − ( )2
2
16 120 225
16 120 225 different
y x
y x
= − −
= − −
Test origin symmetry: Let x x= − and y y= −
( ) ( )2
2
16 120 225
16 120 225 different
y x
y x
− = − −
= − −
Thus, the graph will have x-axis symmetry.
121. Let the upper-right corner of the square be the point ( ),x y . The circle and the square are both centered about the origin. Because of symmetry, we have that x y= at the upper-right corner of the square. Therefore, we get
2 2
2 2
2
2
99
2 992
9 3 22 2
x yx x
x
x
x
+ =+ =
=
=
= =

Chapter 1: Graphs and Functions
32 Copyright © 2016 Pearson Education, Inc.
The length of one side of the square is 2x . Thus, the area is
( )2
22 3 22 3 2 182
A s
= = ⋅ = =
square units.
122. The area of the shaded region is the area of the circle, less the area of the square. Let the upper-right corner of the square be the point ( ),x y . The circle and the square are both centered about the origin. Because of symmetry, we have that x y= at the upper-right corner of the square. Therefore, we get
2 2
2 2
2
2
3636
2 36183 2
x yx x
xxx
+ =+ =
===
The length of one side of the square is 2x . Thus,
the area of the square is ( )22 3 2 72⋅ = square
units. From the equation of the circle, we have 6r = . The area of the circle is
( )22 6 36rπ π π= = square units. Therefore, the area of the shaded region is
36 72A π= − square units.
123. The diameter of the Ferris wheel was 250 feet, so the radius was 125 feet. The maximum height was 264 feet, so the center was at a height of 264 125 139− = feet above the ground. Since the center of the wheel is on the y-axis, it is the point (0, 139). Thus, an equation for the wheel is: ( ) ( )
( )
2 2 2
22
0 139 125
139 15,625
x y
x y
− + − =
+ − =
124. The diameter of the wheel is 520 feet, so the radius is 260 feet. The maximum height is 550 feet, so the center of the wheel is at a height of 550 260 290− = feet above the ground. Since the center of the wheel is on the y-axis, it is the point (0, 290). Thus, an equation for the wheel is: ( ) ( )
( )
2 2 2
22
0 290 260
290 67,600
x y
x y
− + − =
+ − =
125. (b), (c), (e) and (g) We need , 0h k > and ( )0,0 on the graph.
126. (b), (e) and (g) We need 0h < , 0k = , and h r> .
Thus, the graph will have x-axis symmetry.
127. a.
b. Since 2x x= for all x , the graphs of 2 and y x y x= = are the same.

Section 1.3: Functions and Their Graphs
33 Copyright © 2016 Pearson Education, Inc.
c. For ( )2y x= , the domain of the variable
x is 0x ≥ ; for y x= , the domain of the variable x is all real numbers. Thus,
( )2 only for 0.x x x= ≥
d. For 2y x= , the range of the variable y is 0y ≥ ; for y x= , the range of the variable
y is all real numbers. Also, 2x x= only
if 0x ≥ . Otherwise, 2x x= − .
128. Answers will vary. One example: y
x
129. Answers will vary
130. Answers will vary
131. Answers will vary. Case 1: Graph has x-axis and y-axis symmetry, show origin symmetry. ( ) ( ), on graph , on graph (from -axis symmetry)x y x y
x→ −
( ) ( )( )
, on graph , on graphfrom -axis symmetryx y x y
y
− → − −
Since the point ( ),x y− − is also on the graph, the graph has origin symmetry.
Case 2: Graph has x-axis and origin symmetry, show y-axis symmetry. ( ) ( )( )
, on graph , on graphfrom -axis symmetryx y x y
x
→ −
( ) ( )( )
, on graph , on graphfrom origin symmetryx y x y− → −
Since the point ( ),x y− is also on the graph, the graph has y-axis symmetry.
Case 3: Graph has y-axis and origin symmetry, show x-axis symmetry.
( ) ( )( )
, on graph , on graphfrom -axis symmetryx y x y
y
→ −
( ) ( )( )
, on graph , on graphfrom origin symmetry
x y x y− → −
Since the point ( ),x y− is also on the graph, the graph has x-axis symmetry.
132. Answers may vary. The graph must contain the points ( )2,5− , ( )1,3− , and ( )0, 2 . For the graph to be symmetric about the y-axis, the graph must also contain the points ( )2,5 and ( )1,3 (note that (0, 2) is on the y-axis).
For the graph to also be symmetric with respect to the x-axis, the graph must also contain the points ( )2, 5− − , ( )1, 3− − , ( )0, 2− , ( )2, 5− , and
( )1, 3− . Recall that a graph with two of the symmetries (x-axis, y-axis, origin) will necessarily have the third. Therefore, if the original graph with y-axis symmetry also has x-axis symmetry, then it will also have origin symmetry.
133. Answers will vary.
134. The student has the correct radius, but the signs of the coordinates of the center are incorrect. The student needs to write the equation in the standard form ( ) ( )2 2 2x h y k r− + − = .
( ) ( )( )( ) ( )
2 2
2 2 2
3 2 16
3 2 4
x y
x y
+ + − =
− − + − =
Thus, ( ) ( ), 3, 2h k = − and 4r = .
Section 1.3
1. ( )1,3−
2. ( ) ( ) ( ) ( ) ( )2
12
1 13 2 5 2 3 4 5 22 2
112 102
43 or 21 or 21.52
− − − + = − − −−
= + −
=

Chapter 1: Graphs and Functions
34 Copyright © 2016 Pearson Education, Inc.
3. We must not allow the denominator to be 0. 4 0 4x x+ ≠ ≠ − ; Domain: { }4x x ≠ − .
4. 3 2 52 2
1
xxx
− >− >
< −
Solution set: { }| 1x x < − or ( ), 1−∞ −
−1 0
5. 5 2+
6. radicals
7. independent; dependent
8. [ ]0,5
We need the intersection of the intervals [ ]0,7
and [ ]2,5− . That is, domain of domain of f g∩ .
7−2 50
7−2 50
7−2 50
f
g
f + g
9. ≠ ; f; g
10. ( )( )g f x− or ( ) ( )g x f x−
11. False; every function is a relation, but not every relation is a function. For example, the relation
2 2 1x y+ = is not a function.
12. True
13. vertical
14. 3−
15. ( ) 2 4f x ax= +
( )21 4 2 2a a− + = = −
16. False. The graph must pass the vertical line test in order to be the graph of a function.
17. True
18. a
19. Function Domain: {Elvis, Colleen, Kaleigh, Marissa} Range: {Jan. 8, Mar. 15, Sept. 17}
20. Not a function
21. Not a function
22. Function Domain: {Less than 9th grade, 9th-12th grade, High School Graduate, Some College, College Graduate}
Range: {$18,120, $23,251, $36,055, $45,810, $67,165}
23. Not a function
24. Function Domain: {–2, –1, 3, 4} Range: {3, 5, 7, 12}
25. Function Domain: {1, 2, 3, 4} Range: {3}
26. Function Domain: {0, 1, 2, 3} Range: {–2, 3, 7}
27. Not a function
28. Not a function
29. Function Domain: {–2, –1, 0, 1} Range: {0, 1, 4}
30. Function Domain: {–2, –1, 0, 1} Range: {3, 4, 16}
31. Graph 22 3 4y x x= − + . The graph passes the vertical line test. Thus, the equation represents a function.

Section 1.3: Functions and Their Graphs
35 Copyright © 2016 Pearson Education, Inc.
32. Graph 3y x= . The graph passes the vertical line test. Thus, the equation represents a function.
33. Graph 1yx
= . The graph passes the vertical line
test. Thus, the equation represents a function.
34. Graph y x= . The graph passes the vertical line test. Thus, the equation represents a function.
35. 2 24y x= −
Solve for 2: 4y y x= ± − For 0, 2x y= = ± . Thus, (0, 2) and (0, –2) are on the graph. This is not a function, since a distinct x-value corresponds to two different y-values.
36. 1 2y x= ± − For 0, 1x y= = ± . Thus, (0, 1) and (0, –1) are on the graph. This is not a function, since a distinct x-value corresponds to two different y-values.
37. 2x y= Solve for :y y x= ± For 1, 1x y= = ± . Thus, (1, 1) and (1, –1) are on the graph. This is not a function, since a distinct x-value corresponds to two different y-values.
38. 2 1x y+ = Solve for : 1y y x= ± − For 0, 1x y= = ± . Thus, (0, 1) and (0, –1) are on the graph. This is not a function, since a distinct x-value corresponds to two different y-values.
39. Graph 2y x= . The graph passes the vertical line test. Thus, the equation represents a function.
40. Graph 3 12
xyx
−=+
. The graph passes the vertical
line test. Thus, the equation represents a function.
41. 2 22 3 1x y+ = Solve for y: 2 2
2 2
22
2
2 3 1
3 1 2
1 23
1 23
x y
y x
xy
xy
+ =
= −
−=
−= ±
For 10,3
x y= = ± . Thus, 10,3
and
10,3
−
are on the graph. This is not a
function, since a distinct x-value corresponds to two different y-values.
42. 2 24 1x y− = Solve for y: 2 2
2 2
22
2
4 1
4 1
14
12
x y
y x
xy
xy
− =
= −
−=
± −=
For 12,2
x y= = ± . Thus, 12,2
and
12,2
−
are on the graph. This is not a
function, since a distinct x-value corresponds to two different y-values.
Chapter 1: Graphs and Functions
36 Copyright © 2016 Pearson Education, Inc.
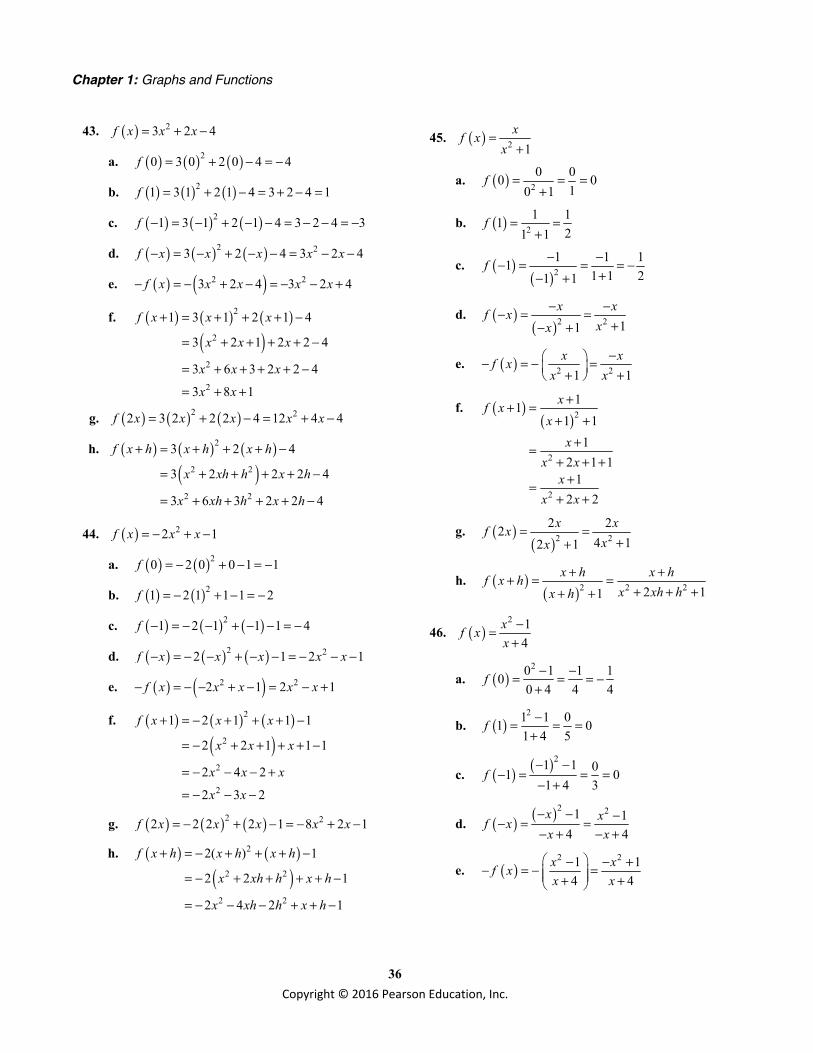
43. ( ) 23 2 4f x x x= + −
a. ( ) ( ) ( )20 3 0 2 0 4 4f = + − = −
b. ( ) ( ) ( )21 3 1 2 1 4 3 2 4 1f = + − = + − =
c. ( ) ( ) ( )21 3 1 2 1 4 3 2 4 3f − = − + − − = − − = −
d. ( ) ( ) ( )2 23 2 4 3 2 4f x x x x x− = − + − − = − −
e. ( ) ( )2 23 2 4 3 2 4f x x x x x− = − + − = − − +
f. ( ) ( ) ( )( )
2
2
2
2
1 3 1 2 1 4
3 2 1 2 2 4
3 6 3 2 2 4
3 8 1
f x x x
x x x
x x x
x x
+ = + + + −
= + + + + −
= + + + + −
= + +
g. ( ) ( ) ( )2 22 3 2 2 2 4 12 4 4f x x x x x= + − = + −
h. ( ) ( ) ( )( )
2
2 2
2 2
3 2 4
3 2 2 2 4
3 6 3 2 2 4
f x h x h x h
x xh h x h
x xh h x h
+ = + + + −
= + + + + −
= + + + + −
44. ( ) 22 1f x x x= − + −
a. ( ) ( )20 2 0 0 1 1f = − + − = −
b. ( ) ( )21 2 1 1 1 2f = − + − = −
c. ( ) ( ) ( )21 2 1 1 1 4f − = − − + − − = −
d. ( ) ( ) ( )2 22 1 2 1f x x x x x− = − − + − − = − − −
e. ( ) ( )2 22 1 2 1f x x x x x− = − − + − = − +
f. ( ) ( ) ( )( )
2
2
2
2
1 2 1 1 1
2 2 1 1 1
2 4 2
2 3 2
f x x x
x x x
x x x
x x
+ = − + + + −
= − + + + + −
= − − − +
= − − −
g. ( ) ( ) ( )2 22 2 2 2 1 8 2 1f x x x x x= − + − = − + −
h. ( ) ( )( )
2
2 2
2 2
2( ) 1
2 2 1
2 4 2 1
f x h x h x h
x xh h x h
x xh h x h
+ = − + + + −
= − + + + + −
= − − − + + −
45. ( ) 2 1xf x
x=
+
a. ( ) 20 00 0
10 1f = = =
+
b. ( ) 21 11
21 1f = =
+
c. ( )( )2
1 1 111 1 21 1
f − −− = = = −+− +
d. ( )( )2 2 11
x xf xxx
− −− = =+− +
e. ( ) 2 21 1x xf x
x x− − = − = + +
f. ( )( )2
2
2
111 1
12 1 1
12 2
xf xx
xx x
xx x
++ =+ +
+=+ + +
+=+ +
g. ( )( )2 2
2 224 12 1
x xf xxx
= =++
h. ( )( )2 2 22 11
x h x hf x hx xh hx h
+ ++ = =+ + ++ +
46. ( )2 1
4xf xx
−=+
a. ( )20 1 1 10
0 4 4 4f − −= = = −
+
b. ( )21 1 01 0
1 4 5f −= = =
+
c. ( ) ( )21 1 01 01 4 3
f− −
− = = =− +
d. ( ) ( )2 21 14 4
x xf xx x
− − −− = =− + − +
e. ( )2 21 1
4 4x xf xx x
− − +− = − = + +
Section 1.3: Functions and Their Graphs
37 Copyright © 2016 Pearson Education, Inc.
f. ( ) ( )( )
2
2 2
1 11
1 4
2 1 1 25 5
xf x
x
x x x xx x
+ −+ =
+ +
+ + − += =+ +
g. ( ) ( )2 22 1 4 122 4 2 4x xf xx x
− −= =+ +
h. ( ) ( )( )
2 2 21 2 14 4
x h x xh hf x hx h x h+ − + + −+ = =+ + + +
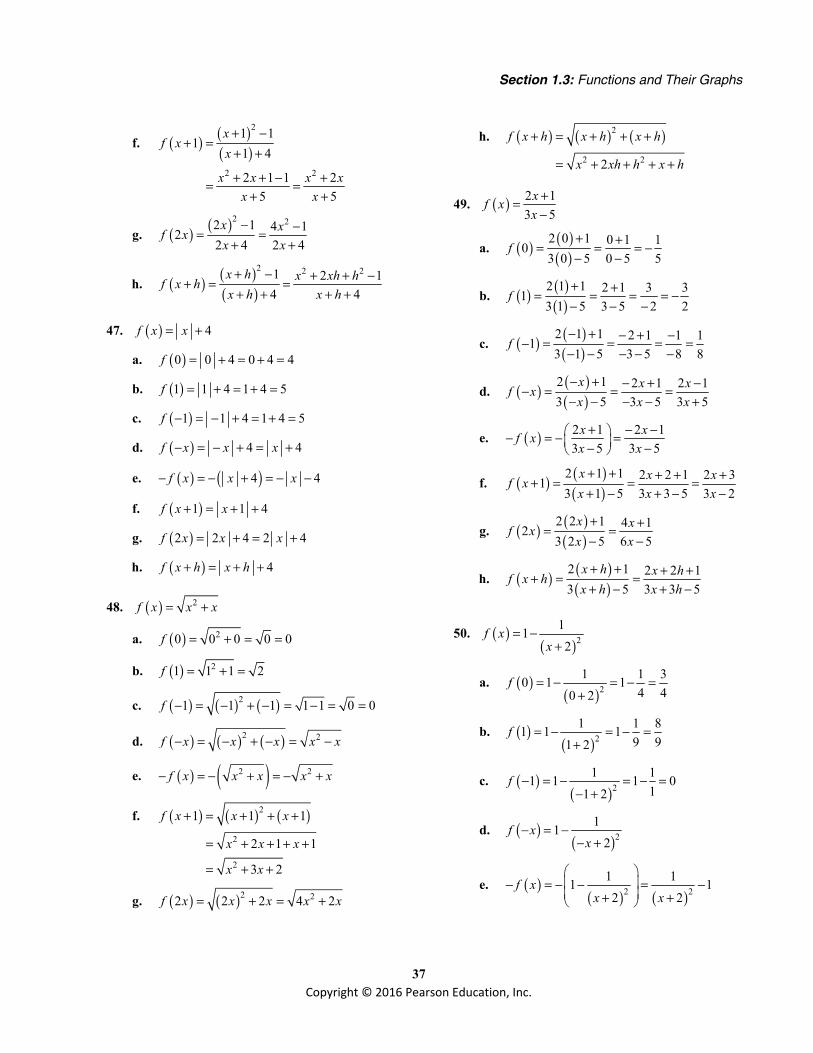
47. ( ) 4f x x= +
a. ( )0 0 4 0 4 4f = + = + =
b. ( )1 1 4 1 4 5f = + = + =
c. ( )1 1 4 1 4 5f − = − + = + =
d. ( ) 4 4f x x x− = − + = +
e. ( ) ( )4 4f x x x− = − + = − −
f. ( )1 1 4f x x+ = + +
g. ( )2 2 4 2 4f x x x= + = +
h. ( ) 4f x h x h+ = + +
48. ( ) 2f x x x= +
a. ( ) 20 0 0 0 0f = + = =
b. ( ) 21 1 1 2f = + =
c. ( ) ( ) ( )21 1 1 1 1 0 0f − = − + − = − = =
d. ( ) ( ) ( )2 2f x x x x x− = − + − = −
e. ( ) ( )2 2f x x x x x− = − + = − +
f. ( ) ( ) ( )2
2
2
1 1 1
2 1 1
3 2
f x x x
x x x
x x
+ = + + +
= + + + +
= + +
g. ( ) ( )2 22 2 2 4 2f x x x x x= + = +
h. ( ) ( ) ( )2
2 22
f x h x h x h
x xh h x h
+ = + + +
= + + + +
49. ( ) 2 13 5
xf xx
+=−
a. ( ) ( )( )
2 0 1 0 1 103 0 5 0 5 5
f+ += = = −− −
b. ( ) ( )( )
2 1 1 2 1 3 313 1 5 3 5 2 2
f+ += = = = −− − −
c. ( ) ( )( )
2 1 1 2 1 1 113 1 5 3 5 8 8
f− + − + −− = = = =− − − − −
d. ( ) ( )( )
2 1 2 1 2 13 5 3 5 3 5
x x xf xx x x
− + − + −− = = =− − − − +
e. ( ) 2 1 2 13 5 3 5
x xf xx x
+ − − − = − = − −
f. ( ) ( )( )
2 1 1 2 2 1 2 313 1 5 3 3 5 3 2
x x xf xx x x
+ + + + ++ = = =+ − + − −
g. ( ) ( )( )
2 2 1 4 123 2 5 6 5
x xf xx x
+ += =− −
h. ( ) ( )( )
2 1 2 2 13 5 3 3 5
x h x hf x hx h x h
+ + + ++ = =+ − + −
50. ( )( )2
112
f xx
= −+
a. ( )( )2
1 1 30 1 14 40 2
f = − = − =+
b. ( )( )2
1 1 81 1 19 91 2
f = − = − =+
c. ( )( )2
1 11 1 1 011 2
f − = − = − =− +
d. ( )( )2
112
f xx
− = −− +
e. ( )( ) ( )2 2
1 11 12 2
f xx x
− = − − = − + +
Chapter 1: Graphs and Functions
38 Copyright © 2016 Pearson Education, Inc.
f. ( )( ) ( )2 2
1 11 1 11 2 3
f xx x
+ = − = −+ + +
g. ( )( ) ( )2 2
1 12 1 12 2 4 1
f xx x
= − = −+ +
h. ( )( )2
112
f x hx h
+ = −+ +
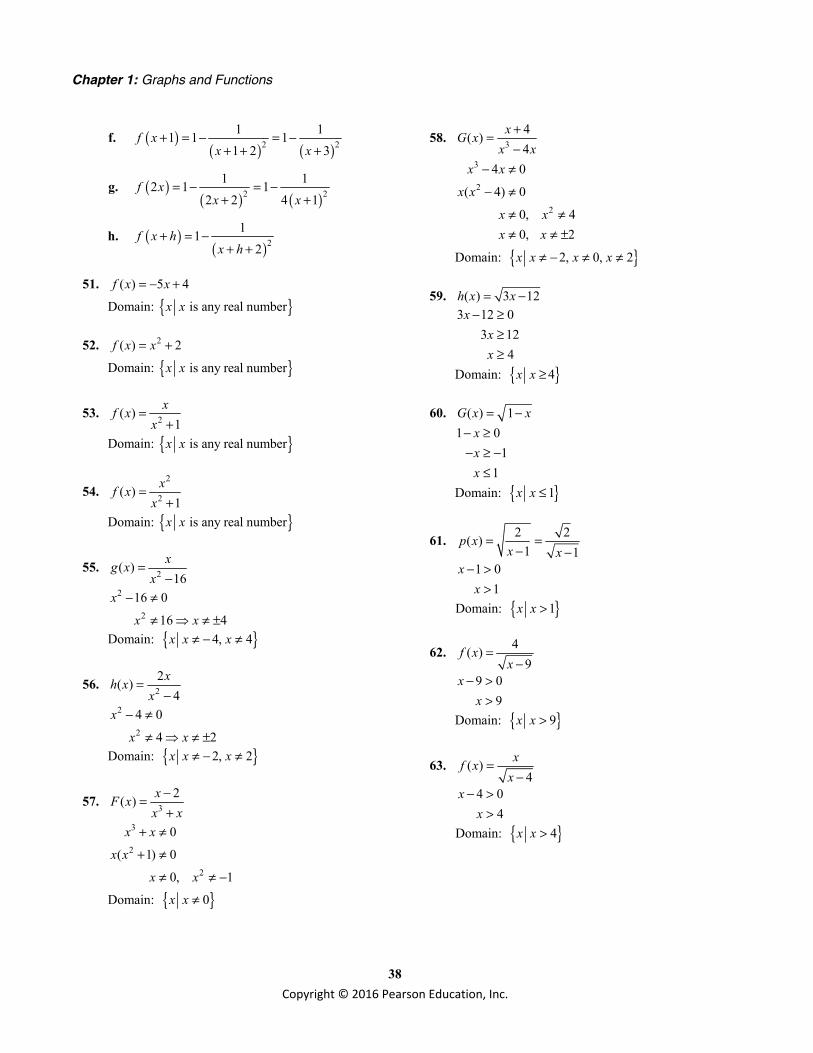
51. ( ) 5 4f x x= − +
Domain: { } is any real numberx x
52. 2( ) 2f x x= +
Domain: { } is any real numberx x
53. 2( )1
xf xx
=+
Domain: { } is any real numberx x
54. 2
2( )1
xf xx
=+
Domain: { } is any real numberx x
55. 2( )16
xg xx
=−
2
2
16 0
16 4
x
x x
− ≠
≠ ≠ ±
Domain: { }4, 4x x x≠ − ≠
56. 22( )
4xh x
x=
−
2
2
4 0
4 2
x
x x
− ≠
≠ ≠ ±
Domain: { }2, 2x x x≠ − ≠
57. 32( ) xF x
x x−=+
3
2
2
0
( 1) 0
0, 1
x x
x x
x x
+ ≠
+ ≠
≠ ≠ −
Domain: { }0x x ≠
58. 34( )4
xG xx x
+=−
3
2
2
4 0
( 4) 0
0, 40, 2
x x
x x
x xx x
− ≠
− ≠
≠ ≠≠ ≠ ±
Domain: { }2, 0, 2x x x x≠ − ≠ ≠
59. ( ) 3 12h x x= − 3 12 0
3 124
xxx
− ≥≥≥
Domain: { }4x x ≥
60. ( ) 1G x x= − 1 0
11
xxx
− ≥− ≥ −
≤
Domain: { }1x x ≤
61. 2 2( )1 1
p xx x
= =− −
1 01
xx
− >>
Domain: { }1x x >
62. 4( )9
f xx
=−
9 09
xx
− >>
Domain: { }9x x >
63. ( )4
xf xx
=−
4 04
xx
− >>
Domain: { }4x x >
Section 1.3: Functions and Their Graphs
39 Copyright © 2016 Pearson Education, Inc.
64. 2
( ) xx
q x −− −
=
2 02
2
xxx
− − >− >
< −
Domain: { }2x x < −
65. 4( )3 21
tP tt
−=−
4 04
tt
− ≥≥
Also 3 21 0t − ≠
3 21 0
3 217
ttt
− ≠≠≠
Domain: { }4, 7t t t≥ ≠
66. 3( )2
zh zz
+=−
3 03
zz
+ ≥≥ −
Also 2 02
zz
− ≠≠
Domain: { }3, 2z z z≥ − ≠
67. ( ) 4 3f x x= + ( ) ( ) 4( ) 3 (4 3)
4 4 3 4 3
4 4
f x h f x x h xh h
x h xh
hh
+ − + + − +=
+ + − −=
= =
68. ( ) 3 1f x x= − + ( ) ( ) 3( ) 1 ( 3 1)
3 3 1 3 1
3 3
f x h f x x h xh h
x h xh
hh
+ − − + + − − +=
− − + + −=
−= = −
69. 2( ) 4f x x= −
2 2
2 2 2
2
( ) ( )
( ) 4 ( 4)
2 4 4
2
2
f x h f xh
x h xh
x xh h xh
xh hh
x h
+ −
+ − − −=
+ + − − +=
+=
= +
70. 2( ) 3 2f x x= +
2 2
2 2 2
2
( ) ( )
3( ) 2 (3 2)
3 6 3 2 3 2
6 3
6 3
f x h f xh
x h xh
x xh h xh
xh hh
x h
+ −
+ + − +=
+ + + − −=
+=
= +
71. 2( ) 4f x x x= − +
2 2
2 2 2
2
( ) ( )
( ) ( ) 4 ( 4)
2 4 4
2
2 1
f x h f xh
x h x h x xh
x xh h x h x xh
xh h hh
x h
+ −
+ − + + − − +=
+ + − − + − + −=
+ −=
= + −
72. ( ) 23 2 6f x x x= − +
( ) ( )
( ) ( )
( )
2 2
2 2 2
2 2 2 2
3 2 6 3 2 6
3 2 2 2 6 3 2 6
3 6 3 2 3 6 3 2
6 3 2
f x h f xh
x h x h x x
hx xh h x h x x
hx xh h h x xh h h
h hx h
+ −
+ − + + − − + =
+ + − − + − + −=
+ + − − + −= =
= + −

Chapter 1: Graphs and Functions
40 Copyright © 2016 Pearson Education, Inc.
73. ( ) 21f xx
=
( )
( )( )
( )( )
( )( )
( )
( )( )( )
2 2
22
22
2 2
22
2
22
22
2 22 2
1 1
( ) ( )
2
1 2
21
22
xx hf x h f xh h
x x h
x x hh
x x xh h
x x hh
xh hh x x h
h x hh x x h
x hx hx x h x x h
−++ − =
− +
+=
− + +
+=
− − = +
− − = +
− +− −= =+ +
74. 1( )3
f xx
=+
( )( )( )
( )( )
( )( )
( )( )
1 1( ) ( ) 3 3
3 33 3
3 3 13 3
13 31
3 3
f x h f x x h xh h
x x hx h x
hx x hx h x h
hx h x h
x h x
−+ − + + +=
+ − + ++ + +
=
+ − − − = + + + − = + + +
−=+ + +
75. 2( )3
xf xx
=+
( )( )( )
( )( )
( )( )
( )( )
2 22 6 2 6 2 6 23 3
2( ) 2( ) ( ) 3 3
2( )( 3) 2 33 3
6 13 3
63 3
x x hx h x x xhx h x
h
x h xf x h f x x h x
h hx h x x x h
x h xh
hx h x h
x h x
+ + + − − −+ + +
+ −+ − + + +=
+ + − + ++ + +
=
=
= + + +
=+ + +
76. 5( )4
xf xx
=−
( )( )( )
( )( )
( )( )
( )( )
2 25 5 20 5 5
4 4
20 20
5( ) 5( ) ( ) 4 4
5( )( 4) 5 44 4
20 14 4204 4
x x hx h x x xh
x h x
h
x h xf x h f x x h x
h hx h x x x h
x h xh
hx h x h
x h x
+ − − −
+ − −
− +
+ −+ − + − −=
+ − − − ++ − −
=
=
− = + − −
= −+ − −
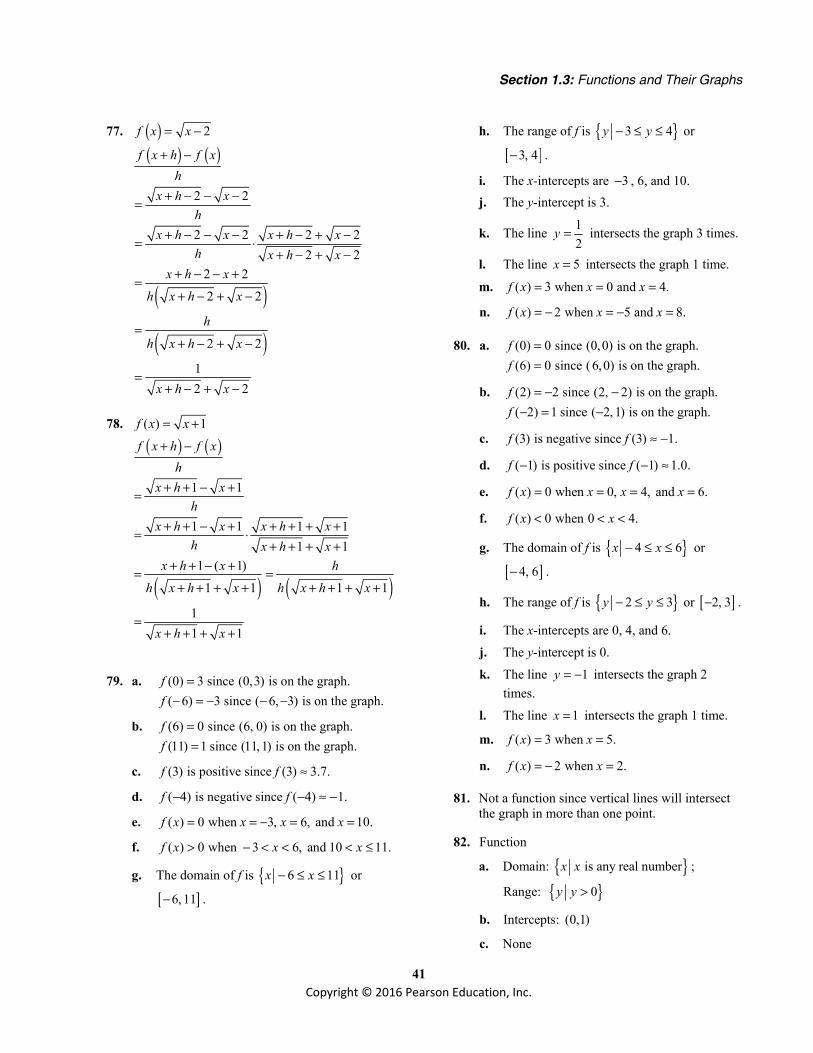
Section 1.3: Functions and Their Graphs
41 Copyright © 2016 Pearson Education, Inc.
77. ( ) 2f x x= −
( ) ( )
( )
( )
2 2
2 2 2 22 2
2 22 2
2 2
12 2
f x h f xh
x h xh
x h x x h xh x h x
x h x
h x h x
h
h x h x
x h x
+ −
+ − − −=
+ − − − + − + −= ⋅+ − + −
+ − − +=
+ − + −
=+ − + −
=+ − + −
78. ( ) 1f x x= + ( ) ( )
( ) ( )
1 1
1 1 1 11 1
1 ( 1)1 1 1 1
11 1
f x h f xh
x h xh
x h x x h xh x h x
x h x h
h x h x h x h x
x h x
+ −
+ + − +=
+ + − + + + + += ⋅+ + + +
+ + − += =+ + + + + + + +
=+ + + +
79. a. (0) 3 since (0,3) is on the graph.f = ( 6) 3 since ( 6, 3) is on the graph.f − = − − −
b. (6) 0 since (6, 0) is on the graph.f = (11) 1 since (11, 1) is on the graph.f =
c. (3) is positive since (3) 3.7.f f ≈
d. ( 4) is negative since ( 4) 1.f f− − ≈ −
e. ( ) 0 when 3, 6, and 10.f x x x x= = − = =
f. ( ) 0 when 3 6, and 10 11.f x x x> − < < < ≤
g. The domain of f is { }6 11x x− ≤ ≤ or
[ ]6, 11− .
h. The range of f is { }3 4y y− ≤ ≤ or
[ ]3, 4− .
i. The x-intercepts are 3− , 6, and 10. j. The y-intercept is 3.
k. The line 12
y = intersects the graph 3 times.
l. The line 5x = intersects the graph 1 time.
m. ( ) 3 when 0 and 4.f x x x= = =
n. ( ) 2 when 5 and 8.f x x x= − = − =
80. a. (0) 0 since (0,0) is on the graph.f = (6) 0 since (6,0) is on the graph.f =
b. (2) 2 since (2, 2) is on the graph.f = − − ( 2) 1 since ( 2, 1) is on the graph.f − = −
c. (3) is negative since (3) 1.f f ≈ −
d. ( 1) is positive since ( 1) 1.0.f f− − ≈
e. ( ) 0 when 0, 4, and 6.f x x x x= = = =
f. ( ) 0 when 0 4.f x x< < <
g. The domain of f is { }4 6x x− ≤ ≤ or
[ ]4, 6− .
h. The range of f is { }2 3y y− ≤ ≤ or [ ]2, 3− .
i. The x-intercepts are 0, 4, and 6. j. The y-intercept is 0. k. The line 1y = − intersects the graph 2
times. l. The line 1x = intersects the graph 1 time.
m. ( ) 3 when 5.f x x= =
n. ( ) 2 when 2.f x x= − =
81. Not a function since vertical lines will intersect the graph in more than one point.
82. Function
a. Domain: { } is any real numberx x ;
Range: { }0y y >
b. Intercepts: (0,1)
c. None

Chapter 1: Graphs and Functions
42 Copyright © 2016 Pearson Education, Inc.
83. Function
a. Domain: { }x x− π ≤ ≤ π ;
Range: { }1 1y y− ≤ ≤
b. Intercepts: ,0 , ,0 , (0,1)2 2π π −
c. Symmetry about y-axis.
84. Function
a. Domain: { }x x− π ≤ ≤ π ;
Range: { }1 1y y− ≤ ≤
b. Intercepts: ( ) ( ), 0 , , 0 , (0, 0)−π π
c. Symmetry about the origin.
85. Not a function since vertical lines will intersect the graph in more than one point.
86. Not a function since vertical lines will intersect the graph in more than one point.
87. Function
a. Domain: { }0 3x x< < ;
Range: { } <2y y
b. Intercepts: (1, 0) c. None
88. Function
a. Domain: { }0 4x x≤ < ;
Range: { }0 3y y≤ <
b. Intercepts: (0, 0) c. None
89. Function
a. Domain: { } is any real numberx x ;
Range: { }2y y ≤
b. Intercepts: (–3, 0), (3, 0), (0,2) c. Symmetry about y-axis.
90. Function
a. Domain: { }3x x ≥ − ;
Range: { }0y y ≥
b. Intercepts: (–3, 0), (2,0), (0,2)
c. None
91. Function
a. Domain: { }is any real numberx x ;
Range: { }3y y ≥ −
b. Intercepts: (1, 0), (3,0), (0,9) c. None
92. Function
a. Domain: { }is any real numberx x ;
Range: { }5y y ≤
b. Intercepts: (–1, 0), (2,0), (0,4) c. None
93. 2( ) 2 1f x x x= − −
a. ( ) ( )2( 1) 2 1 1 1 2f − = − − − − =
The point ( )1, 2− is on the graph of f.
b. ( ) ( )2( 2) 2 2 2 1 9f − = − − − − =
The point ( )2,9− is on the graph of f.
c. Solve for x :
( )
2
2
12
1 2 1
0 2
0 2 1 0,
x x
x x
x x x x
− = − −
= −
= − = =
(0, –1) and ( )12 , 1− are on the graph of f .
d. The domain of f is { } is any real numberx x .
e. x-intercepts: ( )
( )( )
( )
2=0 2 1 012 1 1 0 , 12
1 ,0 and 1,02
f x x x
x x x x
− − =
+ − = = − =
−
f. y-intercept: ( ) ( ) ( )20 =2 0 0 1 1 0, 1f − − = − −

Section 1.3: Functions and Their Graphs
43 Copyright © 2016 Pearson Education, Inc.
94. 2( ) 3 5f x x x= − +
a. ( ) ( )2( 1) 3 1 5 1 8 2 f − = − − + − = − ≠
The point ( )1, 2− is not on the graph of f.
b. ( ) ( )2( 2) 3 2 5 2 = 22f − = − − + − −
The point ( )2, 22− − is on the graph of f.
c. Solve for x :
( ) ( )
2 2
13
2 3 5 3 5 2 0
3 1 2 0 , 2
x x x x
x x x x
− = − + − − =
+ − = = − =
(2, –2) and ( )13 , 2− − on the graph of f .
d. The domain of f is{ } is any real numberx x .
e. x-intercepts: ( )( )
( ) ( )
2
53
53
=0 3 5 0
3 5 0 0,
0,0 and ,0
f x x x
x x x x
− + =
− + = = =
f. y-intercept: ( ) ( ) ( ) ( )20 3 0 5 0 0 0,0f = − + =
95. 2( )6
xf xx
+=−
a. 3 2 5(3) 143 6 3
f += = − ≠−
The point ( )3,14 is not on the graph of f.
b. 4 2 6(4) 34 6 2
f += = = −− −
The point ( )4, 3− is on the graph of f.
c. Solve for x : 226
2 12 214
xx
x xx
+=−
− = +=
(14, 2) is a point on the graph of f .
d. The domain of f is { }6x x ≠ .
e. x-intercepts:
( )
( )
2=0 06
2 0 2 2,0
xf xx
x x
+ =
−+ = = − −
f. y-intercept: ( ) 0 2 1 10 0,0 6 3 3
f + = = − − −
96. 2 2( )
4xf xx
+=+
a. 21 2 3(1)1 4 5
f += =+
The point 31,5
is on the graph of f.
b. 20 2 2 1(0)
0 4 4 2f += = =
+
The point 10,2
is on the graph of f.
c. Solve for x :
( )
22
2
1 2 4 2 42 40 2
12 1 0 0 or 2
x x xxx x
x x x x
+= + = ++
= −
− = = =
1 1 10, and ,2 2 2
are on the graph of f .
d. The domain of f is{ }4x x ≠ − .
e. x-intercepts:
( )2
22=0 0 2 04
xf x xx
+ = + =
+
This is impossible, so there are no x-intercepts.
f. y-intercept:
( )20 2 2 1 10 0,
0 4 4 2 2f + = = = +
97. 2
42( )
1xf x
x=
+
a. 2
42( 1) 2( 1) 1
2( 1) 1f −− = = =
− +
The point (–1,1) is on the graph of f.
b. 2
42(2) 8(2)
17(2) 1f = =
+
The point 82,17
is on the graph of f.

Chapter 1: Graphs and Functions
44 Copyright © 2016 Pearson Education, Inc.
c. Solve for x : 2
4
4 2
4 2
2 2
211
1 22 1 0
( 1) 0
xx
x xx x
x
=+
+ =− + =
− =
2 1 0 1x x− = = ± (1,1) and (–1,1) are on the graph of f .
d. The domain of f is { } is any real numberx x .
e. x-intercept:
( )
( )
2
4
2
2=0 01
2 0 0 0,0
xf xx
x x
=+
= =
f. y-intercept:
( ) ( ) ( )2
4
2 0 00 0 0,00 10 1
f = = = ++
98. 2( )2
xf xx
=−
a.
121 1 22
1 32 322 2
f
= = = −
− −
The point 1 2,2 3
−
is on the graph of f.
b. 2(4) 8(4) 44 2 2
f = = =−
The point ( )4, 4 is on the graph of f.
c. Solve for x : 2 21 2 2
2x xx x
x== − − =
−
(–2,1) is a point on the graph of f .
d. The domain of f is { }2x x ≠ .
e. x-intercept:
( )
( )
2=0 0 2 02
0 0,0
xf x xx
x
= =−
=
f. y-intercept: ( ) ( )00 0 0,00 2
f = = −
99. 3 2( ) 2 4 5 and (2) 5f x x Ax x f= + + − = 3 2(2) 2(2) (2) 4(2) 5
5 16 4 8 55 4 19
14 414 74 2
f AA
AA
A
= + + −= + + −= +
− =−= = −
100. 2( ) 3 4 and ( 1) 12f x x Bx f= − + − = : 2( 1) 3( 1) ( 1) 4
12 3 45
f BB
B
− = − − − += + +=
101. 3 8( ) and (0) 22
xf x fx A
+= =−
3(0) 8(0)2(0)82
2 84
fA
AAA
+=−
=−
− == −
102. 2 1( ) and (2)3 4 2x Bf x fx
−= =+
2(2)(2)3(2) 4
1 42 105 4
1
Bf
B
BB
−=+
−=
= −= −
103. Let x represent the length of the rectangle.
Then, 2x represents the width of the rectangle
since the length is twice the width. The function
for the area is: 2
21( )2 2 2x xA x x x= ⋅ = =
104. Let x represent the length of one of the two equal sides. The function for the area is:
21 1( )2 2
A x x x x= ⋅ ⋅ =
105. Let x represent the number of hours worked. The function for the gross salary is:
( ) 14G x x=

Section 1.3: Functions and Their Graphs
45 Copyright © 2016 Pearson Education, Inc.
106. Let x represent the number of items sold. The function for the gross salary is:
( ) 10 100G x x= +
107. a. P is the dependent variable; a is the independent variable
b. 2(20) 0.014(20) 5.073(20) 327.2875.6 101.46 327.287231.427
P = − += − +=
In 2012 there are 231.427 million people who are 20 years of age or older.
c. 2(0) 0.014(0) 5.073(0) 327.287327.287
P = − +=
In 2012 there are 327.237 million people.
108. a. N is the dependent variable; r is the independent variable
b. 2(3) 1.35(3) 15.45(3) 20.7112.15 46.35 20.71
13.49
N = − + −= − + −=
In 2012, there are 13.49 million housing units with 3 rooms.
109. a. ( ) ( )21 20 4.9 120 4.9 15.1 meters
H = −= − =
( ) ( )( )
( ) ( )( )
( ) ( )( )
2
2
2
1.1 20 4.9 1.120 4.9 1.2120 5.929 14.071 meters
1.2 20 4.9 1.220 4.9 1.4420 7.056 12.944 meters
1.3 20 4.9 1.320 4.9 1.6920 8.281 11.719 meters
H
H
H
= −
= −= − =
= −
= −= − =
= −
= −= − =
b. ( )2
2
2
15 :
15 20 4.9
5 4.9
1.02041.01 seconds
H x
x
x
xx
=
= −
− = −
≈≈
( )2
2
2
10 :
10 20 4.9
10 4.9
2.04081.43 seconds
H x
x
x
xx
=
= −
− = −
≈≈
( )2
2
2
5 :
5 20 4.9
15 4.9
3.06121.75 seconds
H x
x
x
xx
=
= −
− = −
≈≈
c. ( ) 0H x = 2
2
2
0 20 4.9
20 4.9
4.08162.02 seconds
x
x
xx
= −
− = −
≈≈
110. a. ( ) ( )21 20 13 1 20 13 7 metersH = − = − =
( ) ( ) ( )
( ) ( ) ( )
2
2
1.1 20 13 1.1 20 13 1.2120 15.73 4.27 meters
1.2 20 13 1.2 20 13 1.4420 18.72 1.28 meters
H
H
= − = −= − =
= − = −= − =
b. ( )2
2
2
15
15 20 13
5 13
0.38460.62 seconds
H x
x
x
xx
=
= −
− = −
≈≈
( )2
2
2
10
10 20 13
10 13
0.76920.88 seconds
H x
x
x
xx
=
= −
− = −
≈≈
( )2
2
2
5
5 20 13
15 13
1.15381.07 seconds
H x
x
x
xx
=
= −
− = −
≈≈

Chapter 1: Graphs and Functions
46 Copyright © 2016 Pearson Education, Inc.
c. ( ) 0H x = 2
2
2
0 20 13
20 13
1.53851.24 seconds
x
x
xx
= −
− = −
≈≈
111. ( ) 36,00010010xC x
x= + +
a. ( ) 500 36,000500 10010 500
100 50 72$222
C = + +
= + +=
b. ( ) 450 36,000450 10010 450
100 45 80$225
C = + +
= + +=
c. ( ) 600 36,000600 10010 600
100 60 60$220
C = + +
= + +=
d. ( ) 400 36,000400 10010 400
100 40 90$230
C = + +
= + +=
112. ( ) 24 1A x x x= −
a. 2
2
1 1 1 4 8 4 2 24 13 3 3 3 9 3 3
8 2 1.26 ft9
A = ⋅ − = = ⋅
= ≈
b. 2
2
1 1 1 3 34 1 2 22 2 2 4 2
3 1.73 ft
A = ⋅ − = = ⋅
= ≈
c. 2
2
2 2 2 8 5 8 54 13 3 3 3 9 3 3
8 5 1.99 ft9
A = ⋅ − = = ⋅
= ≈
113. ( )2
244 6xh x x
v= − + +
a. ( ) ( ) ( )2
2
44 88 8 6
282816 14 10.4 feet784
h = − + +
= − + ≈
b. ( ) ( ) ( )2
2
44 1212 12 6
286336 18 9.9 feet784
h = − + +
= − + ≈
c. From part (a) we know the point ( )8,10.4 is on the graph and from part (b) we know the point ( )12,9.9 is on the graph. We could evaluate the function at several more values of x (e.g. 0x = , 15x = , and 20x = ) to obtain additional points.
( ) ( ) ( )
( ) ( ) ( )
( ) ( ) ( )
2
2
2
2
2
2
44 00 0 6 6
2844 15
15 15 6 8.428
44 2020 20 6 3.6
28
h
h
h
= − + + =
= − + + ≈
= − + + ≈
Some additional points are ( )0,6 , ( )15,8.4
and ( )20,3.6 . The complete graph is given below.
6
d. ( ) ( ) ( )2
2
44 1515 15 6 8.4 feet
28h = − + + ≈
No; when the ball is 15 feet in front of the foul line, it will be below the hoop. Therefore it cannot go through the hoop.

Section 1.3: Functions and Their Graphs
47 Copyright © 2016 Pearson Education, Inc.
In order for the ball to pass through the hoop, we need to have ( )15 10h = .
( ) ( )
( )
( )
2
2
2
2
2
44 1510 15 6
44 1511
4 225 90030 ft/sec
v
vvv
= − + +
− = −
= =
=
The ball must be shot with an initial velocity of 30 feet per second in order to go through the hoop.
114. ( )2
2136 2.7 3.5xh x x
v= − + +
a. We want ( )15 10h = .
( ) ( )2
2
2
2
136 152.7 15 3.5 10
30,600 34
90030 ft/sec
v
vvv
− + + =
− = −
==
The ball needs to be thrown with an initial velocity of 30 feet per second.
b. ( )2
2126 2.7 3.5
30xh x x= − + +
which simplifies to
( ) 234 2.7 3.5225
h x x x= − + +
c. Using the velocity from part (b),
( ) ( ) ( )2349 9 2.7 9 3.5 15.56 ft225
h = − + + =
The ball will be 15.56 feet above the floor when it has traveled 9 feet in front of the foul line.
d. Select several values for x and use these to find the corresponding values for h. Use the results to form ordered pairs ( ),x h . Plot the points and connect with a smooth curve.
( ) ( ) ( )
( ) ( ) ( )
( ) ( ) ( )
2
2
2
340 0 2.7 0 3.5 3.5 ft225345 5 2.7 5 3.5 13.2 ft225
2415 15 2.7 15 3.5 10 ft225
h
h
h
= − + + =
= − + + ≈
= − + + ≈
Thus, some points on the graph are ( )0,3.5 ,
( )5,13.2 , and ( )15,10 . The complete graph is given below.
115. 2
232( )
130xh x x−= +
a. 2
232(100)(100) 100130
320,000 100 81.07 feet16,900
h −= +
−= + ≈
b. 2
232(300)(300) 300
1302,880,000 300 129.59 feet16,900
h −= +
−= + ≈
c. 2
232(500)(500) 500
1308,000,000 500 26.63 feet16,900
h −= +
−= + ≈
d. 2
232Solving ( ) 0
130xh x x−= + =
2
2
2
32 0130
32 1 0130
x x
xx
− + =
− + =
0x = or 2
2
2
2
32 1 0130
321130
130 32
130 528.13 feet32
x
x
x
x
− + =
=
=
= =
Therefore, the golf ball travels 528.13 feet.

Chapter 1: Graphs and Functions
48 Copyright © 2016 Pearson Education, Inc.
e. 2
1 232
130xy x−= +
−50
150
600
f. Use INTERSECT on the graphs of 2
1 232
130xy x−= + and 2 90y = .
−50
150
600
−50
150
600
The ball reaches a height of 90 feet twice.
The first time is when the ball has traveled approximately 115.07 feet, and the second time is when the ball has traveled about 413.05 feet.
g. The ball travels approximately 275 feet before it reaches its maximum height of approximately 131.8 feet.
h. The ball travels approximately 264 feet
before it reaches its maximum height of approximately 132.03 feet.
116. a. ( )0 5000C = This represents the fixed overhead costs. That is, the company will incur costs of $5000 per day even if no computers are manufactured.
b. ( )10 19,000C = It costs the company $19,000 to produce 10 computers in a day.
c. ( )50 51,000C = It costs the company $51,000 to produce 50 computers in a day.
d. The domain is { }| 0 100q q≤ ≤ . This indicates that production capacity is limited to 100 computers in a day.
e. The graph is curved down and rises slowly at first. As production increases, the graph becomes rises more quickly and changes to being curved up.
f. The inflection point is where the graph changes from being curved down to being curved up.
117. a. ( )0 $30C = It costs $30 if you use 0 gigabytes.
b. ( )5 $30C = It costs $30 if you use 5 gigabytes.
c. ( )15 $90C = It costs $90 if you use 15 gigabytes.
d. The domain is { }g | 0 60g≤ ≤ . This indicates that there are at most 60 gigabytes in a month.
e. The graph is flat at first and then rises in a straight line.
118. a. ( ) 2h x x=
( ) ( )( ) ( )
2 2 2h a b a b a b
h a h b
+ = + = +
= +
( ) 2h x x= has the property.
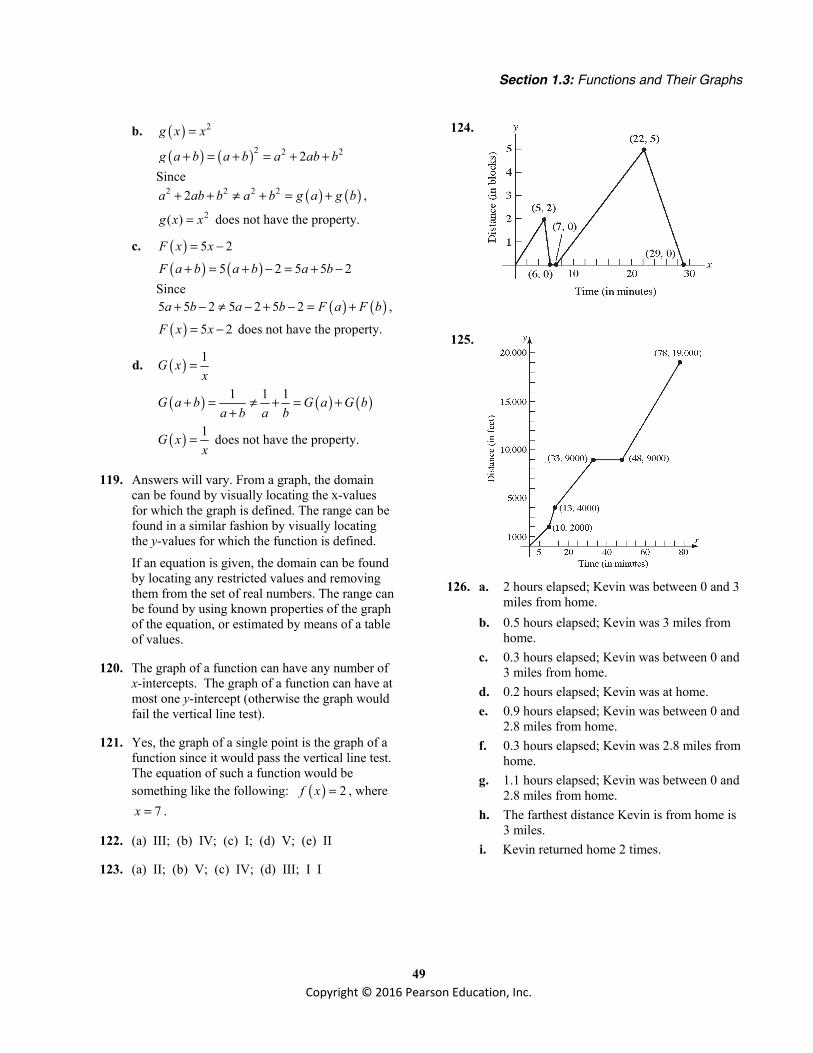
Section 1.3: Functions and Their Graphs
49 Copyright © 2016 Pearson Education, Inc.
b. ( ) 2g x x=
( ) ( )2 2 22g a b a b a ab b+ = + = + + Since
( ) ( )2 2 2 22a ab b a b g a g b+ + ≠ + = + ,2( )g x x= does not have the property.
c. ( ) 5 2F x x= −
( ) ( )5 2 5 5 2F a b a b a b+ = + − = + − Since
( ) ( )5 5 2 5 2 5 2a b a b F a F b+ − ≠ − + − = + ,
( ) 5 2F x x= − does not have the property.
d. ( ) 1G xx
=
( ) ( ) ( )1 1 1G a b G a G ba b a b
+ = ≠ + = ++
( ) 1G xx
= does not have the property.
119. Answers will vary. From a graph, the domain can be found by visually locating the x-values for which the graph is defined. The range can be found in a similar fashion by visually locating the y-values for which the function is defined.
If an equation is given, the domain can be found by locating any restricted values and removing them from the set of real numbers. The range can be found by using known properties of the graph of the equation, or estimated by means of a table of values.
120. The graph of a function can have any number of x-intercepts. The graph of a function can have at most one y-intercept (otherwise the graph would fail the vertical line test).
121. Yes, the graph of a single point is the graph of a function since it would pass the vertical line test. The equation of such a function would be something like the following: ( ) 2f x = , where
7x = .
122. (a) III; (b) IV; (c) I; (d) V; (e) II
123. (a) II; (b) V; (c) IV; (d) III; I I
124.
125.
126. a. 2 hours elapsed; Kevin was between 0 and 3
miles from home. b. 0.5 hours elapsed; Kevin was 3 miles from
home. c. 0.3 hours elapsed; Kevin was between 0 and
3 miles from home. d. 0.2 hours elapsed; Kevin was at home. e. 0.9 hours elapsed; Kevin was between 0 and
2.8 miles from home. f. 0.3 hours elapsed; Kevin was 2.8 miles from
home. g. 1.1 hours elapsed; Kevin was between 0 and
2.8 miles from home. h. The farthest distance Kevin is from home is
3 miles. i. Kevin returned home 2 times.

Chapter 1: Graphs
50 Copyright © 2016 Pearson Education, Inc.
127. a. Michael travels fastest between 7 and 7.4 minutes. That is, ( )7,7.4 .
b. Michael's speed is zero between 4.2 and 6 minutes. That is, ( )4.2,6 .
c. Between 0 and 2 minutes, Michael's speed increased from 0 to 30 miles/hour.
d. Between 4.2 and 6 minutes, Michael was stopped (i.e, his speed was 0 miles/hour).
e. Between 7 and 7.4 minutes, Michael was traveling at a steady rate of 50 miles/hour.
f. Michael's speed is constant between 2 and 4 minutes, between 4.2 and 6 minutes, between 7 and 7.4 minutes, and between 7.6 and 8 minutes. That is, on the intervals (2, 4), (4.2, 6), (7, 7.4), and (7.6, 8).
128. Answers (graphs) will vary. Points of the form (5, y) and of the form (x, 0) cannot be on the graph of the function.
129. The only such function is ( ) 0f x = because it is
the only function for which ( ) ( )f x f x= − . Any other such graph would fail the vertical line test.
130. Answers may vary.
Section 1.4
1. 2 5x< <
2. ( )8 3 5slope 1
53 2yx
Δ −= = = =Δ − −
3. x-axis: y y→ −
( ) 2
2
2
5 1
5 1
5 1 different
y x
y x
y x
− = −
− = −
= − +
y-axis: x x→ − ( )2
2
5 1
5 1 same
y x
y x
= − −
= −
origin: x x→ − and y y→ −
( ) ( )2
2
2
5 1
5 1
5 1 different
y x
y x
y x
− = − −
− = −
= − +
The equation has symmetry with respect to the y-axis only.
4. ( )( ) ( )
( )
1 1
2 5 32 5 3
y y m x x
y x
y x
− = −
− − = −
+ = −
5. 2 9y x= − x-intercepts:
2
2
0 9
9 3
x
x x
= −
= → = ±
y-intercept: ( )20 9 9y = − = −
The intercepts are ( )3,0− , ( )3,0 , and ( )0, 9− .
6. increasing
7. even; odd
8. True
9. True
10. False; odd functions are symmetric with respect to the origin. Even functions are symmetric with respect to the y-axis.
11. c
12. d
13. Yes
14. No, it is increasing.
15. No
16. Yes
17. f is increasing on the intervals ( ) ( ) ( )8, 2 , 0,2 , 5,7− − .

Section 1.4: Properties of Functions
51 Copyright © 2016 Pearson Education, Inc.
18. f is decreasing on the intervals: ( ) ( ) ( )10, 8 , 2,0 , 2,5− − − .
19. Yes. The local maximum at 2 is 10.x =
20. No. There is a local minimum at 5x = ; the local minimum is 0.
21. f has local maxima at 2 and 2x x= − = . The local maxima are 6 and 10, respectively.
22. f has local minima at 8, 0 and 5x x x= − = = . The local minima are –4, 0, and 0, respectively.
23. f has absolute minimum of 4− at x = –8.
24. f has absolute maximum of 10 at x = 2.
25. a. Intercepts: (–2, 0), (2, 0), and (0, 3).
b. Domain: { }4 4x x− ≤ ≤ or [ ]4, 4− ;
Range: { }0 3y y≤ ≤ or [ ]0, 3 .
c. Increasing: (–2, 0) and (2, 4); Decreasing: (–4, –2) and (0, 2).
d. Since the graph is symmetric with respect to the y-axis, the function is even.
26. a. Intercepts: (–1, 0), (1, 0), and (0, 2).
b. Domain: { }3 3x x− ≤ ≤ or [ ]3, 3− ;
Range: { }0 3y y≤ ≤ or [ ]0, 3 .
c. Increasing: (–1, 0) and (1, 3); Decreasing: (–3, –1) and (0, 1).
d. Since the graph is symmetric with respect to the y-axis, the function is even.
27. a. Intercepts: (0, 1).
b. Domain: { } is any real numberx x ;
Range: { }0y y > or ( )0, ∞ .
c. Increasing: ( , )−∞ ∞ ; Decreasing: never.
d. Since the graph is not symmetric with respect to the y-axis or the origin, the function is neither even nor odd.
28. a. Intercepts: (1, 0).
b. Domain: { }0x x > or ( )0, ∞ ;
Range: { } is any real numbery y .
c. Increasing: (0, )∞ ; Decreasing: never.
d. Since the graph is not symmetric with respect to the y-axis or the origin, the function is neither even nor odd.
29. a. Intercepts: ( ,0), ( ,0), and (0,0)−π π .
b. Domain: { }x x− π ≤ ≤ π or [ ],−π π ;
Range: { }1 1y y− ≤ ≤ or [ ]1, 1− .
c. Increasing: ,2 2π π −
;
Decreasing: , and ,2 2π π −π − π
.
d. Since the graph is symmetric with respect to the origin, the function is odd.
30. a. Intercepts: , 0 , , 0 , and (0, 1)2 2π π −
.
b. Domain: { }x x− π ≤ ≤ π or [ ],−π π ;
Range: { }1 1y y− ≤ ≤ or [ ]1, 1− .
c. Increasing: ( ), 0−π ; Decreasing: ( )0, π .
d. Since the graph is symmetric with respect to the y-axis, the function is even.
31. a. Intercepts: 1 5 1, 0 , , 0 , and 0,3 2 2
.
b. Domain: { }3 3x x− ≤ ≤ or [ ]3, 3− ;
Range: { }1 2y y− ≤ ≤ or [ ]1, 2− .
c. Increasing: ( )2, 3 ; Decreasing: ( )1, 1− ;
Constant: ( ) ( )3, 1 and 1, 2− −
d. Since the graph is not symmetric with respect to the y-axis or the origin, the function is neither even nor odd.
32. a. Intercepts: ( ) ( ) ( )2.3, 0 , 3, 0 , and 0, 1− .
b. Domain: { }3 3x x− ≤ ≤ or [ ]3, 3− ;
Range: { }2 2y y− ≤ ≤ or [ ]2, 2− .
c. Increasing: ( ) ( )3, 2 and 0, 2− − ;
Decreasing: ( )2, 3 ; Constant: ( )2, 0− .
Chapter 1: Graphs and Functions
52 Copyright © 2016 Pearson Education, Inc.
d. Since the graph is not symmetric with respect to the y-axis or the origin, the function is neither even nor odd.
33. a. f has a local maximum of 3 at 0.x =
b. f has a local minimum of 0 at both 2 and 2.x x= − =
34. a. f has a local maximum of 2 at 0.x =
b. f has a local minimum of 0 at both 1 and 1.x x= − =
35. a. f has a local maximum of 1 at .2
x π=
b. f has a local minimum of –1 at .2
x π= −
36. a. f has a local maximum of 1 at 0.x =
b. f has a local minimum of –1 both at x π= − and x π= .
37. 3( ) 4f x x= ( )3 3( ) 4( ) 4f x x x f x− = − = − = − Therefore, f is odd.
38. 4 2( ) 2f x x x= −
( )4 2 4 2( ) 2( ) ( ) 2f x x x x x f x− = − − − = − = Therefore, f is even.
39. 2( ) 3 5g x x= − −
( )2 2( ) 3( ) 5 3 5g x x x g x− = − − − = − − = Therefore, g is even.
40. 3( ) 3 5h x x= + 3 3( ) 3( ) 5 3 5h x x x− = − + = − +
h is neither even nor odd.
41. 3( )F x x=
( )3 3( )F x x x F x− = − = − = − Therefore, F is odd.
42. ( )G x x= ( )G x x− = − G is neither even nor odd.
43. ( )f x x x= + ( )f x x x x x− = − + − = − +
f is neither even nor odd.
44. 3 2( ) 2 1f x x= +
( )32 23( ) 2( ) 1 2 1f x x x f x− = − + = + = Therefore, f is even.
45. 21( )g xx
=
( )2 21 1( )
( )g x g x
x x− = = =
−
Therefore, g is even.
46. 2( )1
xh xx
=−
( )2 2( )( ) 1 1
x xh x h xx x− −− = = = −
− − −
Therefore, h is odd.
47. 3
2( )3 9
xh xx−=
−
( )3 3
2 2( )( )
3( ) 9 3 9x xh x h x
x x− −− = = = −− − −
Therefore, h is odd.
48. 2( ) xF xx
=
( )22( )( ) xxF x F xx x
−−− = = = −−
Therefore, F is odd.
49. f has an absolute maximum of 4 at 1.x = f has an absolute minimum of 1 at 5.x = f has an local maximum of 3 at 3.x = f has an local minimum of 2 at 2.x =
50. f has an absolute maximum of 4 at 4.x = f has an absolute minimum of 0 at 5.x = f has an local maximum of 4 at 4.x = f has an local minimum of 1 at 1.x =

Section 1.4: Properties of Functions
53 Copyright © 2016 Pearson Education, Inc.
51. f has an absolute minimum of 1 at 1.x = f has an absolute maximum of 4 at x = 3. f has an local minimum of 1 at 1.x = f has an local maximum of 4 at x = 3.
52. f has an absolute minimum of 1 at 0.x = f has no absolute maximum. f has no local minimum. f has no local maximum.
53. f has an absolute minimum of 0 at 0.x = f has no absolute maximum. f has an local minimum of 0 at 0.x = f has an local minimum of 2 at 3.x = f has an local maximum of 3 at 2.x = 54. f has an absolute maximum of 4 at 2.x = f has no absolute minimum. f has an local maximum of 4 at 2.x = f has an local minimum of 2 at 0.x =
55. f has no absolute maximum or minimum. f has no local maximum or minimum.
56. f has no absolute maximum or minimum. f has no local maximum or minimum.
57. ( ) 3 3 2f x x x= − + on the interval ( )2, 2− Use MAXIMUM and MINIMUM on the graph of 3
1 3 2y x x= − + .
local maximum: ( 1) 4f − = local minimum: (1) 0f = f is increasing on: ( ) ( )2, 1 and 1, 2− − ;
f is decreasing on: ( )1,1−
58. ( ) 3 23 5f x x x= − + on the interval ( )1,3− Use MAXIMUM and MINIMUM on the graph of 3 2
1 3 5y x x= − + .
local maximum: (0) 5f = local minimum: (2) 1f = f is increasing on: ( ) ( )1,0 and 2,3− ;
f is decreasing on: ( )0, 2
59. ( ) 5 3f x x x= − on the interval ( )2, 2− Use MAXIMUM and MINIMUM on the graph of 5 3
1y x x= − .
−0.5
0.5
−2 2
−0.5
0.5
−2 2
local maximum: ( 0.77) 0.19f − = local minimum: (0.77) 0.19f = − f is increasing on: ( ) ( )2, 0.77 and 0.77, 2− − ;
f is decreasing on: ( )0.77,0.77−

Chapter 1: Graphs and Functions
54 Copyright © 2016 Pearson Education, Inc.
60. ( ) 4 2f x x x= − on the interval ( )2, 2− Use MAXIMUM and MINIMUM on the graph of 4 2
1y x x= − .
local maximum: (0) 0f =
local minimum: ( 0.71) 0.25f − = − ; (0.71) 0.25f = −
f is increasing on: ( ) ( )0.71,0 and 0.71,2− ;
f is decreasing on: ( ) ( )2, 0.71 and 0,0.71− −
61. ( ) 3 20.2 0.6 4 6f x x x x= − − + − on the
interval ( )6, 4− Use MAXIMUM and MINIMUM on the graph of 3 2
1 0.2 0.6 4 6y x x x= − − + − .
local maximum: (1.77) 1.91f = − local minimum: ( 3.77) 18.89f − = −
f is increasing on: ( )3.77,1.77− ;
f is decreasing on: ( ) ( )6, 3.77 and 1.77, 4− −
62. ( ) 3 20.4 0.6 3 2f x x x x= − + + − on the
interval ( )4,5− Use MAXIMUM and MINIMUM on the graph of 3 2
1 0.4 0.6 3 2y x x x= − + + − .
local maximum: (2.16) 3.25f = local minimum: ( 1.16) 4.05f − = − f is increasing on: ( )1.16, 2.16− ;
f is decreasing on: ( ) ( )4, 1.16 and 2.16,5− −
63. ( ) 4 3 20.25 0.3 0.9 3f x x x x= + − + on the
interval ( )3,2− Use MAXIMUM and MINIMUM on the graph of 4 3 2
1 0.25 0.3 0.9 3y x x x= + − + .
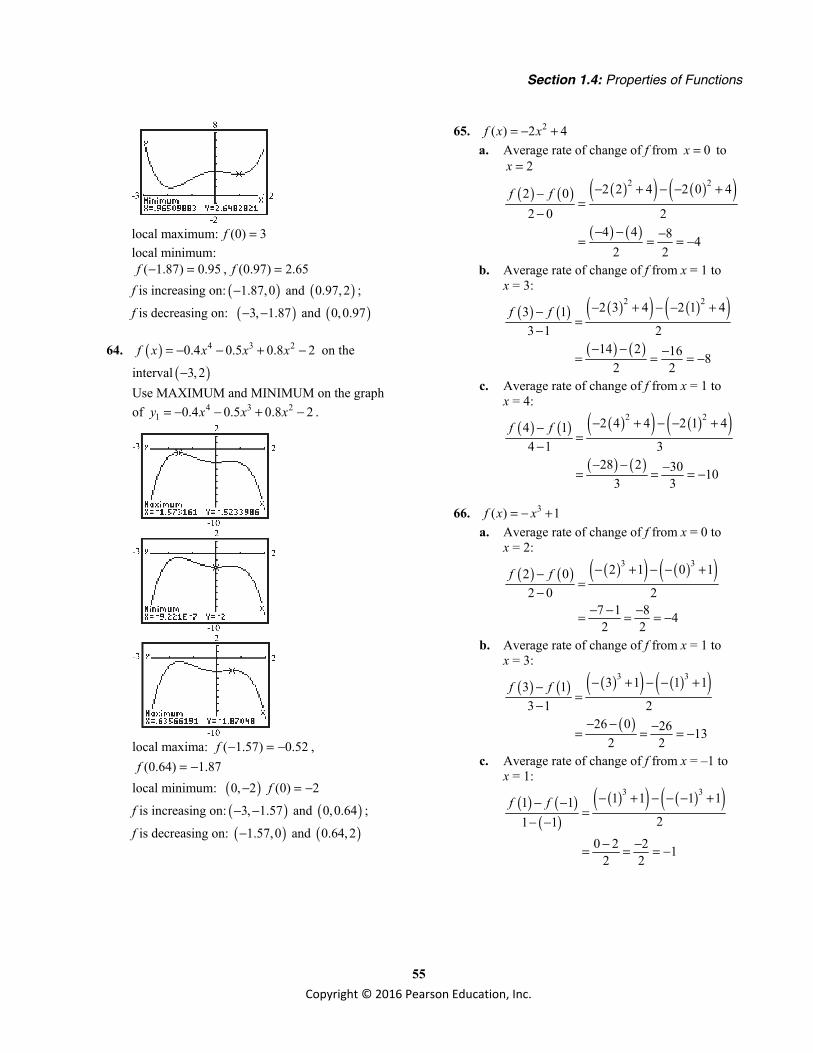
Section 1.4: Properties of Functions
55 Copyright © 2016 Pearson Education, Inc.
local maximum: (0) 3f = local minimum:
( 1.87) 0.95f − = , (0.97) 2.65f = f is increasing on: ( ) ( )1.87,0 and 0.97,2− ;
f is decreasing on: ( ) ( )3, 1.87 and 0,0.97− −
64. ( ) 4 3 20.4 0.5 0.8 2f x x x x= − − + − on the
interval ( )3,2− Use MAXIMUM and MINIMUM on the graph of 4 3 2
1 0.4 0.5 0.8 2y x x x= − − + − .
local maxima: ( 1.57) 0.52f − = − ,
(0.64) 1.87f = − local minimum: ( )0, 2− (0) 2f = −
f is increasing on: ( ) ( )3, 1.57 and 0,0.64− − ;
f is decreasing on: ( ) ( )1.57,0 and 0.64,2−
65. 2( ) 2 4f x x= − + a. Average rate of change of f from 0x = to
2x =
( ) ( ) ( )( ) ( )( )( ) ( )
2 22 2 4 2 0 42 02 0 2
4 4 8 42 2
f f − + − − +−=
−− − −= = = −
b. Average rate of change of f from x = 1 to x = 3:
( ) ( ) ( )( ) ( )( )( ) ( )
2 22 3 4 2 1 43 13 1 2
14 2 16 82 2
f f − + − − +−=
−− − −= = = −
c. Average rate of change of f from x = 1 to x = 4:
( ) ( ) ( )( ) ( )( )( ) ( )
2 22 4 4 2 1 44 14 1 3
28 2 30 103 3
f f − + − − +−=
−− − −= = = −
66. 3( ) 1f x x= − + a. Average rate of change of f from x = 0 to
x = 2:
( ) ( ) ( )( ) ( )( )3 32 1 0 12 02 0 2
7 1 8 42 2
f f − + − − +−=
−− − −= = = −
b. Average rate of change of f from x = 1 to x = 3:
( ) ( ) ( )( ) ( )( )( )
3 33 1 1 13 13 1 2
26 0 26 132 2
f f − + − − +−=
−− − −= = = −
c. Average rate of change of f from x = –1 to x = 1:
( ) ( )( )
( )( ) ( )( )3 31 1 1 11 121 1
0 2 2 12 2
f f − + − − − +− −=
− −− −= = = −
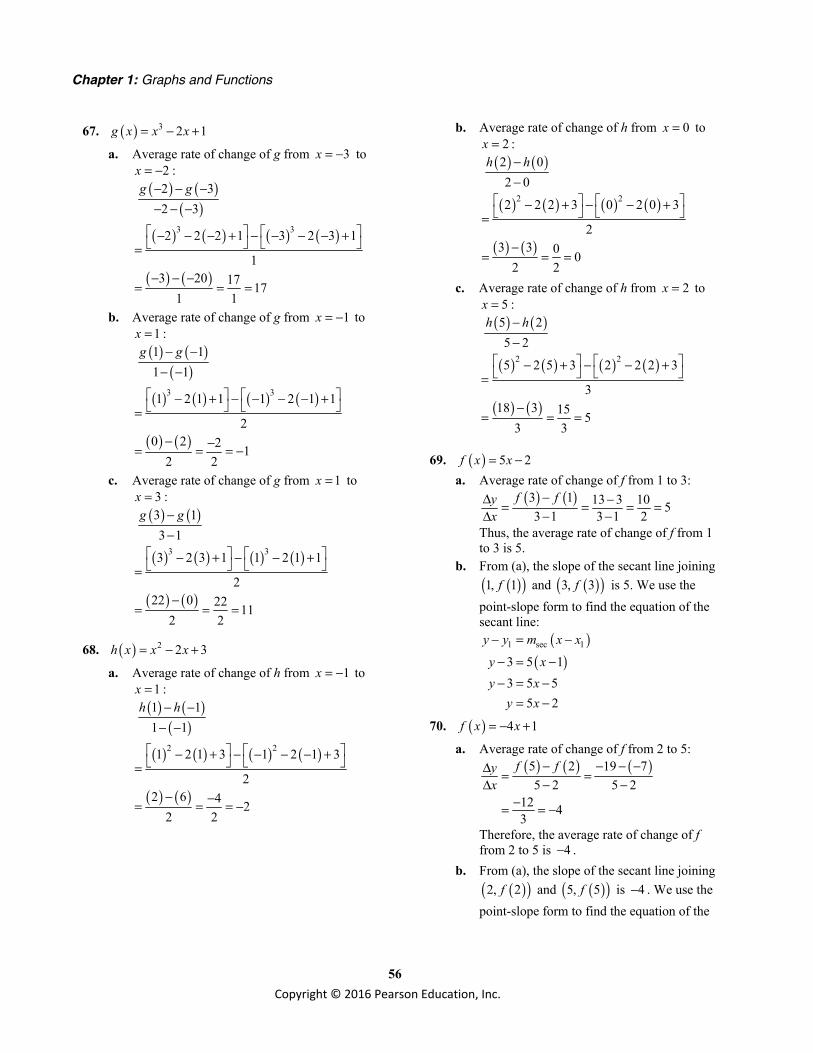
Chapter 1: Graphs and Functions
56 Copyright © 2016 Pearson Education, Inc.
67. ( ) 3 2 1g x x x= − +
a. Average rate of change of g from 3x = − to 2x = − :
( ) ( )( )
( ) ( ) ( ) ( )
( ) ( )
3 3
2 32 3
2 2 2 1 3 2 3 1
13 20 17 17
1 1
g g− − −− − −
− − − + − − − − + =
− − −= = =
b. Average rate of change of g from 1x = − to 1x = :
( ) ( )( )
( ) ( ) ( ) ( )
( ) ( )
3 3
1 11 1
1 2 1 1 1 2 1 1
20 2 2 1
2 2
g g− −− −
− + − − − − + =
− −= = = −
c. Average rate of change of g from 1x = to 3x = :
( ) ( )
( ) ( ) ( ) ( )
( ) ( )
3 3
3 13 13 2 3 1 1 2 1 1
222 0 22 11
2 2
g g−−
− + − − + =
−= = =
68. ( ) 2 2 3h x x x= − +
a. Average rate of change of h from 1x = − to 1x = :
( ) ( )( )
( ) ( ) ( ) ( )
( ) ( )
2 2
1 11 1
1 2 1 3 1 2 1 3
22 6 4 2
2 2
h h− −− −
− + − − − − + =
− −= = = −
b. Average rate of change of h from 0x = to 2x = :
( ) ( )
( ) ( ) ( ) ( )
( ) ( )
2 2
2 02 0
2 2 2 3 0 2 0 3
23 3 0 0
2 2
h h−−
− + − − + =
−= = =
c. Average rate of change of h from 2x = to 5x = :
( ) ( )
( ) ( ) ( ) ( )
( ) ( )
2 2
5 25 2
5 2 5 3 2 2 2 3
318 3 15 5
3 3
h h−−
− + − − + =
−= = =
69. ( ) 5 2f x x= − a. Average rate of change of f from 1 to 3:
( ) ( )3 1 13 3 10 53 1 3 1 2
f fyx
−Δ −= = = =Δ − −
Thus, the average rate of change of f from 1 to 3 is 5.
b. From (a), the slope of the secant line joining ( )( )1, 1f and ( )( )3, 3f is 5. We use the
point-slope form to find the equation of the secant line:
( )( )
1 sec 1
3 5 13 5 5
5 2
y y m x x
y xy x
y x
− = −
− = −− = −
= −
70. ( ) 4 1f x x= − + a. Average rate of change of f from 2 to 5:
( ) ( ) ( )5 2 19 75 2 5 2
12 43
f fyx
− − − −Δ = =Δ − −
−= = −
Therefore, the average rate of change of f from 2 to 5 is 4− .
b. From (a), the slope of the secant line joining ( )( )2, 2f and ( )( )5, 5f is 4− . We use the
point-slope form to find the equation of the

Section 1.4: Properties of Functions
57 Copyright © 2016 Pearson Education, Inc.
secant line: ( )
( ) ( )1 sec 1
7 4 27 4 8
4 1
y y m x x
y xy x
y x
− = −
− − = − −+ = − +
= − +
71. ( ) 2 2g x x= − a. Average rate of change of g from 2− to 1:
( ) ( )( ) ( )
1 2 1 2 3 131 2 1 2
g gyx
− −Δ − − −= = = = −Δ − − − −
Therefore, the average rate of change of g from 2− to 1 is 1− .
b. From (a), the slope of the secant line joining ( )( )2, 2g− − and ( )( )1, 1g is 1− .We use the
point-slope form to find the equation of the secant line:
( )( )( )
1 sec 1
2 1 2
2 2
y y m x x
y x
y xy x
− = −
− = − − −
− = − −= −
72. ( ) 2 1g x x= + a. Average rate of change of g from 1− to 2:
( ) ( )( ) ( )
2 1 5 2 3 132 1 2 1
g gyx
− −Δ −= = = =Δ − − − −
Therefore, the average rate of change of g from 1− to 2 is 1.
b. From (a), the slope of the secant line joining ( )( )1, 1g− − and ( )( )2, 2g is 1. We use the
point-slope form to find the equation of the secant line:
( )( )( )
1 sec 1
2 1 12 1
3
y y m x xy xy x
y x
− = −− = − −− = +
= +
73. ( ) 2 2h x x x= − a. Average rate of change of h from 2 to 4:
( ) ( )4 2 8 0 8 44 2 4 2 2
h hyx
−Δ −= = = =Δ − −
Therefore, the average rate of change of h from 2 to 4 is 4.
b. From (a), the slope of the secant line joining ( )( )2, 2h and ( )( )4, 4h is 4. We use the
point-slope form to find the equation of the
secant line: ( )
( )1 sec 1
0 4 24 8
y y m x x
y xy x
− = −
− = −= −
74. ( ) 22h x x x= − + a. Average rate of change from 0 to 3:
( ) ( )3 0 15 03 0 3 0
15 53
h hyx
−Δ − −= =Δ − −
−= = −
Therefore, the average rate of change of h from 0 to 3 is 5− .
b. From (a), the slope of the secant line joining ( )0, (0)h and ( )3, (3)h is 5− . We use the point-slope form to find the equation of the secant line:
( )( )
1 sec 1
0 5 05
y y m x x
y xy x
− = −
− = − −= −
75. a. ( ) 3 27g x x x= −
( ) ( ) ( )
( )( )
3
3
3
27
27
27
g x x x
x x
x x
g x
− = − − −
= − +
= − −
= −
Since ( ) ( )g x g x− = − , the function is odd.
b. Since ( )g x is odd then it is symmetric about the origin so there exist a local maximum at 3x = − .
( ) 33 ( 3) 27( 3) 27 81 54g − = − − − = − + = So there is a local maximum of 54 at
3x = − .
76. ( ) 3 12f x x x= − +
a. ( ) ( ) ( )
( )( )
3
3
3
12
12
12
f x x x
x x
x x
f x
− = − − + −
= −
= − − +
= −
Since ( ) ( )f x f x− = − , the function is odd.

Chapter 1: Graphs and Functions
58 Copyright © 2016 Pearson Education, Inc.
b. Since ( )f x is odd then it is symmetric about the origin so there exist a local maximum at 3x = − .
( ) 32 ( 2) 12( 2) 8 24 16f − = − − + − = − = − So there is a local maximum of 16− at
2x = − .
77. ( ) 4 28 8F x x x= − + +
a. ( ) ( ) ( )
( )
4 2
4
8 8
8 8
F x x x
x xF x
− = − − + − +
= − + +
=
Since ( ) ( )F x F x− = , the function is even.
b. Since the function is even, its graph has y-axis symmetry. The second local maximum is in quadrant II and is 24 and occurs at 2x = − .
c. Because the graph has y-axis symmetry, the area under the graph between 0x = and
3x = bounded below by the x-axis is the same as the area under the graph between
3x = − and 0x = bounded below the x-axis. Thus, the area is 47.4 square units.
78. ( ) 4 232 144G x x x= − + +
a. ( ) ( ) ( )
( )
4 2
4 2
32 144
32 144
G x x x
x xG x
− = − − + − +
= − + +
=
Since ( ) ( )G x G x− = , the function is even.
b. Since the function is even, its graph has y-axis symmetry. The second local maximum is in quadrant II and is 400 and occurs at 4x = − .
c. Because the graph has y-axis symmetry, the area under the graph between 0x = and
6x = bounded below by the x-axis is the same as the area under the graph between
6x = − and 0x = bounded below the x-axis. Thus, the area is 1612.8 square units.
79. ( ) 2 25000.3 21 251C x x xx
= + − +
a. 21
25000.3 21 251y x xx
= + − +
0 30
2500
−300
b. Use MINIMUM. Rounding to the nearest whole number, the average cost is minimized when approximately 10 lawnmowers are produced per hour.
0 30
2500
−300
c. The minimum average cost is approximately $239 per mower.
80. a. ( ) 4 3 2.002 .039 .285 .766 .085C t t t t t= − + − + + Graph the function on a graphing utility and use the Maximum option from the CALC menu.
1000
1
The concentration will be highest after about 2.16 hours.
b. Enter the function in Y1 and 0.5 in Y2. Graph the two equations in the same window and use the Intersect option from the CALC menu.
1000
1

Section 1.4: Properties of Functions
59 Copyright © 2016 Pearson Education, Inc.
1000
1
After taking the medication, the woman can feed her child within the first 0.71 hours (about 42 minutes) or after 4.47 hours (about 4hours 28 minutes) have elapsed.
81. a. and b.
The slope represents the average rate of change of the cost of the plan from 10 to 30 gigabytes.
c. ( ) ( )10 4avg. rate of change
10 4100 70
6306
$5 per gigabyte
C C−=
−−
=
=
=
On average, the cost per gigabyte is increasing at a rate of $5 gram per gigabyte from 4 to 10 gigabytes.
d. ( ) ( )30 10avg. rate of change
30 10225 100
2012520
$6.25 per gigabyte
C C−=
−−
=
=
=
On average, the cost per gigabyte is increasing at a rate of $6.25 gram per gigabyte from 10 to 30 gigabytes.
e. ( ) ( )50 30avg. rate of change
50 30375 225
2015020
$7.50 per gigabyte
C C−=
−−
=
=
=
On average, the cost per gigabyte is increasing at a rate of $7.50 gram per gigabyte from 30 to 50 gigabytes.
f. The average rate of change is increasing as the gigabyte use goes up. This indicates that the cost is increasing at an increasing rate.
82. a.
b. The slope represents the average rate of change of the debt from 2001 to 2006.
c. ( ) ( )2004 2002avg. rate of change
2004 20027379 6228
21151
2$ 575.5 billion/yr
P P−=
−−
=
=
=
d. ( ) ( )2008 2006avg. rate of change
2008 200610025 8507
21518
2$ 759 billion/yr
P P−=
−−
=
=
=
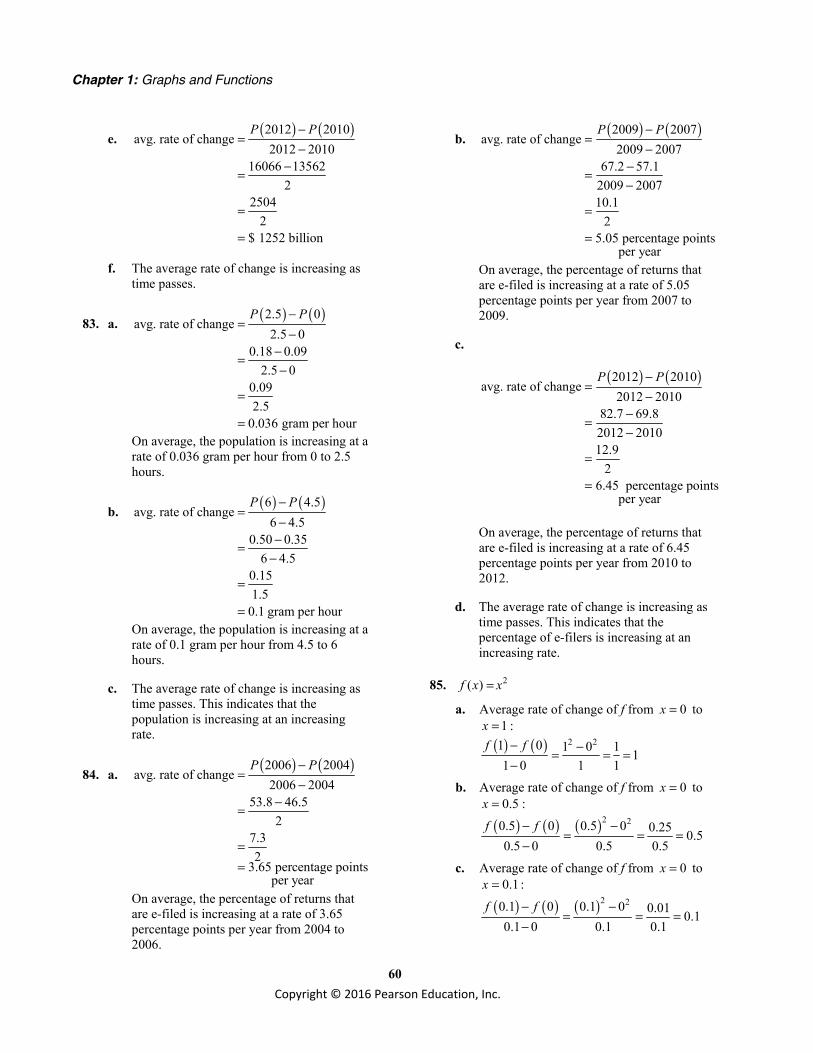
Chapter 1: Graphs and Functions
60 Copyright © 2016 Pearson Education, Inc.
e. ( ) ( )2012 2010avg. rate of change
2012 201016066 13562
22504
2$ 1252 billion
P P−=
−−
=
=
=
f. The average rate of change is increasing as time passes.
83. a. ( ) ( )2.5 0avg. rate of change
2.5 00.18 0.09
2.5 00.092.5
0.036 gram per hour
P P−=
−−=−
=
=
On average, the population is increasing at a rate of 0.036 gram per hour from 0 to 2.5 hours.
b. ( ) ( )6 4.5avg. rate of change
6 4.50.50 0.35
6 4.50.151.5
0.1 gram per hour
P P−=
−−=
−
=
=
On average, the population is increasing at a rate of 0.1 gram per hour from 4.5 to 6 hours.
c. The average rate of change is increasing as time passes. This indicates that the population is increasing at an increasing rate.
84. a. ( ) ( )2006 2004avg. rate of change
2006 200453.8 46.5
27.32
3.65 percentage points per year
P P−=
−−
=
==
On average, the percentage of returns that are e-filed is increasing at a rate of 3.65 percentage points per year from 2004 to 2006.
b. ( ) ( )2009 2007avg. rate of change
2009 200767.2 57.1
2009 200710.1
25.05 percentage points
per year
P P−=
−−
=−
=
=
On average, the percentage of returns that are e-filed is increasing at a rate of 5.05 percentage points per year from 2007 to 2009.
c.
( ) ( )2012 2010avg. rate of change
2012 201082.7 69.82012 201012.9
26.45 percentage points
per year
P P−=
−−
=−
=
=
On average, the percentage of returns that are e-filed is increasing at a rate of 6.45 percentage points per year from 2010 to 2012.
d. The average rate of change is increasing as time passes. This indicates that the percentage of e-filers is increasing at an increasing rate.
85. 2( )f x x=
a. Average rate of change of f from 0x = to 1x = :
( ) ( ) 2 21 0 1 0 1 11 0 1 1
f f− −= = =−
b. Average rate of change of f from 0x = to 0.5x = :
( ) ( ) ( )2 20.5 0 0.5 0 0.25 0.50.5 0 0.5 0.5
f f− −= = =
−
c. Average rate of change of f from 0x = to 0.1x = :
( ) ( ) ( )2 20.1 0 0.1 0 0.01 0.10.1 0 0.1 0.1
f f− −= = =
−
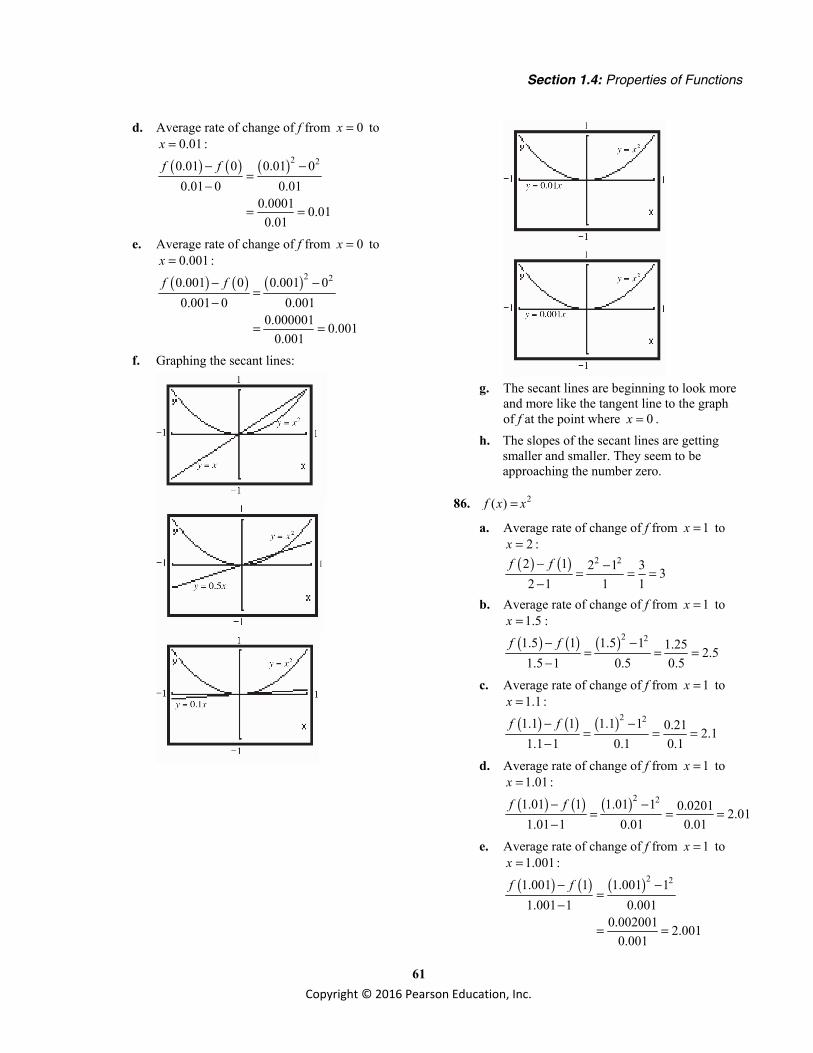
Section 1.4: Properties of Functions
61 Copyright © 2016 Pearson Education, Inc.
d. Average rate of change of f from 0x = to 0.01x = :
( ) ( ) ( )2 20.01 0 0.01 00.01 0 0.01
0.0001 0.010.01
f f− −=
−
= =
e. Average rate of change of f from 0x = to 0.001x = :
( ) ( ) ( )2 20.001 0 0.001 00.001 0 0.001
0.000001 0.0010.001
f f− −=
−
= =
f. Graphing the secant lines:
g. The secant lines are beginning to look more
and more like the tangent line to the graph of f at the point where 0x = .
h. The slopes of the secant lines are getting smaller and smaller. They seem to
be
approaching the number zero.
86. 2( )f x x=
a. Average rate of change of f from 1x = to 2x = :
( ) ( ) 2 22 1 2 1 3 32 1 1 1
f f− −= = =−
b. Average rate of change of f from 1x = to 1.5x = :
( ) ( ) ( )2 21.5 1 1.5 1 1.25 2.51.5 1 0.5 0.5
f f− −= = =
−
c. Average rate of change of f from 1x = to 1.1x = :
( ) ( ) ( )2 21.1 1 1.1 1 0.21 2.11.1 1 0.1 0.1
f f− −= = =
−
d. Average rate of change of f from 1x = to 1.01x = :
( ) ( ) ( )2 21.01 1 1.01 1 0.0201 2.011.01 1 0.01 0.01
f f− −= = =
−
e. Average rate of change of f from 1x = to 1.001x = :
( ) ( ) ( )2 21.001 1 1.001 11.001 1 0.001
0.002001 2.0010.001
f f− −=
−
= =

Chapter 1: Graphs and Functions
62 Copyright © 2016 Pearson Education, Inc.
f. Graphing the secant lines:
g. The secant lines are beginning to look more and more like the tangent line to the graph of f at the point where 1x = .
h. The slopes of the secant lines are getting smaller and smaller. They seem to be approaching the number 2.
87. ( ) 2 5f x x= +
a. sec( ) ( )
2( ) 5 2 5 2 2
f x h f xmh
x h x hh h
+ −=
+ + − −= = =
b. When 1x = : sec0.5 2h m= = sec0.1 2h m= =
sec0.01 2h m= = secas 0, 2h m→ →
c. Using the point ( )( ) ( )1, 1 1,7f = and slope, 2m = , we get the secant line:
( )7 2 17 2 2
2 5
y xy x
y x
− = −− = −
= +
d. Graphing:
The graph and the secant line coincide.
88. ( ) 3 2f x x= − +
a. sec( ) ( )
3( ) 2 ( 3 2) 3 3
f x h f xmh
x h x hh h
+ −=
− + + − − + −= = = −
b. When x = 1, sec0.5 3h m= = − sec0.1 3h m= = −
sec0.01 3h m= = − secas 0, 3h m→ → −
c. Using point ( )( ) ( )1, 1 1, 1f = − and slope = 3− , we get the secant line:
( ) ( )1 3 11 3 3
3 2
y xy x
y x
− − = − −+ = − +
= − +
d. Graphing:
The graph and the secant line coincide.

Section 1.4: Properties of Functions
63 Copyright © 2016 Pearson Education, Inc.
89. 2( ) 2f x x x= +
a. sec
2 2
2 2 2
2
( ) ( )
( ) 2( ) ( 2 )
2 2 2 2
2 2
2 2
f x h f xmh
x h x h x xh
x xh h x h x xh
xh h hh
x h
+ −=
+ + + − +=
+ + + + − −=
+ +=
= + +
b. When x = 1, sec0.5 2 1 0.5 2 4.5h m= = ⋅ + + =
sec0.1 2 1 0.1 2 4.1h m= = ⋅ + + =
sec0.01 2 1 0.01 2 4.01h m= = ⋅ + + =
secas 0, 2 1 0 2 4h m→ → ⋅ + + =
c. Using point ( )( ) ( )1, 1 1,3f = and slope = 4.01, we get the secant line:
( )3 4.01 13 4.01 4.01
4.01 1.01
y xy x
y x
− = −− = −
= −
d. Graphing:
90. 2( ) 2f x x x= +
a. sec( ) ( )f x h f xm
h+ −=
2 2
2 2 2
2 2 2
2
2( ) ( ) (2 )
2( 2 ) 2
2 4 2 2
4 2
4 2 1
x h x h x xh
x xh h x h x xh
x xh h x h x xh
xh h hh
x h
+ + + − +=
+ + + + − −=
+ + + + − −=
+ +=
= + +
b. When x = 1, ( )sec0.5 4 1 2 0.5 1 6h m= = ⋅ + + =
( )sec0.1 4 1 2 0.1 1 5.2h m= = ⋅ + + =
( )sec0.01 4 1 2 0.01 1 5.02h m= = ⋅ + + =
( )secas 0, 4 1 2 0 1 5h m→ → ⋅ + + =
c. Using point ( )( ) ( )1, 1 1,3f = and slope = 5.02, we get the secant line:
( )3 5.02 13 5.02 5.02
5.02 2.02
y xy x
y x
− = −− = −
= −
d. Graphing:
91. 2( ) 2 3 1f x x x= − +
a. sec( ) ( )f x h f xm
h+ −=
( ) ( ) ( )2 2 2
2 2 2
2 2
2
2( 2 ) 3 3 1 2 3 1
2 4 2 3 3 1 2 3 1
2 3 1 2 3 1
4 2 3
4 2 3
x xh h x h x xh
x xh h x h x xh
x h x h x xh
xh h hh
x h
+ + − − + − + −=
+ + − − + − + −=
+ − + + − − +=
+ −=
= + −
b. When x = 1, ( )sec0.5 4 1 2 0.5 3 2h m= = ⋅ + − = ( )sec0.1 4 1 2 0.1 3 1.2h m= = ⋅ + − =
( )sec0.01 4 1 2 0.01 3 1.02h m= = ⋅ + − = ( )secas 0, 4 1 2 0 3 1h m→ → ⋅ + − =
c. Using point ( )( ) ( )1, 1 1,0f = and slope = 1.02, we get the secant line:
( )0 1.02 11.02 1.02
y xy x
− = −= −

Chapter 1: Graphs and Functions
64 Copyright © 2016 Pearson Education, Inc.
d. Graphing:
92. 2( ) 3 2f x x x= − + −
a. sec( ) ( )f x h f xm
h+ −=
( ) ( ) ( )2 2 2
2 2 2
2 2
2
( 2 ) 3 3 2 3 2
2 3 3 2 3 2
3 2 3 2
2 3
2 3
x xh h x h x xh
x xh h x h x xh
x h x h x xh
xh h hh
x h
− + + + + − + − +=
− − − + + − + − +=
− + + + − − − + −=
− − +=
= − − +
b. When x = 1, sec0.5 2 1 0.5 3 0.5h m= = − ⋅ − + =
sec0.1 2 1 0.1 3 0.9h m= = − ⋅ − + =
sec0.01 2 1 0.01 3 0.99h m= = − ⋅ − + =
secas 0, 2 1 0 3 1h m→ → − ⋅ − + =
c. Using point ( )( ) ( )1, 1 1,0f = and slope = 0.99, we get the secant line:
( )0 0.99 10.99 0.99
y xy x
− = −= −
d. Graphing:
93. 1( )f xx
=
a.
( )( )
( ) ( )
( )
sec( ) ( )
1 1
1 1
1
f x h f xmh
x x hx h xx h x
h hx x h h
h hx h x x h x
x h x
+ −=
− + − ++ = =
− − − = = + +
= −+
b. When x = 1,
0.5h = ( )( )sec1
1 0.5 11 2 0.667
1.5 3
m = −+
= − = − ≈ −
0.1h = ( )( )sec1
1 0.1 11 10 0.909
1.1 11
m = −+
= − = − ≈ −
0.01h = ( )( )sec1
1 0.01 11 100 0.990
1.01 101
m = −+
= − = − ≈ −
as 0, h → ( )( )sec1 1 1
11 0 1m → − = − = −
+
c. Using point ( )( ) ( )1, 1 1,1f = and
slope = 100101
− , we get the secant line:
( )1001 1101100 1001101 101100 201101 101
y x
y x
y x
− = − −
− = − +
= − +
d. Graphing:
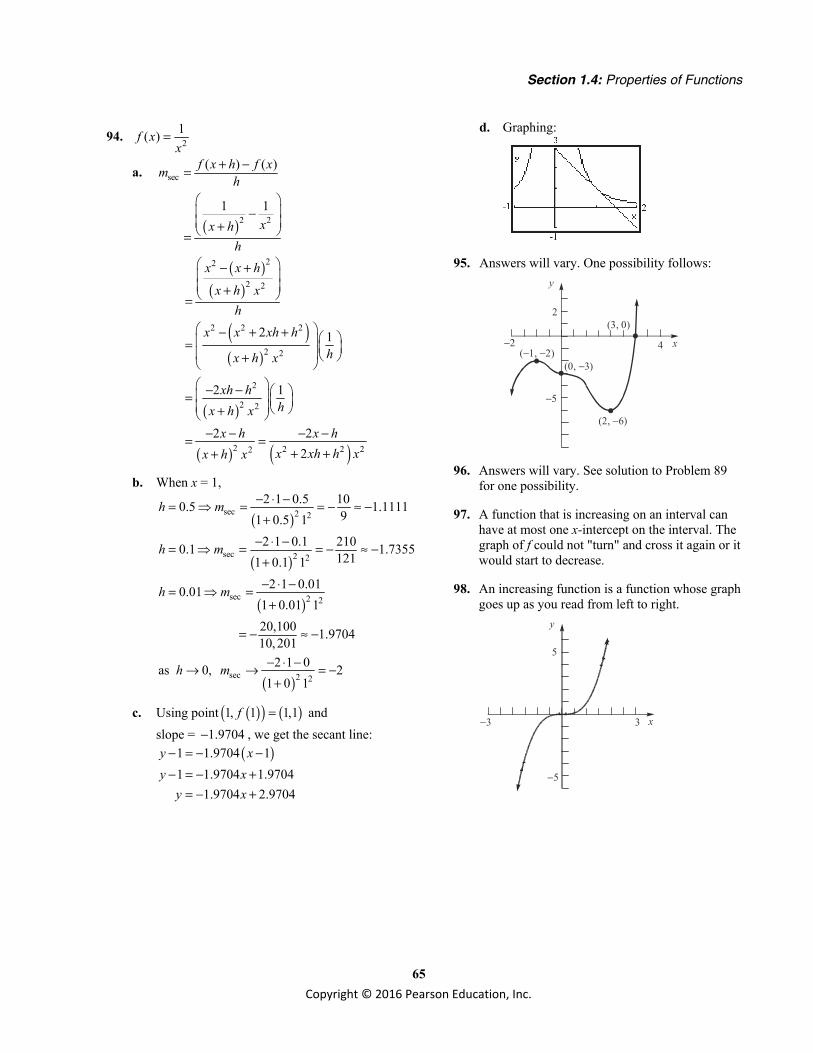
Section 1.4: Properties of Functions
65 Copyright © 2016 Pearson Education, Inc.
94. 21( )f xx
=
a.
( )
sec
2 2
( ) ( )
1 1
f x h f xmh
xx hh
+ −=
− + =
( )( )
( )( )
( )
( ) ( )
22
2 2
2 2 2
2 2
2
2 2
2 2 2 22
2 1
2 1
2 22
x x h
x h xh
x x xh hhx h x
xh hhx h x
x h x hx xh h xx h x
− + + =
− + + = + − − = +
− − − −= =+ ++
b. When x = 1,
( )sec 2 22 1 0.5 100.5 1.1111
91 0.5 1h m − ⋅ −= = = − ≈ −
+
( )sec 2 22 1 0.1 2100.1 1.7355
1211 0.1 1h m − ⋅ −= = = − ≈ −
+
( )sec 2 22 1 0.010.01
1 0.01 120,100 1.970410, 201
h m − ⋅ −= =+
= − ≈ −
( )sec 2 22 1 0as 0, 2
1 0 1h m − ⋅ −→ → = −
+
c. Using point ( )( ) ( )1, 1 1,1f = and slope = 1.9704− , we get the secant line:
( )1 1.9704 11 1.9704 1.9704
1.9704 2.9704
y xy x
y x
− = − −− = − +
= − +
d. Graphing:
95. Answers will vary. One possibility follows:
−2 4
−5
y
2
(0, 3)−
(3, 0)
(2, 6)−
( 1, 2)− −
96. Answers will vary. See solution to Problem 89 for one possibility.
97. A function that is increasing on an interval can have at most one x-intercept on the interval. The graph of f could not "turn" and cross it again or it would start to decrease.
98. An increasing function is a function whose graph goes up as you read from left to right.
5
−5
y
−3 3

Chapter 1: Graphs and Functions
66 Copyright © 2016 Pearson Education, Inc.
A decreasing function is a function whose graph goes down as you read from left to right.
5
−5
y
−3 3
99. To be an even function we need ( ) ( )f x f x− = and to be an odd function we need
( ) ( )f x f x− = − . In order for a function be both
even and odd, we would need ( ) ( )f x f x= − .
This is only possible if ( ) 0f x = .
100. The graph of 5y = is a horizontal line.
The local maximum is 5y = and it occurs at
each x-value in the interval. 101. Not necessarily. It just means ( ) ( )5 2f f> .
The function could have both increasing and decreasing intervals.
102.
( )
2 1
2 1 2 1
( ) ( ) 0
(2) ( 2) 0 0 042 2
f x f x b bx x x x
f f
− −= =− −
− − −= =− −
Section 1.5
1. y = x
2. y = 1x
3. y = x 3 − 8 y-intercept: Let 0x = , then ( )30 8 8y = − = − .
x-intercept: Let 0y = , then 3
3
0 8
82
x
xx
= −
==
The intercepts are ( )0, 8− and ( )2,0 .
4. ( ),0−∞
5. piecewise-defined
6. True
7. False; the cube root function is odd and increasing on the interval ( ),−∞ ∞ .

Section 1.5: Library of Functions; Piecewise-defined Functions
67 Copyright © 2016 Pearson Education, Inc.
8. False; the domain and range of the reciprocal function are both the set of real numbers except for 0.
9. b
10. a
11. C
12. A
13. E
14. G
15. B
16. D
17. F
18. H
19. ( )f x x=
20. ( ) 2f x x=
21. ( ) 3f x x=
22. ( )f x x=
23. ( ) 1f xx
=
24. ( )f x x=
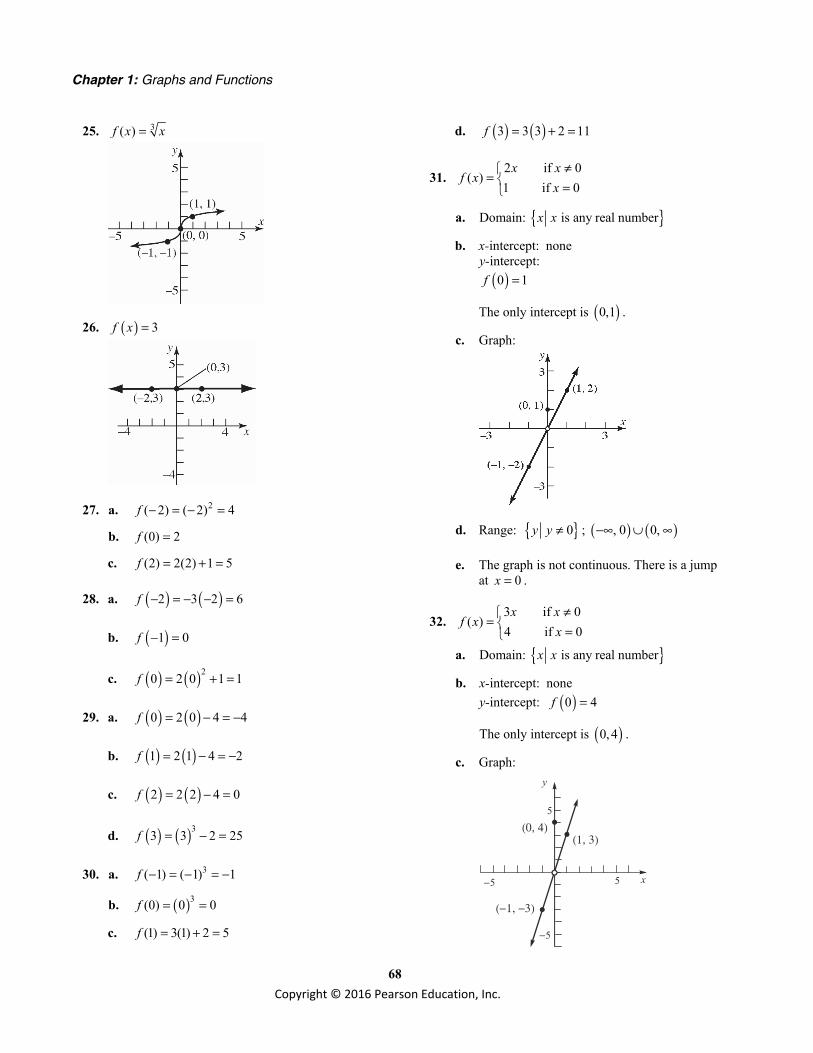
Chapter 1: Graphs and Functions
68 Copyright © 2016 Pearson Education, Inc.
25. 3( )f x x=
26. ( ) 3f x =
27. a. 2( 2) ( 2) 4f − = − =
b. (0) 2f =
c. (2) 2(2) 1 5f = + =
28. a. ( ) ( )2 3 2 6f − = − − =
b. ( )1 0f − =
c. ( ) ( )20 2 0 1 1f = + =
29. a. ( ) ( )0 2 0 4 4f = − = −
b. ( ) ( )1 2 1 4 2f = − = −
c. ( ) ( )2 2 2 4 0f = − =
d. ( ) ( )33 3 2 25f = − =
30. a. 3( 1) ( 1) 1f − = − = −
b. ( )3(0) 0 0f = =
c. (1) 3(1) 2 5f = + =
d. ( ) ( )3 3 3 2 11f = + =
31. 2 if 0
( )1 if 0
x xf x
x≠
= =
a. Domain: { }is any real numberx x
b. x-intercept: none y-intercept:
( )0 1f =
The only intercept is ( )0,1 .
c. Graph:
d. Range: { }0y y ≠ ; ( ) ( ), 0 0,−∞ ∪ ∞
e. The graph is not continuous. There is a jump at 0x = .
32. 3 if 0
( )4 if 0x x
f xx
≠= =
a. Domain: { }is any real numberx x
b. x-intercept: none y-intercept: ( )0 4f =
The only intercept is ( )0,4 .
c. Graph:
5
−5
y
5−5
(0, 4)(1, 3)
(−1, −3)

Section 1.5: Library of Functions; Piecewise-defined Functions
69 Copyright © 2016 Pearson Education, Inc.
d. Range: { }0y y ≠ ; ( ) ( ), 0 0,−∞ ∪ ∞
e. The graph is not continuous. There is a jump at 0x = .
33. 2 3 if 1
( )3 2 if 1
x xf x
x x− + <
= − ≥
a. Domain: { } is any real numberx x
b. x-intercept: none y-intercept: ( ) ( )0 2 0 3 3f = − + =
The only intercept is ( )0,3 .
c. Graph:
d. Range: { }1y y ≥ ; [ )1, ∞
e. The graph is continuous. There are no holes or gaps.
34. 3 if 2
( )2 3 if 2
x xf x
x x+ < −
= − − ≥ −
a. Domain: { } is any real numberx x
b. 3 03
xx
+ == −
2 3 02 3
32
xx
x
− − =− =
= −
x-intercepts: 33,2
− −
y-intercept: ( ) ( )0 2 0 3 3f = − − = −
The intercepts are ( )3,0− , 3 ,02
−
, and
( )0, 3− .
c. Graph:
d. Range: { }1y y ≤ ; ( ], 1−∞
e. The graph is continuous. There are no holes or gaps.
35. 3 if 2 1
( ) 5 if 12 if 1
x xf x x
x x
+ − ≤ <= =− + >
a. Domain: { }2x x ≥ − ; [ )2,− ∞
b. 3 03
(not in domain)
xx
+ == −
2 02
2
xxx
− + =− = −
=
x-intercept: 2
y-intercept: ( )0 0 3 3f = + =
The intercepts are ( )2,0 and ( )0,3 .
c. Graph:
d. Range: { }4, 5y y y< = ; ( ) { }, 4 5−∞ ∪
e. The graph is not continuous. There is a jump at 1x = .

Chapter 1: Graphs and Functions
70 Copyright © 2016 Pearson Education, Inc.
36. 2 5 if 3 0
( ) 3 if 05 if 0
x xf x x
x x
+ − ≤ <= − =− >
a. Domain: { }3x x ≥ − ; [ )3,− ∞
b. 2 5 02 5
52
xx
x
+ == −
= −
5 00
(not in domain of piece)
xx− =
=
x-intercept: 52
−
y-intercept: ( )0 3f = −
The intercepts are 5 ,02
−
and ( )0, 3− .
c. Graph:
d. Range: { }5y y < ; ( ), 5−∞
e. The graph is not continuous. There is a jump at 0x = .
37. 21 if 0
( ) if 0
x xf x
x x+ <= ≥
a. Domain: { } is any real numberx x
b. 1 01
xx
+ == −
2 00
xx
==
x-intercepts: 1,0−
y-intercept: ( ) 20 0 0f = =
The intercepts are ( )1,0− and ( )0,0 .
c. Graph:
d. Range: { }is any real numbery y
e. The graph is not continuous. There is a jump at 0x = .
38. 3
1 if 0( )
if 0
xxf xx x
<= ≥
a. Domain: { }is any real numberx x
b. 1 0
(no solution)x
= 3 00
xx
==
x-intercept: 0
y-intercept: ( ) 30 0 0f = =
The only intercept is ( )0,0 .
c. Graph:
d. Range: { }is any real numbery y
e. The graph is not continuous. There is a break at 0x = .
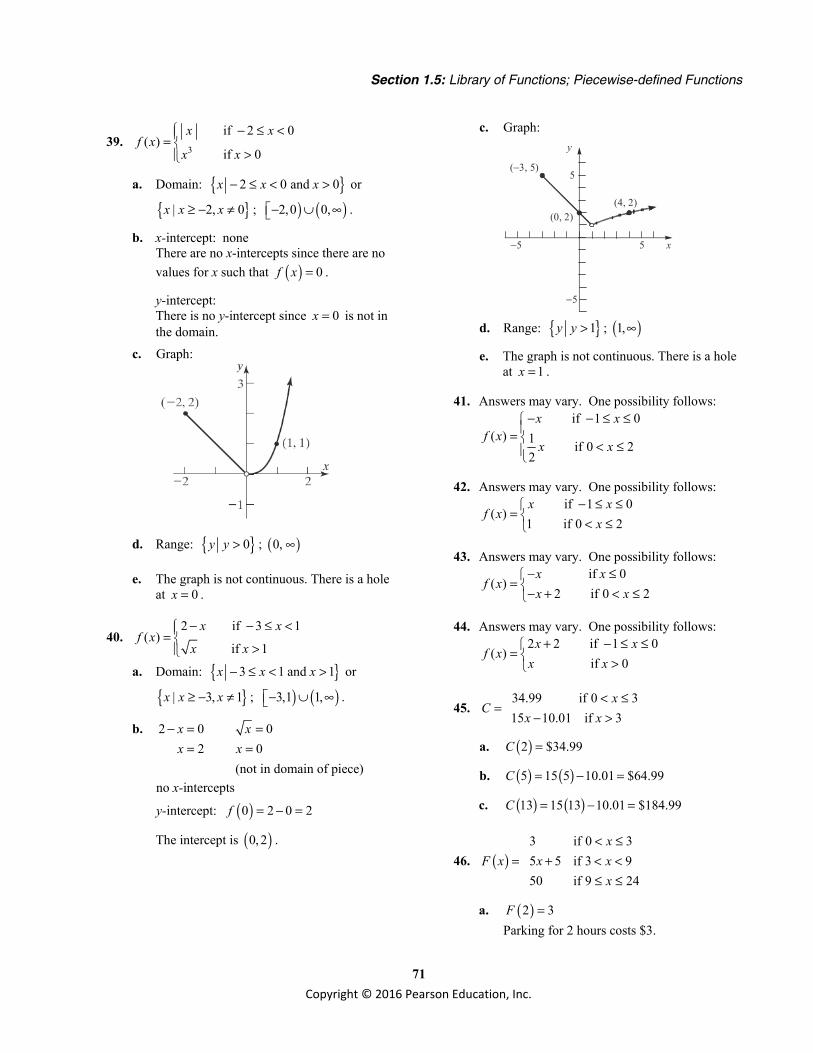
Section 1.5: Library of Functions; Piecewise-defined Functions
71 Copyright © 2016 Pearson Education, Inc.
39. 3
if 2 0( )
if 0
x xf x
x x
− ≤ <= >
a. Domain: { }2 0 and 0x x x− ≤ < > or
{ }| 2, 0x x x≥ − ≠ ; ) ( )2,0 0,− ∪ ∞ .
b. x-intercept: none There are no x-intercepts since there are no values for x such that ( ) 0f x = .
y-intercept: There is no y-intercept since 0x = is not in the domain.
c. Graph:
d. Range: { }0y y > ; ( )0, ∞
e. The graph is not continuous. There is a hole at 0x = .
40. 2 if 3 1
( ) if 1
x xf x
x x
− − ≤ <= >
a. Domain: { }3 1 and 1x x x− ≤ < > or
{ }| 3, 1x x x≥ − ≠ ; ) ( )3,1 1,− ∪ ∞ .
b. 2 02
xx
− ==
00
(not in domain of piece)
xx
==
no x-intercepts
y-intercept: ( )0 2 0 2f = − =
The intercept is ( )0, 2 .
c. Graph: y
5
x−5 5
−5
( 3, 5)−
(0, 2)(4, 2)
d. Range: { }1y y > ; ( )1,∞
e. The graph is not continuous. There is a hole at 1x = .
41. Answers may vary. One possibility follows: if 1 0
( ) 1 if 0 22
x xf x
x x
− − ≤ ≤= < ≤
42. Answers may vary. One possibility follows: if 1 0
( )1 if 0 2x x
f xx
− ≤ ≤= < ≤
43. Answers may vary. One possibility follows: if 0
( )2 if 0 2
x xf x
x x− ≤
= − + < ≤
44. Answers may vary. One possibility follows: 2 2 if 1 0
( ) if 0
x xf x
x x+ − ≤ ≤
= >
45. 34.99 if 0 315 10.01 if 3
xC
x x< ≤
= − >
a. ( )2 $34.99C =
b. ( ) ( )5 15 5 10.01 $64.99C = − =
c. ( ) ( )13 15 13 10.01 $184.99C = − =
46. ( )3 if 0 35 5 if 3 950 if 9 24
xF x x x
x
< ≤ = + < < ≤ ≤
a. ( )2 3F = Parking for 2 hours costs $3.
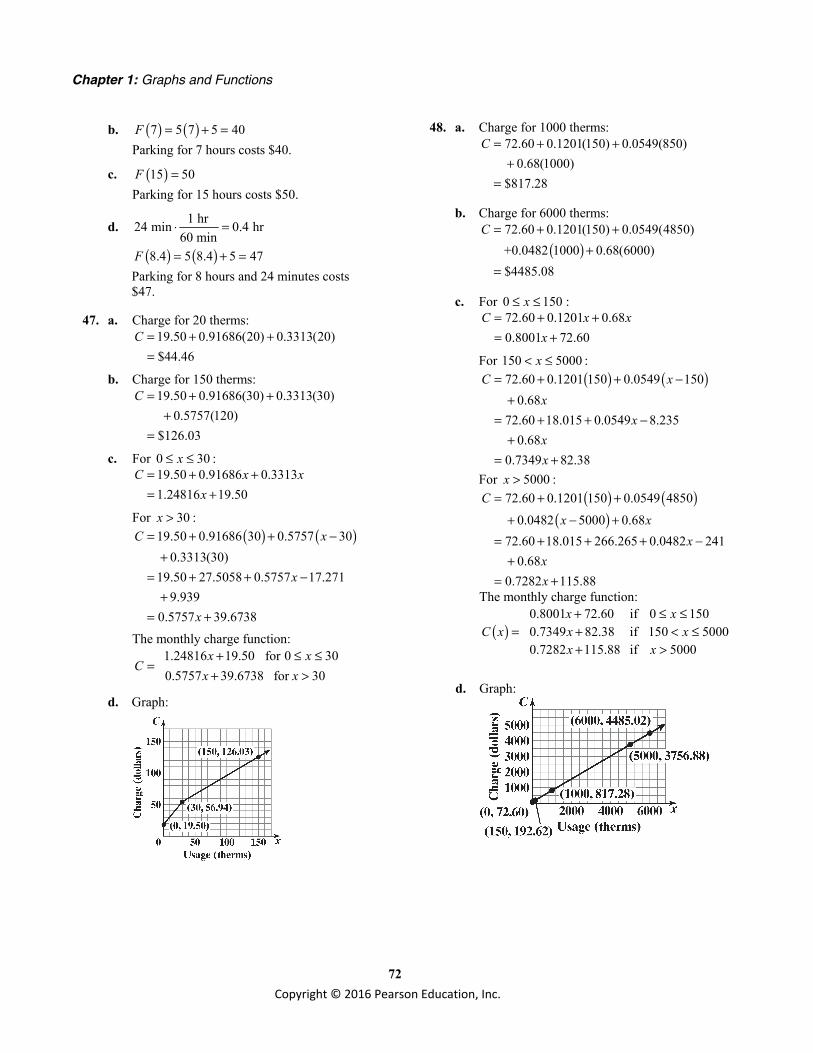
Chapter 1: Graphs and Functions
72 Copyright © 2016 Pearson Education, Inc.
b. ( ) ( )7 5 7 5 40F = + = Parking for 7 hours costs $40.
c. ( )15 50F = Parking for 15 hours costs $50.
d. 1 hr24 min 0.4 hr60 min
⋅ =
( ) ( )8.4 5 8.4 5 47F = + = Parking for 8 hours and 24 minutes costs $47.
47. a. Charge for 20 therms: 19.50 0.91686(20) 0.3313(20)$44.46
C = + +=
b. Charge for 150 therms: 19.50 0.91686(30) 0.3313(30)
0.5757(120)$126.03
C = + ++
=
c. For 0 30x≤ ≤ : 19.50 0.91686 0.33131.24816 19.50
C x xx
= + += +
For 30x > : ( ) ( )19.50 0.91686 30 0.5757 30
0.3313(30)19.50 27.5058 0.5757 17.271
9.9390.5757 39.6738
C x
x
x
= + + −+
= + + −+
= +
The monthly charge function: 1.24816 19.50 for 0 300.5757 39.6738 for 30
x xC
x x+ ≤ ≤
= + >
d. Graph:
48. a. Charge for 1000 therms: 72.60 0.1201(150) 0.0549(850)
0.68(1000)$817.28
C = + ++
=
b. Charge for 6000 therms:
( )72.60 0.1201(150) 0.0549(4850)
+0.0482 1000 0.68(6000)$4485.08
C = + ++
=
c. For 0 150x≤ ≤ : 72.60 0.1201 0.680.8001 72.60
C x xx
= + += +
For 150 5000x< ≤ : ( ) ( )72.60 0.1201 150 0.0549 150
0.6872.60 18.015 0.0549 8.235
0.680.7349 82.38
C xx
xxx
= + + −+
= + + −+
= +
For 5000x > : ( ) ( )
( )72.60 0.1201 150 0.0549 4850
0.0482 5000 0.6872.60 18.015 266.265 0.0482 241
0.680.7282 115.88
Cx x
xxx
= + +
+ − += + + + −
+= +
The monthly charge function:
( )0.8001 72.60 if 0 1500.7349 82.38 if 150 50000.7282 115.88 if 5000
x xC x x x
x x
+ ≤ ≤ = + < ≤ + >
d. Graph:

Section 1.5: Library of Functions; Piecewise-defined Functions
73 Copyright © 2016 Pearson Education, Inc.
49. For schedule X: 0.10 if 0 9075907.50 0.15( 9075) if 9075 36,9005081.25 0.25( 36,900) if 36,900 89,350
( ) 18,193.75 0.28( 89,350) if 89,350 186,35045,353.75 0.33( 186,350) if 117,541.25 0.35( 405,100)
x xx xx x
f x x xxx
< ≤+ − < ≤+ − < ≤
= + − < ≤+ −+ −
186,350 405,100if 405,100 406,750
118,188.75 0.396( 406,750) if 406,750
xx
x x
< ≤
< ≤ + − >
50. For Schedule Y 1− : 0.10 if 0 18,1501815.00 0.15( 18,150) if 18,150 73,80010,162.50 0.25( 73,800) if 73,800 148,850
( ) 28,925.00 0.28( 148,850) if 148,850 226,85050,765.00 0.33( 226,850)109,587.50 0.35( 4
x xx x
x xf x x x
xx
< ≤+ − < ≤
+ − < ≤= + − < ≤
+ −+ −
if 226,850 405,10005,100) if 405,100 457,600
127,962.50 0.396( 457,600) if 457,600
xx
x x
< ≤
< ≤ + − >
51. a. Let x represent the number of miles and C be the cost of transportation. 0.50 if 0 1000.50(100) 0.40( 100) if 100 400
( )0.50(100) 0.40(300) 0.25( 400) if 400 8000.50(100) 0.40(300) 0.25(400) 0( 800) if 800 960
x xx x
C xx x
x x
≤ ≤ + − < ≤= + + − < ≤ + + + − < ≤
0.50 if 0 10010 0.40 if 100 400
( )70 0.25 if 400 800270 if 800 960
x xx x
C xx x
x
≤ ≤ + < ≤= + < ≤ < ≤
b. For hauls between 100 and 400 miles the cost is: ( ) 10 0.40C x x= + .
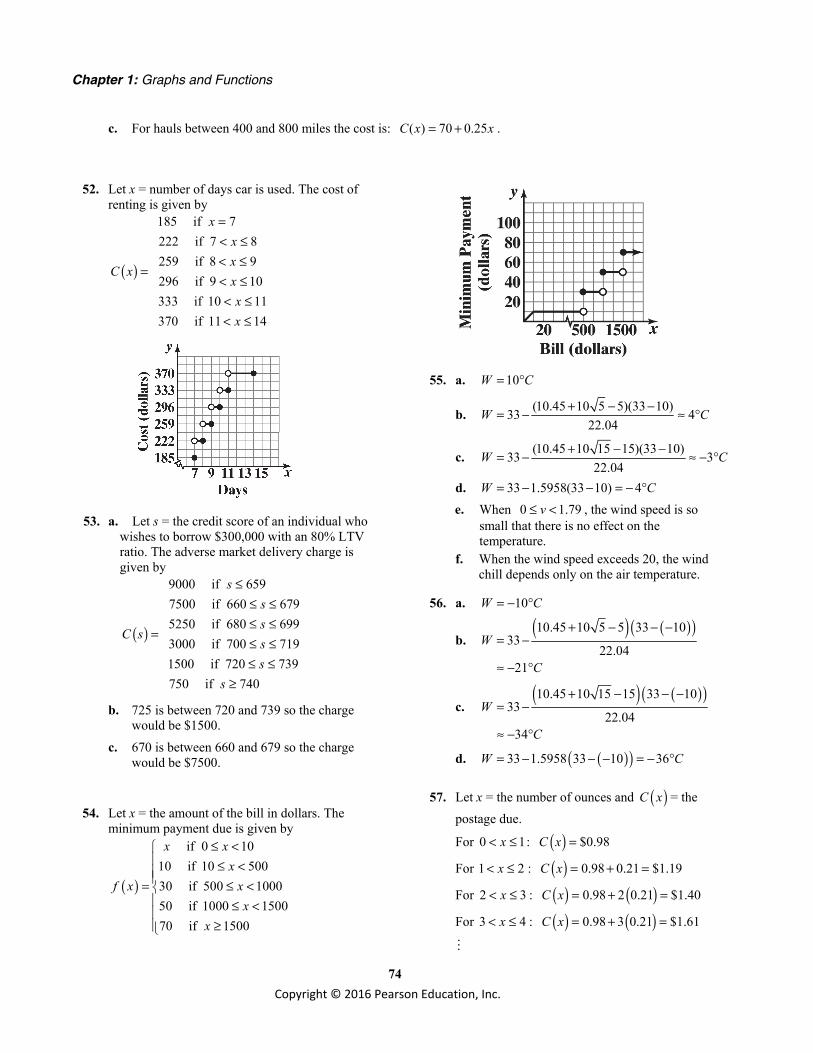
Chapter 1: Graphs and Functions
74 Copyright © 2016 Pearson Education, Inc.
c. For hauls between 400 and 800 miles the cost is: ( ) 70 0.25C x x= + .
52. Let x = number of days car is used. The cost of renting is given by
( )
185 if 7222 if 7 8259 if 8 9296 if 9 10333 if 10 11370 if 11 14
xxx
C xxxx
= < ≤ < ≤
= < ≤ < ≤
< ≤
53. a. Let s = the credit score of an individual who wishes to borrow $300,000 with an 80% LTV ratio. The adverse market delivery charge is given by
( )
9000 if 6597500 if 660 6795250 if 680 6993000 if 700 7191500 if 720 739750 if 740
sss
C sss
s
≤ ≤ ≤ ≤ ≤
= ≤ ≤ ≤ ≤
≥
b. 725 is between 720 and 739 so the charge would be $1500.
c. 670 is between 660 and 679 so the charge would be $7500.
54. Let x = the amount of the bill in dollars. The minimum payment due is given by
( )
if 0 1010 if 10 50030 if 500 100050 if 1000 150070 if 1500
x xx
f x xx
x
≤ < ≤ <= ≤ < ≤ <
≥
55. a. 10W C= °
b. (10.45 10 5 5)(33 10)33 422.04
W C+ − −= − ≈ °
c. (10.45 10 15 15)(33 10)33 322.04
W C+ − −= − ≈ − °
d. 33 1.5958(33 10) 4W C= − − = − ° e. When 0 1.79v≤ < , the wind speed is so
small that there is no effect on the temperature.
f. When the wind speed exceeds 20, the wind chill depends only on the air temperature.
56. a. 10W C= − °
b. ( ) ( )( )10.45 10 5 5 33 10
3322.04
21
W
C
+ − − −= −
≈ − °
c. ( ) ( )( )10.45 10 15 15 33 10
3322.04
34
W
C
+ − − −= −
≈ − °
d. ( )( )33 1.5958 33 10 36W C= − − − = − °
57. Let x = the number of ounces and ( )C x = the postage due.
For 0 1x< ≤ : ( ) $0.98C x =
For 1 2x< ≤ : ( ) 0.98 0.21 $1.19C x = + =
For 2 3x< ≤ : ( ) ( )0.98 2 0.21 $1.40C x = + =
For 3 4x< ≤ : ( ) ( )0.98 3 0.21 $1.61C x = + =
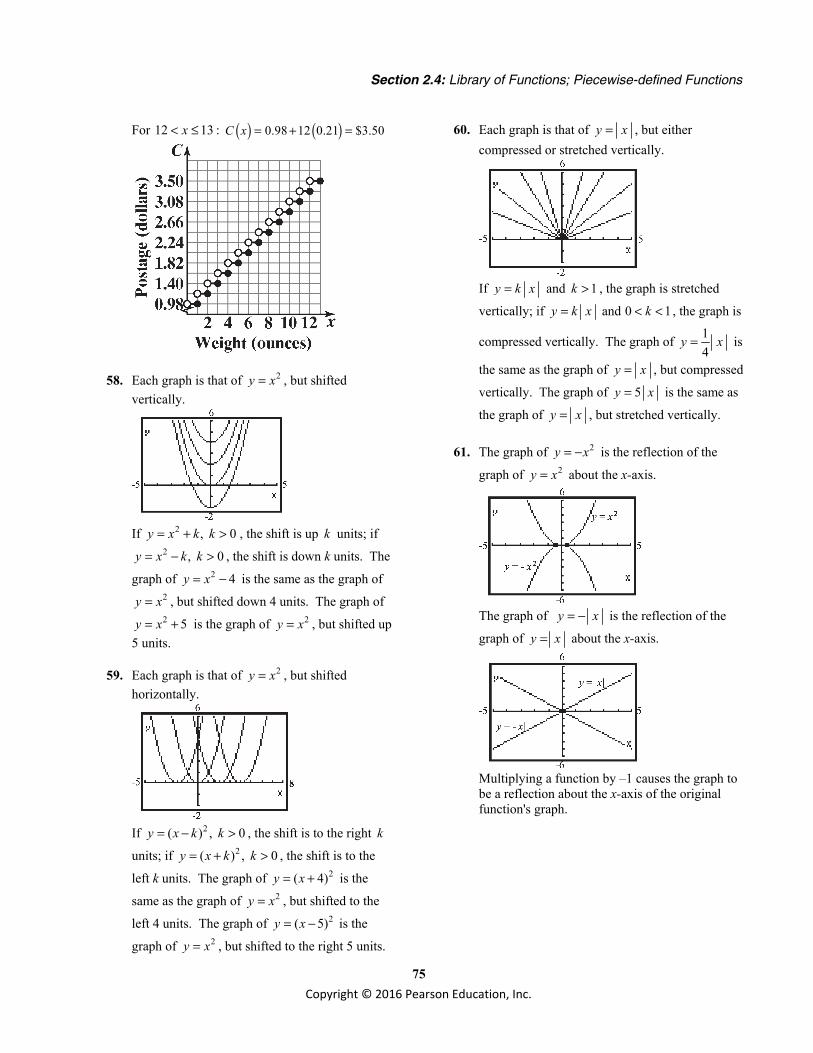
Section 2.4: Library of Functions; Piecewise-defined Functions
75 Copyright © 2016 Pearson Education, Inc.
For 12 13x< ≤ : ( ) ( )0.98 12 0.21 $3.50C x = + =
58. Each graph is that of 2y x= , but shifted vertically.
If 2 , 0y x k k= + > , the shift is up k units; if
2 , 0y x k k= − > , the shift is down k units. The
graph of 2 4y x= − is the same as the graph of 2y x= , but shifted down 4 units. The graph of 2 5y x= + is the graph of 2y x= , but shifted up
5 units.
59. Each graph is that of 2y x= , but shifted horizontally.
If 2( ) , 0y x k k= − > , the shift is to the right k
units; if 2( ) , 0y x k k= + > , the shift is to the
left k units. The graph of 2( 4)y x= + is the
same as the graph of 2y x= , but shifted to the
left 4 units. The graph of 2( 5)y x= − is the
graph of 2y x= , but shifted to the right 5 units.
60. Each graph is that of y x= , but either compressed or stretched vertically.
If y k x= and 1k > , the graph is stretched
vertically; if and 0 1y k x k= < < , the graph is
compressed vertically. The graph of 14
y x= is
the same as the graph of y x= , but compressed
vertically. The graph of 5y x= is the same as
the graph of y x= , but stretched vertically.
61. The graph of 2y x= − is the reflection of the
graph of 2y x= about the x-axis.
The graph of y x= − is the reflection of the
graph of y x= about the x-axis.
Multiplying a function by –1 causes the graph to be a reflection about the x-axis of the original function's graph.

Chapter 1: Graphs and Functions
76 Copyright © 2016 Pearson Education, Inc.
62. The graph of y x= − is the reflection about the
y-axis of the graph of y x= .
3
−1
5−5
y x= −
y x=
The same type of reflection occurs when graphing 2 1 and 2( ) 1y x y x= + = − + .
The graph of ( )y f x= − is the reflection about the y-axis of the graph of ( )y f x= .
63. The graph of 3( 1) 2y x= − + is a shifting of the
graph of 3y x= one unit to the right and two units up. Yes, the result could be predicted.
64. The graphs of ,ny x= n a positive even integer, are all U-shaped and open upward. All go through the points ( 1, 1)− , (0, 0) , and (1, 1) . As n increases, the graph of the function is narrower for 1x > and flatter for 1x < .
65. The graphs of ,ny x= n a positive odd integer, all have the same general shape. All go through the points ( 1, 1)− − , (0, 0) , and (1, 1) . As n increases, the graph of the function increases at a greater rate for 1x > and is flatter around 0 for
1x < .
66. ( ) 1 if is rational0 if is irrational
xf x
x
=
Yes, it is a function. Domain = { }is any real numberx x or ( ),−∞ ∞
Range = {0, 1} or { }| 0 or 1y y y= = y-intercept: 0 is rational 1x x y= = So the y-intercept is 1y = .
x-intercept: 0 is irrationaly x= So the graph has infinitely many x-intercepts, namely, there is an x-intercept at each irrational value of x.
( ) ( )1f x f x− = = when x is rational;
( ) ( )0f x f x− = = when x is irrational. Thus, f is even.
The graph of f consists of 2 infinite clusters of distinct points, extending horizontally in both directions. One cluster is located 1 unit above the x-axis, and the other is located along the x-axis.
67. For 0 < x < 1, the graph of ,ry x= r rational and 0r > , flattens down toward the x-axis as r gets
bigger. For x > 1, the graph of ry x= increases at a greater rate as r gets bigger.

Section 1.6: Graphing Techniques: Transformations
77 Copyright © 2016 Pearson Education, Inc.
Section 1.6
1. horizontal; right
2. y
3. False
4. True; the graph of ( )y f x= − is the reflection
about the x-axis of the graph of ( )y f x= .
5. d
6. a
7. False
8. b
9. B
10. E
11. H
12. D
13. I
14. A
15. L
16. C
17. F
18. J
19. G
20. K
21. 3( 4)y x= −
22. 3( 4)y x= +
23. 3 4y x= +
24. 3 4y x= −
25. ( )3 3y x x= − = −
26. 3y x= −
27. 34y x=
28. 3
31 14 64
y x x = =
29. (1) 2y x= +
( )( )
(2) 2
(3) 2 2
y x
y x x
= − +
= − − + = − − −
30. (1) y x= −
(2) 3
(3) 3 2
y x
y x
= − −
= − − −
31. (1) y x= −
(2) 2
(3) 3 2
y x
y x
= − +
= − + +
32. (1) 2y x= +
(2) 2
(3) ( 3) 2 3 2
y x
y x x
= − +
= − + + = − − +
33. (c); To go from ( )y f x= to ( )y f x= − we reflect about the x-axis. This means we change the sign of the y-coordinate for each point on the graph of ( )y f x= . Thus, the point (3, 6) would
become ( )3, 6− .
34. (d); To go from ( )y f x= to ( )y f x= − , we
reflect each point on the graph of ( )y f x= about the y-axis. This means we change the sign of the x-coordinate for each point on the graph of
( )y f x= . Thus, the point ( )3,6 would become
( )3,6− .
35. (c); To go from ( )y f x= to ( )2y f x= , we stretch vertically by a factor of 2. Multiply the y-coordinate of each point on the graph of
( )y f x= by 2. Thus, the point ( )1,3 would
become ( )1,6 .
36. (c); To go from ( )y f x= to ( )2y f x= , we compress horizontally by a factor of 2. Divide the x-coordinate of each point on the graph of

Chapter 1: Graphs and Functions
78 Copyright © 2016 Pearson Education, Inc.
( )y f x= by 2. Thus, the point ( )4, 2 would
become ( )2,2 .
37. a. The graph of ( )2y f x= + is the same as
the graph of ( )y f x= , but shifted 2 units to the left. Therefore, the x-intercepts are 7− and 1.
b. The graph of ( )2y f x= − is the same as
the graph of ( )y f x= , but shifted 2 units to the right. Therefore, the x-intercepts are 3− and 5.
c. The graph of ( )4y f x= is the same as the
graph of ( )y f x= , but stretched vertically by a factor of 4. Therefore, the x-intercepts are still 5− and 3 since the y-coordinate of each is 0.
d. The graph of ( )y f x= − is the same as the
graph of ( )y f x= , but reflected about the y-axis. Therefore, the x-intercepts are 5 and
3− .
38. a. The graph of ( )4y f x= + is the same as
the graph of ( )y f x= , but shifted 4 units to the left. Therefore, the x-intercepts are 12− and 3− .
b. The graph of ( )3y f x= − is the same as
the graph of ( )y f x= , but shifted 3 units to the right. Therefore, the x-intercepts are 5− and 4.
c. The graph of ( )2y f x= is the same as the
graph of ( )y f x= , but stretched vertically by a factor of 2. Therefore, the x-intercepts are still 8− and 1 since the y-coordinate of each is 0.
d. The graph of ( )y f x= − is the same as the
graph of ( )y f x= , but reflected about the y-axis. Therefore, the x-intercepts are 8 and
1− .
39. a. The graph of ( )2y f x= + is the same as
the graph of ( )y f x= , but shifted 2 units to
the left. Therefore, the graph of ( )2f x + is
increasing on the interval ( )3,3− .
b. The graph of ( )5y f x= − is the same as
the graph of ( )y f x= , but shifted 5 units to
the right. Therefore, the graph of ( )5f x −
is increasing on the interval ( )4,10 .
c. The graph of ( )y f x= − is the same as the
graph of ( )y f x= , but reflected about the x-axis. Therefore, we can say that the graph of ( )y f x= − must be decreasing on the
interval ( )1,5− .
d. The graph of ( )y f x= − is the same as the
graph of ( )y f x= , but reflected about the y-axis. Therefore, we can say that the graph of ( )y f x= − must be decreasing on the
interval ( )5,1− .
40. a. The graph of ( )2y f x= + is the same as
the graph of ( )y f x= , but shifted 2 units to
the left. Therefore, the graph of ( )2f x + is
decreasing on the interval ( )4,5− .
b. The graph of ( )5y f x= − is the same as
the graph of ( )y f x= , but shifted 5 units to
the right. Therefore, the graph of ( )5f x −
is decreasing on the interval ( )3,12 .
c. The graph of ( )y f x= − is the same as the
graph of ( )y f x= , but reflected about the x-axis. Therefore, we can say that the graph of ( )y f x= − must be increasing on the
interval ( )2,7− .
d. The graph of ( )y f x= − is the same as the
graph of ( )y f x= , but reflected about the y-axis. Therefore, we can say that the graph of ( )y f x= − must be increasing on the
interval ( )7, 2− .
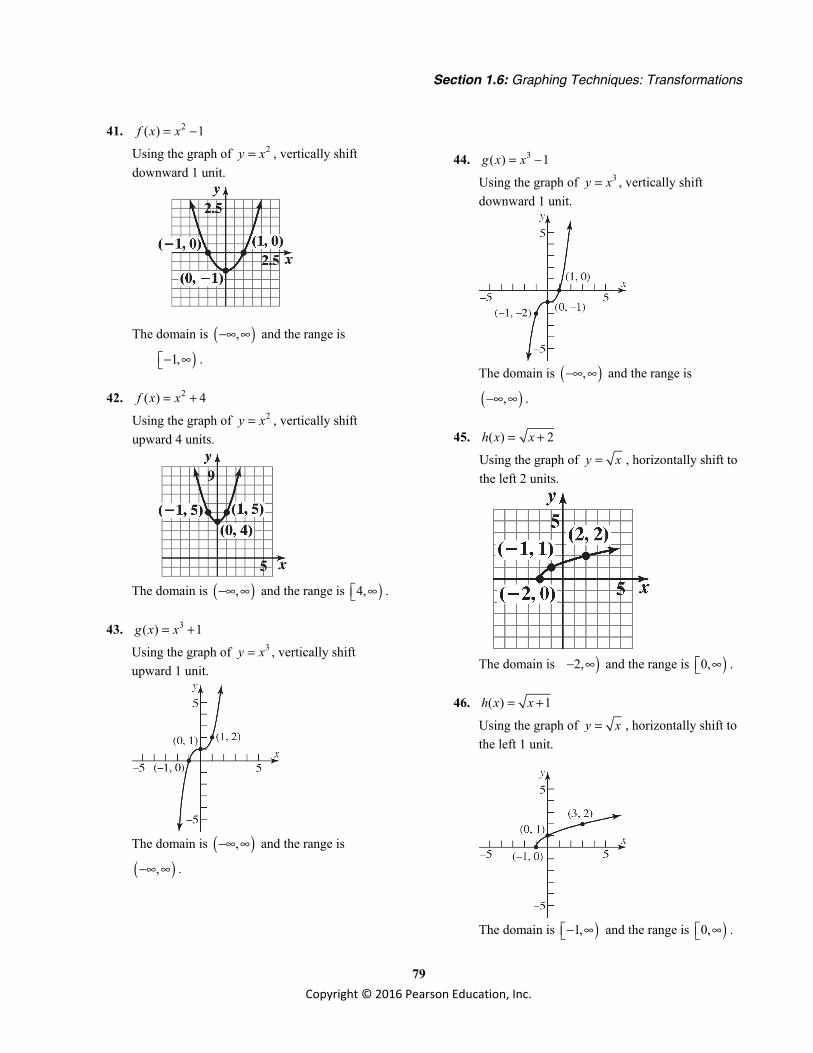
Section 1.6: Graphing Techniques: Transformations
79 Copyright © 2016 Pearson Education, Inc.
41. 2( ) 1f x x= − Using the graph of 2y x= , vertically shift downward 1 unit.
The domain is ( ),−∞ ∞ and the range is
)1,− ∞ .
42. 2( ) 4f x x= + Using the graph of 2y x= , vertically shift upward 4 units.
The domain is ( ),−∞ ∞ and the range is )4,∞ .
43. 3( ) 1g x x= + Using the graph of 3y x= , vertically shift upward 1 unit.
The domain is ( ),−∞ ∞ and the range is
( ),−∞ ∞ .
44. 3( ) 1g x x= − Using the graph of 3y x= , vertically shift downward 1 unit.
The domain is ( ),−∞ ∞ and the range is
( ),−∞ ∞ .
45. ( ) 2h x x= + Using the graph of y x= , horizontally shift to the left 2 units.
The domain is )2,− ∞ and the range is )0,∞ .
46. ( ) 1h x x= + Using the graph of y x= , horizontally shift to the left 1 unit.
The domain is )1,− ∞ and the range is )0,∞ .

Chapter 1: Graphs and Functions
80 Copyright © 2016 Pearson Education, Inc.
47. 3( ) ( 1) 2f x x= − + Using the graph of 3y x= , horizontally shift to
the right 1 unit ( )31y x = − , then vertically
shift up 2 units ( )31 2y x = − + .
The domain is ( ),−∞ ∞ and the range is
( ),−∞ ∞ .
48. 3( ) ( 2) 3f x x= + − Using the graph of 3y x= , horizontally shift to
the left 2 units ( )32y x = + , then vertically
shift down 3 units ( )32 3y x = + − .
The domain is ( ),−∞ ∞ and the range is
( ),−∞ ∞ .
49. ( ) 4g x x= Using the graph of y x= , vertically stretch by a factor of 4.
The domain is )0,∞ and the range is )0,∞ .
50. 1( )2
g x x=
Using the graph of y x= , vertically compress
by a factor of 12
.
The domain is )0,∞ and the range is )0,∞ .
51. 3( )f x x= − Using the graph of 3y x= , reflect the graph about the x-axis.
The domain is ( ),−∞ ∞ and the range is
( ),−∞ ∞ .

Section 1.6: Graphing Techniques: Transformations
81 Copyright © 2016 Pearson Education, Inc.
52. ( )f x x= − Using the graph of y x= , reflect the graph about the x-axis.
The domain is )0,∞ and the range is ( ,0−∞ .
53. 2( ) 2( 1) 3f x x= + − Using the graph of 2y x= , horizontally shift to
the left 1 unit ( )21y x = + , vertically stretch
by a factor of 2 ( )22 1y x = + , and then
vertically shift downward 3 units
( )22 1 3y x = + − .
The domain is ( ),−∞ ∞ and the range is
)3,− ∞ .
54. 2( ) 3( 2) 1f x x= − + Using the graph of 2y x= , horizontally shift to
the right 2 units ( )22y x = − , vertically
stretch by a factor of 3 ( )23 2y x = − , and then
vertically shift upward 1 unit
( )23 2 1y x = − + .
The domain is ( ),−∞ ∞ and the range is )1,∞ .
55. ( ) 2 2 1g x x= − + Using the graph of y x= , horizontally shift to
the right 2 units 2y x = − , vertically stretch
by a factor of 2 2 2y x = − , and vertically
shift upward 1 unit 2 2 1y x = − + .
The domain is )2,∞ and the range is )1,∞ .
56. ( ) 3 1 3g x x= + − Using the graph of y x= , horizontally shift to
the left 1 unit 1y x = + , vertically stretch by a
factor of 3 3 1y x = + , and vertically shift
downward 3 units 3 1 3y x = + − .

Chapter 1: Graphs and Functions
82 Copyright © 2016 Pearson Education, Inc.
The domain is ( ),−∞ ∞ and the range is
)3,− ∞ .
57. ( ) 2h x x= − − Using the graph of y x= , reflect the graph
about the y-axis y x = − and vertically shift
downward 2 units 2y x = − − .
The domain is ( ,0−∞ and the range is )2,− ∞ .
58. 4 1( ) 2 4 2h xx x
= + = +
Stretch the graph of 1yx
= vertically by a factor
of 4 1 44yx x
= ⋅ =
and vertically shift upward 2
units 4 2yx
= +
.
The domain is ( ) ( ),0 0,−∞ ∪ ∞ and the range is
( ) ( ), 2 2,−∞ ∪ ∞ .
59. 3( ) ( 1) 1f x x= − + − Using the graph of 3y x= , horizontally shift to
the left 1 unit ( )31y x = + , reflect the graph
about the x-axis ( )31y x = − + , and vertically
shift downward 1 unit ( )31 1y x = − + − .
The domain is ( ),−∞ ∞ and the range is
( ),−∞ ∞ .
60. ( ) 4 1f x x= − − Using the graph of y x= , horizontally shift to
the right 1 unit 1y x = − , reflect the graph
about the x-axis 1y x = − − , and stretch
vertically by a factor of 4 4 1y x = − − .

Section 1.6: Graphing Techniques: Transformations
83 Copyright © 2016 Pearson Education, Inc.
The domain is )1,∞ and the range is ( ,0−∞ .
61. ( )( ) 2 1 2 1 2 1g x x x x= − = − − + = −
Using the graph of y x= , horizontally shift to
the right 1 unit 1y x = − , and vertically
stretch by a factor or 2 2 1y x = − .
The domain is ( ),−∞ ∞ and the range is )0,∞ .
62. ( ) 4 2 4 ( 2)g x x x= − = − −
Using the graph of y x= , reflect the graph
about the y-axis y x = − , horizontally shift
to the right 2 units ( )2y x = − − , and
vertically stretch by a factor of 4
( )4 2y x = − − .
The domain is ( , 2−∞ and the range is )0,∞ .
63. 1( )2
h xx
=
Using the graph of 1yx
= , vertically compress
by a factor of 12
.
The domain is ( ) ( ),0 0,−∞ ∪ ∞ and the range is
( ) ( ),0 0,−∞ ∪ ∞ .
64. 3( ) 1 3f x x= − + Using the graph of 3( )f x x= , horizontally shift
to the right 1 unit 3 1y x = − , then vertically
shift up 3 units 3 1 3y x = − + .
The domain is ( ),−∞ ∞ and the range is
( ),−∞ ∞ .

Chapter 1: Graphs and Functions
84 Copyright © 2016 Pearson Education, Inc.
65. a. ( ) ( ) 3F x f x= + Shift up 3 units.
b. ( ) ( 2)G x f x= +
Shift left 2 units.
c. ( ) ( )P x f x= − Reflect about the x-axis.
d. ( ) ( 1) 2H x f x= + − Shift left 1 unit and shift down 2 units.
e. 1( ) ( )2
Q x f x=
Compress vertically by a factor of 12
.
f. ( ) ( )g x f x= − Reflect about the y-axis.
g. ( ) (2 )h x f x=
Compress horizontally by a factor of 12
.

Section 1.6: Graphing Techniques: Transformations
85 Copyright © 2016 Pearson Education, Inc.
66. a. ( ) ( ) 3F x f x= + Shift up 3 units.
b. ( ) ( 2)G x f x= +
Shift left 2 units.
c. ( ) ( )P x f x= −
Reflect about the x-axis.
d. ( ) ( 1) 2H x f x= + −
Shift left 1 unit and shift down 2 units.
e. 1( ) ( )2
Q x f x=
Compress vertically by a factor of 12
.
f. ( ) ( )g x f x= −
Reflect about the y-axis.
g. ( ) (2 )h x f x=
Compress horizontally by a factor of 12
.
67. a. ( ) ( ) 3F x f x= + Shift up 3 units.
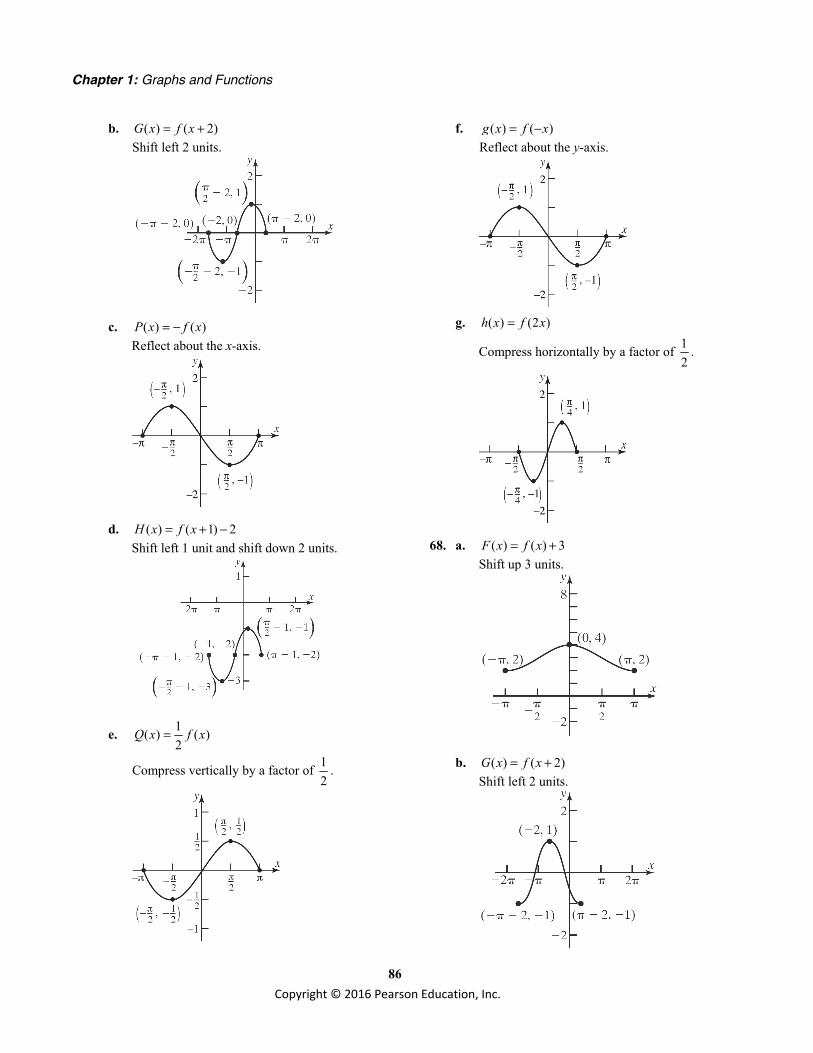
Chapter 1: Graphs and Functions
86 Copyright © 2016 Pearson Education, Inc.
b. ( ) ( 2)G x f x= + Shift left 2 units.
c. ( ) ( )P x f x= − Reflect about the x-axis.
d. ( ) ( 1) 2H x f x= + − Shift left 1 unit and shift down 2 units.
e. 1( ) ( )2
Q x f x=
Compress vertically by a factor of 12
.
f. ( ) ( )g x f x= − Reflect about the y-axis.
g. ( ) (2 )h x f x=
Compress horizontally by a factor of 12
.
68. a. ( ) ( ) 3F x f x= + Shift up 3 units.
b. ( ) ( 2)G x f x= + Shift left 2 units.
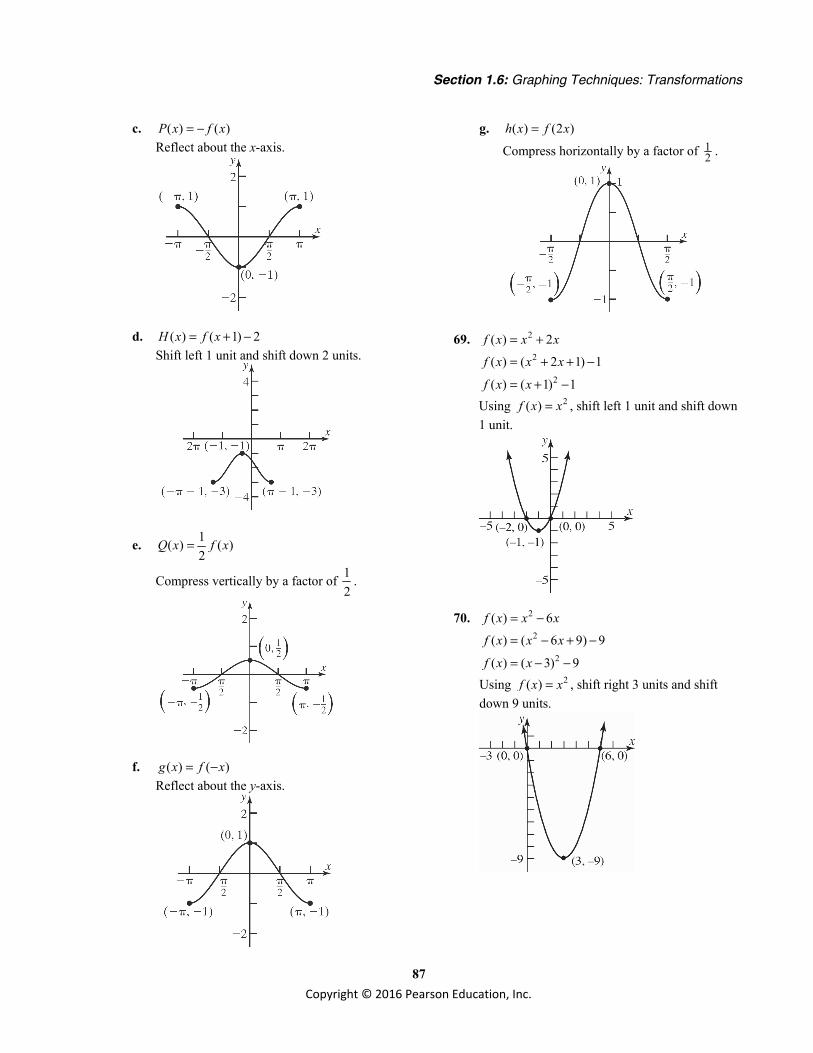
Section 1.6: Graphing Techniques: Transformations
87 Copyright © 2016 Pearson Education, Inc.
c. ( ) ( )P x f x= − Reflect about the x-axis.
d. ( ) ( 1) 2H x f x= + − Shift left 1 unit and shift down 2 units.
e. 1( ) ( )2
Q x f x=
Compress vertically by a factor of 12
.
f. ( ) ( )g x f x= − Reflect about the y-axis.
g. ( ) (2 )h x f x= Compress horizontally by a factor of 1
2 .
69. 2( ) 2f x x x= + 2
2
( ) ( 2 1) 1
( ) ( 1) 1
f x x x
f x x
= + + −
= + −
Using 2( )f x x= , shift left 1 unit and shift down 1 unit.
70. 2( ) 6f x x x= − 2
2
( ) ( 6 9) 9
( ) ( 3) 9
f x x x
f x x
= − + −
= − −
Using 2( )f x x= , shift right 3 units and shift down 9 units.

Chapter 1: Graphs and Functions
88 Copyright © 2016 Pearson Education, Inc.
71. 2( ) 8 1f x x x= − +
( )( )
2
2
( ) 8 16 1 16
( ) 4 15
f x x x
f x x
= − + + −
= − −
Using 2( )f x x= , shift right 4 units and shift down 15 units.
72. 2( ) 4 2f x x x= + +
( )( )
2
2
( ) 4 4 2 4
( ) 2 2
f x x x
f x x
= + + + −
= + −
Using 2( )f x x= , shift left 2 units and shift down 2 units.
73. ( )( )( )( )
2
2
2
2
2 12 19
2 6 19
2 6 9 19 18
2 3 1
f x x x
x x
x x
x
= − +
= − +
= − + + −
= − +
Using ( ) 2f x x= , shift right 3 units, vertically stretch by a factor of 2, and then shift up 1 unit.
74. ( )( )( )( )
2
2
2
2
3 6 1
3 2 1
3 2 1 1 3
3 1 2
f x x x
x x
x x
x
= + +
= + +
= + + + −
= + −
Using ( ) 2f x x= , shift left 1 unit, vertically stretch by a factor of 3, and shift down 2 units.
75. ( )
( )( )( )
2
2
2
2
3 12 17
3 4 17
3 4 4 17 12
3 2 5
f x x x
x x
x x
x
= − − −
= − + −
= − + + − +
= − + −
Using ( ) 2f x x= , shift left 2 units, stretch vertically by a factor of 3, reflect about the x-axis, and shift down 5 units.
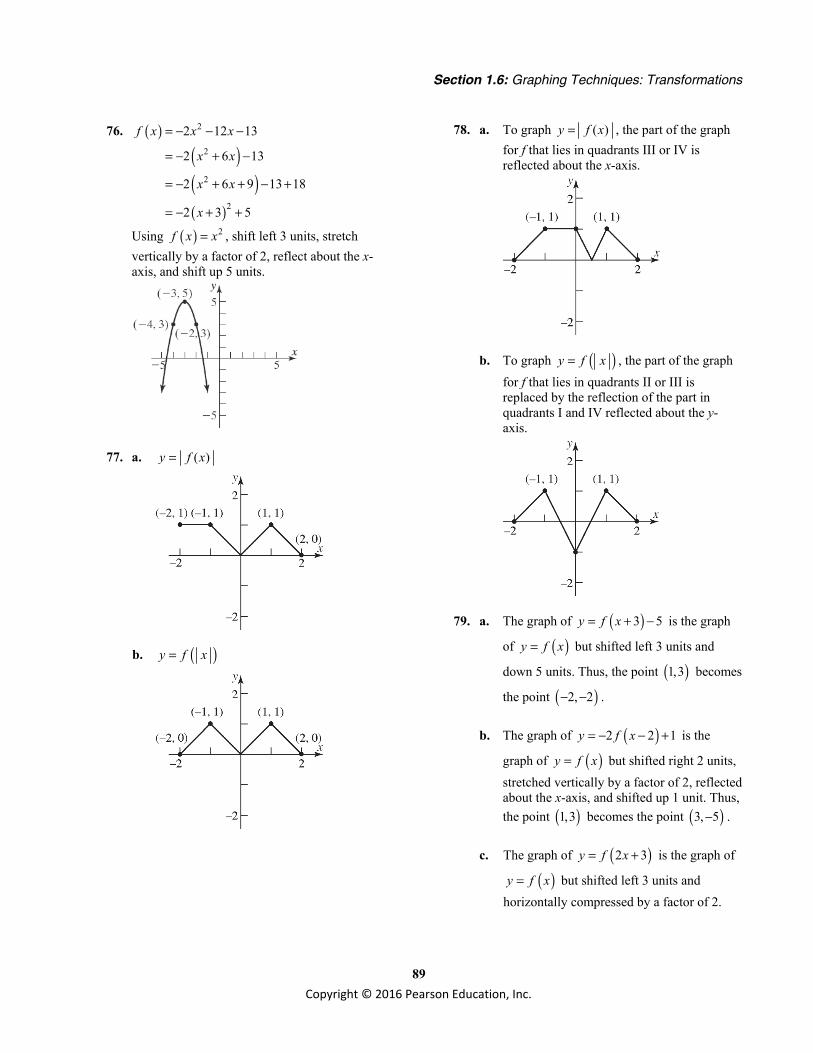
Section 1.6: Graphing Techniques: Transformations
89 Copyright © 2016 Pearson Education, Inc.
76. ( )( )( )( )
2
2
2
2
2 12 13
2 6 13
2 6 9 13 18
2 3 5
f x x x
x x
x x
x
= − − −
= − + −
= − + + − +
= − + +
Using ( ) 2f x x= , shift left 3 units, stretch vertically by a factor of 2, reflect about the x-axis, and shift up 5 units.
77. a. ( )y f x=
b. ( )y f x=
78. a. To graph ( )y f x= , the part of the graph for f that lies in quadrants III or IV is reflected about the x-axis.
b. To graph ( )y f x= , the part of the graph for f that lies in quadrants II or III is replaced by the reflection of the part in quadrants I and IV reflected about the y-axis.
79. a. The graph of ( )3 5y f x= + − is the graph
of ( )y f x= but shifted left 3 units and
down 5 units. Thus, the point ( )1,3 becomes
the point ( )2, 2− − .
b. The graph of ( )2 2 1y f x= − − + is the
graph of ( )y f x= but shifted right 2 units, stretched vertically by a factor of 2, reflected about the x-axis, and shifted up 1 unit. Thus, the point ( )1,3 becomes the point ( )3, 5− .
c. The graph of ( )2 3y f x= + is the graph of
( )y f x= but shifted left 3 units and horizontally compressed by a factor of 2.

Chapter 1: Graphs and Functions
90 Copyright © 2016 Pearson Education, Inc.
Thus, the point ( )1,3 becomes the point
( )1,3− .
80. a. The graph of ( )1 3y g x= + − is the graph
of ( )y g x= but shifted left 1 unit and down
3 units. Thus, the point ( )3,5− becomes the
point ( )4, 2− .
b. The graph of ( )3 4 3y g x= − − + is the graph
of ( )y g x= but shifted right 4 units, stretched vertically by a factor of 3, reflected about the x-axis, and shifted up 3 units. Thus, the point ( )3,5− becomes the point ( )1, 12− .
c. The graph of ( )3 9y g x= + is the graph of
( )y f x= but shifted left 9 units and horizontally compressed by a factor of 3. Thus, the point ( )3,5− becomes the point
( )4,5− .
81. a. ( ) 3 3f x x= − − Using the graph of y x= , horizontally
shift to the right 3 units 3y x = − and
vertically shift downward 3 units 3 3y x = − − .
b. 121 (6)(3) 92
A bh=
= =
The area is 9 square units.
82. a. ( ) 2 4 4f x x= − − + Using the graph of y x= , horizontally shift to
the right 4 units 4y x = − , vertically stretch
by a factor of 2 and flip on the x-axis 2 4y x = − − , and vertically shift upward 4
units 2 4 4y x = − − + .
b. 121 (4)(4) 82
A bh=
= =
The area is 8 square units.
83. a. From the graph, the thermostat is set at 72 F° during the daytime hours. The thermostat appears to be set at 65 F° overnight.
b. To graph ( ) 2y T t= − , the graph of ( )T t is shifted down 2 units. This change will lower the temperature in the house by 2 degrees.
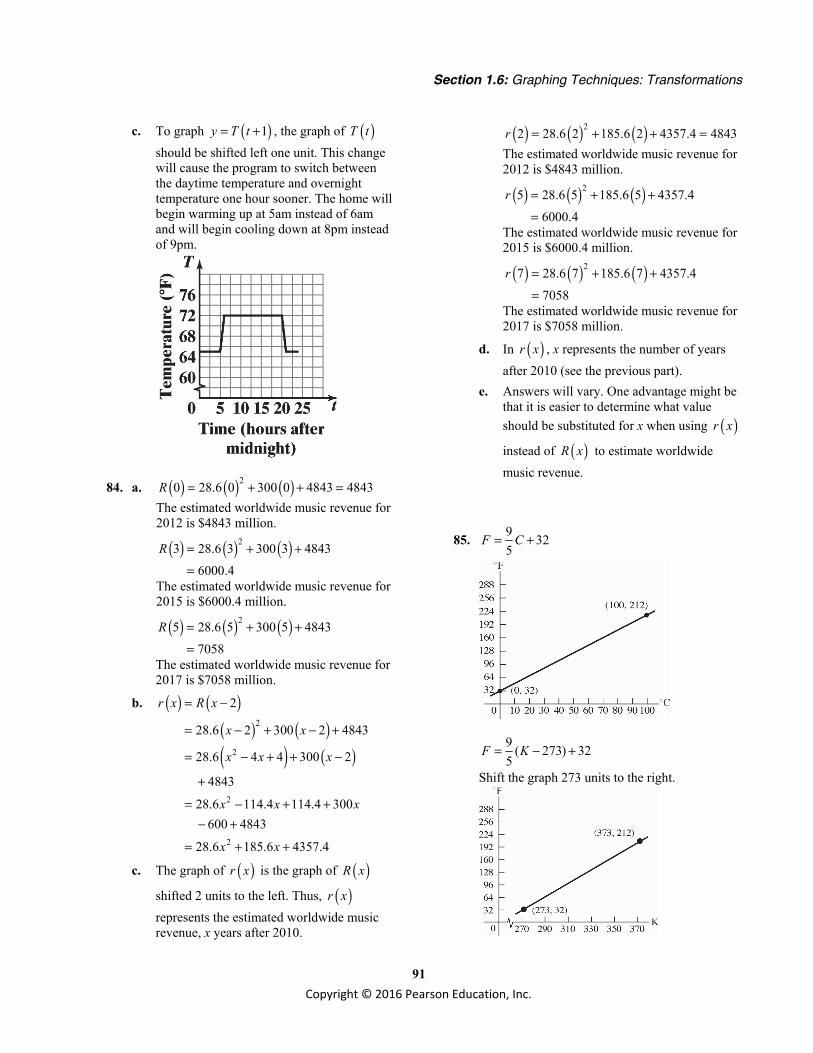
Section 1.6: Graphing Techniques: Transformations
91 Copyright © 2016 Pearson Education, Inc.
c. To graph ( )1y T t= + , the graph of ( )T t should be shifted left one unit. This change will cause the program to switch between the daytime temperature and overnight temperature one hour sooner. The home will begin warming up at 5am instead of 6am and will begin cooling down at 8pm instead of 9pm.
84. a. ( ) ( ) ( )20 28.6 0 300 0 4843 4843R = + + = The estimated worldwide music revenue for 2012 is $4843 million.
( ) ( ) ( )23 28.6 3 300 3 48436000.4
R = + +
=
The estimated worldwide music revenue for 2015 is $6000.4 million.
( ) ( ) ( )25 28.6 5 300 5 48437058
R = + +
=
The estimated worldwide music revenue for 2017 is $7058 million.
b. ( ) ( )( ) ( )( ) ( )
2
2
2
2
2
28.6 2 300 2 4843
28.6 4 4 300 2
4843
28.6 114.4 114.4 300 600 4843
28.6 185.6 4357.4
r x R x
x x
x x x
x x x
x x
= −
= − + − +
= − + + −
+
= − + +− +
= + +
c. The graph of ( )r x is the graph of ( )R x
shifted 2 units to the left. Thus, ( )r x represents the estimated worldwide music revenue, x years after 2010.
( ) ( ) ( )22 28.6 2 185.6 2 4357.4 4843r = + + = The estimated worldwide music revenue for 2012 is $4843 million.
( ) ( ) ( )25 28.6 5 185.6 5 4357.46000.4
r = + +
=
The estimated worldwide music revenue for 2015 is $6000.4 million.
( ) ( ) ( )27 28.6 7 185.6 7 4357.47058
r = + +
=
The estimated worldwide music revenue for 2017 is $7058 million.
d. In ( )r x , x represents the number of years after 2010 (see the previous part).
e. Answers will vary. One advantage might be that it is easier to determine what value should be substituted for x when using ( )r x
instead of ( )R x to estimate worldwide music revenue.
85. 9 325
F C= +
9 ( 273) 325
F K= − +
Shift the graph 273 units to the right.
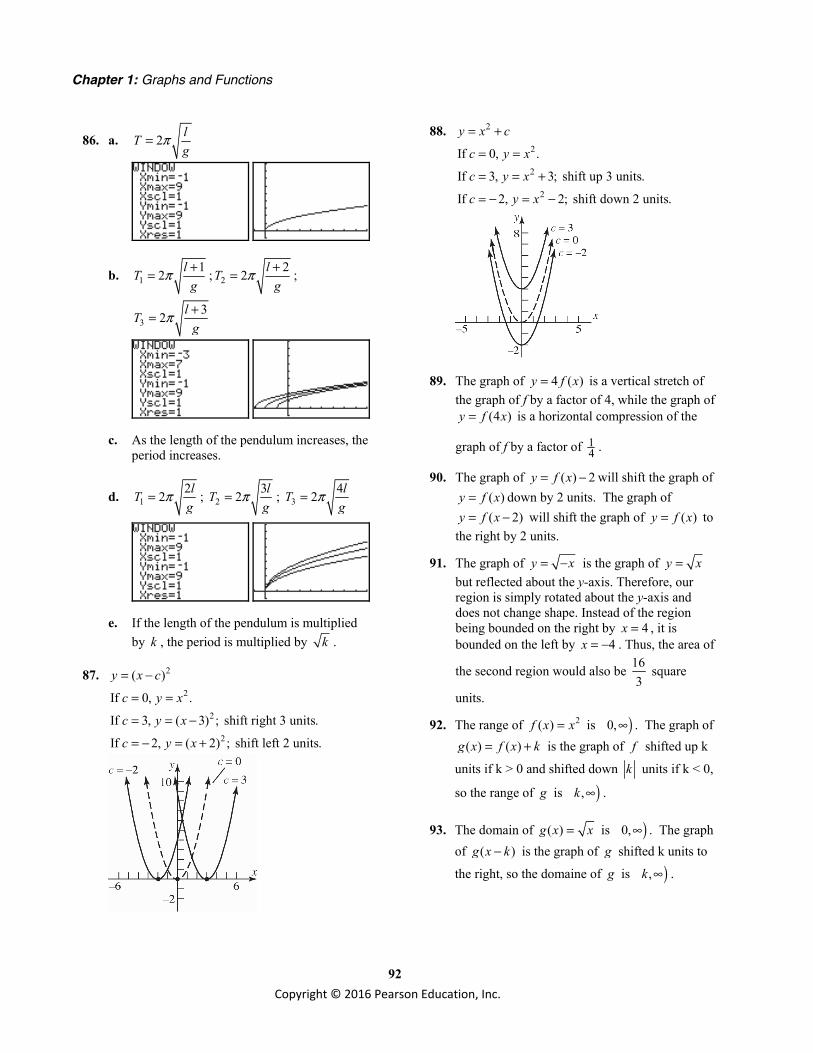
Chapter 1: Graphs and Functions
92 Copyright © 2016 Pearson Education, Inc.
86. a. 2 lTg
π=
b. 112 lT
gπ += ; 2
22 lTg
π += ;
332 lT
gπ +=
c. As the length of the pendulum increases, the period increases.
d. 122 lTg
π= ; 232 lTg
π= ; 342 lTg
π=
e. If the length of the pendulum is multiplied by k , the period is multiplied by k .
87. 2( )y x c= − 2
2
2
If 0, .
If 3, ( 3) ; shift right 3 units.
If 2, ( 2) ; shift left 2 units.
c y x
c y x
c y x
= =
= = −
= − = +
88. 2y x c= + 2
2
2
If 0, .
If 3, 3; shift up 3 units.
If 2, 2; shift down 2 units.
c y x
c y x
c y x
= =
= = +
= − = −
89. The graph of 4 ( )y f x= is a vertical stretch of the graph of f by a factor of 4, while the graph of
(4 )y f x= is a horizontal compression of the
graph of f by a factor of 14 .
90. The graph of ( ) 2y f x= − will shift the graph of ( )y f x= down by 2 units. The graph of ( 2)y f x= − will shift the graph of ( )y f x= to
the right by 2 units.
91. The graph of y x= − is the graph of y x= but reflected about the y-axis. Therefore, our region is simply rotated about the y-axis and does not change shape. Instead of the region being bounded on the right by 4x = , it is bounded on the left by 4x = − . Thus, the area of
the second region would also be 163
square
units.
92. The range of 2( )f x x= is )0,∞ . The graph of ( ) ( )g x f x k= + is the graph of f shifted up k
units if k > 0 and shifted down k units if k < 0,
so the range of g is ),k ∞ .
93. The domain of ( )g x x= is )0,∞ . The graph of ( )g x k− is the graph of g shifted k units to
the right, so the domaine of g is ),k ∞ .

Section 1.7: One-to-One Functions; Inverse Functions
93 Copyright © 2016 Pearson Education, Inc.
Section 1.7
1. The set of ordered pairs is a function because there are no ordered pairs with the same first element and different second elements.
2. { }1,0,5,8−
3. The function is not defined when 2 3 18 0x x+ − = . Solve: 2 3 18 0
( 6)( 3) 0x xx x
+ − =+ − =
6 or 3x x= − = The domain is { | 6, 3}x x x≠ − ≠ .
4. 3 83 8
838 1 8
3 3 3
x yy x
xy
x x
− = −− = − −
− −=−+
= = +
5. ( ) ( )1 2f x f x≠
6. one-to-one
7. 3
8. y x=
9. [ )4,∞
10. True
11. a
12. d
13. The function is one-to-one because there are no two distinct inputs that correspond to the same output.
14. The function is one-to-one because there are no two distinct inputs that correspond to the same output.
15. The function is not one-to-one because there are two different inputs, 20 Hours and 50 Hours, that correspond to the same output, $200.
16. The function is not one-to-one because there are two different inputs, John and Chuck, that correspond to the same output, Phoebe.
17. The function is not one-to-one because there are two distinct inputs, 2 and 3− , that correspond to the same output.
18. The function is one-to-one because there are no two distinct inputs that correspond to the same output.
19. The function is one-to-one because there are no two distinct inputs that correspond to the same output.
20. The function is one-to-one because there are no two distinct inputs that correspond to the same output.
21. The function f is one-to-one because every horizontal line intersects the graph at exactly one point.
22. The function f is one-to-one because every horizontal line intersects the graph at exactly one point.
23. The function f is not one-to-one because there are horizontal lines (for example, 1y = ) that intersect the graph at more than one point.
24. The function f is not one-to-one because there are horizontal lines (for example, 1y = ) that intersect the graph at more than one point.
25. The function f is one-to-one because every horizontal line intersects the graph at exactly one point.
26. The function f is not one-to-one because the horizontal line 2y = intersects the graph at more than one point.
27. To find the inverse, interchange the elements in the domain with the elements in the range:
Domain: {49.7, 43.8, 4.2, 61.9, 12.8} Range: {Atlanta, Boston, Las Vegas, Miami, Los
Angeles}

Chapter 1: Graphs and Functions
94 Copyright © 2016 Pearson Education, Inc.
28. To find the inverse, interchange the elements in the domain with the elements in the range:
Domain: {$761, $475, $659, $623, $535}
(in millions) Range: {Avatar, Titantic, Marvel’s The Avengers,
The Dark Knight, The Phantom Menace}
29. To find the inverse, interchange the elements in the domain with the elements in the range:
$7.09 $8.40$11.29
304045
Monthly Costof Life Insurance Age
Domain: {$10.59, $12.52, $15.94} Range: {30, 40, 45}
30. To find the inverse, interchange the elements in the domain with the elements in the range:
11%5.5%5.1%6.3%
VirginiaNevadaTennesseeTexas
Unemployment Rate State
Domain: {5.0%, 8.5%, 6.7%, 5.5%} Range: {Virginia, Nevada, Tennessee, Texas}
31. Interchange the entries in each ordered pair: {(5, 3), (9, 2), (2, 1), (11,0), ( 5,1)}− − − −
Domain: {5, 9, 2, 11, 5}−
Range: { 3, 2, 1, 0, 1}− − −
32. Interchange the entries in each ordered pair: {(2, 2), (6, 1), (8,0), ( 3,1), (9,2)}− − −
Domain: {2, 6, 8, 3, 9}−
Range: { 2, 1, 0, 1, 2}− −
33. Interchange the entries in each ordered pair: {(1, 2), (2, 3), (0, 10), (9,1), (4,2)}− − −
Domain: {1, 2, 0, 9, 4}
Range: { 2, 3, 10, 1, 2}− − −
34. Interchange the entries in each ordered pair: {( 8, 2), ( 1, 1), (0,0), (1,1), (8, 2)}− − − −
Domain: { 8, 1, 0, 1, 8}− −
Range: { 2, 1, 0, 1, 2}− −
35. 1( ) 3 4; ( ) ( 4)3
f x x g x x= + = −
( ) 1( ) ( 4)3
13 ( 4) 43
( 4) 4
f g x f x
x
xx
= − = − +
= − +=
( )( )
( ) (3 4)1 (3 4) 431 (3 )3
g f x g x
x
x x
= +
= + −
= =
Thus, f and g are inverses of each other.
36. 1( ) 3 2 ; ( ) ( 3)2
f x x g x x= − = − −
( ) 1( ) ( 3)2
13 2 ( 3)2
3 ( 3)
f g x f x
x
xx
= − −
= − − −
= + −=
( )
( )
( ) (3 2 )1 (3 2 ) 321 ( 2 )2
g f x g x
x
x
x
= −
= − − −
= − −
=
Thus, f and g are inverses of each other.

Section 1.7: One-to-One Functions; Inverse Functions
95 Copyright © 2016 Pearson Education, Inc.
37. ( ) 4 8; ( ) 24xf x x g x= − = +
( )( ) 24
4 2 848 8
xf g x f
x
xx
= + = + −
= + −=
( ) (4 8)( )4 8 2
42 2
g xg f xx
x
x
= −−= +
= − +
=
Thus, f and g are inverses of each other.
38. 1( ) 2 6; ( ) 32
f x x g x x= + = −
( ) 1( ) 3212 3 6 6 62
f g x f x
x x
x
= − = − + = − +
=
( ) ( )( ) 2 61 (2 6) 3 3 32
gg f x x
x x
x
= +
= + − = + −
=
Thus, f and g are inverses of each other.
39. 3 3( ) 8; ( ) 8f x x g x x= − = +
( ) ( )( )
3
33
( ) 8
8 8
8 8
f g x f x
x
xx
= +
= + −
= + −=
( ) 3
33
3 3
( ) ( 8)
( 8) 8
g f x g x
x
xx
= −
= − +
==
Thus, f and g are inverses of each other.
40. 2( ) ( 2) , 2; ( ) 2f x x x g x x= − ≥ = +
( ) ( )( )( )
2
2
( ) 2
2 2
f g x f x
x
x
x
= +
= + −
=
=
( ) ( )2
2
( ) ( 2)
( 2) 22 2
g f x g x
xxx
= −
= − += − +=
Thus, f and g are inverses of each other.
41. 1 1( ) ; ( )f x g xx x
= =
( ) 1 1( ) 11 1xf g x f x
xx
= = = ⋅ =
( ) 1 1( ) 11 1xg f x g x
xx
= = = ⋅ =
Thus, f and g are inverses of each other.
42. ( ) ; ( )f x x g x x= =
( ) ( )( )f g x f x x= =
( ) ( )( )g f x g x x= =
Thus, f and g are inverses of each other.
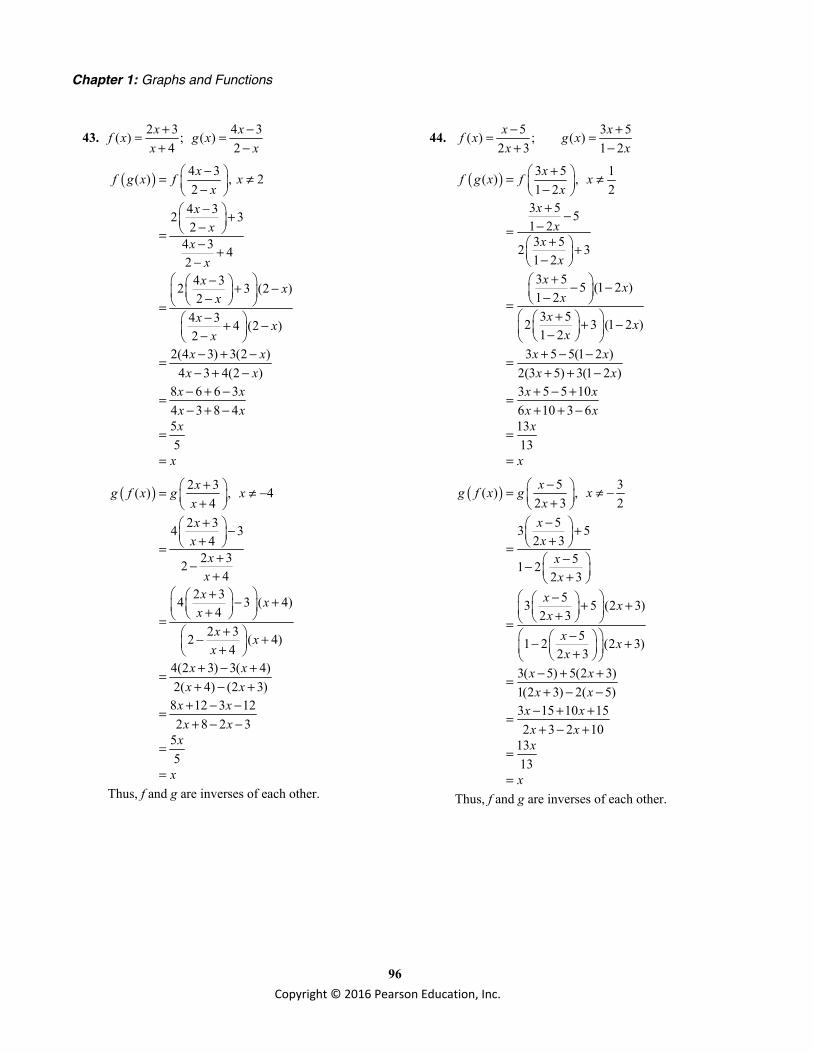
Chapter 1: Graphs and Functions
96 Copyright © 2016 Pearson Education, Inc.
43. 2 3 4 3( ) ; ( )4 2
x xf x g xx x
+ −= =+ −
( ) 4 3( ) , 22
4 32 32
4 3 42
4 32 3 (2 )2
4 3 4 (2 )2
2(4 3) 3(2 )4 3 4(2 )
8 6 6 34 3 8 455
xf g x f xx
xx
xx
x xx
x xx
x xx x
x xx xx
x
− = ≠ − − + − =
− +−
− + − − =− + − −
− + −=− + −
− + −=− + −
=
=
( ) 2 3( ) , 44
2 34 34
2 324
2 34 3 ( 4)4
2 32 ( 4)4
4(2 3) 3( 4)2( 4) (2 3)
8 12 3 122 8 2 3
55
xg f x g xxx
xx
xx x
xx x
xx x
x xx xx x
x
x
+ = ≠ − + + − + =
+−+
+ − + + =+ − + +
+ − +=+ − +
+ − −=+ − −
=
=
Thus, f and g are inverses of each other.
44. 5 3 5( ) ; ( )2 3 1 2x xf x g xx x− += =+ −
( ) 3 5 1( ) , 1 2 2
3 5 51 23 52 31 23 5 5 (1 2 )1 23 52 3 (1 2 )1 2
3 5 5(1 2 )2(3 5) 3(1 2 )3 5 5 106 10 3 61313
xf g x f xx
xx
xx
x xx
x xx
x xx x
x xx xx
x
+ = ≠ − + −
−=+ + − + − − − =
+ + − − + − −=+ + −
+ − +=+ + −
=
=
( ) 5 3( ) , 2 3 2
53 52 3
51 22 3
53 5 (2 3)2 3
51 2 (2 3)2 3
3( 5) 5(2 3)1(2 3) 2( 5)3 15 10 152 3 2 10
1313
xg f x g xx
xx
xx
x xx
x xx
x xx x
x xx xx
x
− = ≠ − + − + + =
− − + − + + + = − − + +
− + +=+ − −
− + +=+ − +
=
=
Thus, f and g are inverses of each other.

Section 1.7: One-to-One Functions; Inverse Functions
97 Copyright © 2016 Pearson Education, Inc.
45. Graphing the inverse:
46. Graphing the inverse:
47. Graphing the inverse:
48. Graphing the inverse:
49. Graphing the inverse:
50. Graphing the inverse: y x=
51. a.
1
( ) 333 Inverse
31( )3
f x xy xx y
xy
f x x−
===
=
=
Verifying: ( )1 1 1( ) 33 3
f f x f x x x− = = =
( )1 1 1( ) (3 ) (3 )3
f f x f x x x− −= = =
b. 1
1
domain of range of all real numbersrange of domain of all real numbers
f ff f
−
−
= == =

Chapter 1: Graphs and Functions
98 Copyright © 2016 Pearson Education, Inc.
52. a.
1
( ) 444 Inverse
41( )4
f x xy xx y
xy
f x x−
= −= −= −
=−
= −
Verifying:
( )1 1 1( ) 44 4
f f x f x x x− = − = − − =
( )1 1 1( ) ( 4 ) ( 4 )4
f f x f x x x− −= − = − − =
b. 1
1
domain of range of all real numbersrange of domain of all real numbers
f ff f
−
−
= == =
53. a.
1
( ) 4 24 24 2 Inverse
4 22
41
4 21( )
4 2
f x xy xx yy x
xy
xy
xf x−
= += += += −
−=
= −
= −
Verifying:
( )1 1 1( ) 4 24 2 4 22 2
x xf f x f
x x
− = − = − +
= − + =
( ) ( )1 1 4 2 1( ) 4 24 2
1 12 2
xf f x f x
x x
− − += + = −
= + − =
b. 1
1
domain of range of all real numbersrange of domain of all real numbers
f ff f
−
−
= == =
54. a.
1
( ) 1 31 31 3 Inverse
3 11
31( )
3
f x xy xx yy x
xy
xf x−
= −= −= −= −
−=
−=
Verifying:
( )1 1 1( ) 1 33 3
1 (1 )
x xf f x f
x x
− − − = = −
= − − =
( )1 1 1 (1 3 ) 3( ) (1 3 )3 3
x xf f x f x x− − − −= − = = =
b. 1
1
domain of range of all real numbersrange of domain of all real numbers
f ff f
−
−
= == =

Section 1.7: One-to-One Functions; Inverse Functions
99 Copyright © 2016 Pearson Education, Inc.
55. a. 3
3
3
3
3
1 3
( ) 111 Inverse
11
( ) 1
f x xy xx y
y xy x
f x x−
= −= −= −= += += +
Verifying:
( ) ( ) ( )31 3 3( ) 1 1 1
1 1
f f x f x x
x x
− = + = + −
= + − =
( ) ( ) ( )1 1 3 33
3 3
( ) 1 1 1f f x f x x
x x
− −= − = − +
= =
b. 1
1
domain of range of all real numbersrange of domain of all real numbers
f ff f
−
−
= == =
56. a. 3
3
3
3
3
1 3
( ) 111 Inverse
11
( ) 1
f x xy xx y
y xy x
f x x−
= += += += −= −= −
Verifying:
( ) ( ) ( )31 3 3( ) 1 1 1
1 1
f f x f x x
x x
− = − = − +
= − + =
( ) ( ) ( )1 1 3 33
3 3
( ) 1 1 1f f x f x x
x x
− −= + = + −
= =
b. 1
1
domain of range of all real numbersrange of domain of all real numbers
f ff f
−
−
= == =
57. a. 2
2
2
2
1
( ) 4, 04, 04, 0 Inverse
4, 44, 4
( ) 4, 4
f x x xy x xx y y
y x xy x x
f x x x−
= + ≥= + ≥= + ≥= − ≥= − ≥= − ≥
Verifying: ( ) ( )( )
1
2
( ) 4
4 4
4 4
f f x f x
x
x x
− = −
= − +
= − + =
( ) ( )( )
1 1 2
2
2
( ) 4
4 4
, 0
f f x f x
x
x xx x
− −= +
= + −
= == ≥
b. { }{ }
1
1
domain of range of | 0range of domain of | 4
f f x x
f f x x
−
−
= = ≥
= = ≥
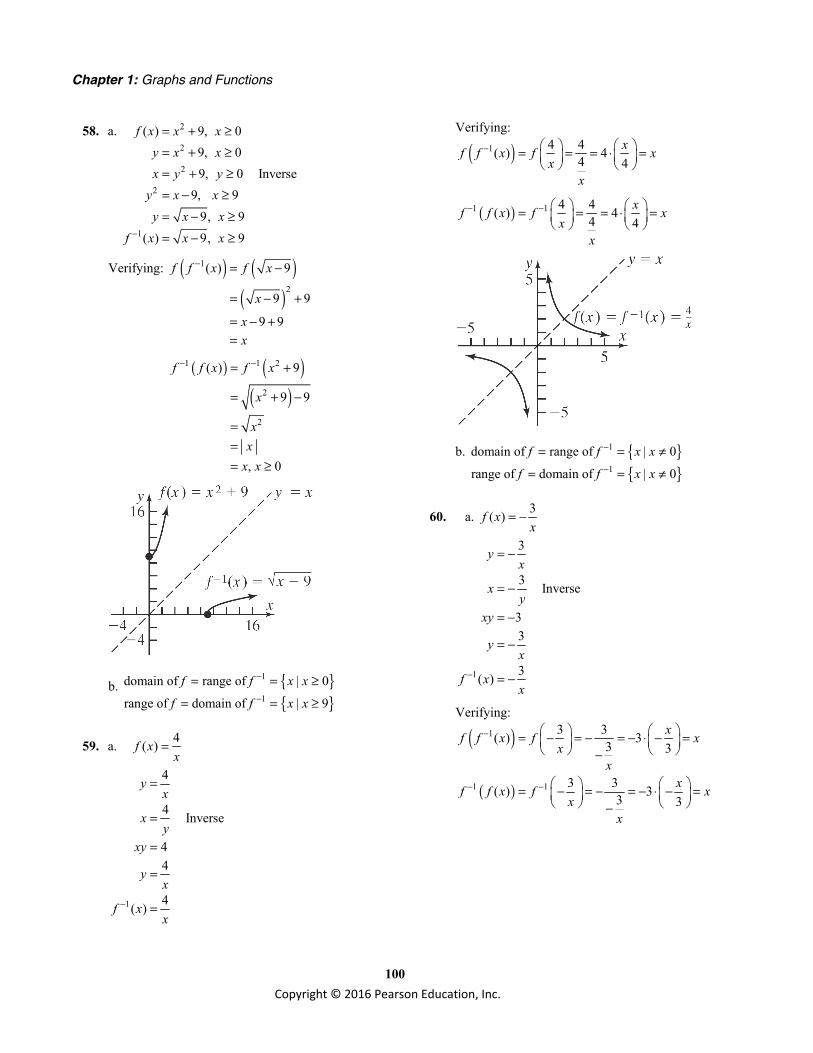
Chapter 1: Graphs and Functions
100 Copyright © 2016 Pearson Education, Inc.
58. a. 2
2
2
2
1
( ) 9, 09, 09, 0 Inverse
9, 99, 9
( ) 9, 9
f x x xy x xx y y
y x xy x x
f x x x−
= + ≥= + ≥= + ≥= − ≥= − ≥= − ≥
Verifying: ( ) ( )( )
1
2
( ) 9
9 9
9 9
f f x f x
x
xx
− = −
= − +
= − +=
( ) ( )( )
1 1 2
2
2
( ) 9
9 9
, 0
f f x f x
x
xx
x x
− −= +
= + −
=== ≥
b. { }{ }
1
1
domain of range of | 0
range of domain of | 9
f f x x
f f x x
−
−
= = ≥
= = ≥
59. a. 4( )f xx
=
1
4
4 Inverse
44
4( )
yx
xy
xy
yx
f xx
−
=
=
=
=
=
Verifying:
( )1 4 4( ) 44 4xf f x f x
xx
− = = = ⋅ =
( )1 1 4 4( ) 44 4xf f x f x
xx
− − = = = ⋅ =
b. { }{ }
1
1
domain of range of | 0
range of domain of | 0
f f x x
f f x x
−
−
= = ≠
= = ≠
60. a. 3( )f xx
= −
1
3
3 Inverse
33
3( )
yx
xy
xy
yx
f xx
−
= −
= −
= −
= −
= −
Verifying:
( )1 3 3( ) 33 3xf f x f x
xx
− = − = − = − ⋅ − = −
( )1 1 3 3( ) 33 3xf f x f x
xx
− − = − = − = − ⋅ − = −

Section 1.7: One-to-One Functions; Inverse Functions
101 Copyright © 2016 Pearson Education, Inc.
b. { }{ }
1
1
domain of range of | 0
range of domain of | 0
f f x x
f f x x
−
−
= = ≠
= = ≠
61. a. 1( )2
f xx
=−
1
12
1 Inverse2
2 12 12 1
2 1( )
yx
xy
xy xxy x
xyx
xf xx
−
=−
=−
− == +
+=
+=
Verifying:
( )1 2 1 1( ) 2 1 2
12 1 2 1 22
1
xf f x fxxx
x xx x xxx
x x
− + = = + −
⋅= =+ + − −
= =
( )1 1
12 11 2( ) 12
212 1 ( 2)
21 ( 2)
22 ( 2)
1 1
xf f x fx
x
xx
xxx x x
− −
+ − = = − −
+ − − = − −
+ −= = =
b. { }{ }
1
1
domain of range of | 2range of domain of | 0
f f x x
f f x x
−
−
= = ≠
= = ≠
62. a. 4( )2
f xx
=+
( )1 1
42
4 Inverse2
( 2) 42 4
4 24 2
4 2 4( ) or 2
yx
xy
x yxy x
xy xxy
xxf x f x
x x− −
=+
=+
+ =+ =
= −−=
−= = −
Verifying:
( )1 4 2 4( ) 4 2 2
4 4 4 4 2 4 2 2 42
xf f x fxx
xx x x x
x x xxx
− − = = − +
⋅= = = =− − + +
( )1 1
44 24 2( ) 42
244 2 ( 2)
2 4( 2) 2(4) 4 4( 2)
24 8 8 4
4 4
xf f x fx
x
xx x
xx
x x x
− −
− + = = + +
− + + + − = = + +
+ −= = =

Chapter 1: Graphs and Functions
102 Copyright © 2016 Pearson Education, Inc.
b. { }{ }
1
1
domain of range of | 2range of domain of | 0
f f x x
f f x x
−
−
= = ≠ −
= = ≠
63. a. 2( )3
f xx
=+
1
23
2 Inverse3
(3 ) 23 2
2 32 3
2 3( )
yx
xy
x yx xy
xy xxy
xxf x
x−
=+
=+
+ =+ =
= −−=
−=
Verifying:
( )1 2 3 2( ) 2 33
2 22 3 3 2 33
22
xf f x fxx
xx x
x x xxx
x x
− − = = − +
⋅= =− + − +
= =
( )1 1
22 32 3( ) 23
322 3 (3 )
32 (3 )
32(3 ) 3(2) 6 2 6
2 222
xf f x fx
x
xx
xx
x x
x x
− −
− + = = + +
− + + = + + + − + −= =
= =
b. { }{ }
1
1
domain of range of | 3
range of domain of | 0
f f x x
f f x x
−
−
= = ≠ −
= = ≠
64. a. 4( )2
f xx
=−
1
42
4 Inverse2
(2 ) 42 4
2 4
2 4
42
4( ) 2
yx
xy
x yx xy
xy x
xyx
yx
f xx
−
=−
=−
− =− =
= −
−=
= −
= −
Verifying:
( )1 4 4( ) 242 2
4 4 44 4 42 2
f f x fx
xx x
x x
− = − = − −
= = = ⋅ =− +
( )
( )
1 1 4 4( ) 242
222 4 2 2
42 2
f f x fx
xx x
x x
− − = = − − −
− = − = − −
= − + =
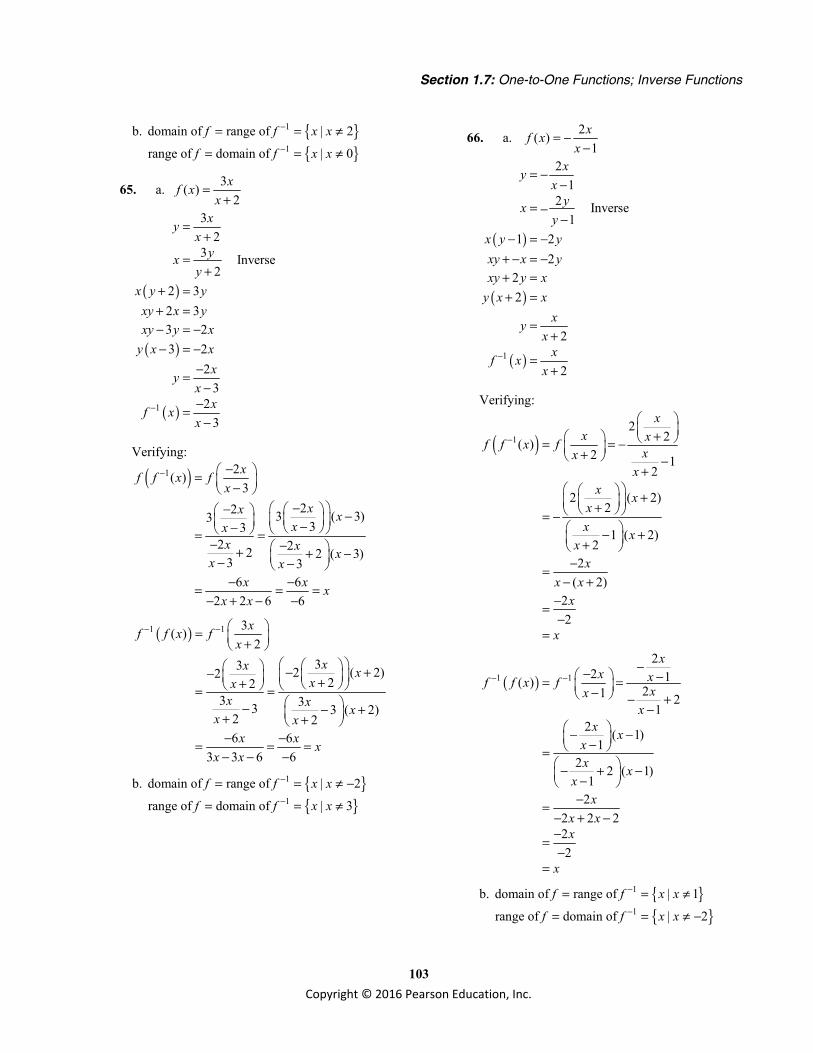
Section 1.7: One-to-One Functions; Inverse Functions
103 Copyright © 2016 Pearson Education, Inc.
b. { }{ }
1
1
domain of range of | 2
range of domain of | 0
f f x x
f f x x
−
−
= = ≠
= = ≠
65. a. 3( )2
xf xx
=+
( )
( )
( )1
32
3 Inverse2
2 32 33 23 2
23
23
xyx
yxy
x y yxy x yxy y x
y x xxy
xxf x
x−
=+
=+
+ =+ =− = −− = −
−=−
−=−
Verifying:
( )1 2( )3
22 3 ( 3)333
2 22 2 ( 3)3 3
6 62 2 6 6
xf f x fx
xx xxx
x x xx x
x x xx x
− − = − − − − −− = =
− − + + − − − − −= = =
− + − −
( )1 1 3( )2
33 2 ( 2)222
3 33 3 ( 2)2 26 6
3 3 6 6
xf f x fx
xx xxx
x x xx x
x x xx x
− − = + − +− ++ = = − − + + +
− −= = =− − −
b. { }{ }
1
1
domain of range of | 2
range of domain of | 3
f f x x
f f x x
−
−
= = ≠ −
= = ≠
66. a. 2( )1
xf xx
= −−
( )
( )
( )1
21
2 Inverse1
1 22
22
2
2
xyx
yxy
x y yxy x yxy y x
y x xxy
xxf x
x−
= −−
= −−
− = −+ − = −+ =+ =
=+
=+
Verifying:
( )12
2( )2 1
2
2 ( 2)2
1 ( 2)2
2( 2)
22
xx xf f x f
xxx
x xxx x
xx
x xx
x
−
+ = = − + −+
+ + = − − + + −=
− +−=−
=
( )1 1
22 1( ) 21 2
12 ( 1)
12 2 ( 1)
12
2 2 222
xx xf f x f
xxx
x xxx x
xx
x xx
x
− −−− −= = − − +
− − − − =
− + − − −=
− + −−=−
=
b. { }{ }
1
1
domain of range of | 1
range of domain of | 2
f f x x
f f x x
−
−
= = ≠
= = ≠ −
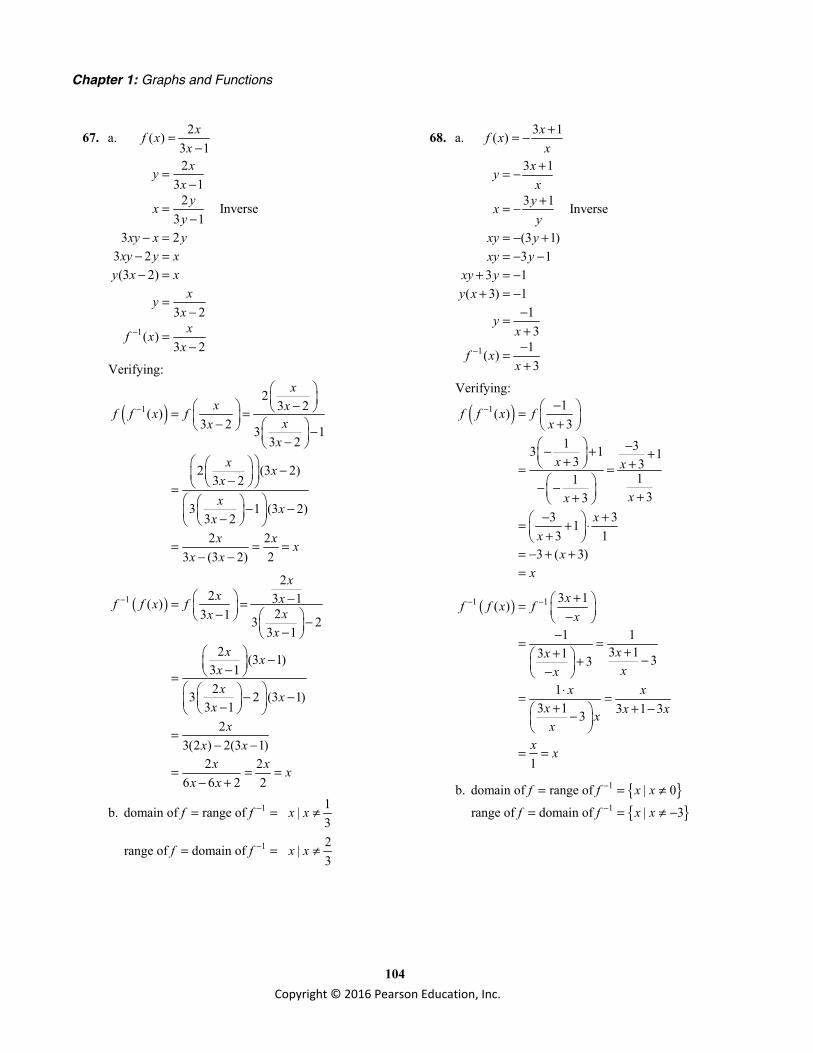
Chapter 1: Graphs and Functions
104 Copyright © 2016 Pearson Education, Inc.
67. a. 2( )3 1
xf xx
=−
1
23 1
2 Inverse3 1
3 23 2(3 2)
3 2
( )3 2
xyx
yxy
xy x yxy y x
y x xxy
xxf x
x−
=−
=−
− =− =− =
=−
=−
Verifying:
( )12
3 2( )3 2 3 1
3 2
2 (3 2)3 2
3 1 (3 2)3 22 2
3 (3 2) 2
xx xf f x f
xxx
x xxx x
xx x x
x x
−
− = = − − −
− − = − − −
= = =− −
( )1
22 3 1( )
23 1 3 23 1
2 (3 1)3 123 2 (3 1)
3 12
3(2 ) 2(3 1)2 2
6 6 2 2
xx xf f x f
xxx
x xxx x
xx
x xx x x
x x
− −= = − − − − − =
− − −
=− −
= = =− +
b. 1
1
1domain of range of |32range of domain of |3
f f x x
f f x x
−
−
= = ≠ = = ≠
68. a. 3 1( ) xf xx+= −
1
3 1
3 1 Inverse
(3 1)3 1
3 1( 3) 1
13
1( )3
xyx
yxy
xy yxy y
xy yy x
yx
f xx
−
+= −
+= −
= − += − −
+ = −+ = −
−=+−=+
Verifying:
( )1 1( )31 33 1 13 3
1133
3 313 1
3 ( 3)
f f x fx
x x
xxx
xx
x
− − = + −− + + + += = − − ++
− + = + ⋅ + = − + +=
( )1 1 3 1( )
1 13 13 1 33
13 1 3 1 33
1
xf f x fx
xxxx
x xx x xxx
x x
− − + = − −= =
++ −+ − ⋅= =
+ + − −
= =
b. { }{ }
1
1
domain of range of | 0
range of domain of | 3
f f x x
f f x x
−
−
= = ≠
= = ≠ −
Section 1.7: One-to-One Functions; Inverse Functions
105 Copyright © 2016 Pearson Education, Inc.
69. a. 3 4( )2 3xf xx
+=−
1
3 42 33 4 Inverse2 3
(2 3) 3 42 3 3 42 3 3 4(2 3) 3 4
3 42 33 4( )2 3
xyxyxy
x y yxy x yxy y x
y x xxyxxf xx
−
+=−+=−
− = +− = +− = +− = +
+=−+=−
Verifying:
( )1
3 43 43 4 2 3( )
3 42 3 2 32 3
3 43 4 (2 3)2 33 42 3 (2 3)2 3
3(3 4) 4(2 3)2(3 4) 3(2 3)9 12 8 12 176 8 6 9 17
xx xf f x f
xxx
x xxx xx
x xx x
x x x xx x
−
+ + + − = = +− − − + + − − = + − − −
+ + −=+ − −
+ + −= = =+ − +
( )1 1
3 43 43 4 2 3( )
3 42 3 2 32 3
3 43 4 (2 3)2 33 42 3 (2 3)2 3
3(3 4) 4(2 3)2(3 4) 3(2 3)9 12 8 12 176 8 6 9 17
xx xf f x f
xxx
x xxx xx
x xx x
x x x xx x
− −
+ + + − = = +− − − + + − − = + − − −
+ + −=+ − −
+ + −= = =+ − +
b. 1
1
3domain of range of |23range of domain of |2
f f x x
f f x x
−
−
= = ≠ = = ≠
70. a. 2 3( )4
xf xx
−=+
1
2 34
2 3 Inverse4
( 4) 2 34 2 32 4 3
( 2) (4 3)(4 3) 4 3
2 24 3( )2
xyxyx
yx y yxy x yxy y xy x x
x xyx x
xf xx
−
−=+−=
++ = −+ = −− = − −− = − +
− + += =− −
+=−
Verifying:
( )1
4 32 34 3 2( ) 4 32 4
22(4 3) 3(2 )
4 3 4(2 )8 6 6 34 3 8 41111
xx xf f x f
xxx
x xx x
x xx xx
x
−
+ − + − = = +− +−
+ − −=+ + −
+ − +=+ + −
=
=
( )
( ) ( )( ) ( )
1 1 2 3( )4
2 34 34
2 324
4 2 3 3 42 4 2 3
8 12 3 122 8 2 3
1111
xf f x fx
xx
xx
x xx x
x xx xx
x
− − − = + − + + =
−−+
− + +=
+ − −− + +=+ − +
=
=
b. { }{ }
1
1
domain of range of | 4range of domain of | 2
f f x x
f f x x
−
−
= = ≠ −
= = ≠

Chapter 1: Graphs and Functions
106 Copyright © 2016 Pearson Education, Inc.
71. a. 2 3( )2
xf xx
+=+
1
2 32
2 3 Inverse2
2 2 32 2 3
( 2) 2 32 3
22 3( )
2
xyxyx
yxy x yxy y xy x x
xyx
xf xx
−
+=++=
++ = +− = − +− = − +
− +=−
− +=−
Verifying:
( )1
2 32 32 3 2( ) 2 32 2
22 32 3 ( 2)
22 3 2 ( 2)
22( 2 3) 3( 2)
2 3 2( 2)4 6 3 62 3 2 4 1
xx xf f x f
xxx
x xxx x
xx x
x xx x x xx x
−
− + + − + − = = − +− +−
− + + − − =− + + − −
− + + −=− + + −
− + + − −= = =− + + − −
( )1 1
2 32 32 3 2( ) 2 32 2
22 32 3 ( 2)
22 3 2 ( 2)
22(2 3) 3( 2)2 3 2( 2)
4 6 3 62 3 2 4 1
xx xf f x f
xxx
x xx
x xxx x
x xx x x x
x x
− −
+ − + + + = = ++ −+
+ − + + + =+ − + +
− + + +=+ − +
− − + + −= = =+ − − −
b. { }{ }
1
1
domain of range of | 2
range of domain of | 2
f f x x
f f x x
−
−
= = ≠ −
= = ≠
72. a. 3 4( )2
xf xx
− −=−
1
3 42
3 4 Inverse2
( 2) 3 42 3 43 2 4
( 3) 2 42 4
32 4( )
3
xyx
yxy
x y yxy x yxy y xy x x
xyxxf xx
−
− −=−
− −=−
− = − −− = − −+ = −+ = −
−=+−=+
Verifying:
( )1 2 4( )3
2 43 43
2 4 23
3(2 4) 4( 3)2 4 2( 3)6 12 4 122 4 2 61010
xf f x fx
xx
xxx x
x xx xx xx
x
− − = + − − − + =
− −+
− − − +=− − +
− + − −=− − −
−=−
=
( )1 1 3 4( )2
3 42 42
3 4 32
2( 3 4) 4( 2)3 4 3( 2)
6 8 4 83 4 3 61010
xf f x fx
xxx
xx xx x
x xx xx
x
− − − − = − − − − − =
− − +−
− − − −=− − + −
− − − +=− − + −−=−
=
b. { }{ }
1
1
domain of range of | 2range of domain of | 3
f f x x
f f x x
−
−
= = ≠
= = ≠ −
Section 1.7: One-to-One Functions; Inverse Functions
107 Copyright © 2016 Pearson Education, Inc.
73. a. 2
24( ) , 0
2xf x x
x−= >
( )
( )
( )
2
2
2
2
2 2
2 2
2
2
2
1
4 , 02
4 , 0 Inverse2
12 4, 212 4, 212 1 4, 211 2 4, 2
4 1, 1 2 2
4 1, 1 2 2
2 1, 21 2
2 , 1 2
xy xx
yx yy
xy y x
xy y x
y x x
y x x
y xx
y xx
y xx
f x xx
−
−= >
−= >
= − <
− = − <
− = − <
− = <
= <−
= <−
= <−
=−
12
<
Verifying:
( )
2
12
2 42 1 2( )
1 2 221 2
44 4 (1 2 )4 1 21 24 42 2 (1 2 )
1 2 1 24 4(1 2 ) 4 4 8 8
2(4) 8 8
xf f x fx
x
xxx
xx x
x x x x
−
− − = = − −
− −− − −= = − − − − − − += = = =
( )2
1 12 2
2
2
22
2
4 2( )2 41 2
22 2
44 1 11
2 2 | |22 24| |
, 0
xf f x fx x
x
xxx
x
xxx x x
− − −= = −−
= =− − +−
= = = ⋅
= = >
b. { }1
1
domain of range of | 01range of domain of |2
f f x x
f f x x
−
−
= = >
= = <
74. a. 2
23( ) , 0
3xf x x
x+= >
( )
( )
2
2
2
2
2 2
2 2
2
2
1
3 , 03
3 , 0 Inverse3
13 3, 313 3, 313 1 3, 3
3 1, 3 1 3
3 1, 3 1 3
3 1, 3 1 3
xy xx
yx yy
xy y x
xy y x
y x x
y xx
y xx
f x xx
−
+= >
+= >
= + >
− = >
− = >
= >−
= >−
= >−

Chapter 1: Graphs and Functions
108 Copyright © 2016 Pearson Education, Inc.
Verifying:
( )
2
12
3 33 13( )
3 1 333 1
33 3 (3 1)3 3 13 13 33 3 (3 1)
3 1 3 13 3(3 1)
3(3)3 9 3
999
xf f x f
x
x
xxx
xx x
x
x
x
x
−
+ − = = −
− + −+ − −= =
− − − + −=
+ −=
=
=
( )
( )
21 1
2 2
2
2
22
22
2
3 3( )3 33 1
3
3 333 1 11
3 33 3
, 0
xf f x fx x
x
xxx
x x
xx x x
− − += = + −
= =+ + −−
= = =
= = >
b. { }1
1
domain of range of | 01range of domain of |3
f f x x
f f x x
−
−
= = >
= = >
75. a. Because the ordered pair ( 1,0)− is on the graph, ( 1) 0f − = .
b. Because the ordered pair (1,2) is on the graph, (1) 2f = .
c. Because the ordered pair (0,1) is on the
graph, 1(1) 0f − = .
d. Because the ordered pair (1,2) is on the
graph, 1(2) 1f − = .
76. a. Because the ordered pair 12,2
is on the
graph, 1(2)2
f = .
b. Because the ordered pair (1,0) is on the graph, (1) 0f = .
c. Because the ordered pair (1,0) is on the
graph, 1(0) 1f − = .
d. Because the ordered pair (0, 1)− is on the
graph, 1( 1) 0f − − = .
77. Since ( )7 13f = , we have ( )1 13 7f − = ; the input of the function is the output of the inverse when the output of the function is the input of the inverse.
78. Since ( )5 3g − = , we have ( )1 3 5g− = − ; the input of the function is the output of the inverse when the output of the function is the input of the inverse.
79. Since the domain of a function is the range of the inverse, and the range of the function is the domain of the inverse, we get the following for 1f − : Domain: [ )2,− ∞ Range: [ )5,∞
80. Since the domain of a function is the range of the inverse, and the range of the function is the domain of the inverse, we get the following for 1f − : Domain: [ )5,∞ Range: [ )0,∞
81. Since the domain of a function is the range of the inverse, and the range of the function is the domain of the inverse, we get the following for 1g− : Domain: [ )0,∞ Range: ( ],0−∞
82. Since the domain of a function is the range of the inverse, and the range of the function is the domain of the inverse, we get the following for 1g− : Domain: ( )0,8 Range: [ ]0,15
83. Since ( )f x is increasing on the interval ( )0,5 , it is one-to-one on the interval and has an inverse,
( )1f x− . In addition, we can say that ( )1f x− is
increasing on the interval ( ) ( )( )0 , 5f f .
Section 1.7: One-to-One Functions; Inverse Functions
109 Copyright © 2016 Pearson Education, Inc.
84. Since ( )f x is decreasing on the interval ( )0,5 , it is one-to-one on the interval and has an inverse,
( )1f x− . In addition, we can say that ( )1f x− is
decreasing on the interval ( )(5), (0)f f .
85.
( )
( )1
( ) , 0
Inverse
1
1( ) , 0
f x mx b my mx bx my b
x b my
y x bm
f x x b mm
−
= + ≠= += +
− =
= −
= − ≠
86. 2 2
2 2
2 2
2 2 2
2 2 2
2 2
1 2 2
( ) , 0
Inverse
( ) , 0
f x r x x r
y r x
x r y
x r yy r x
y r x
f x r x x r−
= − ≤ ≤
= −
= −
= −= −
= −
= − ≤ ≤
87. If ( ),a b is on the graph of f, then ( ),b a is on the
graph of 1f − . Since the graph of 1f − lies in quadrant I, both coordinates of ( , )a b are positive, which means that both coordinates of ( , )b a are positive. Thus, the graph of 1f − must lie in quadrant I.
88. If ( ),a b is on the graph of f, then ( ),b a is on the
graph of 1f − . Since the graph of f lies in quadrant II, a must be negative and b must be positive. Thus, ( , )b a must be a point in
quadrant IV, which means the graph of 1f − lies in quadrant IV.
89. Answers may vary. One possibility follows: ( ) , 0f x x x= ≥ is one-to-one.
Thus,
1
( ) , 0, 0
( ) , 0
f x x xy x x
f x x x−
= ≥= ≥= ≥
90. Answers may vary. One possibility follows: 4( ) , 0f x x x= ≥ is one-to-one.
Thus, 4
4
4
4
1 4
( ) , 0, 0
Inverse, 0
( ) , 0
f x x xy x xx yy x x
f x x x−
= ≥= ≥== ≥= ≥
91. a. 6.97 90.3990.39 6.9790.39
6.97
d rd rd r
= −+ =+ =
Therefore, we would write
( ) 90.396.97
dr d +=
b. ( )( ) ( )6.97 90.39 90.396.97
6.97 90.39 90.39 6.976.97 6.97
rr d r
r r
r
− +=
+ −= =
=
( )( ) 90.396.97 90.396.97
90.39 90.39
dd r d
dd
+ = −
= + −=
c. ( ) 300 90.39300 56.016.97
r += ≈
If the distance required to stop was 300 feet, the speed of the car was roughly 56 miles per hour.
92. a. ( ) 2.15 10.532.15 10.53
10.53 2.1510.53
2.15
H C CH C
H CH C
= −= −
+ =+ =
( ) 10.532.15
HC H +=
b. ( )( ) 10.532.15 10.532.15
10.53 10.53
HH C H
HH
+ = −
= + −=

Chapter 1: Graphs and Functions
110 Copyright © 2016 Pearson Education, Inc.
( )( ) ( )2.15 10.53 10.532.15
2.15 10.53 10.532.15
2.152.15
CC H C
C
C C
− +=
− +=
= =
c. ( ) 26 10.5326 16.992.15
C += ≈
The head circumference of a child who is 26 inches tall is about 17 inches.
93. a. 6 feet = 72 inches ( ) ( )
( )72 50 2.3 72 60
50 2.3 12 50 27.6 77.6W = + −
= + = + =
The ideal weight of a 6-foot male is 77.6 kilograms.
b. ( )50 2.3 6050 2.3 13888 2.388
2.3
W hW hW hW h
= + −− = −+ =+ =
Therefore, we would write
( ) 882.3
Wh W +=
c. ( )( ) ( )( )50 2.3 60 882.3
50 2.3 138 88 2.32.3 2.3
hh W h
h h h
+ − +=
+ − += = =
( )( ) 8850 2.3 602.3
50 88 138
WW h W
W W
+ = + −
= + + − =
d. ( ) 80 88 16880 73.042.3 2.3
h += = ≈
The height of a male who is at his ideal weight of 80 kg is roughly 73 inches.
94. a.
( )
9 3259325
5 329
F C
F C
F C
= +
− =
− =
Therefore, we would write
( ) ( )5 329
C F F= −
b. ( )( ) 5 9 32 329 55 99 5
C F C C
C C
= + −
= ⋅ =
( )( ) ( )9 5 32 325 9
32 32
F C F F
F F
= − +
= − + =
c. ( ) ( ) ( )5 570 70 32 38 21.1 C9 9
C = − = ≈ °
95. a. From the restriction given in the problem statement, the domain is { }| 36,900 89,350g g≤ ≤ or [ ]36900,89350 .
b. ( ) ( )36,900 5081.25 0.25 36,900 36,9005081.25
T = + −=
( ) ( )89,350 5081.25 0.25 89,350 36,90018,193.75
T = + −=
Since T is linear and increasing, we have that the range is { }| 5081.25 18,193.75T T≤ ≤ or
[ ]5081.25,18193.75 .
c. ( )( )
5081.25 0.25 36,9005081.25 0.25 36,9005081.25 36,9000.255081.25 36,9000.25
T gT gT g
T g
= + −− = −−
= −
−+ =
Therefore, we would write
( ) 5081.25 36,9000.25
Tg T −= +
Domain: { }| 5081.25 18,193.75T T≤ ≤
Range: { }| 36,900 89,350g g≤ ≤
96. a. From the restriction given in the problem statement, the domain is { }|18,150 73,800g g≤ ≤ or [ ]18150,73800 .
b. ( ) ( )18,150 1815 0.15 18,150 18,1501815
T = + −=
( ) ( )73,800 1815 0.15 73,800 18,15010162.50
T = + −=
Since T is linear and increasing, we have that the range is { }|1815 10,162.50T T≤ ≤
or [ ]1815, 10162.50 .
Section 1.7: One-to-One Functions; Inverse Functions
111 Copyright © 2016 Pearson Education, Inc.
c. ( )( )
1815 0.15 18,1501815 0.15 18,1501815 18,150
0.151815 18,150
0.15
T gT gT g
T g
= + −− = −−
= −
−+ =
We would write ( ) 1815 18,1500.15
Tg T −= + .
Domain: { }|1815 10162.50T T≤ ≤
Range: { }|18,150 73,800g g≤ ≤
97. a. The graph of H is symmetric about the y-axis. Since t represents the number of seconds after the rock begins to fall, we know that 0t ≥ . The graph is strictly decreasing over its domain, so it is one-to-one.
b. 2
2
2
2
100 4.94.9 1004.9 100
1004.9
1004.9
H tH t
t HHt
Ht
= −+ =
= −−=
−=
Therefore, we would write ( ) 1004.9
Ht H −= .
(Note: we only need the principal square root since we know 0t ≥ )
( )( )2
100100 4.94.9
100100 4.94.9
100 100
HH t H
H
HH
−= −
− = −
= − +=
( )( ) ( )2
22
100 100 4.9
4.9
4.9 (since 0)4.9
tt H t
t t t t
− −=
= = = ≥
c. ( ) 100 8080 2.024.9
t −= ≈
It will take the rock about 2.02 seconds to fall 80 meters.
98. a. ( ) 232.2
lT l = π
2
2
2
2
22
2
232.2
2 32.2
32.2432.2
48.05( ) 8.05 , 0
lT
T l
T l
Tl
T Tl T Tπ
= π
=π
=π
=π
= = > π
b. ( )233 8.05 7.34l
π = ≈
A pendulum whose period is 3 seconds will be about 7.34 feet long.
99. ( ) ax bf xcx d
+=+
1
Inverse
( )
( )
( )
ax bycx day bxcy d
x cy d ay bcxy dx ay bcxy ay b dx
y cx a b dxb dxycx a
dx bf xcx a
−
+=++=+
+ = ++ = +− = −− = −
−=−
− +=−
Now, 1f f −= provided that ax b dx bcx d cx a
+ − +=+ −
.
This is only true if a d= − .
100. Yes. In order for a one-to-one function and its inverse to be equal, its graph must be symmetric about the line y x= . One such example is the
function ( ) 1f xx
= .
101. Answers will vary.
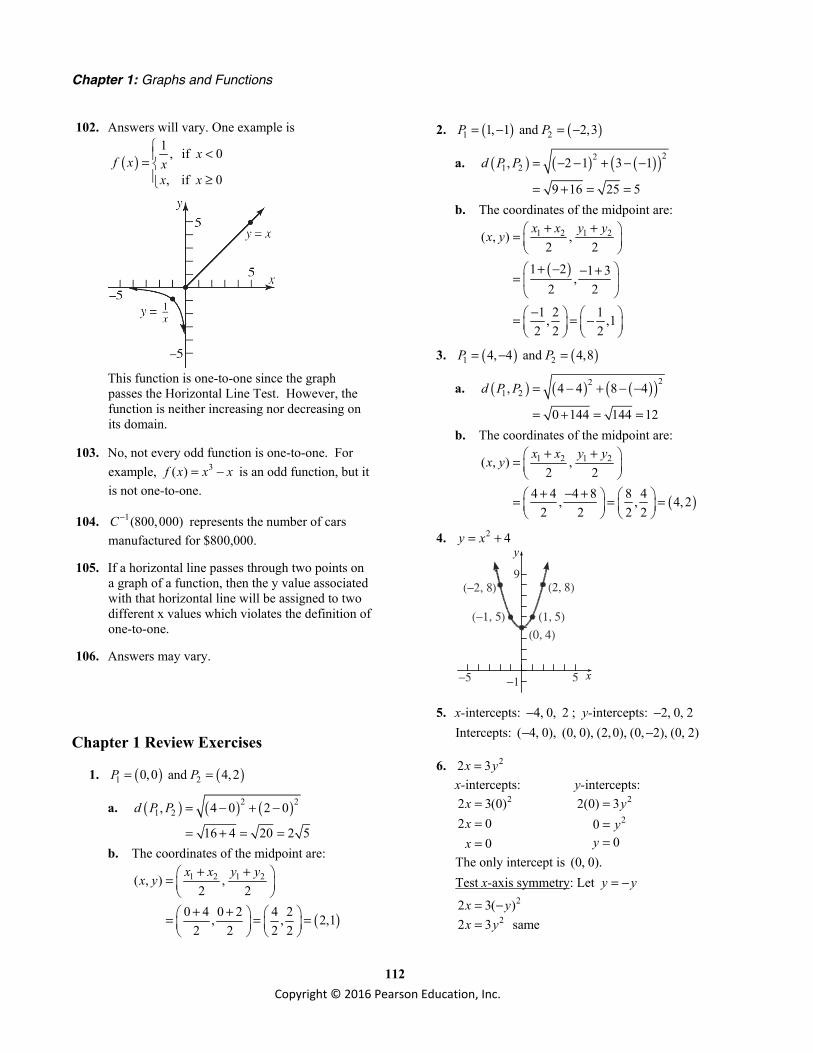
Chapter 1: Graphs and Functions
112 Copyright © 2016 Pearson Education, Inc.
102. Answers will vary. One example is
( )1 , if 0
, if 0
xf x xx x
<= ≥
This function is one-to-one since the graph
passes the Horizontal Line Test. However, the function is neither increasing nor decreasing on its domain.
103. No, not every odd function is one-to-one. For example, 3( )f x x x= − is an odd function, but it is not one-to-one.
104. 1(800,000)C− represents the number of cars manufactured for $800,000.
105. If a horizontal line passes through two points on a graph of a function, then the y value associated with that horizontal line will be assigned to two different x values which violates the definition of one-to-one.
106. Answers may vary.
Chapter 1 Review Exercises
1. ( ) ( )1 20,0 and 4,2P P= =
a. ( ) ( ) ( )2 21 2, 4 0 2 0
16 4 20 2 5
d P P = − + −
= + = =
b. The coordinates of the midpoint are:
( )
1 2 1 2( , ) ,2 2
0 4 0 2 4 2, , 2,12 2 2 2
x x y yx y + + =
+ + = = =
2. ( ) ( )1 21, 1 and 2,3P P= − = −
a. ( ) ( ) ( )( )221 2, 2 1 3 1
9 16 25 5
d P P = − − + − −
= + = =
b. The coordinates of the midpoint are:
( )
1 2 1 2( , ) ,2 2
1 2 1 3,2 2
1 2 1, ,12 2 2
x x y yx y + + =
+ − − +=
− = = −
3. ( ) ( )1 24, 4 and 4,8P P= − =
a. ( ) ( ) ( )( )221 2, 4 4 8 4
0 144 144 12
d P P = − + − −
= + = =
b. The coordinates of the midpoint are:
( )
1 2 1 2( , ) ,2 2
4 4 4 8 8 4, , 4, 22 2 2 2
x x y yx y + + =
+ − + = = =
4. 2 4y x= + y
x−5 5
9
−1
(0, 4)(1, 5)
(2, 8)
(−1, 5)
(−2, 8)
5. x-intercepts: 4, 0, 2− ; y-intercepts: 2, 0, 2− Intercepts: ( 4, 0), (0, 0), (2,0), (0, 2), (0, 2)− −
6. 22 3x y= x-intercepts: y-intercepts:
22 3(0)2 0
0
xxx
===
2
22(0) 3
00
yy
y
===
The only intercept is (0, 0). Test x-axis symmetry: Let y y= −
2
22 3( )2 3 same
x yx y
= −=

Chapter 1 Review Exercises
113 Copyright © 2016 Pearson Education, Inc.
Test y-axis symmetry: Let x x= − 2
2
2( ) 3
2 3 different
x y
x y
− =
− =
Test origin symmetry: Let x x= − and y y= − . 2
22( ) 3( )
2 3 differentx yx y
− = −− =
Therefore, the graph will have x-axis symmetry.
7. 2 2+4 =16x y
x-intercepts: y-intercepts: ( )22
2
+4 0 =16
164
x
xx
== ±
( )2 2
2
2
0 +4 =16
4 16
42
y
y
yy
=
== ±
The intercepts are ( 4,0), (4,0), (0, 2),− − and (0, 2).
Test x-axis symmetry: Let y y= −
( )22
2 24 =16
4 =16 samex y
x y+ −
+
Test y-axis symmetry: Let x x= −
( )2 2
2 2
4 =16
4 =16 same
x y
x y
− +
+
Test origin symmetry: Let x x= − and y y= − .
( ) ( )2 2
2 24 =16
+4 =16 samex y
x y− + −
Therefore, the graph will have x-axis, y-axis, and origin symmetry.
8. 4 2+2 +1y x x=
x-intercepts: y-intercepts:
( ) ( )4 2
2 2
2
2
0 +2 +10 1 1
1 01
x xx x
xx
== + +
+ == −
4 2(0) +2(0) +11
y ==
no real solutions The only intercept is (0, 1).
Test x-axis symmetry: Let y y= − 4 2
4 22 1
2 1 differenty x xy x x
− = + += − − −
Test y-axis symmetry: Let x x= −
( ) ( )4 2
4 2
2 1
2 1 same
y x x
y x x
= − + − +
= + +
Test origin symmetry: Let x x= − and y y= − .
( ) ( )4 2
4 2
4 2
2 12 1
2 1 different
y x xy x xy x x
− = − + − +− = + +
= − − −
Therefore, the graph will have y-axis symmetry.
9. 3y x x= −
x-intercepts: y-intercepts:
( )( )( )
3
200 1
0 1 1
x xx x
x x x
= −= −
= + −
3(0) 00
y = −=
0, 1, 1x x x= = − = The intercepts are ( 1, 0),− (0, 0), and (1, 0).
Test x-axis symmetry: Let y y= − 3
3 differenty x xy x x
− = −= − +
Test y-axis symmetry: Let x x= − 3
3
( ) ( )
different
y x x
y x x
= − − −
= − +
Test origin symmetry: Let x x= − and y y= − . 3
3
3
( ) ( )
same
y x xy x xy x x
− = − − −− = − +
= −
Therefore, the graph will have origin symmetry.
10. 2 2 2 0x x y y+ + + =
x-intercepts: 2 2
2(0) 2(0) 0
0( 1) 0
x xx x
x x
+ + + =+ =+ =
0, 1x x= = −
y-intercepts: 2 2
2(0) 0 2 0
2 0( 2) 0
y yy yy y
+ + + =+ =+ =
0, 2y y= = − The intercepts are ( 1, 0),− (0, 0), and (0, 2).−
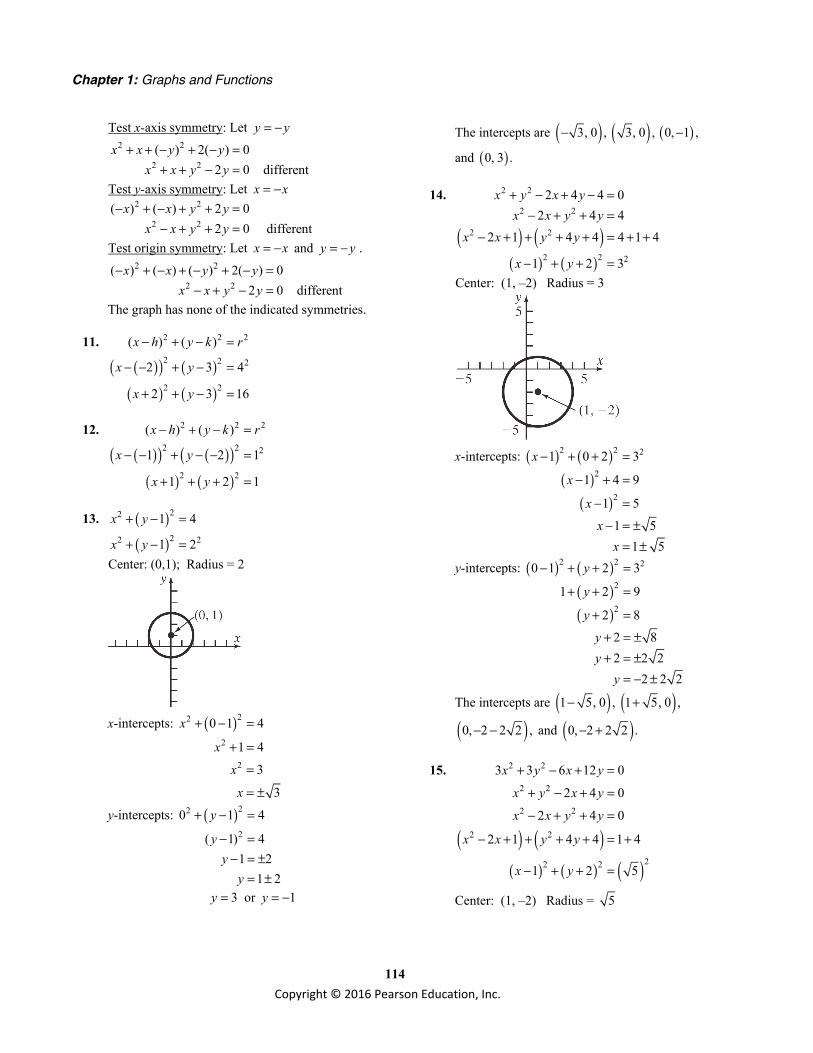
Chapter 1: Graphs and Functions
114 Copyright © 2016 Pearson Education, Inc.
Test x-axis symmetry: Let y y= − 2 2
2 2( ) 2( ) 0
2 0 differentx x y y
x x y y+ + − + − =
+ + − =
Test y-axis symmetry: Let x x= − 2 2
2 2( ) ( ) 2 0
2 0 differentx x y y
x x y y− + − + + =
− + + =
Test origin symmetry: Let x x= − and y y= − . 2 2
2 2( ) ( ) ( ) 2( ) 0
2 0 differentx x y y
x x y y− + − + − + − =
− + − =
The graph has none of the indicated symmetries.
11.
( )( ) ( )( ) ( )
2 2 2
2 2 2
2 2
( ) ( )
2 3 4
2 3 16
x h y k r
x y
x y
− + − =
− − + − =
+ + − =
12.
( )( ) ( )( )( ) ( )
2 2 2
2 2 2
2 2
( ) ( )
1 2 1
1 2 1
x h y k r
x y
x y
− + − =
− − + − − =
+ + + =
13. ( )( )
22
22 2
1 4
1 2
x y
x y
+ − =
+ − =
Center: (0,1); Radius = 2
x-intercepts: ( )22
2
2
0 1 4
1 4
3
3
x
x
x
x
+ − =
+ =
=
= ±
y-intercepts: ( )22
2
0 1 4
( 1) 41 2
1 2
y
yy
y
+ − =
− =− = ±
= ±
3 or 1y y= = −
The intercepts are ( )3, 0 ,− ( )3, 0 , ( )0, 1 ,−
and ( )0, 3 .
14.
( ) ( )( ) ( )
2 2
2 2
2 2
2 2 2
2 4 4 02 4 4
2 1 4 4 4 1 4
1 2 3
x y x yx x y y
x x y y
x y
+ − + − =− + + =
− + + + + = + +
− + + =
Center: (1, –2) Radius = 3
x-intercepts: ( ) ( )
( )( )
2 2 2
2
2
1 0 2 3
1 4 9
1 51 5
1 5
x
x
x
xx
− + + =
− + =
− =
− = ±= ±
y-intercepts: ( ) ( )( )( )
2 2 2
2
2
0 1 2 3
1 2 9
2 82 82 2 2
2 2 2
y
y
y
yy
y
− + + =
+ + =
+ =
+ = ±+ = ±
= − ±
The intercepts are ( )1 5, 0 ,− ( )1 5, 0 ,+
( )0, 2 2 2 ,− − and ( )0, 2 2 2 .− +
15.
( ) ( )( ) ( ) ( )
2 2
2 2
2 2
2 2
22 2
3 3 6 12 0
2 4 0
2 4 0
2 1 4 4 1 4
1 2 5
x y x y
x y x y
x x y y
x x y y
x y
+ − + =
+ − + =
− + + =
− + + + + = +
− + + =
Center: (1, –2) Radius = 5

Chapter 1 Review Exercises
115 Copyright © 2016 Pearson Education, Inc.
x-intercepts: ( ) ( ) ( )( )
( )
22 2
2
2
1 0 2 5
1 4 5
1 11 1
1 1
x
x
xx
x
− + + =
− + =
− =− = ±
= ±
2 or 0x x= =
y-intercepts: ( ) ( ) ( )( )( )
22 2
2
2
0 1 2 5
1 2 5
2 42 2
2 2
y
y
yy
y
− + + =
+ + =
+ =+ = ±
= − ±
0 or 4y y= = − The intercepts are ( )0, 0 , ( )2, 0 , and ( )0, 4 .−
16. Find the distance between each pair of points. 2 2
,
2 2,
2 2,
(1 3) (1 4) 4 9 13
( 2 1) (3 1) 9 4 13
( 2 3) (3 4) 25 1 26
A B
B C
A C
d
d
d
= − + − = + =
= − − + − = + =
= − − + − = + =
Since AB = BC, triangle ABC is isosceles.
17. Endpoints of the diameter are (–3, 2) and (5,–6). The center is at the midpoint of the diameter:
Center: ( ) ( )2 63 5 , 1, 22 2
+ − − + = −
Radius: 2 2(1 ( 3)) ( 2 2)
16 16
32 4 2
r = − − + − −
= +
= =
Equation: ( ) ( ) ( )( ) ( )
22 2
2 2
1 2 4 2
1 2 32
x y
x y
− + + =
− + + =
18. This relation represents a function. Domain = {–1, 2, 4}; Range = {0, 3}.
19. This relation does not represent a function, since 4 is paired with two different values.
20. 23( )
1xf x
x=
−
a. 23(2) 6 6(2) 2
4 1 3(2) 1f = = = =
−−
b. 23( 2) 6 6( 2) 2
4 1 3( 2) 1f − − −− = = = = −
−− −
c. 2 23( ) 3( )
( ) 1 1x xf x
x x− −− = =
− − −
d. 2 23 3( )
1 1x xf x
x x− − = − = − −
e.
( )2
2 2
3( 2)( 2)( 2) 1
3 23 64 4 1 4 3
xf xx
xxx x x x
−− =− −
−−= =− + − − +
f. 2 23(2 ) 6(2 )
(2 ) 1 4 1x xf x
x x= =
− −
21. 2( ) 4f x x= −
a. 2(2) 2 4 4 4 0 0f = − = − = =
b. ( )2( 2) 2 4 4 4 0 0f − = − − = − = =
c. 2 2( ) ( ) 4 4f x x x− = − − = −
d. 2( ) 4f x x− = − −
e. 2
2
2
( 2) ( 2) 4
4 4 4
4
f x x
x x
x x
− = − −
= − + −
= −
f.
( )2 2
2 2
(2 ) (2 ) 4 4 4
4 1 2 1
f x x x
x x
= − = −
= − = −
55. 2
24( ) xf x
x−=
a. 2
22 4 4 4 0(2) 0
4 42f − −= = = =

Chapter 1: Graphs and Functions
116 Copyright © 2016 Pearson Education, Inc.
b. ( )( )
2
2
2 4 4 4 0( 2) 04 42
f− − −− = = = =
−
c. 2 2
2 2( ) 4 4( )
( )x xf x
x x− − −− = =
−
d. 2 2 2
2 2 24 4 4( ) x x xf x
x x x − − −− = − = = −
e.
( )
2 2
2 2
2
2 2
( 2) 4 4 4 4( 2)( 2) ( 2)
44( 2) ( 2)
x x xf xx x
x xx xx x
− − − + −− = =− −
−−= =− −
f.
( )
2 2
2 2
2 2
2 2
(2 ) 4 4 4(2 )(2 ) 4
4 1 14
x xf xx x
x xx x
− −= =
− −= =
23. 2( )9
xf xx
=−
The denominator cannot be zero: 2 9 0
( 3)( 3) 03 or 3
xx x
x
− ≠+ − ≠
≠ −
Domain: { }3, 3x x x≠ − ≠
24. ( ) 2f x x= − The radicand must be non-negative: 2 0
2xx
− ≥≤
Domain: { } ( ]2 or , 2x x ≤ −∞
25. ( )x
g xx
=
The denominator cannot be zero: 0x ≠
Domain: { }0x x ≠
26. 2( )2 3xf x
x x=
+ −
The denominator cannot be zero:
( )( )
{ }
2 2 3 03 1 03 or 1
Domain: 3, 1
x xx x
xx x x
+ − ≠+ − ≠
≠ −
≠ − ≠
27. 21( )4
xf xx
+=−
The denominator cannot be zero:
( )( )2 4 0
2 2 02 or 2
xx x
x
− ≠+ − ≠
≠ −
Also, the radicand must be non-negative: 1 0
1x
x+ ≥
≥ −
[ ) ( )Domain: 1,2 2,− ∪ ∞
28. ( )8
xf xx
=+
The radicand must be non-negative and not zero: 8 0
8x
x+ >
> −
Domain: { }8x x > −
29. 2( ) 2 1f x x x= − + + ( ) ( )
( ) ( ) ( )
( )
( )
2 2
2 2 2
2 2 2
2
2 1 2 1
2 2 1 2 1
2 4 2 1 2 1
4 2 14 2
4 2 1
f x h f xh
x h x h x xh
x xh h x h x xh
x xh h x h x xh
h x hxh h hh h
x h
+ −
− + + + + − − + +=
− + + + + + + − −=
− − − + + + + − −=
− − +− − += =
= − − +
30. a. Domain:{ }4 3x x− ≤ ≤ ; [ ]4, 3−
Range: { }3 3y y− ≤ ≤ ; [ ]3, 3−
b. Intercept: ( )0,0
c. ( )2 1f − = −
d. ( ) 3f x = − when x = –4
e. ( ) 0f x > when 0 3x< ≤ { }| 0 3x x< ≤

Chapter 1 Review Exercises
117 Copyright © 2016 Pearson Education, Inc.
f. To graph ( )3y f x= − , shift the graph of f horizontally 3 units to the right.
g. To graph 12
y f x =
, stretch the graph of
f horizontally by a factor of 2.
h. To graph ( )y f x= − , reflect the graph of f vertically about the y-axis.
31. a. Domain: ( ], 4−∞
Range: ( ],3−∞
b. Increasing: ( ), 2−∞ − and ( )2, 4 ;
Decreasing: ( )2, 2−
c. Local minimum is 1− at 2x = ; Local maximum is 1 at 2x = −
d. No absolute minimum; Absolute maximum is 3 at 4x =
e. The graph has no symmetry.
f. The function is neither. g. x-intercepts: 3,0,3− ;
y-intercept: 0
32. 3( ) 4f x x x= −
( )3 3
3
( ) ( ) 4( ) 4
4 ( )
f x x x x x
x x f x
− = − − − = − +
= − − = −
f is odd.
33. 2
44( )1
xg xx
+=+
2 2
4 44 ( ) 4( ) ( )1 ( ) 1
x xg x g xx x
+ − +− = = =+ − +
g is even.
34. 3( ) 1G x x x= − + 3
3
( ) 1 ( ) ( )
1 ( ) or ( )
G x x x
x x G x G x
− = − − + −
= + − ≠ −
G is neither even nor odd.
35. 2( )1
xf xx
=+
2 2( ) ( )1 ( ) 1
x xf x f xx x
− −− = = = −+ − +
f is odd.
36. ( ) 32 5 1f x x x= − + on the interval ( )3,3− Use MAXIMUM and MINIMUM on the graph of 3
1 2 5 1y x x= − + .
20
−3 3
−20
20
−3 3
−20 local maximum: 4.04 when 0.91x ≈ − local minimum: 2.04− when 0.91x = f is increasing on: ( 3, 0.91)− − and (0.91,3) ; f is decreasing on: ( 0.91,0.91)− .

Chapter 1: Graphs and Functions
118 Copyright © 2016 Pearson Education, Inc.
37. ( ) 4 32 5 2 1f x x x x= − + + on the interval ( )2,3− Use MAXIMUM and MINIMUM on the graph of 4 3
1 2 5 2 1y x x x= − + + .
−2
20
3
−10
−2
20
3
−10
−2
20
3
−10 local maximum: 1.53 when 0.41x = local minima: 0.54 when 0.34x = − , 3.56− when
1.80x = f is increasing on: ( 0.34, 0.41)− and (1.80, 3) ; f is decreasing on: ( 2, 0.34)− − and (0.41, 1.80) .
38. 2( ) 8f x x x= −
a. 2 2(2) (1) 8(2) 2 [8(1) 1]
2 1 132 2 (7) 23
f f− − − −=−
= − − =
b.
( )
2 2(1) (0) 8(1) 1 [8(0) 0]1 0 1
8 1 0 7
f f− − − −=−
= − − =
c. 2 2(4) (2) 8(4) 4 [8(2) 2]
4 2 2128 4 (30) 94 47
2 2
f f− − − −=−
− −= = =
39. ( ) 2 5f x x= −
( ) ( )
( ) ( )
( )
2 5 3 2 5 2(3) (2)3 2 3 2
2 15 2 101
13 8 5
f f − − − − =− −
− − −=
= − − − = −
40. 2( ) 3 4f x x x= −
( ) ( ) ( ) ( )
( ) ( )
2 23 3 4 3 3 2 4 2(3) (2)3 2 3 2
9 36 6 161
27 10 17
f f − − −− =
− −− − −
=
= − + = −
41. The graph does not pass the Vertical Line Test and is therefore not a function.
42. The graph passes the Vertical Line Test and is therefore a function.
43. ( )f x x=
44. ( )f x x=

Chapter 1 Review Exercises
119 Copyright © 2016 Pearson Education, Inc.
45. ( ) 4F x x= − . Using the graph of y x= , vertically shift the graph downward 4 units.
Intercepts: (–4,0), (4,0), (0,–4) Domain: { } is any real numberx x
Range: { }4y y ≥ − or [ )4,− ∞
46. ( ) 2g x x= − . Reflect the graph of y x= about the x-axis and vertically stretch the graph by a factor of 2.
Intercepts: (0, 0) Domain: { } is any real numberx x
Range: { }0y y ≤ or ( ], 0−∞
47. ( ) 1h x x= − . Using the graph of y x= , horizontally shift the graph to the right 1 unit.
Intercept: (1, 0) Domain: { }1x x ≥ or [ )1, ∞
Range: { }0y y ≥ or [ )0, ∞
48. ( ) 1 ( 1)f x x x= − = − − . Reflect the graph of
y x= about the y-axis and horizontally shift the graph to the right 1 unit.
Intercepts: (1, 0), (0, 1) Domain: { }1x x ≤ or ( ], 1−∞
Range: { }0y y ≥ or [ )0, ∞
49. 2( ) ( 1) 2h x x= − + . Using the graph of 2y x= , horizontally shift the graph to the right 1 unit and vertically shift the graph up 2 units.
Intercepts: (0, 3) Domain: { }is any real numberx x
Range: { }2y y ≥ or [ )2, ∞
50. 3( ) 2( 2) 8g x x= − + − Using the graph of 3y x= , horizontally shift the graph to the left 2 units, vertically stretch the graph by a factor of 2, reflect about the x-axis, and vertically shift the graph down 8 units.

Chapter 1: Graphs and Functions
120 Copyright © 2016 Pearson Education, Inc.
−9
y
x
−5(−3, −6)
(−2, −8)(−1, −10)
( )32 4, 0− −
Intercepts: (0,–24), ( ) ( )32 4, 0 3.6, 0− − ≈ −
Domain: { } is any real numberx x
Range: { } is any real numbery y
51. 3 if 2 1
( )1 if 1
x xf x
x x− < ≤
= + >
a. Domain: { }2x x > − or ( )2,− ∞
b. Intercept: ( )0,0
c. Graph:
d. Range: { }| 6y y > − or ( )6,− ∞
e. There is a jump in the graph at 1x = . Therefore, the function is not continuous.
52. if 4 0
( ) 1 if 03 if 0
x xf x x
x x
− ≤ <= = >
a. Domain: { }4x x ≥ − or [ )4,− ∞
b. Intercept: (0, 1) c. Graph:
d. Range: { }4, 0y y y≥ − ≠
e. There is a jump at 0x = . Therefore, the function is not continuous.
53. 5( ) and (1) 46 2Axf x f
x+= =−
(1) 5 46(1) 2
5 44
5 1611
A
A
AA
+ =−+ =
+ ==
54. a. The function is one-to-one because there are no two distinct inputs that correspond to the same output.
b. The inverse is ( ) ( ) ( ) ( ){ }2,1 , 5,3 , 8,5 , 10,6 .
55. The function f is one-to-one because every horizontal line intersects the graph at exactly one point.

Chapter 1 Test
121 Copyright © 2016 Pearson Education, Inc.
56. 2 3( )5 2
xf xx
+=−
1
2 35 22 3 Inverse5 2
(5 2) 2 35 2 2 35 2 2 3(5 2) 2 3
2 35 22 3( )5 2
xyxyxy
x y yxy x yxy y x
y x xxyxxf xx
−
+=−+=−
− = +− = +− = +− = +
+=−+=−
Domain of f = Range of 1f −
= All real numbers except 25
.
Range of f = Domain of 1f −
= All real numbers except 25
.
57. 1( )
1f x
x=
−
1
11
1 Inverse1
( 1) 11
11
1( )
yx
xy
x yxy x
xy xxy
xxf x
x−
=−
=−
− =− =
= ++=
+=
Domain of f = Range of 1f − = All real numbers except 1 Range of f = Domain of 1f − = All real numbers except 0
58. ( ) 2f x x= −
2
2
1 2
22 Inverse
2 02 0
( ) 2 0
y xx y
x y xy x x
f x x x−
= −= −
= − ≥= + ≥= + ≥
Domain of f = Range of 1f − { }| 2x x= ≥ or [ )2,∞
Range of f = Domain of 1f − { }| 0x x= ≥ or [ )0,∞
59. 1/3
1/3
1/3
1/3
3
1 3
( ) 111 Inverse
1( 1)
( ) ( 1)
f x xy xx y
y xy x
f x x−
= += += += −= −= −
Domain of f = Range of 1f − = All real numbers or ( ),−∞ ∞
Range of f = Domain of 1f − = All real numbers or ( ),−∞ ∞
Chapter 1 Test
1. ( ) ( )
( )
2 21 2
22
( , ) 5 ( 1) 1 3
6 4
36 16
52 2 13
d P P = − − + − −
= + −
= +
= =
2. The coordinates of the midpoint are:
( )
1 2 1 2( , ) ,2 2
3 ( 1)1 5 ,2 2
4 2,2 22, 1
x x y yx y + + =
+ −− + = =
=
3. 2 9y x= −

Chapter 1: Graphs and Functions
122 Copyright © 2016 Pearson Education, Inc.
4. 2y x= y
x10
5
−5
(1, 1)
(0, 0)
(9, 3)(4, 2) 2y x=
(1,−1)(4,−2)
(9,−3)
5. 2 9x y+ = x-intercepts: y-intercept:
2
2
0 9
93
x
xx
+ =
== ±
2(0) 99
yy
+ ==
The intercepts are ( )3,0 ,− ( )3,0 , and ( )0,9 .
Test x-axis symmetry: Let y y= −
( )2
299 different
x yx y+ − =
− =
Test y-axis symmetry: Let x x= − ( )2
299 same
x yx y
− + =+ =
Test origin symmetry: Let x x= − and y y= −
( ) ( )2
299 different
x yx y
− + − =− =
Therefore, the graph will have y-axis symmetry.
6. 2 2 2( ) ( )x h y k r− + − =
( ) ( )( ) ( )
2 2 2
2 2
4 ( 3) 5
4 3 25
x y
x y
− + − − =
− + + =
General form: ( ) ( )2 2
2 2
2 2
4 3 25
8 16 6 9 25
8 6 0
x y
x x y y
x y x y
− + + =
− + + + + =
+ − + =
7. 2 2
2 2
2 2
2 2 2
4 2 4 04 2 4
( 4 4) ( 2 1) 4 4 1( 2) ( 1) 3
x y x yx x y y
x x y yx y
+ + − − =+ + − =
+ + + − + = + ++ + − =
Center: (–2, 1); Radius = 3
y
x−5 5
5
−5
(−2, 1)
8. a. ( ) ( ) ( ) ( ){ }2,5 , 4,6 , 6,7 , 8,8 This relation is a function because there are no ordered pairs that have the same first element and different second elements. Domain: { }2, 4,6,8
Range: { }5,6,7,8
b. ( ) ( ) ( ) ( ){ }1,3 , 4, 2 , 3,5 , 1,7− − This relation is not a function because there are two ordered pairs that have the same first element but different second elements.
c. This relation is not a function because the graph fails the vertical line test.
d. This relation is a function because it passes the vertical line test. Domain: { }is any real numberx x
Range: { }| 2y y ≥ or [ )2, ∞
9. ( ) 4 5f x x= − The function tells us to take the square root of 4 5x− . Only nonnegative numbers have real square roots so we need 4 5 0x− ≥ .
4 5 04 5 4 0 4
5 45 45 5
45
xx
xx
x
− ≥− − ≥ −
− ≥ −− −≤− −
≤
Domain: 45
x x ≤
or 4,5
−∞
( ) ( )1 4 5 1 4 5 9 3f − = − − = + = =

Chapter 1 Test
123 Copyright © 2016 Pearson Education, Inc.
10. ( ) 22
xg xx
+=+
The function tells us to divide 2x + by 2x + . Division by 0 is undefined, so the denominator can never equal 0. This means that 2x ≠ − . Domain: { }| 2x x ≠ −
( ) ( )( )
1 2 11 111 2
g− +
− = = =− +
11. ( ) 24
5 36xh x
x x−=
+ −
The function tells us to divide 4x − by 2 5 36x x+ − . Since division by 0 is not defined,
we need to exclude any values which make the denominator 0.
( )( )2 5 36 0
9 4 0x x
x x+ − =
+ − =
9 or 4x x= − = Domain: { }| 9, 4x x x≠ − ≠ (note: there is a common factor of 4x − but we must determine the domain prior to simplifying)
( ) ( )( ) ( )2
1 4 5 1140 81 5 1 36
h− − −− = = =
−− + − −
12. a. To find the domain, note that all the points on the graph will have an x-coordinate between 5− and 5, inclusive. To find the range, note that all the points on the graph will have a y-coordinate between 3− and 3, inclusive. Domain: { }| 5 5x x− ≤ ≤ or [ ]5, 5−
Range: { }| 3 3y y− ≤ ≤ or [ ]3, 3−
b. The intercepts are ( )0, 2 , ( )2,0− , and ( )2,0 . x-intercepts: 2, 2− y-intercept: 2
c. ( )1f is the value of the function when
1x = . According to the graph, ( )1 3f = .
d. Since ( )5, 3− − and ( )3, 3− are the only points on the graph for which
( ) 3y f x= = − , we have ( ) 3f x = − when 5x = − and 3x = .
e. To solve ( ) 0f x < , we want to find x-values such that the graph is below the x-axis. The graph is below the x-axis for values in the domain that are less than 2− and greater than 2. Therefore, the solution set is { }| 5 2 or 2 5x x x− ≤ < − < ≤ . In interval notation we would write the solution set as [ ) ( ]5, 2 2,5− − ∪ .
13. ( ) 4 3 22 4 2f x x x x= − + + − We set Xmin = 5− and Xmax = 5. The standard Ymin and Ymax will not be good enough to see the whole picture so some adjustment must be made.
We see that the graph has a local maximum of
0.86− (rounded to two places) when 0.85x = − and another local maximum of 15.55 when
2.35x = . There is a local minimum of 2− when 0x = . Thus, we have
Local maxima: ( )( )0.85 0.862.35 15.55
f
f
− ≈ −
≈
Local minima: ( )0 2f = − The function is increasing on the intervals ( )5, 0.85− − and ( )0, 2.35 and decreasing on the
intervals ( )0.85,0− and ( )2.35,5 .
14. a. ( ) 2 1 14 1
x xf xx x
+ < −= − ≥ −
To graph the function, we graph each “piece”. First we graph the line 2 1y x= + but only keep the part for which 1x < − . Then we plot the line 4y x= − but only

Chapter 1: Graphs and Functions
124 Copyright © 2016 Pearson Education, Inc.
keep the part for which 1x ≥ − .
b. To find the intercepts, notice that the only
piece that hits either axis is 4y x= − . 4
0 44
y xyy
= −= −= −
40 44
y xxx
= −= −=
The intercepts are ( )0, 4− and ( )4,0 .
c. To find ( )5g − we first note that 5x = − so we must use the first “piece” because 5 1− < − .
( ) ( )5 2 5 1 10 1 9g − = − + = − + = −
d. To find ( )2g we first note that 2x = so we must use the second “piece” because 2 1≥ − .
( )2 2 4 2g = − = −
15. The average rate of change from 3 to 4 is given by ( ) ( )
( ) ( )( ) ( ) ( )( )2 2
4 34 3
3 4 2 4 4 3 3 2 3 4
4 344 25 19 19
4 3 1
f fyx
−Δ =Δ −
− + − − +=
−−= = =−
16. a. The basic function is 3y x= so we start with the graph of this function.
10
−10
y
x2−2
(−1, −1) (1, 1)
3y x=
Next we shift this graph 1 unit to the left to obtain the graph of ( )31y x= + .
10
−10
y
x2−2
( )31y x= +
(−2, −1) (0, 1)
Next we reflect this graph about the x-axis to obtain the graph of ( )31y x= − + .
10
−10
y
x2−2
(−2, 1)(0, −1)
( )31y x= − + Next we stretch this graph vertically by a factor of 2 to obtain the graph of
( )32 1y x= − + .
10
−10
y
x2−2
(−2, 2) (0, −2)
( )32 1y x= − + The last step is to shift this graph up 3 units to obtain the graph of ( )32 1 3y x= − + + .
10
−10
y
x2−2
(−2, 5)
(0, 1)
( )32 1 3y x= − + + b. The basic function is y x= so we start
with the graph of this function.

Chapter 1 Project
125 Copyright © 2016 Pearson Education, Inc.
y
x
8
8
y x=
(−2, 2) (2, 2)
Next we shift this graph 4 units to the left to obtain the graph of 4y x= + .
y
x
8
8
(−6, 2)
(−2, 2)
4y x= +
Next we shift this graph up 2 units to obtain the graph of 4 2y x= + + .
y
x
8
8
(−6, 4) (−2, 4)
4 2y x= + +
17. 2( )3 5
f xx
=−
1
23 5
2 Inverse3 5
(3 5) 23 5 2
3 5 25 2
35 2( )
3
yx
xy
x yxy x
xy xxy
xxf x
x−
=−
=−
− =− =
= ++=
+=
Domain of f = Range of 1f −
= { }53|x x ≠ .
Range of f = Domain of 1f − = { }| 0x x ≠
18. If the point (3, 5)− is on the graph of f, then the
point ( 5, 3)− must be on the graph of 1f − .
Chapter 1 Project
Project I – Internet Based Project