CHAPTER-1 General Introduction -...
49
1 CHAPTER-1 General Introduction
Transcript of CHAPTER-1 General Introduction -...

1
CHAPTER-1
General Introduction

2
The search for remedies is as old as humanity itself. There is evidence that the first
advanced civilizations were already using drugs of plant, mineral and animal origin for
medicinal purposes. Systematic descriptions of remedies have been handed down to us
from Greek antiquity and from the Roman Empire. This knowledge was adopted by
Arabian scholars and was developed further. It served for a long time as an important
basis of medicine. The gradual change from the ancient models started in 16th
century. A
typical representative of the new direction was Paracelsus, lived in Basel, who, in 1537,
coined the famous phrase: “only dose makes the poison”. The emergence of organic
chemistry at the start of 19th
century brought progress. In 1906, P. Ehrlich discovered a
chemical compound named atoxyl which had been shown to be able to treat sleeping
sickness. Ehrlich received the Nobel Prize for medicine in 1908. The period from
Paracelsus to Ehrlich has been described as that leading from Quintessence to the
Chemical and has been reviewed by Barber [1]. This transition from Quintessence to
Chemical stimulated a considerable amount of interest in the analysis as well as
determination of purity of natural products.
Pharmaceutical industry is growing day by day with the aim to develop new drugs
extracted from natural products or synthetically produced drug substances, but one thing
always remains constant, that is, the product should be as pure as possible. Therefore,
purity has always been considered as an essential factor in ensuring drug quality. In
pharmaceutical industry, the quality of the manufactured drug and its formulations must
be carefully controlled. Slight changes in composition or in the purity of drugs itself can
affect the therapeutic values. Therefore, it is necessary to establish the properties and
therapeutic value of a drug before it is approved and made available in the market.
Establishment of the permissible level of dosage of a drug requires the determination of
its composition, toxicity and its metabolites at various stages.
3
The availability of sub-standard medicines to the general public possesses many
problems, both clinically and economically. It is widely believed that sub-standard drug
preparations are readily available in many developing countries [2-6]. This may be due to
poor manufacturing procedures, poor storage conditions or deliberate counterfeiting of
branded or generic products. Therefore, it is important to recognize that the drugs may
contain impurities.
IMPURITY PROFILING
There is an ever increasing interest in impurities present in active pharmaceutical
ingredients (API’s). Recently, not only purity profile but also impurity profile has
become essential as per various regulatory requirements. In the pharmaceutical world, an
impurity is considered as any other organic material, besides the drug substance, or
ingredients, arise out of synthesis or unwanted chemicals that remains with API’s. The
impurity may be developed either during formulation, or upon aging of both API’s and
formulated API’s in medicines. The presence of these unwanted chemicals, even in small
amount, may influence the efficacy and safety of the pharmaceutical products. Impurity
profiling (i.e., the identity as well as the quantity of impurity in the pharmaceuticals), is
now gaining critical attention from regulatory authorities.
The different Pharmacopoeias, such as the British Pharmacopoeia (BP), United
States Pharmacopeia (USP), and Indian Pharmacopoeia (IP) are slowly incorporating
limits to allowable levels of impurities present in the API’s or formulations. The
International Conference on Harmonization of Technical Requirements for Registration
of Pharmaceuticals for Human Use (ICH) has also published guidelines for validation of
methods for analysing impurities in new drug substances, products, residual solvents and
microbiological impurities [7-10].
4
Qualification of impurities is the process of acquiring and evaluating data that
establishes biological safety of an individual impurity; thus, revealing the need and scope
of impurity profiling of drugs in pharmaceutical research (Fig. 1.1).
Classification of impurities
Impurities in the drug substance produced by chemical synthesis can broadly be
classified into following three categories:
a) Organic impurities: It may arise during the manufacturing process and/or storage of
the drug substance. They may be identified or unidentified, volatile or non-volatile, and
may include:
starting materials or intermediates
by-products
degradation products
reagents, ligands, and catalysts (less commonly found in APIs but in some cases
they may pose a problem as impurities)
b) Inorganic impurities: These impurities are generally known and identified and may
originate from the following sources:
the use of equipments,
reagents, ligands, and catalysts, that are used during production, may serve as
impurities,
the water used in the processes and the stainless steel reactors, where acidification
or acid hydrolysis takes place, may discharge heavy metals as impurities,
contain drying agents that are generally employed during production,

5
Fig. 1.1. Proposed chart for profiling drug impurity.
6
the use of filter aids (such as centrifuge bags or activated charcoal that are
routinely used in the bulk manufacturing plants).
c) Residual solvents: These are organic or inorganic volatile liquids used during the
manufacturing process or generated during the production.
Origin of Impurities from different sources
Crystallization-related impurities
Based on the realization that the nature of structure adopted by a given compound
upon crystallization could exert a profound effect on the solid-state properties of that
system, the pharmaceutical industry is required to take a strong interest in polymorphism
and solvatomorphism [11] as per the regulations laid down by the regulatory authorities.
Stereochemistry-related impurities
It is of paramount importance to look for stereochemistry related compounds; that
is, those compounds that have similar chemical structure but different spatial orientation,
these compounds can be considered as impurities in the API’s. The single enantiomeric
form of chiral drug is now considered as an improved chemical entity that may offer a
better pharmacological profile and an increased therapeutic index with a more favourable
adverse reaction profile. However, the pharmacokinetic profile of levofloxacin (S-
isomeric form) and ofloxacin (R- isomeric form) are comparable, suggesting the lack of
advantages of single isomer in this regard [12]. The prominent single isomer drugs, which
are being marketed, include levofloxacin (S-ofloxacin), levalbuterol (R-albuterol), and
esomeprazole (S- omeprazole).
7
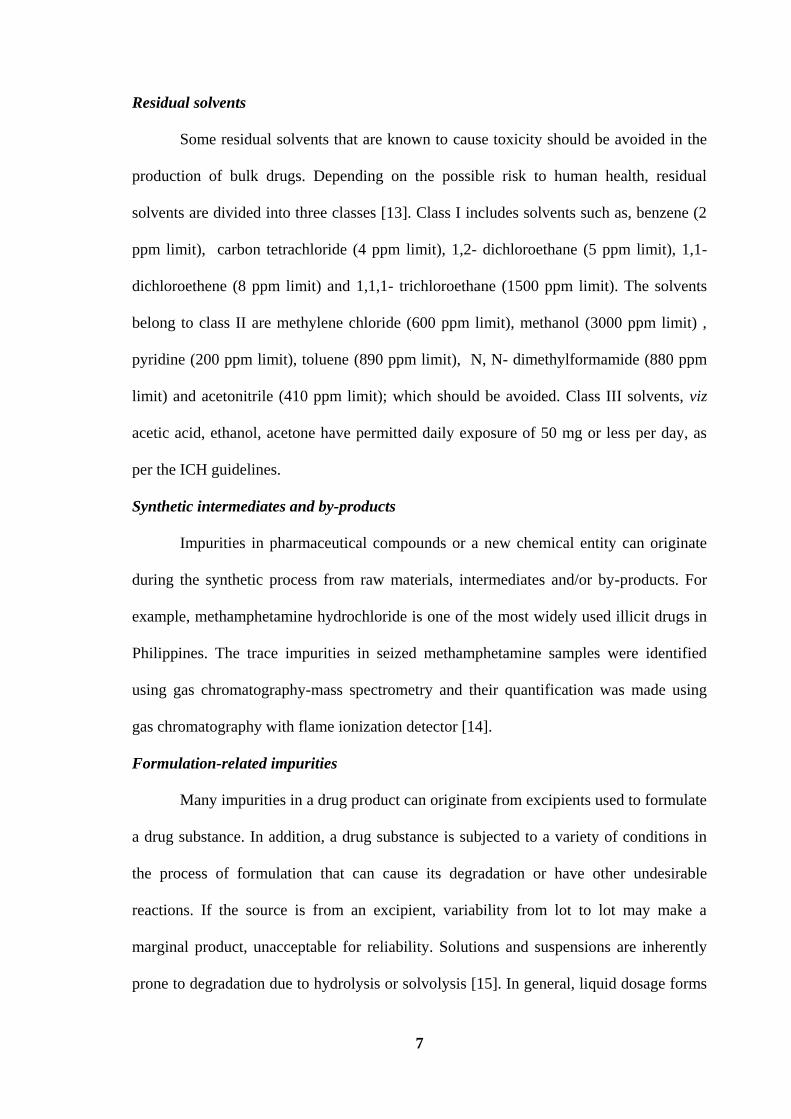
Residual solvents
Some residual solvents that are known to cause toxicity should be avoided in the
production of bulk drugs. Depending on the possible risk to human health, residual
solvents are divided into three classes [13]. Class I includes solvents such as, benzene (2
ppm limit), carbon tetrachloride (4 ppm limit), 1,2- dichloroethane (5 ppm limit), 1,1-
dichloroethene (8 ppm limit) and 1,1,1- trichloroethane (1500 ppm limit). The solvents
belong to class II are methylene chloride (600 ppm limit), methanol (3000 ppm limit) ,
pyridine (200 ppm limit), toluene (890 ppm limit), N, N- dimethylformamide (880 ppm
limit) and acetonitrile (410 ppm limit); which should be avoided. Class III solvents, viz
acetic acid, ethanol, acetone have permitted daily exposure of 50 mg or less per day, as
per the ICH guidelines.
Synthetic intermediates and by-products
Impurities in pharmaceutical compounds or a new chemical entity can originate
during the synthetic process from raw materials, intermediates and/or by-products. For
example, methamphetamine hydrochloride is one of the most widely used illicit drugs in
Philippines. The trace impurities in seized methamphetamine samples were identified
using gas chromatography-mass spectrometry and their quantification was made using
gas chromatography with flame ionization detector [14].
Formulation-related impurities
Many impurities in a drug product can originate from excipients used to formulate
a drug substance. In addition, a drug substance is subjected to a variety of conditions in
the process of formulation that can cause its degradation or have other undesirable
reactions. If the source is from an excipient, variability from lot to lot may make a
marginal product, unacceptable for reliability. Solutions and suspensions are inherently
prone to degradation due to hydrolysis or solvolysis [15]. In general, liquid dosage forms
8
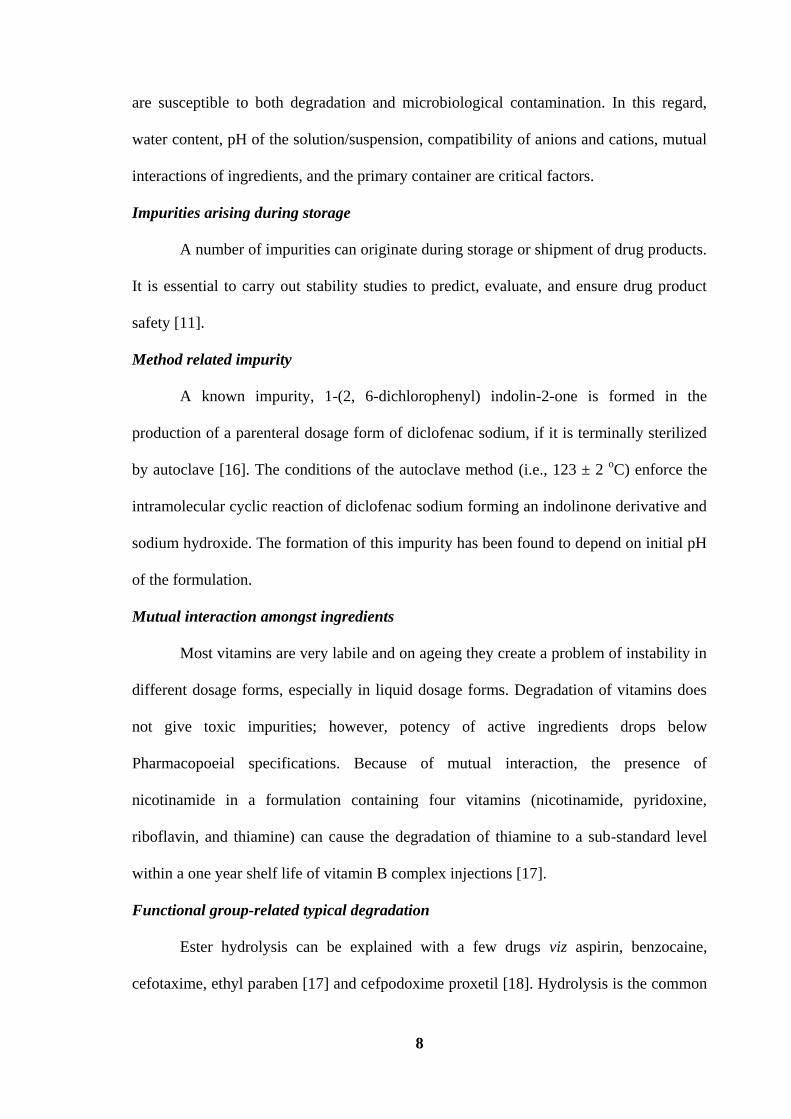
are susceptible to both degradation and microbiological contamination. In this regard,
water content, pH of the solution/suspension, compatibility of anions and cations, mutual
interactions of ingredients, and the primary container are critical factors.
Impurities arising during storage
A number of impurities can originate during storage or shipment of drug products.
It is essential to carry out stability studies to predict, evaluate, and ensure drug product
safety [11].
Method related impurity
A known impurity, 1-(2, 6-dichlorophenyl) indolin-2-one is formed in the
production of a parenteral dosage form of diclofenac sodium, if it is terminally sterilized
by autoclave [16]. The conditions of the autoclave method (i.e., 123 ± 2 oC) enforce the
intramolecular cyclic reaction of diclofenac sodium forming an indolinone derivative and
sodium hydroxide. The formation of this impurity has been found to depend on initial pH
of the formulation.
Mutual interaction amongst ingredients
Most vitamins are very labile and on ageing they create a problem of instability in
different dosage forms, especially in liquid dosage forms. Degradation of vitamins does
not give toxic impurities; however, potency of active ingredients drops below
Pharmacopoeial specifications. Because of mutual interaction, the presence of
nicotinamide in a formulation containing four vitamins (nicotinamide, pyridoxine,
riboflavin, and thiamine) can cause the degradation of thiamine to a sub-standard level
within a one year shelf life of vitamin B complex injections [17].
Functional group-related typical degradation
Ester hydrolysis can be explained with a few drugs viz aspirin, benzocaine,
cefotaxime, ethyl paraben [17] and cefpodoxime proxetil [18]. Hydrolysis is the common

9
phenomenon for ester type of drugs, especially in liquid dosage forms viz
benzylpenicillin, oxazepam and lincomycin. Oxidative degradation of drugs like
hydrocortisone, methotrexate, hydroxyl group directly bonded to an aromatic ring (viz
phenol derivatives such as catecholamines and morphine), conjugated dienes (viz vitamin
A and unsaturated free fatty acids), heterocyclic aromatic rings, nitroso and nitrite
derivatives, and aldehydes (especially flavorings) are all susceptible to oxidative
degradation. In mazipredone, the hydrolytic and oxidative degredation pathways in 0.1
mol L-1
hydrochloric acid and sodium hydroxide at 800 °C were studied [19]. Photolytic
cleavage includes example of pharmaceutical products that are exposed to light while
being manufactured as solid or solution, packaged, or when being stored in pharmacy
shops or hospitals for use by consumers. Most compounds will degrade as solutions when
exposed to high-energy UV exposures. Fluoroquinolone antibiotics are also found to be
susceptible to photolytic cleavage [20]. In ciprofloxacin eye drop preparation (0.3 %),
sunlight induces photocleavage reaction producing ethylenediamine analog of
ciprofloxacin [21]. As seen earlier, impurities in drug products can come from the drug or
from excipients or can be brought into the system through an inprocess step by contact
with the packaging material. These impurities are needed to be analyzed by using
different analytical methods.
ANALYTICAL TECHNIQUES
Analysis of drugs in biological samples and pharmaceutical products is becoming
more important owing to the need to understand the therapeutic and toxic effects of drugs
and hence efforts are being made to develop more selective and effective drugs [22-25].
Because of the vast number of drugs introduced every year, more and more methods for
drugs and their metabolites determination are being developed either for routine or
research use. The assay procedures in official monographs have been described to
10
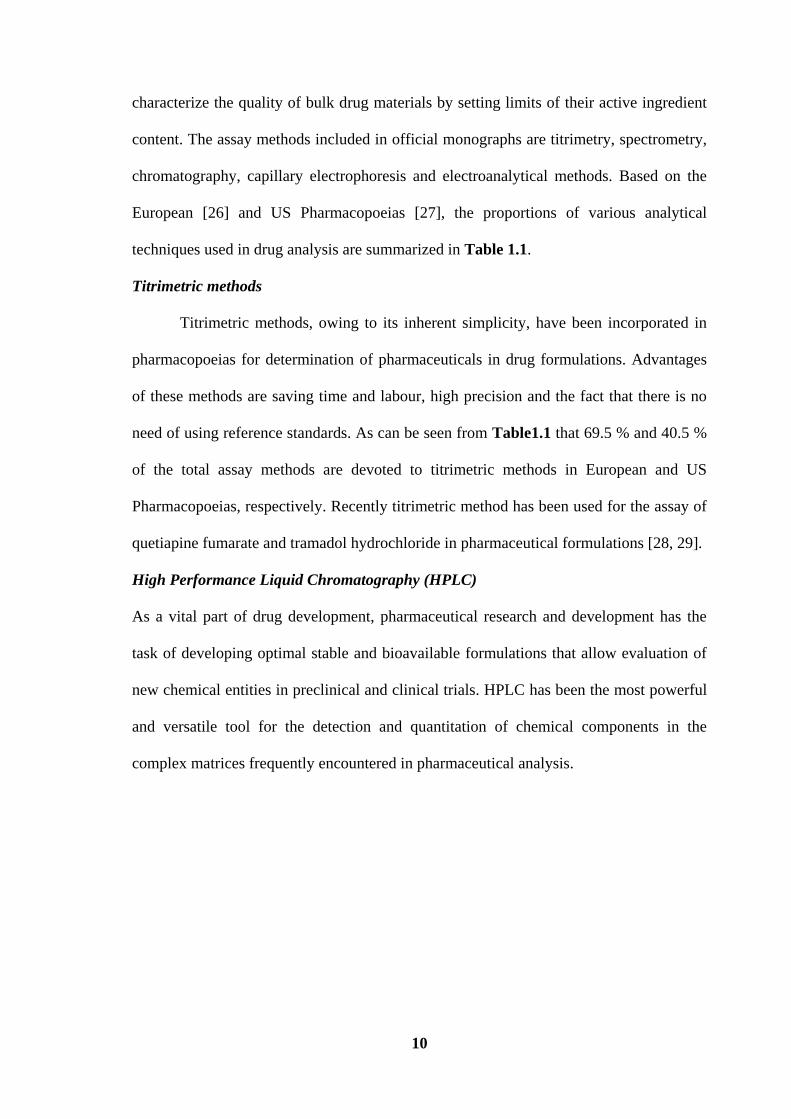
characterize the quality of bulk drug materials by setting limits of their active ingredient
content. The assay methods included in official monographs are titrimetry, spectrometry,
chromatography, capillary electrophoresis and electroanalytical methods. Based on the
European [26] and US Pharmacopoeias [27], the proportions of various analytical
techniques used in drug analysis are summarized in Table 1.1.
Titrimetric methods
Titrimetric methods, owing to its inherent simplicity, have been incorporated in
pharmacopoeias for determination of pharmaceuticals in drug formulations. Advantages
of these methods are saving time and labour, high precision and the fact that there is no
need of using reference standards. As can be seen from Table1.1 that 69.5 % and 40.5 %
of the total assay methods are devoted to titrimetric methods in European and US
Pharmacopoeias, respectively. Recently titrimetric method has been used for the assay of
quetiapine fumarate and tramadol hydrochloride in pharmaceutical formulations [28, 29].
High Performance Liquid Chromatography (HPLC)
As a vital part of drug development, pharmaceutical research and development has the
task of developing optimal stable and bioavailable formulations that allow evaluation of
new chemical entities in preclinical and clinical trials. HPLC has been the most powerful
and versatile tool for the detection and quantitation of chemical components in the
complex matrices frequently encountered in pharmaceutical analysis.
11
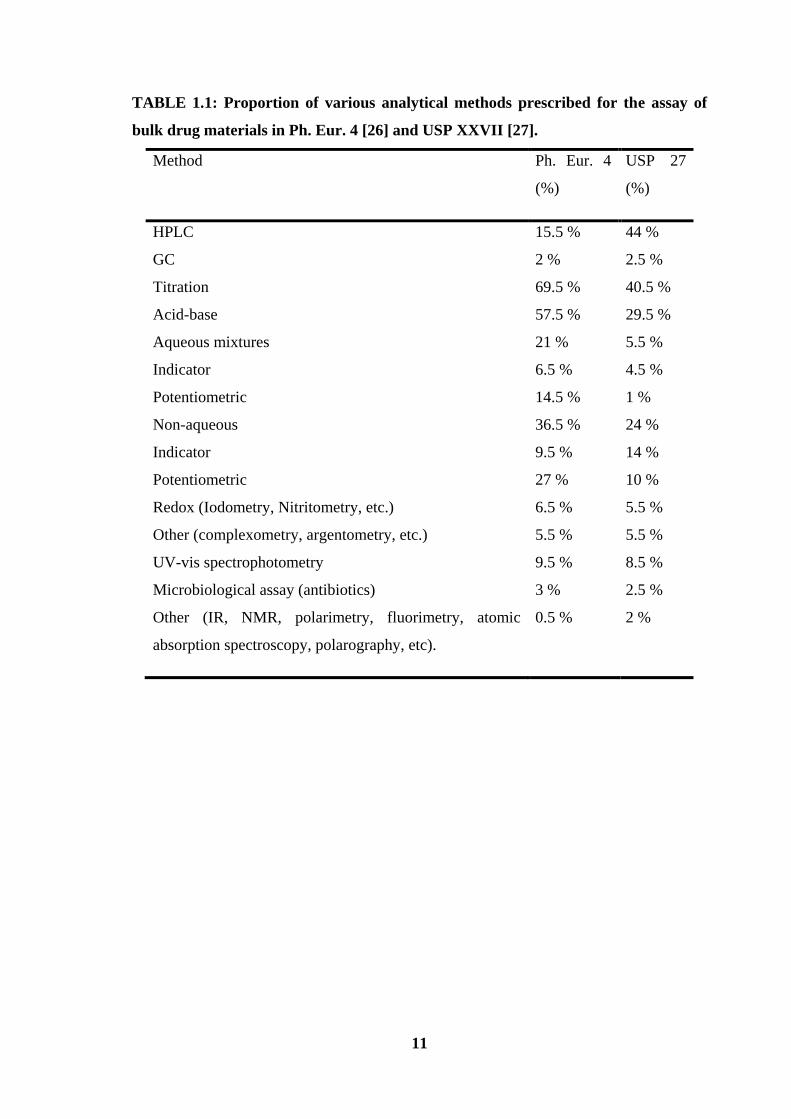
TABLE 1.1: Proportion of various analytical methods prescribed for the assay of
bulk drug materials in Ph. Eur. 4 [26] and USP XXVII [27].
Method Ph. Eur. 4
(%)
USP 27
(%)
HPLC
GC
Titration
Acid-base
Aqueous mixtures
Indicator
Potentiometric
Non-aqueous
Indicator
Potentiometric
Redox (Iodometry, Nitritometry, etc.)
Other (complexometry, argentometry, etc.)
UV-vis spectrophotometry
Microbiological assay (antibiotics)
Other (IR, NMR, polarimetry, fluorimetry, atomic
absorption spectroscopy, polarography, etc).
15.5 %
2 %
69.5 %
57.5 %
21 %
6.5 %
14.5 %
36.5 %
9.5 %
27 %
6.5 %
5.5 %
9.5 %
3 %
0.5 %
44 %
2.5 %
40.5 %
29.5 %
5.5 %
4.5 %
1 %
24 %
14 %
10 %
5.5 %
5.5 %
8.5 %
2.5 %
2 %

12
In general, there are two types of HPLC procedures in pharmaceutical analysis: the
method for the quantitation of the major component (drug substance) and the method for
the detection and/or quantitation of drug substance related impurities and degradants. As
can be seen in Table 1.1, this has become the predominant method in USP XXVII [27]
and-although to a lesser extent-it is one of the most widely used methods also in Ph. Eur.
4 [26]. The specificity of this method is excellent and at the same time sufficient
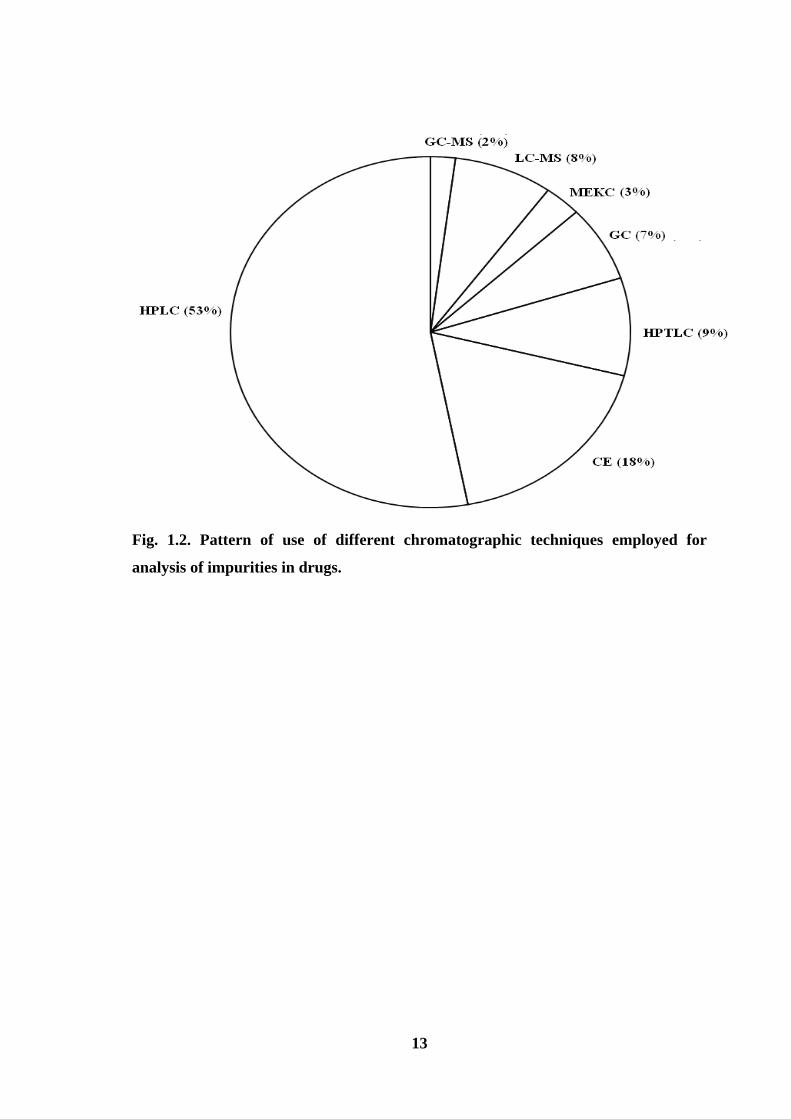
precision is also attainable. Fig. 1.2 shows the pie diagram indicating the percent usage of
various chromatographic techniques from which it becomes very clear that HPLC has
been the main technique used for analysis of impurities in drugs. Fig. 1.3 shows the
percent usage of various detectors used for HPLC analysis of drugs. The choice of proper
detection mode is crucial to ensure that all the components are detected. With UV
detection, this problem could be overcome by using a multiple wavelength scanning
programme which is capable of monitoring several wavelengths simultaneously. It
provides assurance that all the UV absorbing components are detected, if present in
sufficient quantity. Photodiode-array detectors are useful in determining the purity of
enantiomeric drugs by HPLC. Most workers used the reversed-phase mode with UV
absorbance detection whenever appropriate, because this provided the best available
reliability, repeatability and sensitivity.
Several drugs such as gentamicin sulphate [30], duloxetine hydrochloride [31],
mebeverine, mesalazine, sulphasalazine, aspirin [32] and tolvaptan [33] have been
assayed in pharmaceutical formulations and in biological fluids [34] using HPLC. Thus,
HPLC provides a major service in answering many questions posed by pharmaceutical
industry. However, the limitations of HPLC include the cost of columns, solvents and a
lack of long term reproducibility due to the proprietary nature of column packing. Liquid
chromatography combined with mass spectrometry (LC-MS) is considered as one of the
most important techniques of the last decade of 20th
century [35, 36]. Recently HPLC-
MS has been used for assay of drugs [37-40].
13
Fig. 1.2. Pattern of use of different chromatographic techniques employed for
analysis of impurities in drugs.
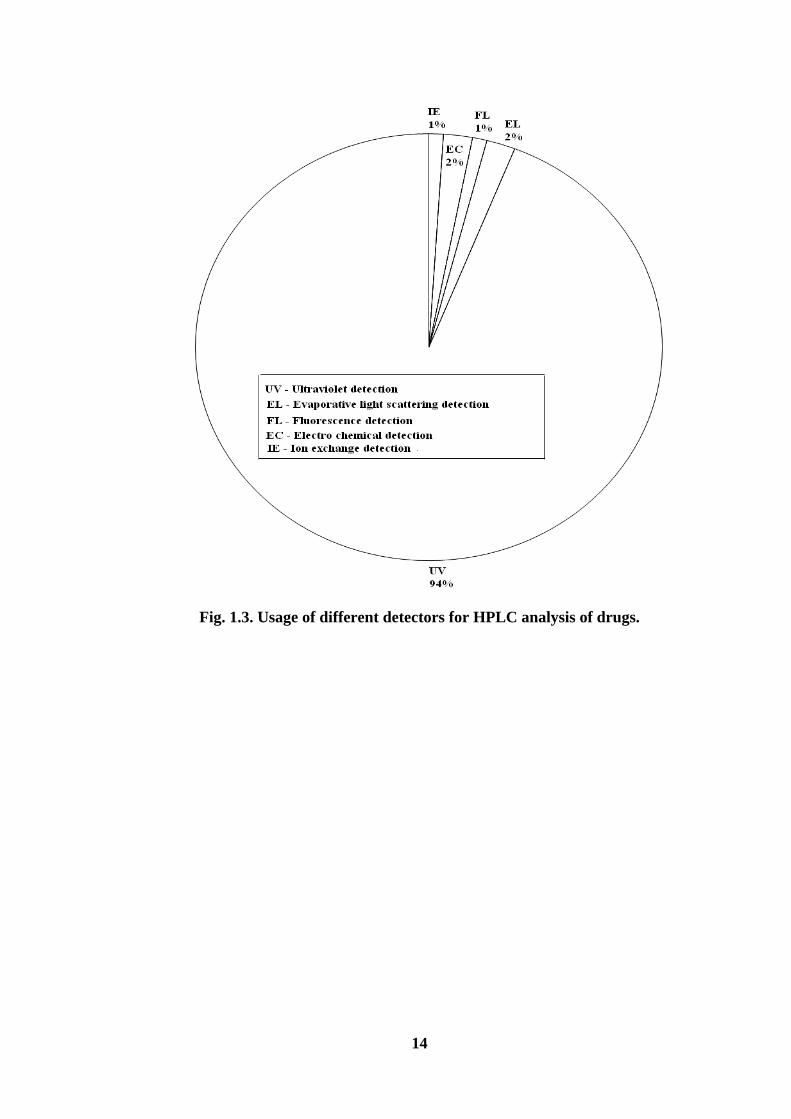
14
Fig. 1.3. Usage of different detectors for HPLC analysis of drugs.
15
Gas chromatography
Gas chromatography is a dynamic method for separation and detection of volatile
organic compounds. The advent of high- molecular weight products such as polypeptides,
or thermally unstable antibiotics limits the scope of this technique. Its principal limitation
rests in the relative non-volatility of the drug substances. Therefore, derivatization is
mandatory, but the techniques for producing volatile derivatives of drugs are legion. Due
to insufficient volatility and thermal stability of the majority of drug materials, gas
chromatography can also be used for their assay in a limited number of cases only, as
reflected by the figures in Table 1.1. Recently, gas chromatography has been used for
assay of drugs such as levetiracetam, [41], divalproex sodium [42] and residual benzene
in oral liquid pharmaceutical products [43].
Thin layer chromatography
Thin-layer chromatography (TLC) is a routine analytical technique, which finds
wide applications in the field of pharmaceutical analysis. TLC has distinct advantages
such as simplicity (require less sophisticated apparatus), minimal sample clean-up, wide
choice of mobile phases, flexibility in sample distinction, high sample loading capacity
and low cost. TLC is a powerful tool for screening unknown materials in bulk drugs
[44]. It provides a relatively high degree of assurance that all possible components of the
drug are separated. TLC has been exploited for quantitative analysis using spot elution
followed by spectrophotometric measurement. It has been utilized for impurity profiling
in pharmaceuticals [45] and for the determination of drugs such as amphetamine [46],
dutasteride [47], bromhexine hydrochloride, etofylline, salbutamol sulphate [48] and
azaphenothiazines [49].
16
High performance thin layer chromatography
High performance thin layer chromatography (HPTLC) is a fast separation
technique and flexible enough to analyze different kind of samples. This technique is
more advantageous in many ways as it is simple to handle and requires short analysis
time to analyze the complex or the crude sample clean up. HPTLC evaluates the entire
chromatogram with a wide variety of techniques and parameters without time constrains.
Moreover, there is simultaneous but independent development of multiple sample and
standards on each plate, leading to an increased reliability of results. HPTLC procedures
have been used for the simultaneous quantitation of famotidine and domeperidone [50]
lamivudine, stavudine, nevirapine [51] in bulk and dosage forms.
Capillary electrophoresis
Capillary electrophoresis (CE) is a relatively new analytical technique based on
the separation of charged analytes through a small capillary under the influence of an
electric field. In this technique solutes are seen as peaks as they pass through the detector
and the area of each peak is proportional to their concentration, which allows quantitative
determinations. CE separations are generally more efficient, can be performed on a faster
time scale, require only nanoliter injection volumes, and in most cases, take place under
aqueous conditions. These four characteristics of CE have proven to be advantageous for
many pharmaceutical applications. Several reports have appeared on the application of
this technique in the routine drug analysis [52-54].
Flow injection analysis (FIA)
Automation is a key demand in modern Analytical Chemistry. Process and quality
control require fast and reliable results in all areas of human activity. FIA technique [55]
became a versatile instrumental tool that contributed substantially to the development of
automation in pharmaceutical analysis. This can be well documented by a number of
17
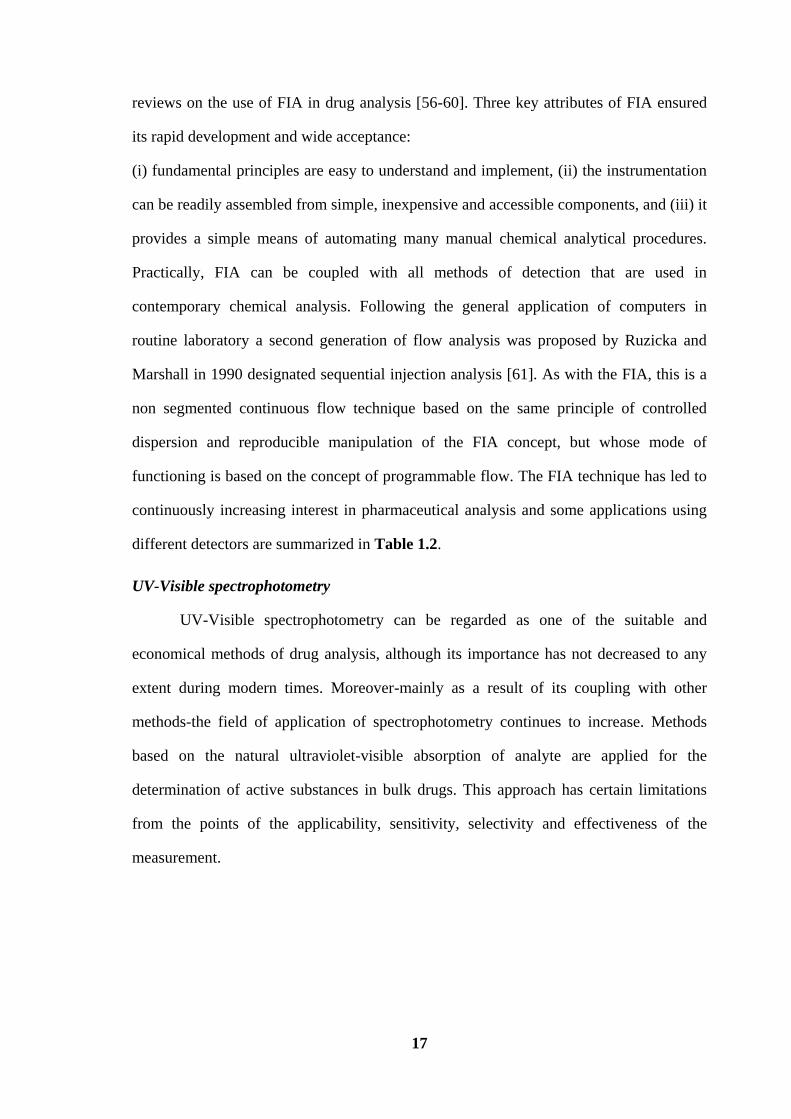
reviews on the use of FIA in drug analysis [56-60]. Three key attributes of FIA ensured
its rapid development and wide acceptance:
(i) fundamental principles are easy to understand and implement, (ii) the instrumentation
can be readily assembled from simple, inexpensive and accessible components, and (iii) it
provides a simple means of automating many manual chemical analytical procedures.
Practically, FIA can be coupled with all methods of detection that are used in
contemporary chemical analysis. Following the general application of computers in
routine laboratory a second generation of flow analysis was proposed by Ruzicka and
Marshall in 1990 designated sequential injection analysis [61]. As with the FIA, this is a
non segmented continuous flow technique based on the same principle of controlled
dispersion and reproducible manipulation of the FIA concept, but whose mode of
functioning is based on the concept of programmable flow. The FIA technique has led to
continuously increasing interest in pharmaceutical analysis and some applications using
different detectors are summarized in Table 1.2.
UV-Visible spectrophotometry
UV-Visible spectrophotometry can be regarded as one of the suitable and
economical methods of drug analysis, although its importance has not decreased to any
extent during modern times. Moreover-mainly as a result of its coupling with other
methods-the field of application of spectrophotometry continues to increase. Methods
based on the natural ultraviolet-visible absorption of analyte are applied for the
determination of active substances in bulk drugs. This approach has certain limitations
from the points of the applicability, sensitivity, selectivity and effectiveness of the
measurement.

18
TABLE 1.2: Analysis of pharmaceuticals by FIA techniques.
Drug Detector Matrix References
Ambroxol Amperometric dosage form [55]
Ciprofloxacin Spectrophotometric dosage form [60]
Distigmine Potentiometric dosage form,
human urine
[62]
Fluoxetine Square-wave
adsorptive-sripping
voltammetric
dosage form [58]
Lansoprazole UV dosage form [56]
Metoclopramide Fast stripping
continous cyclic
voltammetric
dosage form [59]
Paracetamol Spectrophotometric dosage form [57]
Thiamine Fluorimetric dosage form [63]
19
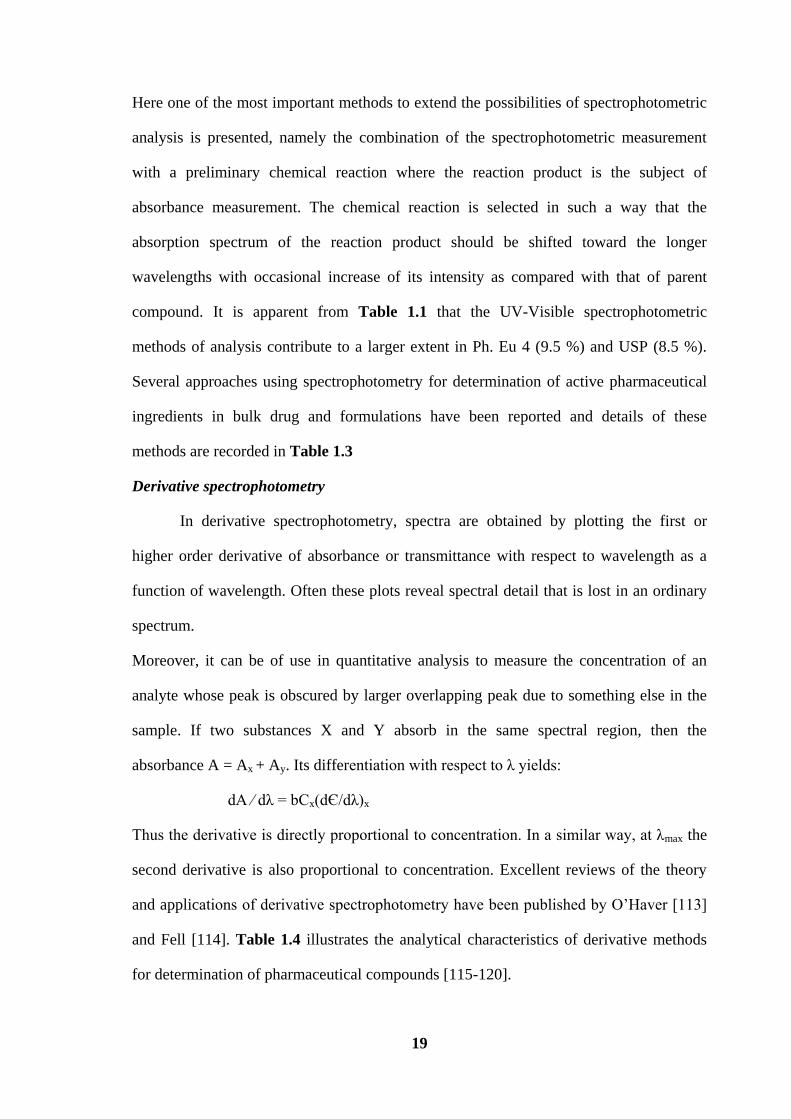
Here one of the most important methods to extend the possibilities of spectrophotometric
analysis is presented, namely the combination of the spectrophotometric measurement
with a preliminary chemical reaction where the reaction product is the subject of
absorbance measurement. The chemical reaction is selected in such a way that the
absorption spectrum of the reaction product should be shifted toward the longer
wavelengths with occasional increase of its intensity as compared with that of parent
compound. It is apparent from Table 1.1 that the UV-Visible spectrophotometric
methods of analysis contribute to a larger extent in Ph. Eu 4 (9.5 %) and USP (8.5 %).
Several approaches using spectrophotometry for determination of active pharmaceutical
ingredients in bulk drug and formulations have been reported and details of these
methods are recorded in Table 1.3
Derivative spectrophotometry
In derivative spectrophotometry, spectra are obtained by plotting the first or
higher order derivative of absorbance or transmittance with respect to wavelength as a
function of wavelength. Often these plots reveal spectral detail that is lost in an ordinary
spectrum.
Moreover, it can be of use in quantitative analysis to measure the concentration of an
analyte whose peak is obscured by larger overlapping peak due to something else in the
sample. If two substances X and Y absorb in the same spectral region, then the
absorbance A = Ax + Ay. Its differentiation with respect to λ yields:
dA ⁄ dλ = bCx(dЄ/dλ)x
Thus the derivative is directly proportional to concentration. In a similar way, at λmax the
second derivative is also proportional to concentration. Excellent reviews of the theory
and applications of derivative spectrophotometry have been published by O’Haver [113]
and Fell [114]. Table 1.4 illustrates the analytical characteristics of derivative methods
for determination of pharmaceutical compounds [115-120].

20
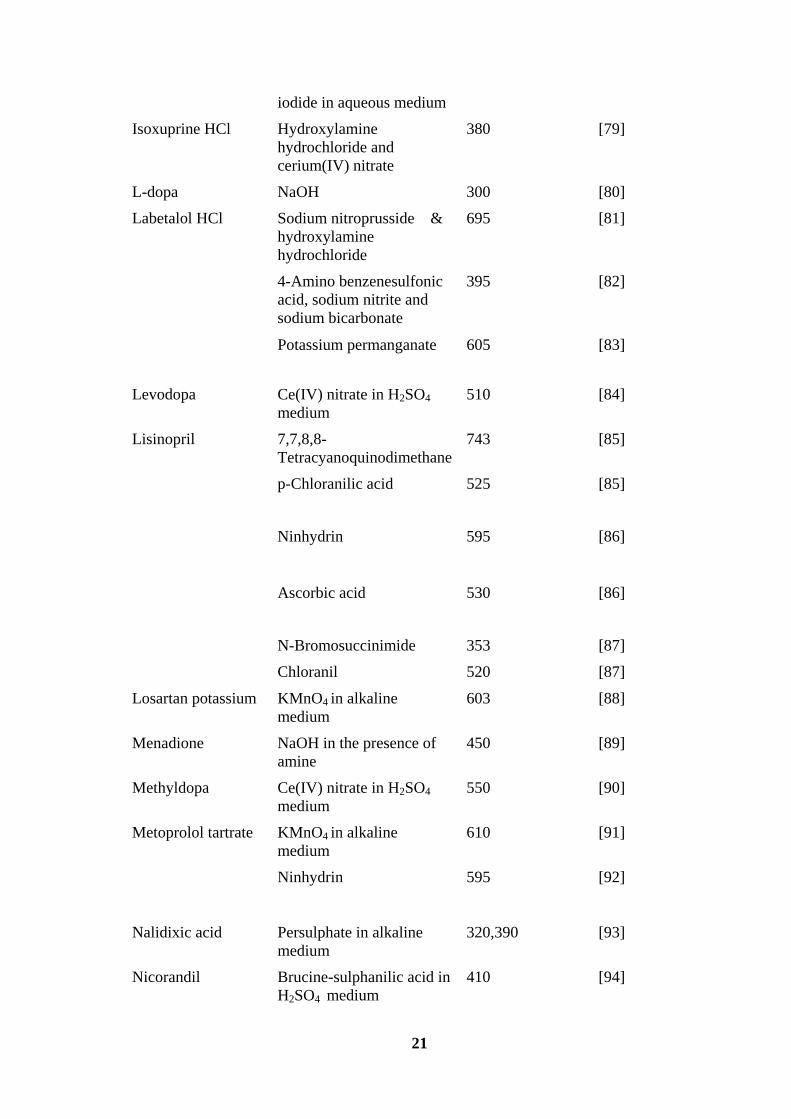
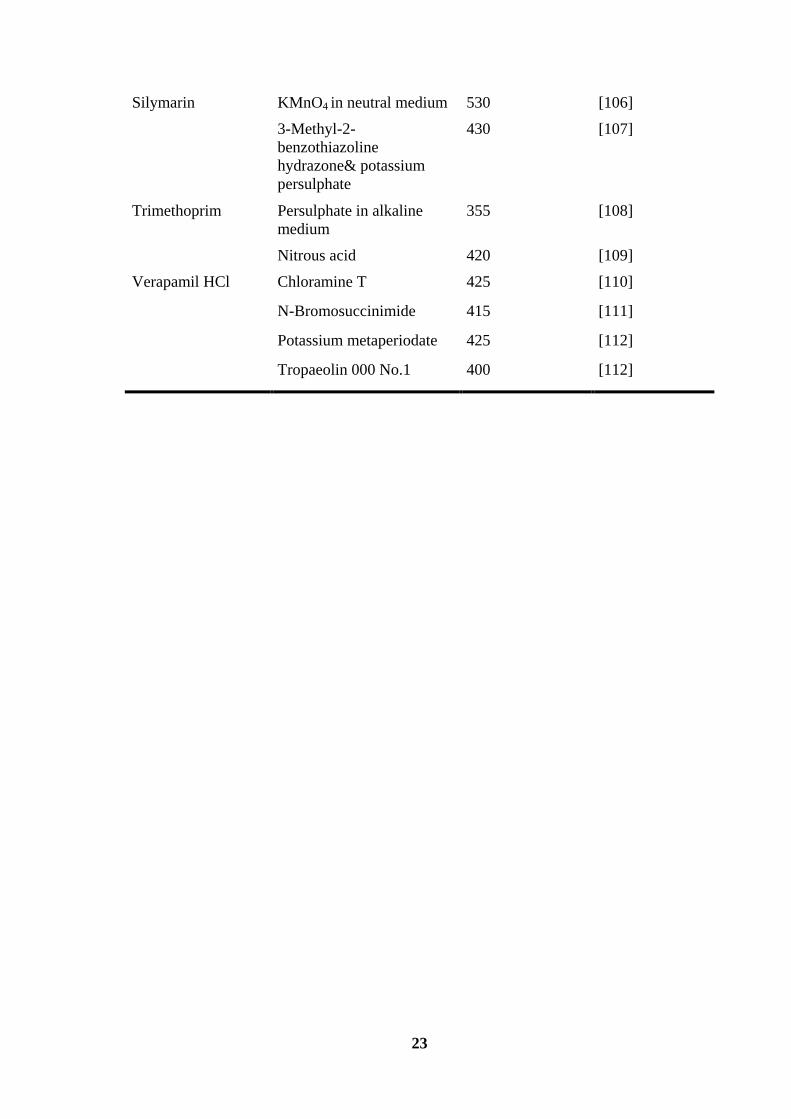
TABLE 1.3: Quantitative analysis of drugs in pharmaceutical formulations by UV-
visible Spectrophotometric procedure.
Name of drug Reagents used λmax (nm) References
Acetaminophen m-Cresol 640 [64]
Amiodarone HCl p-Chloranilic acid
2,3-Dichloro 5,6-
dicyano1,4- benzoquinone
535
575
[65]
[65]
Amlodipine
besylate
p-Chloranilic acid 540 [66]
Ninhydrin in DMF
medium
595 [67]
2,3-Dichloro 5,6-
dicyano1,4- benzoquinone
580 [68]
Ascorbic acid 530 [68]
Amoxycillin &
ampicillin
KIO3 520 [69]
Ampicillin,
amoxycillin &
carbenicillin
Folin ciocalteau phenol 750,770
& 750
[70]
Ascorbic acid 1-Chloro-2,4-
dinitrobenzene
380 [71]
Diltiazem HCl Sodium metavanadate
Bromothymol blue
Bromophenol blue
Bromocresol green
750
415
415
415
[72]
[73]
[73]
[73]
Enalapril maleate KIO3 and KI
p-Chloranilic acid
2,3-Dichloro 5,6-
dicyano1,4-benzoquinone
352
510
565
[74]
[74]
[74]
Iodine 365 [74]
Esomeprazole
magnesium
5-Sulphosalicylic acid 365 [75]
Famotidine KMnO4 in alkaline
medium
610 [76]
Ninhydrin 590 [77]
Irbesartan Potassium iodate and 352 [78]
21
iodide in aqueous medium
Isoxuprine HCl Hydroxylamine
hydrochloride and
cerium(IV) nitrate
380 [79]
L-dopa NaOH 300 [80]
Labetalol HCl Sodium nitroprusside &
hydroxylamine
hydrochloride
695
[81]
4-Amino benzenesulfonic
acid, sodium nitrite and
sodium bicarbonate
395 [82]
Potassium permanganate 605 [83]
Levodopa Ce(IV) nitrate in H2SO4
medium
510 [84]
Lisinopril 7,7,8,8-
Tetracyanoquinodimethane
743 [85]
p-Chloranilic acid 525
[85]
Ninhydrin 595
[86]
Ascorbic acid 530
[86]
N-Bromosuccinimide
Chloranil
353
520
[87]
[87]
Losartan potassium KMnO4 in alkaline
medium
603 [88]
Menadione NaOH in the presence of
amine
450 [89]
Methyldopa Ce(IV) nitrate in H2SO4
medium
550 [90]
Metoprolol tartrate KMnO4 in alkaline
medium
610 [91]
Ninhydrin 595 [92]
Nalidixic acid Persulphate in alkaline
medium
320,390 [93]
Nicorandil Brucine-sulphanilic acid in
H2SO4 medium
410 [94]

22
3-Methyl-2-
benzothiazoline hydrazone
HCl-metol
560 [94]
N-(1-Naphthyl)
ethylenediamine
dihydrochloride
525 [95]
Nifedipine KMnO4 in neutral medium 530 [96]
4-Methyl amino phenol
and K2Cr2O7
525 [97]
Bromocresol green
415 [98]
Bromophenol blue
415 [98]
Bromothymol blue
415 [98]
Eriochrome Black T
520 [98]
KOH in
dimethylsulphoxide
430
[99]
Ammonium molybdate 830 [99]
Norfloxacin KMnO4 in alkaline
medium
603 [100]
Pantoprazole
sodium
Potassium ferricyanide and
ammonium ferric sulphate
725 [101]
Perindopril
erbumine
1-Chloro-2,4-
dinitrobenzene in dimethyl
sulphoxide
420
[102]
Zn(II) and eosin 510 [103]
Ramipril Potassium iodate and
potassium iodide in
aqueous medium
352
[104]
1-Chloro- 2,4
dinitrobenzene
420
[105]
23
Silymarin KMnO4 in neutral medium
3-Methyl-2-
benzothiazoline
hydrazone& potassium
persulphate
530
430
[106]
[107]
Trimethoprim Persulphate in alkaline
medium
355 [108]
Nitrous acid 420 [109]
Verapamil HCl Chloramine T 425 [110]
N-Bromosuccinimide 415 [111]
Potassium metaperiodate 425 [112]
Tropaeolin 000 No.1 400 [112]

24
TABLE 1.4: Analytical characteristics of derivative procedures for determination of
pharmaceutical compounds.
Compound Deriv.
Order
λmax/
(nm)
Linear
range/
µg mL-1
Application
remark
Ref.
Doripenem
1st 324 (0.42-11.30)
× 10-2
Degradation
products
[115]
Estradiol valerate 1st 270 200-400 Tablet [116]
Fluocinolone acetonide 2nd 250-400 0.062–0.312
mM
Solvolysis [117]
Galanthamine hydrobromide Zero 287 30-80 bulk and
pharmaceutical
formulation
[118]
1st 277.4 30-80 bulk and
pharmaceutical
formulation
[118]
Hydrochlorothiazide 1st 233 1-6 Tablet [119]
2nd 231 1-6 Tablet
Pseudoephedrine hydrochloride
2nd 271 200 - 1000
Tablet and
Dissolution
testing
[120]
Triamterene 1st 243 0.75-5 Tablet [119]
2nd 224 0.75-5 Tablet
Triprolidine hydrochloride
2nd 321 10-50
Tablet and
Dissolution
testing
[120]

25
Near infrared spectroscopy (NIRS)
Near infrared spectroscopy is a fast and non-destructive technique that offers
many advantages of industrial applications. The near-infrared (NIR) region (780-2500
nm) is situated between the red band of the visible light and the mid infrared (mid-IR)
region. The NIR signal is a consequence of the absorption of light due to molecular
vibrations (overtones and combinations of fundamental vibrations) of hydrogen bonds
like C-H, N-H, O-H. Within the spheres of pharmaceutical sciences, NIR spectroscopy is
now widely accepted as a valuable analytical tool. It can be assumed that the ICH’s
quality of design [121] and the U.S. Food and Drug Administration’s process analytical
technology (PAT) [122] initiatives laid the cornerstone for the increasing interest of the
pharmaceutical industry in NIR spectroscopy. Thorough reviews on the application of
NIR spectroscopy in pharmaceutical development have been published [123-125].
General aspects of NIR analyses are also described in the Ph.Eur [126] and the USP
[127].
Pharmaceutical Analytical Science Group [128] has written an interesting
document, entitled “Guidelines for the development and validation of NIR spectroscopic
methods”. NIR spectroscopy can be applied to the process that can be either at-line, on-
line or in-line [122] and thus able to provide fast, non-destructive and non-invasive
process information. This development also led to a document of the European Medicine
Agency regarding the use of NIR spectroscopy by the pharmaceutical industry [129]. For
fluid bed and high shear processes, NIR has been applied for the investigation of blend
homogeneity, moisture content and process monitoring [130-132]. There are also
numerous publications reporting the application of NIR for quantification of active
pharmaceutical ingredients. NIR spectroscopy has been used to determine the diclofenac
sodium powder with a root mean square error between one and two percent [133].
Recently, a study investigated the quantification of ibuprofen in sustained release
26
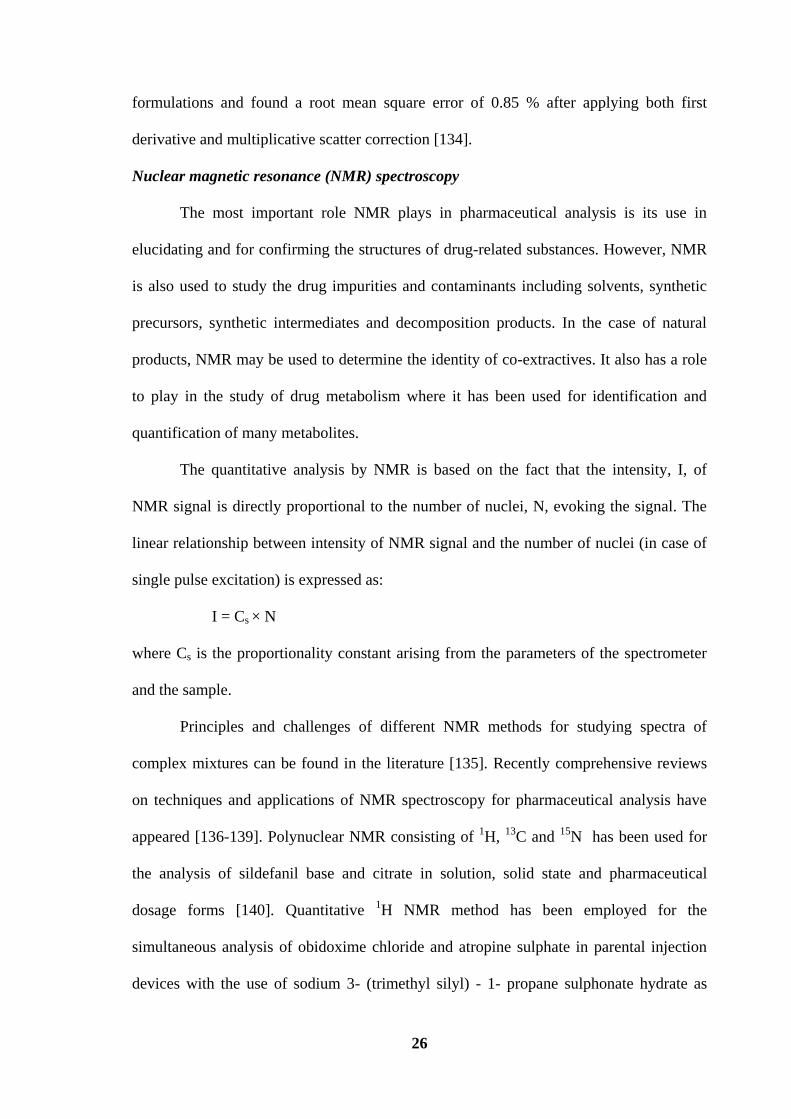
formulations and found a root mean square error of 0.85 % after applying both first
derivative and multiplicative scatter correction [134].
Nuclear magnetic resonance (NMR) spectroscopy
The most important role NMR plays in pharmaceutical analysis is its use in
elucidating and for confirming the structures of drug-related substances. However, NMR
is also used to study the drug impurities and contaminants including solvents, synthetic
precursors, synthetic intermediates and decomposition products. In the case of natural
products, NMR may be used to determine the identity of co-extractives. It also has a role
to play in the study of drug metabolism where it has been used for identification and
quantification of many metabolites.
The quantitative analysis by NMR is based on the fact that the intensity, I, of
NMR signal is directly proportional to the number of nuclei, N, evoking the signal. The
linear relationship between intensity of NMR signal and the number of nuclei (in case of
single pulse excitation) is expressed as:
I = Cs × N
where Cs is the proportionality constant arising from the parameters of the spectrometer
and the sample.
Principles and challenges of different NMR methods for studying spectra of
complex mixtures can be found in the literature [135]. Recently comprehensive reviews
on techniques and applications of NMR spectroscopy for pharmaceutical analysis have
appeared [136-139]. Polynuclear NMR consisting of 1H,
13C and
15N has been used for
the analysis of sildefanil base and citrate in solution, solid state and pharmaceutical
dosage forms [140]. Quantitative 1H NMR method has been employed for the
simultaneous analysis of obidoxime chloride and atropine sulphate in parental injection
devices with the use of sodium 3- (trimethyl silyl) - 1- propane sulphonate hydrate as

27
internal standard [141]. It has been demonstrated [142,143] that 2D diffusion–ordered 1H
NMR spectroscopy (2D DOSY 1H NMR) is an interesting method for the complete
characterization of pharmaceutical formulations. The formulations of tadalafil were
analysed by 1H NMR and 2D DOSY
1H NMR spectroscopy [144].
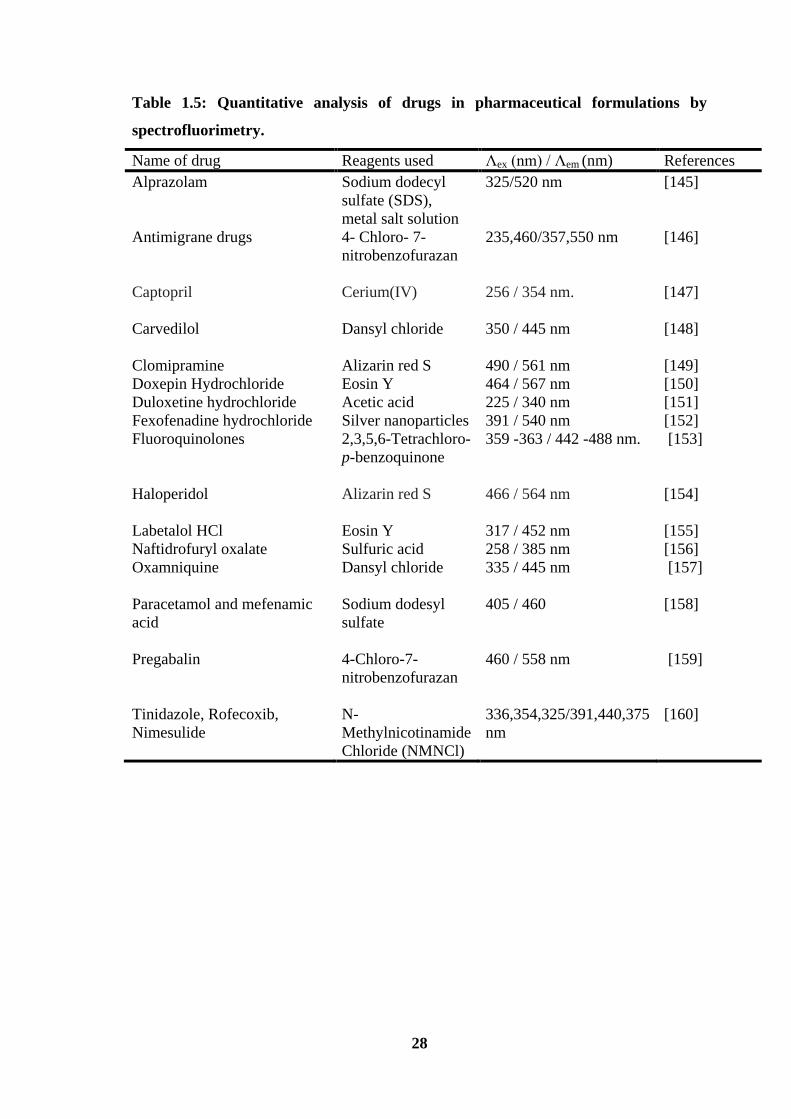
Spectrofluorimetric methods
Fluorescence spectrometry has been firmly established as a sensitive and specific
technique for detection and determination of trace quantities of drugs in pharmaceutical
preparations and biological fluids. The technique involves the measurement of an
enhanced or quenched fluorescent signal of the analyte. Regarding fluorimetric
methodologies, some methods involve chemical reactions while others are based on the
native fluorescence of analytes. One can also distinguish between equilibrium or end
point methods and kinetic methods, the latter include methods involving reaction-rate or
fluorescence life time measurements. Generally a fluorimetric method has the potential of
being 10-100 folds more sensitive than a colorimetric method. Spectrofluorimetry has
been used for determination of active pharmaceutical ingredients in bulk drug and
formulations and details of these methods are recorded in Table 1.5.
Electranalytical methods
Electroanalytical techniques provide high sensitivity with low detection limits and
associated with simple and inexpensive instrumentation. Electrogravimetry, coulometry,
conductometry, polarography, potentiometry, amperometry and voltammetry are
electroanalytical techniques that have been used for the determination of drugs in dosage
forms. Besides their analytical advantages, these techniques play an important role in the
study of pharmacologically active compounds since most of the metabolic pathways
involving these substances are based on redox reactions. However, voltammetric
techniques have been used most commonly for analysis of drugs.
28
Table 1.5: Quantitative analysis of drugs in pharmaceutical formulations by
spectrofluorimetry.
Name of drug Reagents used Λex (nm) / Λem (nm) References
Alprazolam Sodium dodecyl
sulfate (SDS),
metal salt solution
325/520 nm [145]
Antimigrane drugs 4- Chloro- 7-
nitrobenzofurazan
235,460/357,550 nm [146]
Captopril
Cerium(IV)
256 / 354 nm.
[147]
Carvedilol Dansyl chloride 350 / 445 nm [148]
Clomipramine Alizarin red S 490 / 561 nm [149]
Doxepin Hydrochloride Eosin Y 464 / 567 nm [150]
Duloxetine hydrochloride Acetic acid 225 / 340 nm [151]
Fexofenadine hydrochloride Silver nanoparticles 391 / 540 nm [152]
Fluoroquinolones 2,3,5,6-Tetrachloro-
p-benzoquinone
359 -363 / 442 -488 nm.
[153]
Haloperidol Alizarin red S 466 / 564 nm
[154]
Labetalol HCl Eosin Y 317 / 452 nm [155]
Naftidrofuryl oxalate Sulfuric acid 258 / 385 nm [156]
Oxamniquine Dansyl chloride 335 / 445 nm [157]
Paracetamol and mefenamic
acid
Sodium dodesyl
sulfate
405 / 460 [158]
Pregabalin
4-Chloro-7-
nitrobenzofurazan
460 / 558 nm [159]
Tinidazole, Rofecoxib,
Nimesulide
N-
Methylnicotinamide
Chloride (NMNCl)
336,354,325/391,440,375
nm
[160]
29
Comprehensive reviews on the application of these techniques for drug analysis have
appeared in the literature [161-164]. The most commonly used voltammetric techniques
are linear sweep voltammetry (LSV), differential pulse voltammetry (DPV) and square
wave voltammetry (SWV). The sensitivity of voltammetric techniques can be
significantly improved by using a preconcentration step before voltammetric scan. This
procedure is called stripping voltammetric techniques. Several materials can be used as
working electrode in voltammetric techniques and they can be classified into two groups:
(i) Mercury electrodes (dropping mercury electrode, DME, and hanging mercury
drop electrode, HMDE),
(ii) Solid electrodes such as platinum, gold, glassy carbon and carbon paste
electrodes.
Voltammetric techniques are especially useful for drug analyses in dosage forms because
most of the pharmacologically active compounds have electroactive groups. On the other
hand, excipients are ususlly non-electroactive compounds. Therefore, voltammetric
techniques can be directly employed for drug quantification in dosage forms by simply
dissolving the sample in an appropriate solvent without any additional pretreatment. The
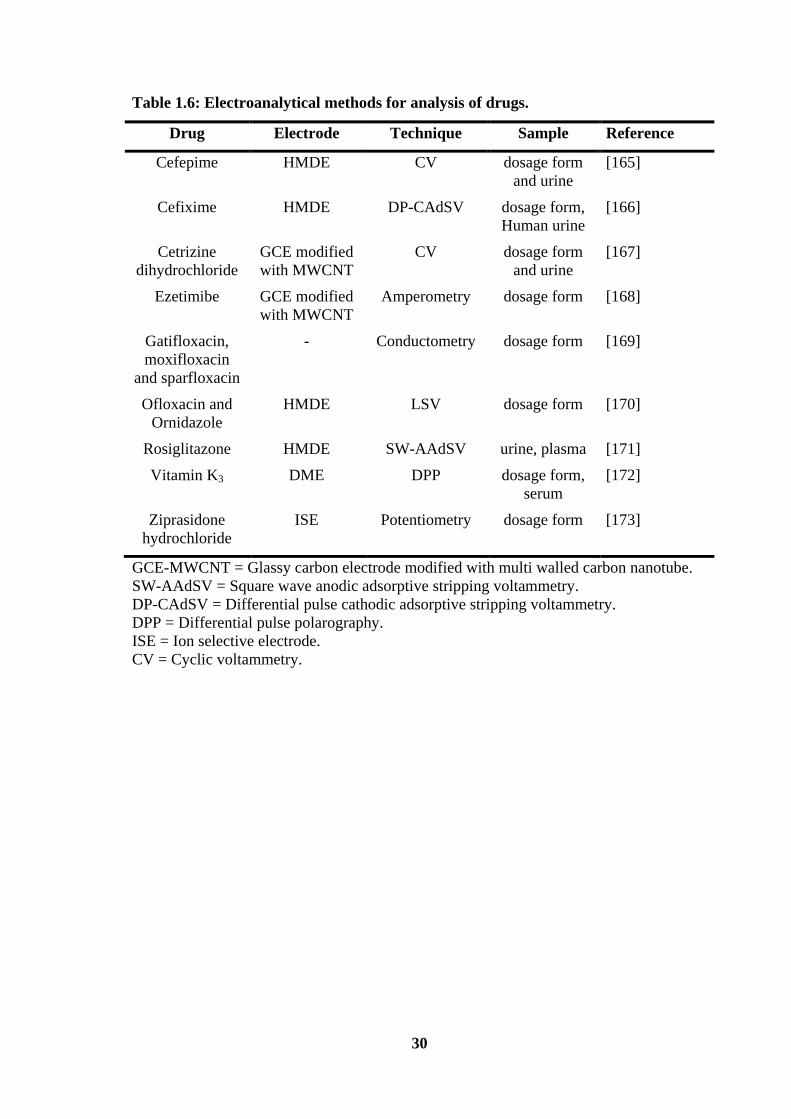
application of electroanalytical techniques for quantification of drugs is presented in
Table 1.6.
The present thesis deals with development of new analytical methods for the
determination of Haloperidol, Doxepin hydrochloride, Amitriptyline hydrochloride and
Perindopril erbumine in pharmaceutical preparations.
30
Table 1.6: Electroanalytical methods for analysis of drugs.
Drug Electrode Technique Sample Reference
Cefepime HMDE CV dosage form
and urine
[165]
Cefixime HMDE DP-CAdSV dosage form,
Human urine
[166]
Cetrizine
dihydrochloride
GCE modified
with MWCNT
CV dosage form
and urine
[167]
Ezetimibe GCE modified
with MWCNT
Amperometry dosage form [168]
Gatifloxacin,
moxifloxacin
and sparfloxacin
- Conductometry dosage form [169]
Ofloxacin and
Ornidazole
HMDE LSV dosage form [170]
Rosiglitazone HMDE SW-AAdSV urine, plasma [171]
Vitamin K3 DME DPP dosage form,
serum
[172]
Ziprasidone
hydrochloride
ISE Potentiometry dosage form [173]
GCE-MWCNT = Glassy carbon electrode modified with multi walled carbon nanotube.
SW-AAdSV = Square wave anodic adsorptive stripping voltammetry.
DP-CAdSV = Differential pulse cathodic adsorptive stripping voltammetry.
DPP = Differential pulse polarography.
ISE = Ion selective electrode.
CV = Cyclic voltammetry.

31
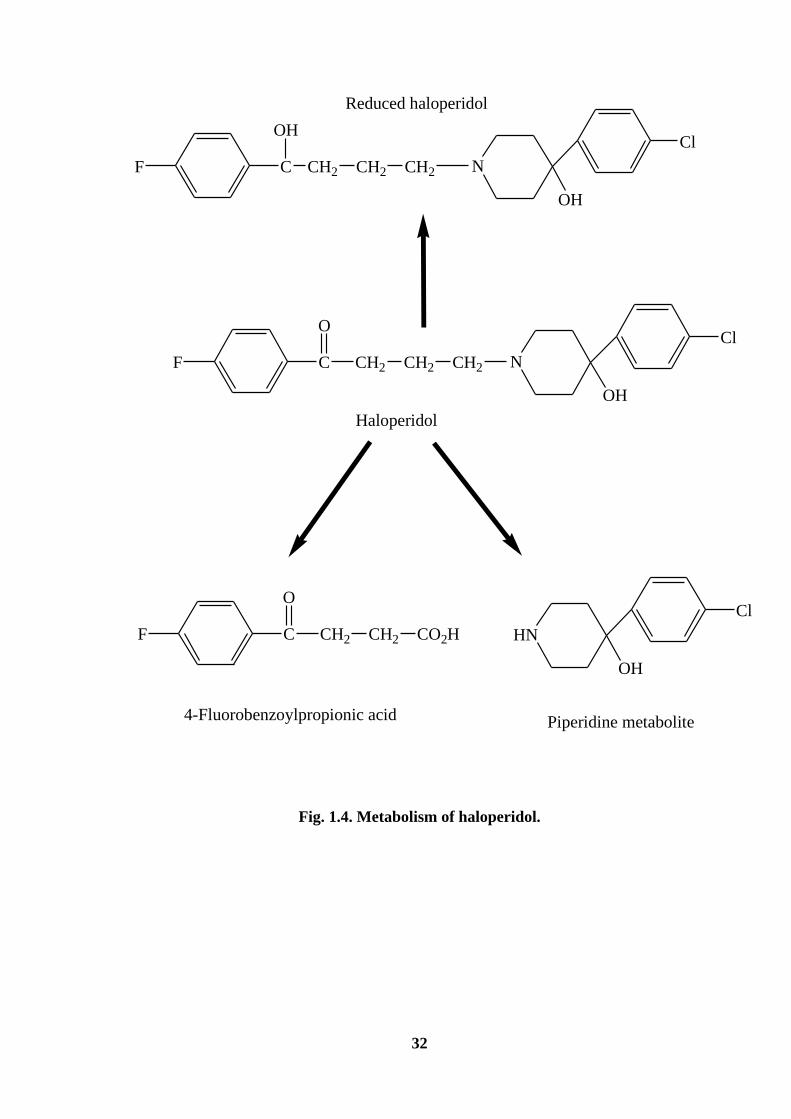
HALOPERIDOL
Haloperidol, 4-[4-(4-chlorophenyl)-4- hydroxy-1-piperidinyl]-1-(4-fluorophenyl)
butan-1-one, is a typical butyrophenone antipsychotic drug. It is used in the treatment of
chronic Schizophrenia and acute psychotic states and delirium [174]. It is an odourless
white to pale yellow crystals or white powder with the molecular weight of 375.87.
Haloperidol is practically insoluble in water, slightly soluble in alcohol, methanol and
methylene chloride. It is commercially available as tablets and injections. The
recommended dose varies based on the indication, usually found to be 5-15 mg per day
with an average of 10 mg per day. Haloperidol has a pKa value of 8.3. It should be stored
in tight and light resistant containers. Haloperidol is metabolized to several metabolites
(Fig. 1.4) and the enzyme involved in the biotransformation of haloperidol include
cytochrome P450, carbonyl reductase and uridine diphosphoglucose glucuronosyl
transferase [175]. The greatest proportion of the intrinsic hepatic clearance of haloperidol
is by glucuronidation followed by the reduction of haloperidol to reduced haloperidol and
by cytochrome P450-mediated oxidation [176].
The drug is noted for its strong early and late extrapyramidal side effects. The risk
of facial disfiguring tardive dyskinesia is around 4 % per year in younger patients. In the
patients over the age of 45, the percentage of those afflicted can be even higher. Other
side effects include dry mouth, lethargy, restlessness of akathisia, muscle-stiffness,
muscle-cramping and weight gain. Such side effects occur more likely when drug is
given in high doses and/or during long term treatment.
32
F C
OH
CH2 CH2 CH2 N
Cl
OH
Reduced haloperidol
F C
O
CH2 CH2 CH2 N
Cl
OH
Haloperidol
F C
O
CH2 CH2 CO2H HN
Cl
OH
4-Fluorobenzoylpropionic acid Piperidine metabolite
Fig. 1.4. Metabolism of haloperidol.
33
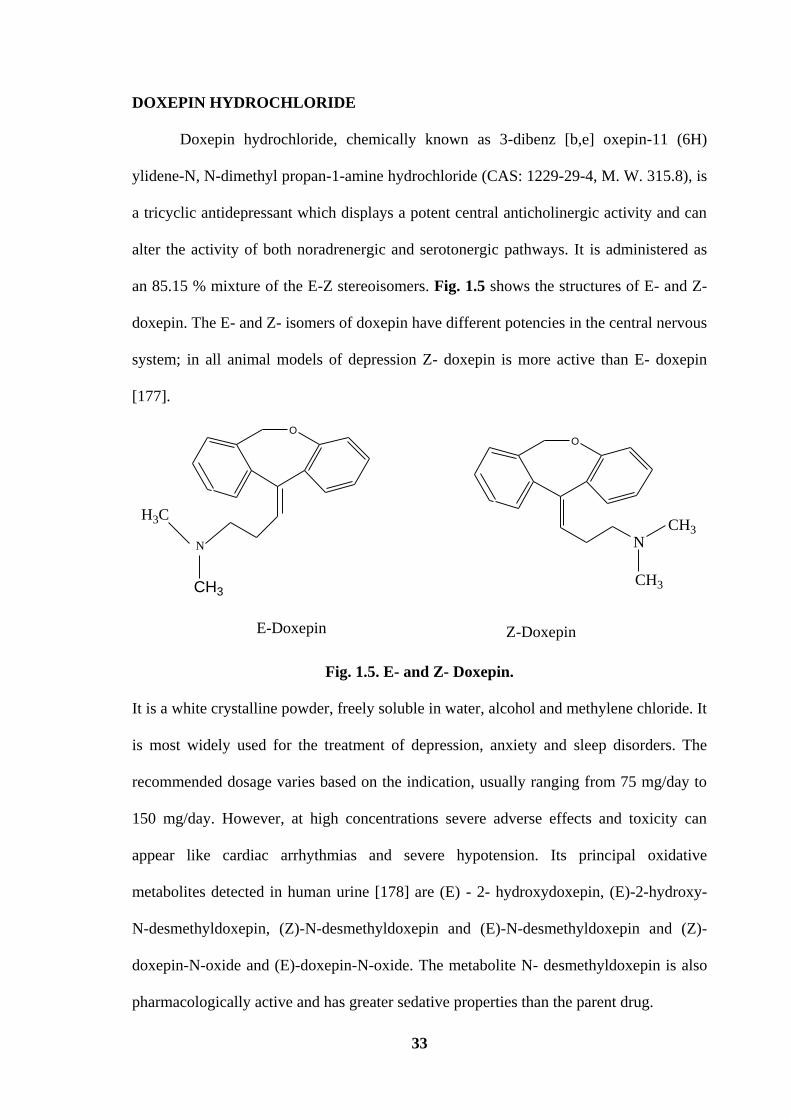
DOXEPIN HYDROCHLORIDE
Doxepin hydrochloride, chemically known as 3-dibenz [b,e] oxepin-11 (6H)
ylidene-N, N-dimethyl propan-1-amine hydrochloride (CAS: 1229-29-4, M. W. 315.8), is
a tricyclic antidepressant which displays a potent central anticholinergic activity and can
alter the activity of both noradrenergic and serotonergic pathways. It is administered as
an 85.15 % mixture of the E-Z stereoisomers. Fig. 1.5 shows the structures of E- and Z-
doxepin. The E- and Z- isomers of doxepin have different potencies in the central nervous
system; in all animal models of depression Z- doxepin is more active than E- doxepin
[177].
O
N
CH3
H3C
O
N
CH3
CH3
E-Doxepin Z-Doxepin
Fig. 1.5. E- and Z- Doxepin.
It is a white crystalline powder, freely soluble in water, alcohol and methylene chloride. It
is most widely used for the treatment of depression, anxiety and sleep disorders. The
recommended dosage varies based on the indication, usually ranging from 75 mg/day to
150 mg/day. However, at high concentrations severe adverse effects and toxicity can
appear like cardiac arrhythmias and severe hypotension. Its principal oxidative
metabolites detected in human urine [178] are (E) - 2- hydroxydoxepin, (E)-2-hydroxy-
N-desmethyldoxepin, (Z)-N-desmethyldoxepin and (E)-N-desmethyldoxepin and (Z)-
doxepin-N-oxide and (E)-doxepin-N-oxide. The metabolite N- desmethyldoxepin is also
pharmacologically active and has greater sedative properties than the parent drug.
34
AMITRIPTYLINE HYDROCHLORIDE
Amitriptyline is a tricyclic antidepressant with sedative properties. It is chemically
described as {3-(10,11-dihydro-5H-dibenzo[a,d] cyclohepten-5-ylidene)-N,N-dimethyl-1-
propanamine hydrochloride}. The steps involved (Fig. 1.6) in the synthesis of
amitriptyline are:
(i) cyclization of dibenzyl-o-carboxylic acid (I) by means of polyphosphoric acid at
170°C leads to 10, 11-dihydro-5H-dibenzo [a, d] cyclohepten-5-one (II);
(ii) the treatment of II with 3-dimethylamino propyl magnesium yields the corresponding
tertiary carbinol (III);
(iii) the dehydration of III with acetic anhydride or acetyl chloride in chloroform results
in amitriptyline (IV).
Amitriptyline hydrochloride [CAS No. 549-18-8] is a white, colourless, crystalline
compound with the molecular weight of 313.87. It is freely soluble in water. Chemically
it is basic (log k of 9.42), and hydrophobic (logPo/w of 4.64). Amitriptyline is metabolized
mainly by demethylation forming nortriptyline (Fig. 1.7), and by hydroxylation, leading
to the formation of E-10-hydroxy (EHAT) and Z-10-hydroxyamitriptyline (ZHAT).
Nortriptyline is further demethylated to desmethylnortriptyline (NNT) and hydroxylated
to E-10-hydroxy nortriptyline (EHNT) and Z-10-hydroxynortriptyline (ZHNT). The
demethylation of amitriptyline and nortriptyline is mainly catalysed by CYP2C19, with
the participation of other CYP enzyme forms in higher drug concentrations. The
formation of E-10-hydroxy metabolites is dependent on the activity of CYP2D6, with
stereospecificity to the (-)-EHAT and (-)-EHNT metabolites.

35
Fig. 1.6. Synthesis of amitriptyline.
NCH3
Amitriptyline
CYP2D6
CYP2C19
N
CH3
EHATCH3
CH3
NH3C
H3C
ZHAT
CYP2C19
CYP2C19
NCH3
H
Nortriptyline
CYP2D6
N
CH3
HEHNT
NH3C
H3C
ZHNT
CYP2C19
NH
H
NNT
HO
HOHO
HO
Fig. 1.7. Main metabolite pathways of amitriptyline.
36
. Pharmacokinetics of this drug is related to absorption and elimination in plasma.
Peak plasma concentration occurs within 2 to 12 h after oral administration. The plasma
half-life of amitriptyline ranges from 10 to 50 h. Doses of upto 200 mg daily to 300 mg
daily have been used in severely depressed patients. Approximately 25-50 % of a dose is
excreted in urine as inactive metabolites within 24 h, and small amounts are excreted in
faeces via biliary elimination.
PERINDOPRIL ERBUMINE
Perindopril erbumine is a new member of angiotensin-converting enzyme
inhibitors group. It is chemically known as (2S, 3aS, 7aS)-1-[(S)-N-[(S)-1-carboxybutyl]
alanyl] hexahydro-2-indolinecarboxylic acid, 1-ethylester, compound with tert-
butylamine (1:1). It is a white crystalline powder which is freely soluble in water, alcohol
and chloroform. Perindopril is a pro drug and metabolized in vivo by hydrolysis of the
ester group to form perindoprilat, the biologically active metabolite. It is safely
administered for the treatment of hypertension [179]. According to the dose response
studies [180], the recommended dose to be used in hypertensive patients is 4 mg once a
day that could be increased to 8 mg once a day if necessary. The commercial tablets
contain 2 mg, 4 mg or 8 mg of perindopril for oral administration. In addition to
perindopril erbumine, each tablet contains the inactive ingredients such as colloidal silica,
lactose, magnesium stearate and microcrystalline cellulose. Following oral
administration, perindopril is rapidly absorbed and metabolized; only 4-12 % of the dose
is recovered unchanged in urine. The degradation products [181] of perindopril erbumine
include perindoprilat, Y31. Y32, and Y33, but they can also be present as impurities from
the synthesis route. The structural formulae and IUPAC names of these impurities are
given below (Fig. 1.8):

37
H3C O
H3C N
O
H
CH3
O
NH
H
COOH,
(9)(11)
(7a) (2)
NH2
CH3
CH3
3(a)
Perindopril erbumine
(2a,3aS,7aS)-1-((S)-N-((S)-1-(ethoxycarbonyl)alanyl)octahydro-1H-indole-2-carboxylic acid,ter-butylamine salt
N
O
N
O
O
O CH3
CH3
CH3H
H
N
O
N
O
O
OH
CH3
CH3H
H
H
Impurity Y 31
H
Impurity Y 32
N
O
N
O
O
OH
CH3
CH3H
H H
Impurity Y 33
((2S)-2-((2S,4aS,5aS,9aS)-2-methyl-1,4-dioxooctahydro-1H-indolo(1,2-a)piperazin-3-yl)pentanoic acid
((2S)-2-((2S,4aR,5aS,9aS)-2-methyl-1,4-dioxooctahydro-1H-indolo(1,2-a)piperazin-3yl) pentanoic acid
((2S)-ethyl(2-((2S,4aS,5aS,9aS)-2-methyl-1,4-dioxooctahydro-1H-indolo(1,2-a)piperazin-3yl)pentanoate
CH3
Fig. 1.8. Structures of perindopril erbumine and its impurities.

38
REFERENCES
[1] H.J. Barber, Historical aspects of chemotherapy, May and Baker Ltd., (1978),
Dagenham, UK.
[2] O. Shakoor, R.B. Taylor and R.R. Moody, Analyst 120 (1995) 2191.
[3] S. Foster, Soc. Sci. Med. 32 (1991) 1201.
[4] M.T. Ham, Adverse drug React. Toxicol. Rev. 11 (1992) 59.
[5] S. K. Pandya, Br. Med. J. 297 (1988) 117.
[6] M.M. Silverman, M. Lydecker and P.R. Lee, Int. J. Health Services 20 (1990)
561.
[7] International Conference on Harmonization (2000) Draft Revised Guidance On
Impurities In New Drug Substances. Federal Register Q3A(R) 65 (140): 45085.
[8] International Conference on Harmonization (2000) Draft Revised Guidance On
Impurities In New Drug Products. Federal Register Q3B(R) 65 (139) 44791.
[9] International Conference on Harmonization (1997) Impurities, Q3C Guidelines
for Residual Solvents, Q3C. Federal Register 62 (247) 67377.
[10] International Conference on Harmonization (1999) Specifications, Q6A: Test
Procedures and Acceptance Criteria for New Drug Substances and New Drug
Products. Chemical substances 65 (146) 67488.
[11] S. Ahuja, Impurities Evaluation of Pharmaceuticals. Marcel Dekker, New York,
(1998), p. 142.
[12] T.N. Riley, Steric aspects of drug action. Pharmacist 23 (1998) 40.
[13] International Conference on Harmonization (1997) Impurities, Q3C Guidelines
for Residual Solvents, Q3C. Federal Register 62 (247) 67377.
[14] F.M. Dayril and M.C. Dumlao, Forensic Sci. Int. 144 (2004) 29.
39
[15] V. Buhler, Vademecum for Vitamin Formulation. Stuttgart, Germany, Wiss,
Verl-Ges., 142 (1998) 36.
[16] J. Roy, M. Islam, A.H. Khan, S.C. Das, M. Akhteruzzaman, A.K. Deb and A.H.
Alam, J. Pharma. Sci. 90 (2001) 541.
[17] J. Roy, M. Mahmud, A. Sobhan, M. Aktheruzzaman, M. Al-Faooque and E. Ali,
Drug Dev. Ind. Pharm. 20 (1994) 2157.
[18] S.L. Hoerle, K.D. Evans and B.G. Snider, HPLC Determination of Impurities in a
3rd Generation Cephalosporine, Eastern Analytical Symposium, November 16-
20, Somerset, New Jersey, (1992), p. 12.
[19] M. Gazdag, M. Babjag, J. Brlik, S. Maho, Z. Tuba and S. Gorog, J. Pharm.
Biomed. Anal. 17 (1998) 1029.
[20] A. Smith, P.M. Pennefather, S.B. Kaye and C.A. Hart, Indian Drugs 61 (2001)
747.
[21] N.R. Rao, S.S. M. Kiran and N.L. Prasanthi, Indian J. Pharm. Educ. Res. 44
(2010) 301.
[22] K. Valko (ed), In: Handbook of analytical separation, vol. 1. Elsevier,
Amsterdam, (2000).
[23] J. Pawliszyn (ed), In: Comprehensive analytical chemistry, vol XXXVII. Elsevier,
Amsterdam, (2002).
[24] D.A. Wells In: Progress in pharmaceutical and biomedical analysis, vol. 5.
Elsevier, Amsterdam, (2003).
[25] G. Hempel (ed), In: Handbook of analytical separations vol 5. Elsevier,
Amsterdam, (2004).
[26] The European Pharmacopoeia, 4th
edn., Council of Europe, Strasbourg, (2002).
40
[27] United States Pharmacopoeia, 27th
edn., The USP Convention Inc., Rockville,
MD (2004).
[28] N.R. Prasad, Chemical industry and chemical engineering quarterly 17 (2011) 99.
[29] K.B. Vinay, H.D. Revanasiddappa, N. Rajendraprasad, M.S. Raghu, P.J. Ramesh,
C.M. Xavier and K. Basavaiah, J. Preclin. Clin. Res. 4 (2010) 019.
[30] A. Joseph and A. Rustum, J. Pharm. Biomed. Anal. 51(2010) 521.
[31] M.J. Skibic, L.A. King, M. Khan, P.J. Fox, B.E. Winger and S.W. Baertschi, J.
Pharm. Biomed. Anal. 53 (2010) 432.
[32] M.S. Elmasry, I.S. Blagbrough, M.G. Rowan, H.M. Saleh, A.A. Kheir and P.J.
Rogers, J. Pharm. Biomed. Anal. 54 (2011) 646.
[33] V. K. Chakravarthy and D.G. Shankar, Rasayan J. Chem. 4 (2011)165.
[34] J.W. Collier, R.B. Shah, A.R. Bryant, M.J. Habib, M.A. Khan and P.J. Faustino,
J. Pharm. Biomed. Anal. 54 (2011) 433.
[35] I.I. Salem, M. Alkhatib and N. Najib, J. Pharm. Biomed. Anal. Article in press
(2011), doi:10.1016/j.jpba.2011.07.020
[36] L. Chytil, B. Strauch, J. Cvacka, V. Maresova, J.W. Jr, R. Holaj and O. Slanar, J.
chromatogr. B 878 (2010) 3167.
[37] Yan-Hui Wang, C. Qiu, Da-Wei Wang, Zheng-Fang Hu, Bo-Yang Yu and Dan-
Ni Zhu, J. Pharm. Biomed. Anal. 54 (2011) 1110.
[38] S. Geenen, F. Michopoulos, J.G. Kenna, K.L. Kolaja, H.V. Westerhoff and I.
Wilson, J. Pharm. Biomed. Anal. 54 (2011) 1128.
[39] A. D’Avolio, M. Simiele, M. Siccardi, L. Baietto, M. Sciandra, V. Oddone, F.R.
Stefani, S. Agati, J. Cusato, S. Bonora and G.D. Perri. J. Pharm. Biomed. Anal. 54
(2011) 779.
[40] J. He, T. Qin, J. Wen, F. Qin and F. Li, J. Pharm. Biomed. Anal. 54 (2011) 551.
41
[41] M. Indupriya, R.S. Chandan, B.M. Gurupadayya and K. Sowjanya, Int. J. Pharm.
Tech. 3 (2011) 1694.
[42] A. Subasranjan, P. Suresh, C. Srinivasulu and R. Hemant, Int. J. Pharm. Tech. 2
(2010) 182.
[43] H. Liu, Q. Tang, R.J. Markovich and A.M. Rustum, J. Pharm. Biomed. Anal. 54
(2011) 417.
[44] G. Szepesi and S. Nyiredy, Pharmaceutical and drugs. in: J. Sherma, B. Fried
(Eds.). Handbook of Thin-Layer chromatography, 2nd
edn., Marcel Dekker, New
York, (1996) p. 208.
[45] K. Ferenczi-Fodor, Z. Vegh and B. Renger, J. Chromatogr. A 1218 (2011) 2722.
[46] J.M. Płotka, C. Morrison and M. Biziuk, Trends Anal. Chem. 30 (2011) 1139.
[47] V.P. Choudhari1 and A.P. Nikalje, Chromatographia 70 (2009) 309.
[48] H.N. Dave, R.C. Mashru and A.K. Patel, J. Pharm. Sci. Res. 2 (2010) 143.
[49] M. Jelen, B. Morak-Mlodawska and K. Pluta, J. Pharm. Biomed. Anal. 55 (2011)
466.
[50] S.M. Pawar, B.S. Patil and R.Y. Patil, Int. J. Adv. Pharm. Sci. 1 (2010) 52.
[51] D.H. Shewiyo, E. Kaale, C. Ugullum, M.N. Sigonda, P.G. Risha, B. Dejaegher, J.
Smeyers–Verbeke and Y. Vander Heyden , J. Pharm. Biomed. Anal. 54 (2011)
445.
[52] D.C. Oliva, K.T. Velez and A.L.R. Vazquez, J. Mex. Chem. Soc. 55 (2011) 79.
[53] Yu-Shan Huang, Shun-Niang Chen andChen-Wen Whang, Electrophoresis 32
(2011) 2155.
[54] U. Franzen, C. Vermehren, H. Jensen and J. Ostergaard, Electrophoresis 32
(2011) 738.
[55] F.S. Felix, C.M.A. Brett and L. Angnes, Talanta 78 (2008) 128.

42
[56] D. Yeniceli, D. Dogrukol-Ak and M. Tuncel, J. Pharm. Biomed. Anal. 36 (2004)
145.
[57] A.F. Lavorante, C.K. Pires and B.F. Reis, J. Pharm. Biomed. Anal. 42 (2006) 423.
[58] H.P.A. Nouws, C. Delerue-Matos, A.A. Barros, J.A. Rodriguez and A. Santos-
Silva, Anal. Bioanal. Chem. 382 (2005) 1662.
[59] P. Norouzi, M.R. Ganjali and P. Matloobi, Electrochem. Commun. 7 (2005) 333.
[60] I.F. Al-Momani, A.T. Haj-Hussein and A.N. Tahtamouni, J. Flow Injection Anal.
25 (2008) 151.
[61] J. Ruzicka and G.D. Marshall, Anal. Chim. Acta 237 (1990) 329.
[62] Y. M. Issa and A.F. Khorshid, J. Adv. Res. 2 (2011) 25.
[63] P. Vinas, C. Lopez-Erroz, F.J. Cerdan, N. Campillo and M. Hermandez-Cordoba,
Mikrochim. Acta 134 (2000) 83.
[64] S.Z. Qureshi, A. Saeed and N. Rahman, Chem. Anal. (Warsaw) 37 (1992) 227.
[65] N. Rahman, N.A. Khan and S.N.H. Azmi, Anal. Sci. 20 (2004) 1231.
[66] N. Rahman and S.N.H. Azmi, Anal. Sci. 16 (2000) 1353.
[67] N. Rahman and S.N. H. Azmi, IL Farmaco 56 (2001) 731.
[68] N. Rahman and M.N. Hoda, J. Pharm. Biomed. Anal. 31 (2003) 381.
[69] M.I.H. Helaleh, N. Rahman and R.M.A. Q. Jamhour, Chem. Anal. (Warsaw)
42 (1997) 261.
[70] A.S. Ahmad, N. Rahman and F. Islam, J. Anal. Chem. 59 (2004) 119.
[71] S.Z. Qureshi, A. Saeed, S. Haq and N. Rahman, Anal. Lett. 23 (1990) 995.
[72] N. Rahman and S.N.H. Azmi, Microchem. J. 65 (2000) 39.
[73] N. Rahman and S.N.H.Azmi, J. Pharm. Biomed. Anal. 24 (2000) 33.
[74] N. Rahman and S.M. Haque, Anal. Chem. Insights 3 (2008) 31.
[75] N. Rahman, Z. Bano and S.N.H. Azmi, J. Chin. Chem. Soc. 55 (2008) 557.
43
[76] N. Rahman and M. Kashif, Anal. Sci. 19 (2003) 907.
[77] N. Rahman and M. Kashif, IL Farmaco 58 (2003) 1045.
[78] N. Rahman, M.R. Siddiqui and S.N.H. Azmi, Chem. Pharm. Bull. 54 (2006) 626.
[79] N. Rahman and N.Afaq, Drug testing and Anal. 2 (2010) 442.
[80] M.I.H. Helaleh, N. Rahman, R.M.A.Q. Jamhour and E.S.M.A. Nameh, J. Pharm.
Biomed. Anal. 16 (1997) 269.
[81] N. Rahman, M. Singh and M.N. Hoda, Chin. J. Chem. 23 (2005) 1.
[82] N. Rahman, H. Rahman and S.N.H. Azmi, J. Chin. Chem. Soc. 54 (2007) 185.
[83] N. Rahman, N. Anwar, M. Kashif, M.M. Hoda and H. Rahman, J. Mex. Chem.
Soc. 55 (2011) 105.
[84] M.I.H. Helaleh, N. Rahman and E.S.M.A. Nameh, Anal. Sci.13 (1997) 1007.
[85] N. Rahamn, N. Anwar and M. Kashif, IL Farmaco 60 (2005) 605.
[86] N. Rahman, M. Singh and M.N. Hoda, J. Braz. Chem. Soc. 16 (2005) 1001.
[87] N. Rahman, M.R. Siddiqui and S.N.H. Azmi, Chem. Anal. (Warsaw) 52(2007)
465.
[88] N. Rahman, M.R. Siddiqui and S.N.H. Azmi, J. Chin. Chem. Soc. 53 (2006) 735.
[89] M.I.H. Helaleh, N. Rahman and R.M.A.Q. Jamhour, Annali di chim. (Rome) 86
(1996) 509.
[90] N. Rahman, Y. Ahmad and S.N.H. Azmi, Chem. Anal. 50 (2005) 769.
[91] N. Rahman, H. Rahman and S.N.H. Azmi, Chem. Pharm. Bull. 53 (2005) 942.
[92] N. Rahman, Y. Ahmad and S. N. H. Azmi, Chem. Anal. 50 (2005) 769.
[93] M. I. H. Helaleh, S. Z. Qureshi, N. Rahman and R. M. A. Q. Jamhour, Acta Pol.
Pharm. Drug Research 54 (1997) 111.
[94] N. Rahman, N.A. Khan and S.N.H Azmi, IL Farmaco 59 (2004) 519.
[95] N. Rahman, M.R. Siddiqui and S.N.H. Azmi, Yakugaku Zasshi 127 (2007) 367.
44
[96] N. Rahman and S.N.H. Azmi, Acta Pharm. (Zagreb) 49 (1999) 113.
[97] N. Rahman and M.N. Hoda, IL Farmaco 57 (2002) 435.
[98] N. Rahman, N.A. Khan and S.N.H. Azmi, IL Farmaco 59 (2004) 47.
[99] N. Rahman and S.N.H. Azmi, Acta Biochim. Pol. 52 (2005) 915.
[100] N. Rahman, Y. Ahmad and S.N.H. Azmi, Eur. J. Pharm. Biopharm. 57 (2004)
359.
[101] N. Rahman, Z. Bano and S.N.H. Azmi, Anal. Sci. 22 (2006) 983.
[102] N. Rahman, N. Anwar and M. Kashif, Chem. Pharm. Bull. 54 (2006) 33.
[103] N. Rahman and H. Rahman, Spectroscopy 25 (2011) 123.
[104] N. Rahman, Y. Ahmad and S.N.H. Azmi, AAPS Pharm. Sci. Tech. 06 (2005) 543.
[105] N. Rahman, H. Rahman and S.N.H. Azmi, Inter. J. Pharm. Biomed. Sci. 2 (2007)
52.
[106] N. Rahman, N.A. Khan and S.N.H. Azmi, Pharmazie 59 (2004) 112.
[107] N. Rahman, Y. Ahmad and S.N.H. Azmi, Can. J. Anal. Sci. Spec. 50 (2005) 116.
[108] S.Z. Qureshi, M.I.H. Helaleh, N. Rahman and R.M.A.Q. Jamhour, Fresenius J.
Anal. Chem. 357 (1997) 1005.
[109] S.Z. Qureshi, M.I.H. Helaleh, N. Rahman and, R.M.A.Q. Jamhour, Chem. Anal.
(Warsaw) 42 (1997) 65.
[110] N. Rahman and M.N. Hoda, Anal. Bioanal. Chem. 374 (2002) 484.
[111] N. Rahman and S.N.H. Azmi, IL Farmaco 59 (2004) 529.
[112] N. Rahman, N.A. Khan and S.N.H. Azmi, Sci. Asia 31(2005) 341.
[113] T.C.O. Haver, Anal. Chem. 51 (1979) 91 A.
[114] A.F. Fell, Quality control of Steroids in Pharmaceutical Formulations by Higher
Derivative Spectroscopy, in Advances in Steroids Analysis, S. Gorog, (Ed.);
Elsevier, Amsterdam, (1982), p. 495.
45
[115] J. Cielecka-Piontek and A. Jelinska, Spectrochim. Acta A 77 (2010) 554.
[116] A.S.L. Mendez, L. Deconto and C.V. Garcia, Quim. Nova 33 (2010) 981.
[117] B. Markovic, S. Vladimirov, O. Cudina, V. Savic and K. Karljikovic-Rajic,
Spectrochim. Acta A 75 (2010) 930.
[118] K. Mittal1, R. Kaushal, R. Mashru and A. Thakkar, J. Biomed. Sci. Eng. 3 (2010)
439.
[119] K. Mohammadpour, M.R. Sohrabi and A. Jourabchi, Talanta 81 (2010) 1821.
[120] L. Sriphong, A. Chaidedgumjorn, K. Chaisuroj, World Academy of Science,
Engineering and Technology 55 (2009) 573.
[121] International Conference on Harmonization of Technical Requirements for
registration of Pharmaceuticals for Human Use 2009: Topic Q8 (R2):
Pharmaceutical Development.
[122] U.S. Food and Drug Administration 2004: Guidance for industry. PAT- A frame
work for Innovative Pharmaceutical Development, Manufacturing, and Quality
Assurance.
[123] M. Blanco, J. Coello, H. Iturriaga, S. Maspoch and C. de la Pezuela, Analyst 123
(1998) 135 R.
[124] E. Rasanen and N. Sandler, J. Pharm. Pharmacol. 59 (2007) 147.
[125] J. Luypaert, D.I. Massart and Y.V. Heyden, Talanta 72 (2007) 865.
[126] The Eurapean Pharmacopoeia, 5th
edn., Council of Europe, Strasbourg (2004).
[127] The United States Pharmacopoeia, 26th
edn., NF 22 (2003).
[128] Pharmaceutical Analytical Science Group, NIR sub Group, Guidelines for the
development and validation of Near Infrared Spectroscopic methods,
(http://www.pasg.org.uk/NIR/NIR) Guidelines Oct. 01. Pdf (2001).
46
[129] European Medicines Agency 2009: Draft Guideline on the use of Near Infrared
spectroscopy by the pharmaceutical Industry and the Data Requirements for New
submissions and Variations revision 1.
[130] Y. Sulub, B. Wabuyele, P. Gargiulo, J. Pazdan, J. Cheney, J. Berry, A. Gupta, R.
Shah, H.Q. Wu and M. Khan, J. Pharm. Biomed. Anal. 49 (2009) 48.
[131] Y. Zheng, X. Lai, S.W. Bruun, H. Ipsen, J.N. Larsen, H. Lowenstein, I.
Sondergaard and S. Jacobsen, J. Pharm. Biomed. Anal. 46 (2008) 592.
[132] A.U. Vanarase, M. Alcala, J. Rozo, F.J. Muzzio and R.J. Romanach, Chem. Eng.
Sci. 65 (2010) 5728.
[133] B. Whang, G.L. Liu, Y. Dou, L.W. Liang, H.T. Zhang and Y.L. Ren, J. Pharm.
Biomed. Anal. 50 (2009) 158.
[134] X.L. Wang, Q.A. Fu, J.F. Shang, X. Yang, J.Z. Jia and W. Du, Vib. Spectros. 53
(2010) 214.
[135] R. Novoa-Carballal, E. Fernandez-Megia, C. Jimenez and R. Riguera, Nat. Prod.
Rep. 28 (2011) 78.
[136] U. Holzgrabe, Prog. Nucl. Mag. Res. Spectros. 57 (2010) 229.
[137] M. Malet-Matrino and U. Holzgrabe, J. Pharm. Biomed. Anal. 55 (2011) 1.
[138] U. Holzgrabe and M. Malet-Martino, J. Pharm. Biomed. Anal. 55 (2011) 679.
[139] H. Therien-Aubin and X.X. Zhu, Carbohydrate Polymers 75 (2009) 369.
[140] I. Wawer, M. Pisklak and Z. Chilmonczyk, J. Pharm. Biomed. Anal. 38 (2005)
865.
[141] R. Sharma, P.K. Gupta, A. Mazumder, D.K. Dubey, K. Ganesen and R.
Vijayaraghavan, J. Pharm. Biomed. Anal. 49 (2009) 1092.
[142] S. Trefi, V. Gilard, M. Malet-Martino and R. Martino, J. Pharm. Biomed. Anal.
44 (2007) 743.
47
[143] S. Trefi, V. Gilard, S. Balayssac, M. Marlet-Martino and R. Martino, J. Pharm.
Biomed. Anal. 46 (2008) 707.
[144] S. Trefi, C. Routaboul, S. Hamieh, V. Gilard, M. Malet-Martino and R. Martino,
J. Pharm. Biomed. Anal. 47 (2008) 103.
[145] A. Mohd, A.A.P. Khan, S. Bano and K.S. Siddiqi, Arabian J. Chem. Article in
press, doi: 10. 1016/j. arabjc. 2010. 10. 013.
[146] R.I. EI-Bagary, N.G. Mohammed and H.A. Nasr, J. Chem. Pharm. Res. 3 (2011)
304.
[147] A.M. El-Didamony, J. Chin. Chem. Soc. 56 (2009) 755.
[148] L. El Sayed, A. F.T.A. Mohamed and E.A. Taha, Chemical Industry & Chemical
Engineering Quarterly 16 (2010) 31.
[149] N. Rahman and N. Afaq, Anal. Methods 2 (2010) 513.
[150] N. Rahman, S. Siddiqui and S.N.H. Azmi, AAPS Pharm. Sci. Tech. 10 (2009)
1381.
[151] S.L. Prabhu, S. Shahnawaz, C.D. Kumar and A. Shirwaikar, Indian J. Pharm. Sci.
70 (2008) 502.
[152] Z.A. Alothman, N. Bukhari, S. Haider, S.M. Wabaidur and A.A. Alwarthan,
Arabian J. Chem. 3 (2010) 251.
[153] S.T. Ulu, Spectrochim. Acta A 72 (2009) 1038.
[154] N. Rahman and S. Siddiqui, Drug Testing and Anal. 2 (2010) 252.
[155] N. Rahman and S.M. Haque, Int. J. Biomed. Sci. 4 (2008) 100.
[156] S.M. Sabry, T.S. Belal, M.H. Barary and M.E.A. Ibrahim, Int. J. Biomed. Sci. 5
(2009) 283.
[157] N. El-Enany, F. Belal and M. Rizk, J. Fluoresc. 18 (2008) 349.
48
[158] T. Madrakian, A. Afkhami and M. Mohammadnejad, Anal. Chim. Acta 645
(2009) 25.
[159] O.O. Sagirli, Spectrochim. Acta A 72 (2009) 68.
[160] K.M. Elokely, M.A. Eldawy, M.A. Elkersh and T.F. EI-Moselhy, Int. J. Anal.
Chem. DOI: 10.1155/2011/840178.
[161] A. L. Santos, R.M. Takeuchi and N.R. Stradiotto, Current Pharm. Anal. 5 (2009)
69.
[162] Q. Xu, A. Yuan, R. Zhang, X. Biang and D. Chem, X. Hu, Current Pharm. Anal.
5 (2009) 144.
[163] N.A. El-Maali, Bioelectrochemistry 64 (2004) 99.
[164] S.A. Ozkan, B. Uslu and H.Y. Aboul-Enein, Crit. Rev. Anal. Chem. 33 (2003)
155.
[165] K. Balaji, K. Reddaiah, T.M. Reddy and S.R.J. Reddy, Portugaliae Electrochim.
Acta, 29 (20011) 177.
[166] R. Jain, V.K. Gupta, N. Jadon and K. Radhapyari, Anal. Biochem. 407 (2010) 79.
[167] R.H. Patil, R.N. Hegde and S.T. Nandibewoor, Colloids Surf. B: Biointerfaces 83
(2011) 133.
[168] F. Jalali, E. Ahmadi, M. Roushani, Gh. Bahrami and M. Shamsipur, Anal. Lett. 43
(2010) 1481.
[169] S.M. Al-Ghannam, Spectrochim. Acta A 69 (2008) 1188.
[170] P.V. Rege and P.A. Sathe, Int. J. Pharm. Sci. Res. 2 (2011) 2226.
[171] A.F. Al-Ghamdi and M.M. Hefnawy, Arabian J. Chem. In Press (2011), doi:
10.1016/J. arabjc. 2011.07.011.
[172] U.T. Yilmaz and G. Somer, Turk. J. Chem. 35 (2011) 201.
[173] V.K. Gupta, S. Agarwal and B. Singhal, Int. J. Electrochem. Sci. 6 (2011) 3036.

49
[174] B. Santamaria, M. Perez, D. Montero, M. Madurga and F.J. de Abajo, Eur.
Psychiatry 17(2002) 471.
[175] J. Fang and J.W. Gorrod, J. Chromatogr. A 614 (1993) 614.
[176] S. Kudo and T. Ishizaki, Clin. Pharmacokinetics 37 (1999) 435.
[177] R.M. Pinder, R.N. Brogden, T.M. Speight and G.S. Avery, Drugs 13 (1997) 161.
[178] Y.Z. Shu, J.W. Hubbard, J.K. Cooper, G. Mc Kay, E.D. Korchinski, R. Kumar
and K.K. Midha, Drug Metab. Dispos. 18 (1990) 735.
[179] D. Herpin, J.P. Santoni, F. Pouyallon and J. Demange, Current Ther. Res. 45
(1989) 576.
[180] R. Luccioni, Y. Frances, R. Gass, C. Schwab, J.P. Santoni and L. Perret, Eur.
Heart J. 9 (1988) 1131.
[181] M. Medenica, D. Ivanovic, M. Maskovic, B. Jancic and A. Malenovic, J. Pharm.
Biomed. Anal. 44 (2007) 1087.


![General introduction and scope of present investigationshodhganga.inflibnet.ac.in/bitstream/10603/104246/9/09_chapter 1.pdf2003]. Anti-hypertensive compounds thiocarbamate and isothiocyanate](https://static.fdocuments.net/doc/165x107/5e83e82feab7cf2a327d9f16/general-introduction-and-scope-of-present-inv-1pdf-2003-anti-hypertensive-compounds.jpg)