CHAPTER 1 Economic Models: Trade-offs and Trade PowerPoint® Slides by Can Erbil © 2004 Worth...
18
•CHAPTER 1 •Economic Models: •Trade-offs and Trade • PowerPoint® Slides by Can Erbil © 2004 Worth Publishers, all rights reserved
-
Upload
robert-poole -
Category
Documents
-
view
232 -
download
2
Transcript of CHAPTER 1 Economic Models: Trade-offs and Trade PowerPoint® Slides by Can Erbil © 2004 Worth...

• CHAPTER 1• Economic Models: • Trade-offs and Trade
• PowerPoint® Slides by Can Erbil
© 2004 Worth Publishers, all rights reserved
2
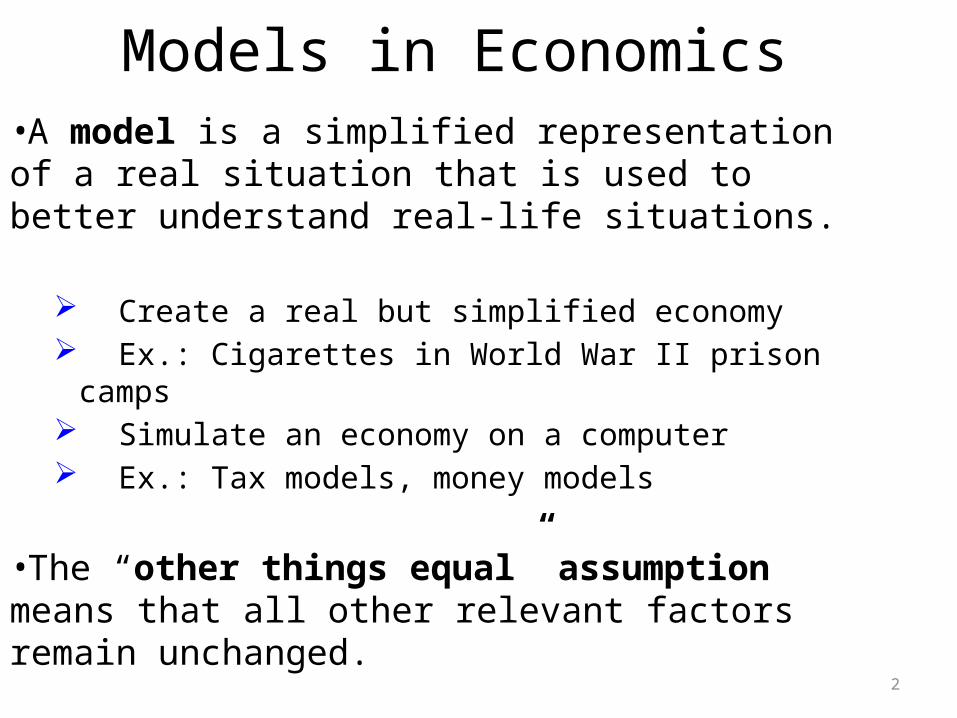
Models in Economics•A model is a simplified representation of a real situation that is used to better understand real-life situations.
Create a real but simplified economy Ex.: Cigarettes in World War II prison camps Simulate an economy on a computer Ex.: Tax models, money models
•The “other things equal” assumption means that all other relevant factors remain unchanged.

3
Trade-offs: The Production Possibility Frontier (PPF)
•The production possibility frontier (PPF) illustrates the trade-offs facing an economy that produces only two goods. It shows the maximum quantity of one good that can be produced for any given production of the other.
•The PPF improves our understanding of trade-offs by considering a simplified economy that produces only two goods by showing this trade-off graphically.

4
Tom’s Trade-offs: The Production Possibility Frontier

5
Increasing Opportunity Cost

6
Economic GrowthEconomic growth results in an outward shift of the PPF because production possibilities are expanded.
The economy can now produce more of everything.
Production is initially at point A (20 fish and 25 coconuts), it can move to point E (25 fish and 30 coconuts).

7
Comparative Advantage and Gains from TradeEx.: Tom and Hank

8
Comparative Advantage and Gains from TradeEx.: Tom and Hank

9
Tom and Hank’s Opportunity Costs of Fish and Coconuts
Tom’s Opportunity Cost
Hank’s Opportunity Cost
One fish
3/4 coconut 2 coconuts
One coconut
4/3 fish 1/2 fish

10
Specialize and Trade
•Both castaways are better off when they each specialize in what they are good at and trade.
•It’s a good idea for Tom to catch the fish for both of them, because his opportunity cost of a fish in terms of coconuts not gathered is only 3⁄4 of a coconut, versus 2 coconuts for Hank.
•Correspondingly, it’s a good idea for Hank to gather coconuts for the both of them.

11
Transactions: The Circular-Flow Diagram
•Trade takes the form of barter when people directly exchange goods or services that they have for goods or services that they want.
•The circular-flow diagram is a model that represents the transactions in an economy by flows around a circle.

12
The Circular-Flow Diagram

13
Circular-Flow of Economic Activities
•A household is a person or a group of people that share their income.
•A firm is an organization that produces goods and services for sale.
•Firms sell goods and services that they produce to households in markets for goods and services.
•Firms buy the resources they need to produce—factors of production—in factor markets.

14
Growth in the U.S. Economy from 1962…

15
…to 1988

16
Using Models
•Positive economics is the branch of economic analysis that describes the way the economy actually works.
•Normative economics makes prescriptions about the way the economy should work.
•A forecast is a simple prediction of the future.

17
Using Models•Economists can determine correct answers for positive questions, but typically not for normative questions, which involve value judgments.
•The exceptions are when policies designed to achieve a certain prescription can be clearly ranked in terms of efficiency.
•It is important to understand that economists don’t use complex models to show “how clever they are,” but rather because they are “not clever enough” to analyze the real world as it is.

18
When and Why Economists Disagree
•There are two main reasons economists disagree:•
They may disagree about which simplifications to make in a model.
They may disagree about values.