Chapter 1 Disability and the environment
71
Disability: the use of aids and the role of the environment
Transcript of Chapter 1 Disability and the environment

Disability: the use of aids andthe role of the environment

The Australian Institute of Health and Welfare is Australia’s national health and welfarestatistics and information agency. The Institute’s mission is to improve the health and well-being of Australians by informing community discussion and decision making throughnational leadership in developing and providing health and welfare statistics and information.

DISABILITY SERIES
Disability: the use of aidsand the role of the
environment
August 2003
Australian Institute of Health and WelfareCanberra
AIHW cat. no. DIS 32

© Australian Institute of Health and Welfare 2003
This work is copyright. Apart from any use as permitted under the Copyright Act 1968, nopart may be reproduced without prior written permission from the Australian Institute ofHealth and Welfare. Requests and enquiries concerning reproduction and rights should bedirected to the Head, Media and Publishing, Australian Institute of Health and Welfare,GPO Box 570, Canberra ACT 2601.
This publication is part of the Australian Institute of Health and Welfare’s Disability Series. Acomplete list of the Institute’s publications is available from the Publications Unit, AustralianInstitute of Health and Welfare, GPO Box 570, Canberra ACT 2601, or via the Institute’s website (http://www.aihw.gov.au).ISSN 1444-3589ISBN 1 74024 291 2
Suggested citationAustralian Institute of Health and Welfare (AIHW): Bricknell S 2003. Disability: the use of aidsand the role of the environment. Disability Series. AIHW Cat. No. DIS 32. Canberra: AIHW.
Australian Institute of Health and WelfareBoard ChairDr Sandra Hacker
DirectorDr Richard Madden
Any enquiries about or comments on this publication should be directed to:Samantha BricknellAustralian Institute of Health and WelfareGPO Box 570Canberra ACT 2601Phone: (02) 6244 1138
Published by Australian Institute of Health and WelfarePrinted by Elect Printing

v
ContentsList of figures, boxes and tables...................................................................................................... viAcknowledgements.........................................................................................................................viiiAbbreviations ......................................................................................................................................ixSymbols ................................................................................................................................................. xSummary ..............................................................................................................................................xi1 Disability and the environment..................................................................................................... 1
1.1 The International Classification of Functioning, Disability and Health (ICF) .............. 11.2 Objectives and structure of the report................................................................................. 3
2 Provision and access to aids and equipment in Australia ........................................................ 42.1 Definition of aids and equipment........................................................................................ 42.2 Aids and equipment schemes available in Australia........................................................ 62.3 Review of aid and equipment schemes ............................................................................ 142.4 Health insurance and tax offsets........................................................................................ 142.5 Some examples of unmet need........................................................................................... 15
3 Factors associated with aid and equipment use........................................................................ 173.1 Factors associated with the use of aids and equipment ................................................. 173.2 Efficacy and impact of aid and equipment use................................................................ 183.3 Abandonment of aids and equipment .............................................................................. 20
4 Use of aids and equipment in Australia..................................................................................... 234.1 ABS Survey of Disability, Ageing and Carers, 1998........................................................ 234.2 Prevalence of aid use ........................................................................................................... 254.3 Age ......................................................................................................................................... 254.4 Severity of restriction........................................................................................................... 264.5 Main disabling condition .................................................................................................... 284.6 Need for assistance .............................................................................................................. 294.7 Assistance from a primary carer ........................................................................................ 35
5 Other environmental factors......................................................................................................... 405.1 Environmental factors and the Survey of Disability, Ageing and Carers.................... 405.2 Education and support arrangements .............................................................................. 405.3 Employment and workplace arrangements..................................................................... 435.4 Access to public transport................................................................................................... 455.5 Assistance with daily activities .......................................................................................... 475.6 Home modifications ............................................................................................................ 49
Appendix: Detailed tables ............................................................................................................... 51References ........................................................................................................................................... 55

vi
List of figures, boxes and tablesFigure 1: Interactions between components of the ICF ............................................................ 2Box 2.1: Examples of aids and equipment available in Australia.......................................... 5Box 4.1: ABS 1998 Survey of Disability, Ageing and Carers: restrictions and their
severity .......................................................................................................................... 24Table 2.1: Examples of aids and equipment schemes funded by state and territory
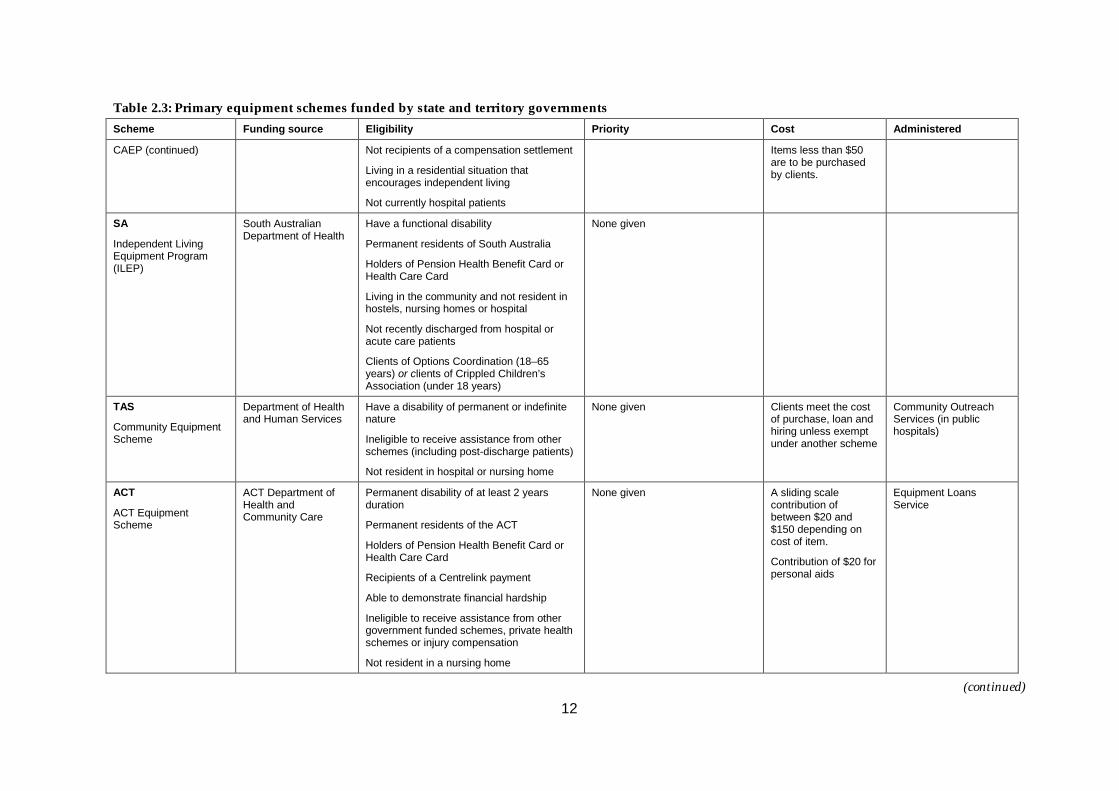
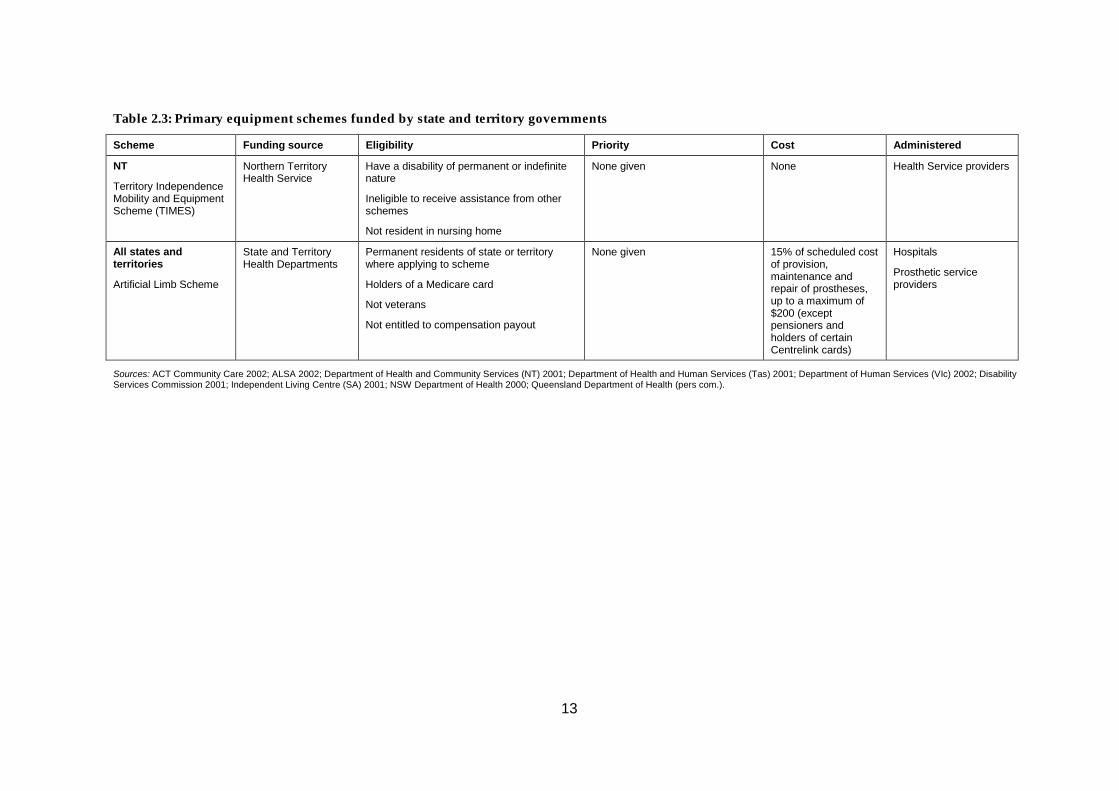
governments................................................................................................................... 7Table 2.2: National equipment schemes funded by the Commonwealth ............................... 9Table 2.3: Primary equipment schemes funded by state and territory governments.......... 10Table 4.1: Types of aids included in the Survey of Disability, Ageing and Carers, 1998.... 24Table 4.2: Use of aids by people with a disability by age group and sex, 1998 .................... 25Table 4.3: People with a disability using aids, by age group, 1998 ........................................ 25Table 4.4: Aids used, by type of aids and age group (people with a disability), 1998 ........ 26Table 4.5: People with specific restrictions, by use of aids and severity of
restriction, 1998 ............................................................................................................ 27Table 4.6: Aids used, by type of aids and severity of core activity restriction, 1998............ 27Table 4.7: People with a core activity restriction using aids, by main disabling
condition, 1998 ............................................................................................................. 28Table 4.8: People aged 0–64 years with a core activity restriction and using aids, by
main disabling condition and type of aid used, 1998............................................. 30Table 4.9: People aged 65 years and over with a core activity restriction and using aids,
by main disabling condition and type of aid used, 1998 ....................................... 31Table 4.10: People with a core activity restriction, by use of aids and need for assistance
with specific activities, 1998 ....................................................................................... 32Table 4.11: People with a severe or profound core activity restriction and need for
assistance with a core activity, by use of aids specific to the core activity,and age group, 1998 .................................................................................................... 33
Table 4.12: People aged 0–64 years with a severe or profound core activity restriction,by use of aids specific to core activities, by frequency of need forassistance, 1998............................................................................................................. 34
Table 4.13: People aged 0–64 years with a severe or profound core activity restriction, byneed for assistance with self-care, mobility or communication, by use of aidsand primary care, 1998................................................................................................ 35
Table 4.14: People with a core activity restriction living in households, by primary carerstatus, relationship of carer and hours of care per week and use ofaids, 1998....................................................................................................................... 36
Table 4.15: People aged 0–64 years with a profound or severe core activity restrictionliving in households, by primary carer status, relationship of carer andhours of care per week, by severity of core activity restriction and useof aids, 1998 .................................................................................................................. 37

vii
Table 4.16: People with a core activity restriction living in households by primary carerstatus, relationship of carer and hours of care per week, by age group anduse of aids and equipment, 1998 ............................................................................... 39
Table 5.1: People aged 5–19 years with a specific restriction, by type of school/classattended and severity of restriction, 1998 ................................................................ 41
Table 5.2: People aged 5–19 years with a specific restriction by type of supportprovided and type of school/class, 1998.................................................................. 42
Table 5.3: People aged 15–64 years with a specific restriction by support arrangementsprovided and type of higher education institute attending, 1998 ........................ 43
Table 5.4: People aged 15–65 years with a specific restriction, by employment andrestriction status, and workplace arrangements, 1998 ........................................... 44
Table 5.5: People with a core activity restriction, by availability and use of publictransport, 1998.............................................................................................................. 45
Table 5.6: People with a core activity restriction, by ability to use public transportand problems or difficulties associated with public transport use, 1998............. 46
Table 5.7: People with a core activity restriction, by transport used in last fortnightand problems associated with use of public transport, 1998................................. 47
Table 5.8: People aged 0–64 years with a core activity restriction living in households,by need for assistance with daily activities by type of assistancereceived, 1998 ............................................................................................................... 48
Table 5.9: People aged 65+ years with a core activity restriction living in households byneed for assistance with daily activities by type of assistance received, 1998 .... 48
Table 5.10: People with a core activity restriction living in households by severityof core activity restrictions, age group, tenure type and type of homemodifications, 1998...................................................................................................... 49
Table A4.1: Aids used, by types of aids and age group (people with a disability), 1998....... 52Table A4.2: Aids used, by use of types of aids and severity of core activity restriction
(people with a disability), 1998.................................................................................. 53Table A4.3: Grouping of main disabling conditions, using the 1998 ABS Survey of
Disability, Ageing and Carers Confidentialised Unit Record File........................ 54

viii
AcknowledgementsThe principal author of this report was Samantha Bricknell, advised and assisted by RosMadden and Xing-yan Wen.The advice and support received from the following people is gratefully acknowledged:
• Ros Madden, Xing-yan Wen, Tim Beard, Phil Anderson, Gail Weaving and NicolaFortune of the Functioning and Disability Unit, AIHW.
• Associate Professor David Gray of Washington University School of Medicine,Missouri and Professor Jerome Bickenbach of Queens University, Ontario.
• Lynne Davis of the National Disability Advisory Council.

ix
AbbreviationsA&EP Aids and Equipment Program (Victoria)ABS Australian Blindness ForumABI Acquired Brain InjuryABS Australian Bureau of StatisticsAIWH Australian Institute of Health and WelfareALS Artificial Limb SchemeCAAS Continence Aids Assistance SchemeCAEP Community Aids and Equipment Program (Western Australia)CRS Commonwealth Rehabilitation SchemeCSDA Commonwealth/State Disability AgreementDVA Department of Veterans’ AffairsICF International Functioning of Disability and HealthILEP Independent Living Equipment Program (South Australia)NGO non-government organisationPADP Program of Appliances for Disabled People (New South Wales)PDCN Physical Disability Council of NSWRAP Rehabilitation Appliances ProgramSAEAS Supported Accommodation Equipment Assessment Scheme (Victoria)TAFE Technical and Further EducationTIMES Territory Independence Mobility and Equipment Scheme (Northern Territory)

x
Symbols— when used in a table, means nil or rounded to zero (including null cells). . when used in a table, means not applicable

xi
SummaryRecognition of the environment as having a direct impact on the experience of disability is animportant conceptual and practical step on the road to improving participation and thequality of life of people with disabilities. The provision of affordable aids and equipment,support arrangements in educational and workplace settings, mainstream education,accessible public transport and personal assistance all act to facilitate opportunities forindividuals to participate in the economic and social world. Furthermore, and just asimportantly, they provide people with disabilities an added independence to explore theseopportunities. Nonetheless, features of the environment may still act as barriers for differentpeople in different circumstances.The International Classification of Functioning, Disability and Health recognisesenvironmental factors as one of three components defining functioning and disability (WHO2001). Environmental factors make up the physical, social and attitudinal environment inwhich people live and conduct their lives, and influence the experience of disability both atthe body level (function and structure) and in terms of the activities they do and the areas oflife in which they participate.Aids and equipment are environmental factors with the potential to improve the life ofpeople with disabilities through the attainment of greater independence and less reliance onpersonal assistance. Some research suggests that aids and equipment alone may be a moreefficacious form of assistance than personal assistance in reducing difficulty associated withperforming tasks of daily living. Nonetheless, the prescription of aids and equipment topeople with disabilities is not always beneficial to the client, sometimes leading to theacquisition of an inappropriate aid and its eventual abandonment.In Australia, a range of Commonwealth and state and territory based schemes provide cost-free or low-cost aids to people with disabilities. These schemes, however, do not generallyprovide complete coverage in terms of scope, size and the types of aids and equipmentprovided, despite recent reviews to improve the quality and delivery of aids.This report describes the use of aids and equipment by people with disabilities in Australia,and other relevant environmental factors, such as support arrangements in educational andworkplace settings, access to public transport, assistance with daily activities, and homemodifications. A summary of the findings from analysis of the 1998 Survey of Disability,Ageing and Carers is given below.
Aids and equipment• In 1998, 48% of people with a disability used some form of aid. Of this group, 40% were
under the age of 65 years (Section 4.2).• The use of aids and equipment was more likely in older age groups and for those with
more severe core activity restrictions (Sections 4.3 and 4.4).• Medical aids were the most frequently used aid for people aged 15–64 years, followed by
mobility aids. The exception was children under 15 years, where self-care andcommunication aids were the second most used aid categories, after medical aids(Sections 4.3).

xii
• The average number of aids used generally rose with increasing severity of core activityrestriction. People with a mild core activity restriction used on average 1.2 aids comparedto 1.5 for a moderate core activity restriction and 1.9 aids for a severe core activityrestriction. People with a profound core activity restriction used an average of 3.5 aids(Section 4.4).
• People aged 0–64 and with physical/diverse or hearing impairments were more likely tobe users of aids compared with people with an intellectual, psychiatric or vision andspeech impairment (Section 4.5).
• People who needed assistance with core and other daily activities were more likely to useaids than those who did not need assistance. However, needing assistance with a coreactivity was not necessarily associated with a high use of aids specific to the core activity.Around 40% of people who needed assistance with self-care or mobility used self-careand mobility aids respectively. Only 8% of people needing assistance with communicationused communication aids (Section 4.6).
• Almost half of people aged 0–64 years and reporting a need for assistance with self-care,mobility or communication received personal assistance only, suggesting that ‘low’ aiduse is offset by receipt of personal assistance. Nonetheless, a high proportion of peoplestill reported using neither personal nor aid or equipment assistance for core activities, inparticular in relation to communication where the proportion having no personal orequipment assistance was 43% (Section 4.6).
• People with a primary carer were more likely to use aids. For people aged under 65 yearsand using aids and equipment, the primary carer was usually a spouse or partner, and toa lesser extent a parent; for people who did not use aids, a parent was the main primarycarer. Aid and equipment users generally received shorter hours of primary care, albeitonly slightly less so (Section 4.7).
Other environmental factors
Education (Section 5.2)• Over 70% of school-aged (5–19 years) children with a severe, moderate or mild core
activity restriction and 49% of children with a profound core activity restriction attendedordinary classes in 1998.
• Receipt of support arrangements was more likely if a primary or secondary school studentattended a special class or a special school. This might reflect the greater needs of childrenin these educational settings compared to those in ordinary classes and/or a better arrayof facilities in classes or schools specifically catering for children with disabilities.However, it was not possible to determine the proportion of children who did not haveaccess to support arrangements, but who needed them, compared to those who did notneed them.
Employment and workplace arrangements (Section 5.3)• Support arrangements in the workplace were more common for people with a profound
or severe core activity restriction than those with other restrictions. Special equipment andassistance from a disability support person were the most common forms of supportarrangement. Again, however, it was not possible to determine the proportion of adults

xiii
who did not have access to workplace support arrangements, but who needed them,against those who did not need such arrangements.
Access to public transport (Section 5.4)• Public transport systems were available to over 80% of people with a disability. For
people aged over 65 years, 98% had a concession card but only 52% of those aged under65 years held a similar card.
• Six per cent of people who used private transport did so because the absence of publictransport in their area meant they had to rely on other transportation means.
• Problems with safety, frequency and reliability of services, ability to transfer betweenhome and stops or station, and in and out of vehicles, and the absence of direct serviceshave been identified as barriers to regular public transport use.
Personal assistance with daily activities (Section 5.5)• Personal assistance with daily activities was predominantly provided by informal
assistance. Formal personal assistance accounted for only a small proportion of assistancereceived. This is particularly so for people aged under 65 years where the proportion ofassistance received from formal sources ranges from 2% to 11% for specific activities, theexception being health care where 19% of assistance is formal.
• Between 5% and 33% of people with a core activity restriction and aged 0–64 yearsreported that their need for assistance with a specific daily activity was partly met. Forpeople aged over 65 years, the range is from 3% to 19%.
• Between 4% and 8% of people with a core activity restriction and aged 0–64 years whoneed assistance with a specific daily activity report they do not receive any assistance atall. Between 2% and 11% of people aged 65 years and over and with a core activityrestriction also report not receiving assistance for specific activities.
Home modifications (Section 5.6)• Home modifications were more common for people with a profound or severe core
activity restriction (23% and 14% respectively), those aged under 14 years (11%) or over 65years (16%) and home owners, boarders or lodgers living rent-free (13–14%).
• People using aids were significantly more likely to live in homes with modifications.• Type of home modifications varied with age. Ramps and structural changes were more
common in the homes of people aged under 30 years and handgrab rails more common inthe homes of people aged over 30 years. Toilet, laundry and bath modifications areequally important to all age groups.
The role of the environment in the experience of disability is a new and important area forinformation in the disability field in Australia. Information here and internationally is ratherscarce and tends to neglect the population under the age of 65 years. This report starts to fillthis gap by providing a broad-scale picture of the association between disability and theenvironment, for all age groups. However, in turn, further questions are unlocked, forexample, the effect of the environment on specific disability groups (e.g. vision impaired) orage groups (e.g. children), the adequacy and scope of current schemes responsible for theprovision of support arrangements, aids and equipment, and other assistance, and policyimplications of these findings.

xiv

1
1 Disability and the environmentThe ‘social model of disability’ was pioneered in the late 1960s and early 1970s, andcontinued to gain momentum and acceptance in the decades that followed. This model,introduced by people with disabilities, civil/human rights activists and social theorists,specified that disability is not simply a manifestation of a person’s impairment, but rather acomplex phenomenon, created in part by features of the physical and social world. It is theenvironment that acts to facilitate integration or contribute to isolation, influencing aperson’s ability to participate in society (see Bickenbach et al. 1999 for a review).The recognition of the environment’s influence on the experience of disability and theimplementation of Disability Discrimination Acts in various countries have led to thedevelopment and implementation of programs and initiatives for improving theenvironment experienced by a person with disabilities. Some examples include:• The concept of Universal Design, where the underlying principle is the design of
products, buildings and environments that are useable by all people (see Mace et al. 1991).Issues such as accessibility, safety, individual ability and efficiency underpin the design ofarticles that make up the physical world, from buildings and forms of transportation tocomputer and Internet access, and products used in the home.
• Integration of students with disabilities into mainstream or regular educational settings.Enabling students with disabilities to participate in a regular education setting is thoughtto improve rather than hinder both academic and social learning (e.g. Center and Curry1993; Wang and Baker 1986). Furthermore it improves their chances of participating in thefuture, instead of setting them on ‘a straight pathway to a segregated life’ (Uditsky 2002).
• Schemes for the provision of aids and equipment, where individuals receive cost-free orlow-cost equipment to help their performance of daily activities, such as self-care andmobility in and outside the house, and facilitate participation in sport, work, educationand other activities.
• Improvement of standards for accessible public transport. Transport is a fundamentalhuman right, including having ready access to safe and disability-friendly forms of publictransport, but remains a common problem for people with disabilities (see AIHW 2002).There have been recent developments in Australia, such as the implementation of theDisability Standards for Accessible Public Transport, passed by Parliament in October2002.
1.1 The International Classification of Functioning, Disability andHealth (ICF)Environmental factors are recognised by the International Classification of Functioning,Disability and Health1 (ICF) as one of three components defining functioning and disability(WHO 2001). The other two components are Body Functions and Structures and Activitiesand Participation (see Figure 1 and WHO 2001). The inclusion of environmental factorsrepresents an important new component to the classification.
1 The World Health Assembly endorsed the ICF in June 2001.

2
Environmental factors make up the physical, social and attitudinal environment in whichpeople live and conduct their lives. These influence the experience of disability both at thebody and in terms of the activities they do and the areas of life in which they participate,affecting a person’s impairment extent, activity limitation and/or participation restriction.
Source: WHO 2001.
Figure 1: Interactions between components of the ICF
The ICF groups environmental factors into five chapters (WHO 2001). These are:• Products and technology, i.e. natural and human-made products and systems of
products, equipment and technology• Natural environment and human-made changes to environment, i.e. animate and
inanimate elements of the natural and physical environment, and components of thatenvironment that have been modified
• Support and relationships, i.e. people or animals that provide practical physical oremotional support, nurturing, protection, assistance, and relationships to other persons,in the home, place of work, school or at play
• Attitudes, i.e. attitudes that reflect the observable consequences of customs, practices,ideologies, values, norms, factual beliefs and religious beliefs
• Services, systems and policies, i.e. services that provide benefits, structure programs andoperations to meet the needs of individuals, systems designed to organise, control andmonitor these services and policies that govern and organise the systems that organise,control and monitor services.
Environmental factors may act either as facilitators or barriers to an individual, enhancing orhindering their performance. Different environments therefore may have very differentimpacts on the same individual with a given health condition.
Health condition(disorder or disease)
Body functionsand structures Activity Participation
Environmentalfactors
Personal factors

3
1.2 Objectives and structure of the reportIn this report we examine information available in Australia on this important component ofdisability. It includes a discussion of some of the environmental factors recognised by theICF as influencing the experience of disability—aids and equipment, home modifications,educational settings, support arrangements provided at school and in the workplace, accessto public transport and receipt of assistance for daily activities.The primary focus of the report, however, is aids and equipment and their use by peoplewith disabilities in Australia. Aids and equipment have long been recognised as anenvironmental factor with the potential to improve the quality of life of people withdisabilities, allowing greater independence and reduced reliance on personal assistance. Aidsand equipment have also received more attention in the disability literature than otherenvironmental factors, with the possible exception of the built environment.The majority of data regarding the use of aids and equipment come from the United States orEurope, with little research being undertaken in Australia. This report aims to fill this gap byproviding a picture of the current status of provision and use of aids and equipment bypeople with disabilities in Australia, and the factors associated with this use.The structure of the report is as follows:Chapter 2 identifies some of the current definitions of aids and equipment specific to peoplewith disabilities, and describes the kinds of equipment available in Australia and theCommonwealth and relevant state/territory based schemes operating in Australia. Issues ofeligibility, priority and funding are discussed, as is reported cases of unmet need for aids andequipment.Chapter 3 reviews the literature on the use of aids and equipment in other countries, theefficacy of aid and equipment use, both overall and compared to personal assistance, andfactors identified as being associated with the use and abandonment of aids and equipment.Chapter 4 presents analyses of the 1998 ABS Survey of Disability, Ageing and Carers anddescribes prevalence of the use of aids and equipment by age group, severity of restriction,main disabling condition, need for personal assistance and the use of a primary carer. Thetypes of equipment (e.g. mobility aids, communication aids) used by different demographicgroups is also investigated.Chapter 5 focuses on some of the other environmental factors relevant to people withdisabilities. Environmental factors covered in the Survey of Disability, Ageing and Carersand presented in this chapter include support arrangements provided in educational andworkplace settings, receipt of assistance for daily activities, availability of public transportand home modifications.

4
2 Provision and access to aids and equipment inAustralia
2.1 Definition of aids and equipmentAids and equipment are generally defined as products that assist a person with disabilitiesby improving their functioning, increasing participation in society and/or improving theirquality of life. Aids and equipment have been defined as operating to:
‘increase or improve functional capabilities of individuals with disabilities’ (Technology-Related Assistance of Individuals with Disabilities Act 1988 (US))‘improve functioning, enable a person to live at home and in the community, and enhanceindependence’ (Scherer 1996).
The aims and objectives of Australian equipment schemes also recognise these functions,describing the provision of aids and equipment as acting to:
‘improve the quality of life of people with disabilities and improve capacity to participatein family and community activities’ (PADP, NSW(NSW Department of Health, 2000));‘to enhance…safety and independence, (and) reduce…reliance on carers’ (A&EP, Victoria(Department of Human Services, 2002));‘minimise the impact of…disability and maximise…ability to function(ing) effectively’(CAEP, Western Australia (Disability Services Commission, 2001)); and‘increase…independence and to enable them to function at optimal levels in their homeand communities’ (TIMES, Northern Territory (Department of Health and CommunityServices, 2001)).
Categories of aids and equipmentAids and equipment are sometimes categorised in terms of technological sophistication e.g.as low-, medium- and high-tech aids. Low-tech aids are those that are simple in constructionand/or use, such as toilet supports or hand-held showers. Medium-tech aids are morecomplicated and tend to be mechanically based, for example, wheelchairs and mechanicallifters. Equipment that incorporates sophisticated electronics or computers, such as electroniccommunication boards and voice amplifiers, are referred to as high-tech aids.A large range of aids and equipment is available in Australia, for mobility, self-care andcommunication purposes, to treat medical conditions, plus orthoses and prostheses, andmodifications made to homes. Box 2.1 lists the types of aids and equipment (and homemodifications) that can be obtained in Australia. For this report, glasses and contact lenseswill not be included as aids and equipment.

5
Box 2.1: Examples of aids and equipment available in Australia
Primary use Examples of aids and equipment
Self-care/Personal Beds/bed table/mattressesShower hose/hand showerBath and shower seatingCommodeToilet support, frames and stepsContinence aids/drainage bags and bottlesSafety helmets
Mobility Bed backrest and bed raiseAlternative positional and postural seating supportsStanding equipmentHoist/mechanical lifterCrutches/walking stick/walking frameWheelchair/scooter/stroller (and wheelchair push mitt)Portable ramps
Communication Communication boardCommunication cardsCommunication/chat bookElectronic communication device schemeEye-pointing frameBox scannerMemory/message box with voice inputComputer interface/accessAlternative keyboardsCommunication output device with(out) voiceElectrolarynxVoice amplifier and other electronic voice aidsCochlear Implant Speech ProcessorHearing aids
Medical aids Pressure management (bed)Ventilator/CPAP appliance/respiratory mask and accessoriesHumidifierMedical dressingsCathetersTracheostomy tubes and dressingsOxygen concentrators and oxygen gasContinuous positive airway pressureTube feeding equipmentGlucometerNebuliser
Orthoses Cervical, cervical thoracic, thoracic lumbar sacral, lumbar sacral and spinalorthosesLower limb orthosisUpper limb orthosisPressure management garmentFootwear (for deformation or chronic ulceration)
Prostheses WigsMammary prothesisOptical prosthesis
Home Modifications Bathroom, toilet, kitchen and laundry modificationsBidet toilet attachmentDoor fittings and wideningHand-held showersHand-rails and gripsPower outlets and switchesNon-slip paint for rampsSafety flooringRamps/step modificationsThermostats
Sources: ACT Community Care 2002; ALSA 2002; Department of Human Services (Victoria) 2002; Disability Services Commission 2001; NSWDepartment of Health 2000.

6
2.2 Aids and equipment schemes available in AustraliaThe Commonwealth, state and territory governments, and a range of non-governmentorganisations (NGOs), undertake the funding and operation of the majority of equipmentschemes in Australia. These schemes provide in most cases cost-free, essential aids andequipment for people with disabilities based on eligibility criteria. Two types of governmentschemes exist—those funded at the Commonwealth level and those at the state or territorylevel—while NGO schemes are primarily state- and territory-based.Aids and equipment are, of course, also available for purchase privately; the focus in thischapter is on schemes with some element of subsidy.
CommonwealthNational equipment schemes are funded by the Commonwealth Government, of which theprimary schemes are:• Rehabilitation Appliances Program (RAP) and Home Modification (Department of
Veterans Affairs (DVA))• Australian Hearing Services• Commonwealth Rehabilitation Service (CRS)• Continence Aids Assistance Scheme (CAAS) (Department of Health and Ageing)• Workplace Modifications Scheme (Department of Family and Community Services).While the funding of these schemes is through the Commonwealth, their administrationvaries. The Australian Hearing Services, RAP, CRS and Workplace Modifications Scheme areadministered through Commonwealth departments. A non-government organisation, PQLifestyles, manages CAAS, under contract to the Department of Health and Ageing.
State/territory governmentsState and territory governments fund additional government equipment schemes. Eachstate/territory manages a single scheme (Table 2.1) although some, such as Victoria andQueensland, have secondary schemes for specific disability groups (e.g. hearing impaired) orconnected to other support schemes (e.g. supported accommodation). Responsibility forfunding of the Artificial Limb Scheme (ALS) was transferred in the mid-1990s from theCommonwealth to state and territory governments, with their respective health departmentsimplementing its administration.
Non-government organisationsA range of NGOs, for example the Motor Neurone Disease Association of NSW, TheNorthcott Society (NSW), ParaQuad (NSW), The Spastic Centre (NSW), Spectronics(Queensland), Cerebal Palsy League of Queensland and Anelcomobil (South Australia), alsoprovide aids and equipment. These organisations are mostly self-funded and distributeequipment both on a long-term or temporary loan basis. The manufacturing of specifiedequipment is also commissioned or undertaken by certain NGOs, for example TAD(Technical Aid to the Disabled), where volunteers make and supply custom-designed aids ifcommercial equipment is not suitable or cost-effective.

7
Table 2.1: Examples of aids and equipment schemes funded by state and territory governments
State/territory Equipment Scheme
NSW Program of Appliances for Disabled People (PADP)
Vic Victorian Aids and Equipment Program (A&EP)
Supported Accommodation Equipment Assessment Scheme (SAEAS)
A&EP Communication Devices Scheme
Qld Medical Aids Subsidy Scheme
Queensland Hearing Services
WA CAEP (Community Aids and Equipment Program)
SA Independent Living Equipment Program (ILEP)
Tas Community Equipment Scheme
ACT ACT Equipment Scheme
Oxygen Scheme
NT Territory Independence Mobility and Equipment Scheme (TIMES)
Scheme specificsCommonwealth equipment schemes focus on delivering specific equipment assistance toaddress particular impairments or population groups. For example:• CRS provides equipment to people entering the workforce after an extended absence from
employment• the Workplace Modifications Schemes contributes to the cost of workplace modifications
for people both in and planning to enter the workforce• RAP is available to war veterans and their widows/widowers• CAAS is for people suffering from incontinence• Australian Hearing Services for people with hearing impairments.In contrast, the state/territory government (and NGO) schemes are more inclusive withregard to who can apply and are broader in the range of equipment supplied. Tables 2.2 and2.3 outline funding, eligibility, priority, cost and administration information for the primaryCommonwealth and state/territory schemes.
EligibilityEligibility criteria apply for all equipment schemes. For Commonwealth-based schemes, theprimary criterion is based on veteran status (DVA schemes), having a specific impairment(e.g. hearing (Australian Hearing Services), incontinence (CAAS)) or demonstrating need forenvironmental support in the workplace (CRS, Workplace Modifications Scheme). For moststate and territory schemes, eligibility criteria require the client to have a disability ofpermanent or indefinite nature and be able to demonstrate they are:• a permanent resident of that state or territory• in receipt of a pension or health card, or a relevant Centrelink payment• a resident within the community or a non-government-funded group home• not receiving any form of compensation settlement• ineligible for assistance from another scheme.

8
Demonstration of financial hardship is required in some cases in Queensland, WesternAustralia and the Australian Capital Territory, for example when the client is not a benefitrecipient. The New South Wales PADP scheme also stipulates a financial eligibility clausewhere singles and couples/families are only eligible for equipment if their taxable income isless than or equal to $26,759 and $45,490 respectively. A higher income threshold is specifiedfor equipment costing more than $800 (Table 2.3).
PriorityOnly New South Wales and Victoria detail clear priority conditions. In New South Walespriority is based on income, with lower income groups receiving equipment before higherincome groups (Table 2.3). In Victoria, it is perceived need that determines priority withthree category groups defined: No waiting, High urgency and Low urgency. Peoplerequiring the oxygen program, wheelchair repairs and continence aids fall into the ‘Nowaiting’ group. ‘High category’ includes those where the provision of equipment is critical tothe safety of the client or could prevent injury or deterioration of health.
Associated costsIn most schemes, and in most cases, the cost of items is met by the equipment scheme.However, aids and equipment costing less than $50–$100 or ‘non-essential’ items are notprovided by any of these schemes. Contributions are sometimes required for high-cost itemssuch as electric wheelchairs.Clients obtaining equipment from the New South Wales PADP scheme normally have toprovide a single co-payment of $100. Co-payments are also essential when items cost lessthan $100 (for clients who can demonstrate financial hardship) and for certain income groupswhere a high-cost item is requested. In this case the client is expected to pay 20% of the retailcost.ALS also requires some financial commitment from the client—15% of the scheduled cost ofprovision, maintenance and repair of each prosthetic. However, payment by the client is notto exceed $200.

9
Table 2.2: National equipment schemes funded by the Commonwealth
Scheme Funding source Eligibility Priority Cost Administered
RehabilitationAppliances Program(RAP) and HomeModifications
Department ofVeterans Affairs (DVA)
Veterans, war widows and widowers, andtheir dependants
Holders of DVA Repatriation Gold or WhiteHealth Cards
None given To repairs andalterations if priorfinancial authorisationhas not been sought
Pharmacy or DVA
Australian HearingServices
Department of Healthand Ageing (DoHA)
Children and young adults up to 21 yearsand aged pensioners
Most veterans (veterans benefit holders)
Defence Force personnel
Clients of CRS Australia with a hearingproblem
Holders of a Pensioner Concession Card,Health Benefit Card, DVA Gold RepatriationCard or DVA White Repatriation Health cardspecifying hearing loss or receiving aSickness Allowance from Centrelink
None given An annual servicecharge of $25 formaintenance ofhearing aids andbatteries
Australian HearingServices
Continence AidsAssistance Scheme(CAAS)
Department of Healthand Ageing (DoHA)
Permanent and ongoing continence as aresult of neurological condition or permanentor severe intellectual impairment
Aged 16–64 or 65+ years and working
Eligible for Disability Support Pension (DSP)or Mobility Allowance or in receipt of theequivalent sales tax or GST exemption on avehicle
Not resident in a nursing home
None given Subsidy of $460 perannum for aidsordered
Intouch, PQ Lifestyles(under contract toDepartment of Healthand Ageing)
CRS Australia CommonwealthGovernment
Potential for full-time or part-time work
Aged 14–65 years
None given None CRS
Workplace ModificationsScheme
Department of Familyand CommunityServices (FaCS)
Worker(a) employed for a minimum of 8hours per week and in employment expectedto continue for an excess of 13 weeks.
None given A $5,000 cap appliesfor each client in anyone year
FaCS
(a) A ‘worker’ means an individual with a disability who is supported by a FaCS-funded open employment service or a FaCS-funded s10 Business Service, or is attached to a Job Network Intensive Assistance provider, oris a participant in the Supported Wage Scheme. The scheme is specifically aimed at new workers (i.e. individuals who were unemployed before commencing in the position for which assistance is provided), SupportedWage System and ‘job in jeopardy’ workers, and some eligible self-employed persons who are participants of the New Enterprise Scheme.
Sources: Australian Hearing Services 2002; Department of Health and Ageing 2002; CRS Australia 2002; Department of Family and Community Services 2002; Department of Veterans Affairs 2001.

10
Table 2.3: Primary equipment schemes funded by state and territory governments
Scheme Funding source Eligibility Priority Cost Administered
NSW
Program of Appliancesfor Disabled People(PADP)
NSW Department ofHealth
All children and young people under 16regardless of parental income or all peopleaged 16 years and over if:
• has a long term permanent disability
• permanent resident of NSW
• holds a Centrelink pension or Health Card
• unable to obtain aids and equipment fromother government programs
• not a recipient of a compensationsettlement
• resident in an NGO-run group home
• recently discharged from hospital (1month) and not eligible for equipment fromhospital or health care service
and has a:
a taxable income in the preceding financialyear that was less than or equal to$26,759 (single) or $45,490 (couple orfamily)
or (for high-cost items >$800)
b taxable income in the preceding financialyear was $1 above the upper level in (a)and less than or equal to $39,941 (single)and $67,899 (couple or family)
c taxable income in the preceding financialyear that was above $39,941 and $67,899(couple or family) adjusted fordependants.
Income groups a and b overincome groups c
Co-payments arecharged in thefollowing:
• people requiringone item costing<$100 in a financialyear whodemonstrate severehardship
• all PADP recipients(except incomegroup c) make asingle co-paymentof $100
• income group crecipients eligiblefor high cost itemsare charged 20% ofretail cost
• any upgrading willincur the cost ofadditional item
PADP LodgementCentres
VIC
Aids and EquipmentProgram (A&EP)
Department of HumanServices (DisabilityServices Division)
Children or adults with a long-term orpermanent disability, or frail aged
Permanent residents of Victoria
Holders of a Medicare card
Those ‘in greatest need’:
1. ‘No waiting’: clinical eligibility foroxygen program, wheelchairrepairs and continence aids,and re-issue of aids
Doesn’t providemoney to cover cost ofaids bought by clients
Public hospitals
Extended care facilities
Other service agencies
(continued)

11
Table 2.3: Primary equipment schemes funded by state and territory governmentsScheme Funding source Eligibility Priority Cost Administered
A&EP (continued) Requires aids and equipment on apermanent or long-term basis
Ineligible to receive assistance from othergovernment schemes
Not in-patients of a public or private hospital
Not able to claim cost of aids and equipmentthrough private health insurance
Not post discharge patients
2. ‘High urgency’: critical to safetyor the client or to prevent injuryin daily living; or deterioration ofhealth could lead to prematureadmission to institutional care,hospital or dependence oncostly services.
3. ‘Low urgency’: clinical factorsand length of waiting period
Non-refundablecontribution can bemade.
SAEAS Department of HumanServices (DisabilityServices Division)
Eligible for Victorian A&EP
Resident in a Department of HumanServices-funded accommodation servicethat is registered or funded under theIntellectually Disabled Persons Services Act1986, the Community Services Act 1970 orThe Disability Services Act 1991
Ineligible to receive assistance from othergovernment schemes
As above As above As above
QLD
Medical Aids SubsidyScheme
QueenslandDepartment of Health
Permanent residents of Queensland
Holders of a Pensioner Concession Card,Health Care Card or PharmaceuticalBenefits Card (for oxygen)
Recipients of Centrelink payment
Able to demonstrate financial hardship
Ineligible to receive assistance from othergovernment schemes
Not resident in residential care
None given None Community healthservices
Home care services
Public hospitals
WA
Community Aids andEquipment Program(CAEP)
Disability ServicesCommission
Have a disability of permanent or indefinitenature
Holders of or eligible for PensionerConcession Card, Health Care Card,Commonwealth Seniors Card or CarersPayment or able to demonstrate financialhardship
None given CAEP funds only theessential componentof the item. Clients orother fundraisers arerequired to pay for thebalance.
Health service providerse.g. public fundedhospitals
Specialist serviceproviders
(continued)
12
Table 2.3: Primary equipment schemes funded by state and territory governmentsScheme Funding source Eligibility Priority Cost Administered
CAEP (continued) Not recipients of a compensation settlement
Living in a residential situation thatencourages independent living
Not currently hospital patients
Items less than $50are to be purchasedby clients.
SA
Independent LivingEquipment Program(ILEP)
South AustralianDepartment of Health
Have a functional disability
Permanent residents of South Australia
Holders of Pension Health Benefit Card orHealth Care Card
Living in the community and not resident inhostels, nursing homes or hospital
Not recently discharged from hospital oracute care patients
Clients of Options Coordination (18–65years) or clients of Crippled Children’sAssociation (under 18 years)
None given
TAS
Community EquipmentScheme
Department of Healthand Human Services
Have a disability of permanent or indefinitenature
Ineligible to receive assistance from otherschemes (including post-discharge patients)
Not resident in hospital or nursing home
None given Clients meet the costof purchase, loan andhiring unless exemptunder another scheme
Community OutreachServices (in publichospitals)
ACT
ACT EquipmentScheme
ACT Department ofHealth andCommunity Care
Permanent disability of at least 2 yearsduration
Permanent residents of the ACT
Holders of Pension Health Benefit Card orHealth Care Card
Recipients of a Centrelink payment
Able to demonstrate financial hardship
Ineligible to receive assistance from othergovernment funded schemes, private healthschemes or injury compensation
Not resident in a nursing home
None given A sliding scalecontribution ofbetween $20 and$150 depending oncost of item.
Contribution of $20 forpersonal aids
Equipment LoansService
(continued)
13
Table 2.3: Primary equipment schemes funded by state and territory governments
Scheme Funding source Eligibility Priority Cost Administered
NT
Territory IndependenceMobility and EquipmentScheme (TIMES)
Northern TerritoryHealth Service
Have a disability of permanent or indefinitenature
Ineligible to receive assistance from otherschemes
Not resident in nursing home
None given None Health Service providers
All states andterritories
Artificial Limb Scheme
State and TerritoryHealth Departments
Permanent residents of state or territorywhere applying to scheme
Holders of a Medicare card
Not veterans
Not entitled to compensation payout
None given 15% of scheduled costof provision,maintenance andrepair of prostheses,up to a maximum of$200 (exceptpensioners andholders of certainCentrelink cards)
Hospitals
Prosthetic serviceproviders
Sources: ACT Community Care 2002; ALSA 2002; Department of Health and Community Services (NT) 2001; Department of Health and Human Services (Tas) 2001; Department of Human Services (VIc) 2002; DisabilityServices Commission 2001; Independent Living Centre (SA) 2001; NSW Department of Health 2000; Queensland Department of Health (pers com.).

14
2.3 Review of aid and equipment schemesIn 1996, a national review by the CSDA (Commonwealth/State Disability Agreement) ofequipment schemes operating in Australia concluded that availability, access and equity,administration and funding issues continued to beleaguer the distribution of equipment topeople with disabilities (CSDA: Ernst and Young 1996). Some of these problems includedthe:• exclusion of certain groups from accessing schemes, e.g. some people in employment,
children from the CAAS scheme• insufficient funding, which varies between jurisdictions and depends upon location• absence of local alternatives for people living in remote or country areas• inadequate information on eligibility criteria and the range of items available• inconsistent or total absence of a process to establish priority.A survey conducted by CSDA/Ernst and Young (1996) also found that for the 389respondents, 544 cases of unmet need (for specific items) were reported. Of particularconcern was a high percentage (37%) of unmet need for children aged 0–15 years.From these findings, the report recommended that a nationally consistent process ofapplication, assessment and distribution be developed and adopted by national andstate/territory based schemes, in order to improve their accessibility and equity.Some schemes have since undergone at least one review process, leading to reform primarilyin improving the range of equipment items available and the broadening of eligibilitycriteria. For example, following a recent review of the PADP scheme operating in New SouthWales a number of significant changes were introduced, including:• the drafting of a common PADP application form that will be consistently applied across
the state• plans to develop a needs based assessment tool for PADP• a new set of eligibility criteria• suspension of most co-payments• abolishment of income testing for families of children who need equipment.
2.4 Health insurance and tax offsetsMost major Australian health insurance and health fund organisations provide some form ofbenefits cover for aids and equipment, mostly for hearing aids or specific types of medicalaid (e.g. nebulisers, TENS machines, CPA machines) but also including mobility aids(e.g. wheelchairs, calipers, crutches) and prostheses and orthoses. The maximum benefit andtime period allowed between claims varies somewhat between schemes, and it is stipulatedin some that membership be at least one to two years before a claim for aids and equipmentcan be made. Most schemes only include aids and equipment benefits under higher levels ofcover and all require formal prescription from a medical practitioner. Between June 2002 andMarch 2003 private health insurance organisations paid $18,944,000 and $10,348,000respectively in ‘non-contractual ancillaries’ benefits for ‘prostheses, aids and appliances’ and
15
‘hearing aids and audiology’ services (PHIAC 2003). This accounted for 0.96% and 0.52% ofall benefits paid for services in this time period.People who have purchased high-cost aids over a specified limit in an income year are alsoentitled to claim the medical expenses tax offset. For the financial year 2002–03, the tax offsethas been set at 20% of net medical expenses over $1,500. Included under claimable medicalexpenses are ‘artificial appliances’, such as limbs or hearing aids, and standard medical aidswhich have been prescribed by a medical practitioner.
2.5 Some examples of unmet needFor some people, access to aids and equipment or aids and equipment schemes remainsdifficult. While problems of access are not often officially documented, reference to cases ofunmet need have been described by the 1996 CSDA review of Australian equipment schemesand in literature prepared by disability advocacy groups. The CSDA review found that:• Eligibility criteria for some schemes were considered by some to be too restrictive. Nine
per cent of people surveyed by Ernst and Young stated that they had been refused accessto aids and equipment based on eligibility criteria.
• Funding for equipment schemes was suggested to be insufficient to both increase thenumber and range of equipment available to clients and properly cover the cost ofmaintenance, repair and replacement of loan equipment. For example, an estimation byErnst and Young of the annual replacement cost for wheelchairs, an expensive butregularly used form of equipment, was calculated to be almost 70% of total fundsavailable (CSDA: Ernst and Young 1996:34–35).
• The exclusion of employed people from equipment schemes other than CRS, and theabsence of alternatives for this group has the potential to cause financial hardship,particularly for those who require high-cost or numerous equipment items.
Advocacy groups have also highlighted potential and real cases of unmet need.• Despite support for the recent changes to the PADP scheme, the Physical Disability
Council of NSW (PDCN) maintains that access to equipment remains a ‘postcode lottery’(PDCN 2001). People with disabilities living in rural and remote locations aredisadvantaged by the absence of equipment outlets in these areas and often have to travellong distances on numerous occasions to apply for and obtain required equipment items.
• The Australian Blindness Forum (ABF) has highlighted the difficulty that the legally blindexperience in obtaining communication equipment (ACROD 2002). The absence of aprogram that consistently provides appropriate communication equipment has led to theABF’s proposal for a Commonwealth-funded National Equipment Subsidy Scheme.Provision of communication equipment was also noted by the CSDA review (1996) as asignificant problem.
• A recent survey by the Carers Association of Australia found that many carers do notreceive enough financial assistance to obtain aids and equipment, which has in some casesresulted in financial hardship (Carers Australia 2001).
• A survey conducted by the Australian Quadriplegic Association in 2000 of users of CAASfound that for 68% of respondents (n=100) allocation of continence equipment did not lastthe year (PDCN 2000). Fifty seven per cent of respondents ran out of supplies in 9 monthsor less. One problem identified was the absence of factoring in inflation as 69% ofrespondents stated their allowance did not last as long as it did 5 years ago. Carers have

16
also indicated a problem with the limited nature of services and assistance for peoplesuffering from incontinence (Carers Australia 2001).
• Under-funding of the ALS in Northern Territory is reported to have severely limitedequipment and staff numbers and the ability to treat remote patients (Barnes 1997). Thehigh traumatic amputation rate in the Northern Territory requires an increase inprostheses which is currently not feasible with current funding levels.
Further emphasis on unmet need for equipment provision was voiced at peak discussionsheld to inform an Australian Institute of Health and Welfare (AIHW) report on unmet needfor disability services in Australia (AIHW 2002). Issues raised included a limited range ofequipment, problems with cost, availability and shortage of referral services in remote areasof Australia, and the decline in equipment supply from traditional dispensing units such ashospitals. Systems for the provision of equipment appear to be nationally fragmented.
17
3 Factors associated with aid and equipment useThis chapter reviews literature on the use of aids and equipment and covers three primaryissues—factors associated with the uptake of equipment, reasons people abandon equipmentand the suggested greater efficacy of equipment assistance over personal assistance. Most ofthe literature discussed focuses on the aged population (i.e. people aged 65 years and over)living in North America or Western Europe, as similar research based on Australianpopulations or on younger adults or children has not received the same level of researchattention.
3.1 Factors associated with the use of aids and equipmentA range of personal and environmental factors, and factors related to impairment andactivity limitation, has been identified as being associated with the uptake and use of aidsand equipment for people over the age of 552. Some of these factors, however, displayvarying associations with equipment use, from study to study. Only those factors foundconsistently and positively to associate with the use of equipment are described here.
Impairment and activity limitationIncreased impairment and activity limitation exhibited the strongest and most consistentrelationship with equipment use (de Klerk et al. 1997; Forbes et al. 1993; Hartke et al. 1998;Mann et al. 1995; Zimmer and Chappell 1994). Specific factors found to associate with aidsand equipment use include:• limited functional status, as measured by severity of difficulty performing self-care and
domestic activities and the number of days of restricted activity• mobility limitation, as measured by difficulty changing position, walking inside and
outside the home, walking up stairs etc.• higher number of chronic health conditions• fair or poor self-assessed health status.Thus, the more difficult it is to perform an activity, the larger the number of impairmentsexperienced and/or the feeling that one’s health is compromised influence people to seekassistance from aids and equipment. These factors have been referred to in the literature as‘need’ factors, where the combination and volume of need factors influences an individual’sability ‘to cope’ without assistance (Zimmer and Chappell 1994).
Environmental factorsSystems by which people are able to receive financial assistance for aids and equipment, oraccess aids by other means (e.g. through equipment schemes), exerts a strong influence onwhether people adopt aids and equipment or not (Scherer and Cushman 2001). Ease ofaccess is a critical issue and use of equipment is more readily engaged the more generous (in
2 In the literature, factors were categorised as either predisposing, enabling or need factors, based on
the Anderson and Newman model of health care access (see Andersen and Newman 1973).

18
terms of financial assistance and equipment availability) and easier the support system. Thereceipt of personal assistance, either informal or formal, is also related to equipment use (deKlerk et al. 1997; Zimmer and Chappell 1994). An increased need for assistance due tofunctional limitation might account for this association, especially in elderly people. Alsosignificant is the attitude of others, in particular relatives and friends, who can have a verysignificant effect on aid and equipment use (Scherer 2000). Expectations held by others mayencourage or discourage the uptake of aid and equipment.
Personal factorsAge was a consistent variable linked with aids and equipment use (de Klerk et al. 1997;Forbes et al. 1993; Hartke et al. 1998; Russell et al. 1997; Zimmer and Chappell 1994). Olderseniors (over 75 years) were found to be more likely users of aids and equipment comparedwith younger seniors (between 55 and 65 years). The increase in activity limitation andseverity of impairments associated with increasing age is a probable explanation for thisassociation, although Hartke et al. (1998) found that age remained a significant factor in aidand equipment use after controlling for health status. It has been suggested, therefore, thatattitudinal or psychological reasons might also influence use or non-use (Hartke et al. 1998;Zimmer and Chappell 1994). For example, younger seniors may think they are still tooyoung to rely on aids and equipment and therefore avoid their use.Gender also had some association with use, with females tending to use aids and equipmentmore often than males. In one study, however, males were found to be more frequent usersof equipment while females were significantly associated with multiple use (Hartke et al.1998). Some association was also found with marital status and living arrangement, withequipment users tending to be unmarried and/or living alone. However, it must be notedthat this data was not age-standardised.Other personal factors such as income, education and place of residence were moreinconsistently related to aid and equipment use. A higher income and level of education waspredicted as improving the chances of people obtaining aids and equipment by respectivelyproviding the financial ability and access to information to do so (de Klerk et al. 1997).However, when income and education did hold a significant association with use, it was lesseducation and low or average incomes that were associated with higher levels of use.
Subjective factorsSubjective factors have also been identified as predisposing people to use aids andequipment (Vash 1983, cited in Phillips and Zhao 1993; Scherer 1996; Scherer and Cushman2001). Adjustment to and acceptance of one’s disability, and a focus to manage theirdisability, leads the individual to recognise that assistance in some areas is required and anaid or piece of equipment can provide that assistance. Similarly, setting goals for the future,and associated motivation, may also influence the adoption of methods (such as equipmentuse) which improve the chance of achieving those goals.
3.2 Efficacy and impact of aid and equipment useThe use of equipment has been suggested as being more efficacious in the management ofdisability than either personal assistance or a combination of assistance types (Agree 1999;

19
Verbrugge et al. 1997; Verbrugge and Sevak 2002). For people aged over 55 years, areduction in disability was uniformly achieved only for those using aids and equipment.Agree (1999) assessed the level of residual difficulty people aged over 70 years experiencedwith indoor mobility. Residual difficulty was defined as the level of difficulty stillexperienced despite the receipt of assistance. People using aids and equipment consistentlyreported experiencing lower levels of residual difficulty with indoor mobility, comparedwith people relying on personal assistance alone or a combination of personal and non-personal assistance. Controlling the level of underlying physical impairment did not alterthese findings, with the report of residual difficulty still around 1.5 and 3 times more likelyfor people using personal assistance or both assistance types respectively (Agree 1999).Aids and equipment also proved to be better at reducing any difficulty associated withcarrying out tasks of daily living3 (Verbrugge et al. 1997; Verbrugge and Sevak 2002).Efficacy was measured as the difference between unassisted and assisted degrees ofdifficulty (Verbrugge et al. 1997), and found to be greatest for people (aged 55 years andover) using aids and equipment. Estimated rates of improvement were generally high, insome cases above 90%, and at least 10–20% higher than estimates for people using bothpersonal and aid and equipment assistance. These rates were lower still for people relying onpersonal assistance only.While it is proposed by Agree (1999) and Verbrugge and colleagues (1997; 2002) that aidsand equipment benefit those with an impairment more than the other forms of assistance,variation in its effectiveness can depend on the severity of impairment and, in some cases,the type of health condition. For example, 76% of people with a mild impairment had noresidual difficulty (i.e. ‘the degree of disablement that remains after (assistance has)ameliorated some part of the total underlying need’ Agree 1999:429) if using aids andequipment to perform a task (Agree 1999). This dropped to 65% and 52% of people withmoderate and severe impairments respectively.The combined use of personal and aid and equipment assistance follows the reverse pattern(i.e. the proportion of people experiencing residual difficulty increases with severity ofimpairment). The efficacy of personal assistance did not vary across severity of impairment,with similar proportions of people experiencing no residual difficulty (between 49–53% ofpeople).With regard to health condition, Agree (1999) focused on five health conditions—chroniclung disease, stroke, heart disease, arthritis and cognitive impairment—and found that aidand equipment assistance was less effective in reducing mobility difficulties and other taskrelated difficulties for those with chronic lung disease and arthritis. Personal assistanceprovided greater benefit to people with chronic lung disease, possibly because conventionalforms of (mobility) equipment did not immediately alleviate shortness of breath and lack ofoxygen, the prime antecedent to mobility impairment in this group (Agree 1999). For thosewith arthritis, the pain associated with using aids and equipment might necessitate thereceipt of personal assistance for certain tasks.Despite these anomalies, aids and equipment appear from the literature available to be moreeffective than personal assistance, or at least for people aged over 55 years. Verbrugge and
3 These tasks included dressing, bending to pick up clothes, opening jars, standing up from a chair,
walking a quarter mile, walking from room to room, and getting in and out of bed, the bathtub orthe car.

20
Sevak (2002) suggest that both objective and subjective facets associated with aid andequipment use influence its efficacy in alleviating disability. Objectively, aids and equipmentcan be fitted to deal specifically with the functional problems experienced by the user.Furthermore, aids and equipment are readily available which might not always be the casewith a personal carer. In subjective terms, aids and equipment promote feelings of autonomyand self-sufficiency in the user.
3.3 Abandonment of aids and equipmentDespite the potential advantage of aids and equipment use, some people still choose not torely on this form of assistance or abandon (i.e. discard) an aid after a defined period of use.Aids and equipment are abandoned for a multitude of reasons, and reported rates ofabandonment for a specific aid range from 8% to 75% (Phillips and Zhao 1993; Scherer 1996).High rates of abandonment are costly ‘both in terms of dollars and outcome achievement’(Scherer 1996) and suggest ‘a waste of a significant resource in an environment where thereis an increased need for cost containment and accountability in the provision of AT (assistivetechnology)’ (Kittel et al. 2002). Just as important is the human cost of abandonment, wherepeople who might have improved their ability to both perform activities of daily living andparticipate in the wider social and economic field find themselves ‘back at square one’.
Rates of abandonmentIn a survey of 227 adults with physical impairments, living in the US and aged 18 years andover, it was estimated that one third of devices reported by the survey sample were‘completely’ abandoned (Phillips and Zhao 1993). Mobility aids (e.g. crutches, walkers,canes, wheelchairs, electric scooters) tended to be abandoned more readily than otherdevices. This higher rate of abandonment might be a manifestation of the survey sample,which consisted of people with long-term disabilities, and in particular mobilityimpairments, who may have needed to change equipment over time. Phillips and Zhao(1993) also suggest that mobility aids, compared with other devices, are used more often inthe social world and users might change equipment until they find one with which they feelmore comfortable in social settings.The first year of use generally sees the highest rates of aid and equipment abandonment(Phillips and Zhao 1993; Scherer 1996). Temporary or never-used aids or equipment mayaccount for some of the abandonment but also includes aids or equipment consideredineffective by the user. A second peak of abandonment occurs around 5 years after theindividual first started using the device, which might reflect the need for, and the ability to,change the aid or type of equipment used.
Reasons for abandonmentReasons cited for abandoning aids and equipment largely relate to the characteristics of theequipment itself, the needs of the user, and the environment and psychosocial setting inwhich the aid or equipment is used.

21
Four significant reasons given for abandoning aids and equipment4 in Phillip and Zhao’s(1993) study were, in order of importance:• Changes in the needs or priorities of users. Both improvement and deterioration in
functional ability induced users to discard the original device(s), either because they didnot need them any more or to upgrade to another device.
• Ease of obtaining aids and equipment from a supplier. Aids and equipment that wereeasier to obtain tended to be abandoned more readily since the consumer believed thatthese devices, when needed again, could easily be replaced.
• Performance. Users indicated that if aids and equipment met their expectations foreffectiveness, reliability, durability, comfort, safety and ease of use, they were less likelyto abandon the device. Studies examining device preferences (e.g. Brooks and Hoyer 1989,cited in Phillips and Zhao 1993) specified such features as being important characteristicsof a good device.
• The level of consumer involvement in aid and equipment selection. Users felt verystrongly that their views and needs be taken into consideration when aids and equipmentwere being selected for them. It followed that where the user participated in the selectionof a device, the device was more often than not retained.
Other, more specific reasons for abandonment have been drawn from the sizeable amount ofresearch on mobility aids, in particular wheelchair, abandonment. Many reasons given bywheelchair users for abandonment focused on the physical properties of the wheelchairitself, including weight (too heavy or too light), manoeuvrability, rolling resistance, overalldesign, and difficulties transporting the wheelchair (Bates et al. 1993; Bell and Hinjosa 1995;Hesse et al. 1996; Post et al. 1997; Scherer 1996; and reviewed in Kittel et al. 2002). Some usersalso expressed physical discomfort associated with long periods in the wheelchair;limitations placed on function, mobility and access; poor device performance; and theunaesthetic nature of their wheelchair (Bates et al. 1993; Bell and Hinjosa 1995; Brooks 1991;Phillips and Zhao 1993).Psychosocial factors can also influence whether a person retains or discards an aid or piece ofequipment (Bell and Hinjosa 1995; Brooks 1991). For some, the use of a device ‘underscoresthe existence of impairment’ i.e. it constantly reaffirms the nature and extent of theirdisability. These feelings are especially real for new (and younger) device users. If anindividual sees the use of a device as undermining or impeding their independence or socialacceptance, the chances of a device being abandoned increase.Finally, one of the major contributions to dissatisfaction with devices, and hence theirabandonment, is poor feature matching and prescription practices (Hesse et al. 1996; Scherer1996). For example, a small group of South Australian wheelchair users interviewed by Kittelet al. (2002) stated that unsatisfactory interview processes with prescribing therapists led tothe prescription of inappropriate devices. Unsatisfactory interviews tended to occur when anindividual was being prescribed a device for the first time. While users conceded that someof the problem lay with not knowing what their future needs might be5, they also felt that
4 Abandonment in this study was defined as ‘nonuse’ of an equipment type or category, in the
context that it was once used or prescribed but never used.5 Wheelchair users interviewed in this study had been in rehabilitation facilities up until they were
prescribed a wheelchair.

22
prescribing therapists did not spend enough time exploring options, asking their opinion,and ‘feature matching’ i.e. translating the users’ expressed views on needs and lifestyle towhat they would require from their wheelchair. Poor feature matching can and does result inthe functional needs of the individual not being met, restricting participation in their socialand community roles. Those who feel a device impinges on their independence are likely toreport negative experiences with that device.To improve feature matching and prescriptive practices, consideration must be given to theenvironment in which the person uses the technology, the individual’s characteristics andpreferences, and the functions and features of the aid or piece of equipment (Scherer 1996).Consumers need to be involved in the process of aids and equipment selection, includingbeing able to make choices and to have control over the final decision. Without this input,and an improvement in information transferral to consumers, family members andproviders, discontent with, and the abandonment of, aids and equipment may be the result.

23
4 Use of aids and equipment in AustraliaThis chapter presents data on the use of aids and equipment by people with a disability inAustralia. Aids and equipment are one of the environmental factors recognised by the ICF asinfluencing the level of impairment, activity limitation or participation restrictionexperienced by a person with a disability.The data presented below profile the overall use of aids and equipment by people with adisability in terms of age group, core activity restriction status, and main disabling condition.Use of aids and equipment and its association with assistance from a personal carer and theneed for assistance with core activities (i.e. self-care, mobility and communication) are alsocovered. Aids and equipment will be referred to herein as aids.
4.1 ABS Survey of Disability, Ageing and Carers, 1998The primary data source used in this report is the 1998 Survey of Disability, Ageing andCarers. The 1998 survey is the latest in a series of disability surveys collected by the ABS, theprevious surveys taking place in 1981, 1988 and 19936. The ABS disability surveys are animportant source of national population data on disability. Data are collected from bothhouseholds and cared accommodation samples, in all states and territories.The 1998 disability survey defines people as having a disability if they report a limitation,restriction or impairment which has lasted, or is likely to last, for at least six months andrestricts everyday activities (ABS 1999:67). A ‘specific restriction’ is defined as a restriction incore activities (self-care, mobility and communication), schooling or employment (ABS1999:72).Four levels of core activity restriction—profound, severe, moderate and mild—aredetermined in the 1998 survey, based on whether a person needs help with, has difficultywith, or uses aids and equipment for any of the core activities. A person’s overall level ofcore activity restriction is determined by the highest level of restriction they experience inany of the core activity areas. Each level of core activity restriction is defined in Box 4.1.In the survey, respondents were also asked to indicate their long-term condition. A long-term condition is defined as a disease or disorder that has lasted or is likely to last for at leastsix months; or a disease, disorder or event that produces an impairment or restriction thathas lasted or is likely to last for at least six months. A main condition is a long-term conditionidentified by a person as the one causing the most problems. Where only one long-termcondition is reported, it is recorded as the main condition (ABS 1999:69).
6 The fifth Survey of Disability, Ageing and Carers will be run in 2003.

24
Box 4.1: ABS 1998 Survey of Disability, Ageing and Carers: restrictions and their severitySpecific restrictions are:• Core activity restrictions; and/or• Schooling or employment restrictions.Core activities are:• Self care—bathing or showering, dressing, eating, using the toilet, and managing incontinence;• Mobility—moving around at home and away from home, getting into or out of a bed or chair, and
using public transport; and• Communication—understanding and being understood by others: strangers, family and friends.A core activity restriction may be:• Profound—unable to perform a core activity or always needing assistance;• Severe—sometimes needing assistance to perform a core activity;• Moderate—not needing assistance, but having difficulty performing a core activity: or• Mild—having no difficulty performing a core activity but using aids or equipment because of
disability.Source: ABS 1999
Aids included in the surveySurvey respondents identified as having a disability (see above) were asked about their useof aids for self-care, mobility and communication tasks and, specifically, the types of aidsthey used for mobility (e.g. wheelchairs, canes), medical and communication purposes (e.g.non-electronic and electronic aids). These aids are listed in Table 4.1.
Table 4.1: Types of aids included in the Survey of Disability, Ageing and Carers, 1998
Broad category Specific aid
Self-care Eating, showering, toilet, incontinence and dressing aids
Mobility Electric wheelchairs and scooters, manual wheelchair, cane, crutches or walking stick, walking frame,seating and bedding aids, modified car aids and other
Communication(Reading and writing)
Non-electronic aids e.g. picture boards, symbol boards, large print booksElectronic aids e.g. audio tapes, talking word processor, special computer software and printoutsystem
Communication(Speaking)
Non-electronic aids e.g. picture boards, symbol boards, letter/word boardsElectronic aids e.g. digitised or synthesised speech output systemsFax and mobile phone
Meal preparation Not specified
Medical aids Nebulisers, dialysis machines, feeding pumps, pacemakers, oxygen concentrator or cylinder,ventilators, medical dressings, surgical stockings, pain management aids and other
Hearing aids Hearing aids, cochlear implants
Source: 1998 Survey of Disability, Ageing and Carers Questionnaire (including prompt cards).
While this list broadly captures the kinds of aids mostly available to people with a disability,it omits some items provided in Australian aids and equipment schemes, such as prosthesesand orthoses, hoists, lifters and standing equipment, and some specific communication aids.Also absent from the survey are questions on ‘seeing-eye dogs’ and other assistant animals,important for people with vision and hearing impairments, and mobility limitations.

25
4.2 Prevalence of aid useA total of 1,737,800 people with a disability used aids in 1998, or 48% of all people with adisability (Table 4.2). Among people with a disability, aid use was higher for those aged over65 (64%) compared with those aged between 0–64 years (40%). Males and females with adisability used aids at similar rates, although females did tend to show a higher use (51%)compared with males (46%). Sex differences in aid use was more pronounced in the under 65year age group.
Table 4.2: Use of aids by people with a disability by age group and sex, 1998
0–64 years 65+ years All ages
Male Female Total Male Female Total Male Female Total
Uses aids
Number (’000) 496.8 461.6 958.4 337.6 441.8 779.4 834.5 903.3 1,737.8
% of all with adisability 38.7 41.9 40.1 63.0 64.3 63.7 45.8 50.5 48.1
Total with adisability (’000) 1,285.1 1,102.2 2,387.4 536.0 686.7 1,222.5 1,821.1 1,788.9 3,610.0
Source: AIHW analysis of ABS 1998 Survey of Disability, Ageing and Carers Confidentialised Unit Record File.
4.3 AgeThe relationship between age and aids use is represented in more detail in Table 4.3.People with a disability and aged 45–64 (28%) or 65 years and older (45%) were greater usersof aids than younger people (Table 4.2). Aid users with a severe or profound core activityrestriction also tended to be older. Fifty two per cent of such users were aged over 65 yearsand 24% between the ages of 45 and 65.
Aid use within age groupsThe likelihood of aid use showed some variation between age groups. The proportion ofyounger people using aids ranged from 36% (15–29) to 40% (0–14) (Table 4.3). This compareswith 43% of people aged 45–64 years and 64% of people aged over 65 years who reportedaid use.
Table 4.3: People with a disability using aids, by age group, 1998
Age group (years)
0–14 15–29 30–44 45–64 65+ Total
All with disability
Number using aids (’000) 118.2 134.8 222.4 483.0 779.4 1,737.8
% of all with a disability 6.8 7.8 12.8 27.8 44.8 100.0
% within age group 39.8 36.1 36.9 43.3 63.7 48.1
Severe/profound coreactivity restriction
Number using aids (’000) 66.7 37.7 85.1 181.2 396.2 766.9
% of all with a SP core activityrestriction 8.7 4.9 11.1 23.6 51.6 100.0
% within age group 46.2 45.6 60.0 63.1 82.5 67.5
Source: AIHW analysis of ABS 1998 Survey of Disability, Ageing and Carers Confidentialised Unit Record File.

26
Some evidence of an age trend was also found if only people with a profound or severe coreactivity restriction were considered. While around 46% of people in the two youngest agegroups used aids, this climbed to 60% and 63% for the 30–44 and 45–64 age groupsrespectively and to 83% for the over 65s. This shows that the variation in use of aids with ageis not just a result of variation in severity of core activity limitation.
Type of aids usedAid users under the age of 65 used an average of 1.5 or 1.6 aids. For the over 65s, the averagenumber of aids used rose to 2.4 aids per individual (Table 4.4).The use of aids for specific activities also showed a relationship with age (Table 4.4 and seeAppendix Table 4.1 for proportional use of all aid types). By far the most commonly usedtype of aid for people with a disability aged under 65 years were medical aids; these aidsrepresented 40% or more of all aids used in each age group. Mobility aids were the secondmost used aid for those aged between 15 and 65 years, followed by self-care orcommunication aids. In contrast, self-care and communication aids were more commonlyused by the under 15s (16% each).Medical aids were also important for people aged over 65, accounting for 17% of all aidsused. However, older people tended to rely more on aids for self-care (32%) and mobility(28%). Hearing aids were also an important type of aid for this group, with 18% of all aidsused being some sort of hearing aid or cochlear implant.
Table 4.4: Aids used, by type of aids and age group (people with a disability), 1998
Age group (years)
0–14 15–29 30–44 45–64 65+
Type of aid ’000 % ’000 % ’000 % ’000 % ’000 %
Self-care 28.4 15.9 24.3 12.3 47.2 13.2 117.9 15.1 587.7 31.8
Mobility 21.2 11.8 33.7 17.1 60.1 16.8 137.8 17.7 512.4 27.8
Communication 28.5 15.9 24.0 12.1 58.5 16.4 119.1 15.3 87.6 4.7
Hearing 10.1 5.6 10.2 5.1 19.0 5.3 73.3 9.4 322.8 17.5
Meal preparation *3.0 *1.7 *4.3 *2.2 13.2 3.7 20.9 2.7 21.7 1.2
Medical 88.1 49.1 101.0 51.2 159.7 44.6 309.5 39.8 314.1 17.0
Total aids used 179.3 100.0 197.4 100.0 357.7 100.0 778.5 100.0 1,846.3 100.0
Total users 118.2 134.8 222.4 483.0 779.4
Average no. of aidsused 1.5 1.5 1.6 1.6 2.4
Note: Estimates marked * have an associated relative standard error of between 25% and 50%. These estimates should be interpretedaccordingly.
Source: AIHW analysis of ABS 1998 Survey of Disability, Ageing and Carers Confidentialised Unit Record File.
4.4 Severity of restrictionAid use increased with the severity of restriction. Twenty one per cent of people reportingeither a schooling or employment restriction only used aids, compared with between 47–52%of those with a moderate or mild core activity restriction and 60% with a severe restriction(Table 4.5). Three quarters of people with a profound core activity restriction used aids.

27
Table 4.5: People with specific restrictions, by use of aids and severity of restriction, 1998
Severity of core activity restriction
Profound Severe Moderate Mild
Schooling oremployment
restriction only(a)
0–64 years
Number using aids (’000) 127.6 243.1 208.3 249.2 67.9
% uses aids 58.4 55.6 48.0 39.4 20.7
65+ years
Number using aids (’000) 278.4 117.9 130.9 232.8 . .
% uses aids 87.2 73.1 58.0 58.4 . .
All ages
Number using aids (’000) 406.0 361.0 339.3 482.0 67.9
% uses aids 75.5 60.3 51.5 46.8 20.7
Total with restriction 537.8 598.7 659.4 1,030.6 328.4
(a) Schooling or employment restriction is not applicable to the over 65 age group.
. . not applicable
Source: AIHW analysis of ABS 1998 Survey of Disability, Ageing and Carers Confidentialised Unit Record File.
Around 58% and 56% of people aged 0–64 and with either a profound or severe core activityrestriction respectively used aids. Aid use declined to 48% of people with a moderate coreactivity restriction and 39% of people with a mild core activity restriction. The generallyhigher proportion of aid use by the over 65s (as shown in Table 4.3) is reflected in the higherpercentages observed for each restriction group, compared with the under 65s.
Type of aids usedPeople with a profound core activity restriction used an average of 3.5 aids (Table 4.6).Average number of aids used was lower for people with a severe or moderate core activityrestriction—1.9 and 1.5 aids respectively.
Table 4.6: Aids used, by type of aids and severity of core activity restriction, 1998
Severity of core activity restriction
Profound Severe Moderate Mild
Type of aid ’000 % ’000 % ’000 % ’000 %
Self-care 575.0 40.0 127.7 18.4 75.3 15.0 26.8 4.6
Mobility 481.7 33.5 166.9 24.0 77.0 15.3 39.7 6.9
Communication 92.6 6.4 102.3 14.7 57.5 11.5 55.0 9.5
Hearing 73.9 5.1 61.6 8.9 68.4 13.6 231.4 39.9
Meal preparation 26.3 1.8 20.5 3.0 *6.7 *1.3 *6.6 *1.1
Medical 188.2 13.1 215.5 31.0 216.7 43.2 219.7 37.9
Total aids used 1,437.7 100.0 694.4 100.0 501.5 100.0 579.2 100.0
Total users 405.6 361.0 339.3 482.0
Average no. ofaids used 3.5 1.9 1.5 1.2
Note: Estimates marked * have an associated relative standard error of between 25% and 50%. These estimates should be interpretedaccordingly.
Source: AIHW analysis of ABS 1998 Survey of Disability, Ageing and Carers Confidentialised Unit Record File.

28
The type of aid used varied with severity of core activity restriction (Table 4.6 and seeAppendix Table 4.2 for proportional use of all aid types). People with a profound coreactivity restriction relied mostly on self-care (40%) and mobility aids (34%). Medical aidswere the most commonly used aid for people with a severe (31%) or moderate (43%) coreactivity restriction, followed by mobility and self-care aids.Hearing aids were the most commonly used aid for people with a mild restriction (40%),followed by medical aids (38%) and communication aids (10%). The marked variation intype of aid use between this and other restriction groups is probably due to people with amild restriction generally not experiencing difficulty performing a core activity (i.e. mobility,self-care or communication) and thus not having as great a need for related aids.
4.5 Main disabling conditionFor people with a core activity restriction and using aids, most reported a physical/diversecondition as their main disabling condition (Table 4.7 and see Appendix Table A4.3 for list ofmain disabling conditions associated with each primary category). Around 77% and 74% ofaid users under and over the age of 65 years respectively had such a condition. Aid use wasmost commonly associated with ‘other musculoskeletal conditions’ (32%) in the under 65sand arthritis in the over 65s (21%).
Table 4.7: People with a core activity restriction using aids, by main disabling condition, 1998
0–64 years 65+ years
Main disabling conditionUses aids
(’000)% of all aid
users
% uses aid incondition
groupUses aids
(’000)% of all aid
users
% uses aid incondition
group
Physical/diverse 638.5 77.1 50.7 559.6 73.6 66.7
Circulatory 45.5 5.5 48.4 113.5 14.9 66.1
Respiratory 94.5 11.4 74.3 59.8 7.9 88.3
Arthritis 87.9 10.6 47.6 158.2 20.8 64.5
Neurological 12.8 3.0 47.3 23.5 3.1 77.3
Other musculoskeletal 261.3 31.5 46.4 109.0 14.3 60.4
Other physical 22.4 2.7 67.8 *5.2 *0.7 83.5
All other physical 101.9 12.3 50.1 90.4 11.9 65.7
ABI 12.3 1.5 39.3 *3.8 *0.5 89.8
Psychiatric 47.4 5.7 37.3 60.2 7.9 72.2
Intellectual/learning 47.0 5.7 29.4 *2.6 *0.3 51.9
Sensory/Speech 76.7 9.3 59.3 132.8 17.5 77.6
Vision *7.2 *0.9 32.0 37.8 5.0 57.1
Hearing 67.7 8.2 78.7 95.0 12.5 91.0
Speech **1.8 **0.2 8.5 **0.1 **0.0 8.0
Not applicable *6.3 *0.8 39.1 **0.9 **0.1 56.2
Total 828.3 100.0 759.9 100.0
Note: Estimates marked with ** have an associated relative standard error (RSE) of 50% or more. Estimates marked with * have an associatedRSE of between 25% and 50%. These estimates should be interpreted accordingly.
Source: AIHW analysis of ABS 1998 Survey of Disability, Ageing and Carers Confidentialised Unit Record File.

29
Aid use within main disabling condition groupsAid use among people aged 0–64 years and with a core activity restriction was especiallyprevalent for those with a sensory/speech (60%) or physical/diverse disability (51%)(Table 4.7). Within these groups, aids were commonly used by people with a hearingimpairment (79%) or an ‘other physical’ (e.g. paralysis) condition (68%).For people aged 65 years and over, aid use was generally very high (50% plus) for alldisabling condition groups. People with an acquired brain injury (ABI) (90%) or asensory/speech disability (78%) had the highest prevalence of aid use, followed by peoplewith a psychiatric disability (72%).
Average number of aids usedGenerally, people aged under 65 years and with a core activity restriction used an average ofone or two aids each (Table 4.8). A low use of aids was reported by people with aneurological condition, with an average of 0.4 aids used. In contrast, people reporting an‘other physical’ condition used on average 4.7 aids.Compared with people in the under 65 age group, the average number of aids used bypeople aged 65 years and over was high (Table 4.9). An average of 4.1 aids was used bypeople with an intellectual disability and 5.0 aids by those with an ‘other physical’ condition.An interesting difference between the two age groups is the 9-fold increase in the averagenumber of aids used by people with a neurological condition, from 0.4 for the under 65s to3.6 in the group aged 65+.
Type of aids usedPeople aged under 65 years and with either a hearing impairment or a respiratory-relatedcondition showed considerable use of just one aid category (Table 4.8). For the hearingimpaired these were, not surprisingly, ‘hearing and hearing associated aids’ (80%). Medicalaids were the most important group for those with a respiratory-related condition (77%).Medical aids were also the most commonly used aid for people under 65 years and with ‘allother physical’ conditions or a psychiatric condition. Use of medical aids accounted for 44%and 52% of all aid use for these two groups respectively (Table 4.8). In contrast, those whohad a neurological condition most commonly used mobility aids (32% of all aid use) andpeople with a vision impairment relied mostly on communication aids (46%).People aged 65 years and over and with a core activity restriction reported a higherproportional use of self-care and mobility aids, regardless of main disabling condition(Table 4.9). People with a respiratory-related condition, however, did show a slightlydifferent pattern. As found for people aged under 65, medical aids were the most importantaid used (45% of all aids used), followed by mobility aids at 19%. People with a hearingimpairment also showed a significant reliance on hearing and hearing associated aids (78%of all aids used).
4.6 Need for assistanceTable 4.10 examines need for assistance (either help or supervision) with daily activities forpeople with a core activity restriction of any level or those with a severe or profoundrestriction, and their use of aids. ‘Core activities’ are communication, mobility and self-care

30
Table 4.8: People aged 0–64 years with a core activity restriction and using aids, by main disabling condition and type of aid used, 1998
Type of aid
Self-care Mobility Communication HearingMeal
preparation Medical
Main disablingcondition ’000
% allaids ’000
% allaids ’000
% allaids ’000
% allaids ’000
% allaids ’000
% allaids
Total aids(’000)
Total useaids (’000)
Averageno. aids
Physical 180.6 16.4 225.3 20.5 160.1 14.6 33.4 3.0 32.4 2.9 466.7 42.4 1,099.2 638.5 1.7
Circulatory 16.8 19.9 19.7 23.4 15.5 18.5 *2.9 *3.4 **1.4 **1.7 27.9 33.11 84.2 45.5 1.9
Respiratory *6.0 *5.0 *5.3 *4.5 11.9 10.0 **1.5 **1.3 **2.2 **1.8 92.1 77.4 119.0 94.5 1.3
Arthritis 22.0 15.8 25.1 18.0 19.2 13.7 *7.0 *5.0 *5.2 *3.7 61.2 43.8 139.7 87.9 1.6
Neurological 17.0 25.0 21.6 31.7 10.1 14.8 **1.8 **2.6 *3.4 *5.1 14.2 20.8 68.2 68.2 0.4
Other musculoskeletal 53.7 12.7 88.3 20.9 68.0 16.1 11.9 2.8 10.7 2.5 189.4 44.8 423.1 261.3 1.6
Other physical 39.0 37.1 40.1 38.3 9.8 9.4 **1.5 **1.4 *3.5 *3.3 11.0 10.5 104.9 22.4 4.7
All other physical 26.1 16.2 25.2 15.6 26.3 16.3 *6.8 *4.2 *6.1 *3.8 70.8 43.9 161.3 101.9 1.6
ABI *6.8 *26.4 *7.3 *28.3 *4.1 15.9 **0.0 **0.0 **1.3 **4.9 *6.3 *24.5 25.7 12.3 2.1
Psychiatric *8.0 *12.5 *4.5 *7.0 13.2 20.6 *4.4 *6.9 **0.8 **1.2 33.1 51.8 63.9 47.4 1.3
Intellectual 19.4 23.9 *8.1 *10.0 25.0 30.8 *2.8 *3.4 **1.7 **2.1 24.2 29.8 81.3 46.9 1.7
Sensory/speech **2.4 **2.3 *4.2 *4.0 16.3 15.5 71.9 68.6 **1.7 **1.7 *8.4 *8.0 104.9 76.7 1.4
Speech 0 0.0 0 0.0 **1.7 **71.6 0 0.0 0 0.0 **0.7 **28.4 **2.4 **1.8 1.4
Vision **0.2 **1.4 *2.9 *22.8 *6.0 *46.3 **0.0 **0.2 **1.4 **10.5 **2.4 **10.5 12.9 *7.2 1.8
Hearing **2.2 2.5 **1.3 1.5 *8.6 9.6 71.9 80.2 **0.3 0.4 *5.3 5.9 89.6 67.7 1.3
Note: Estimates marked with ** have an associated relative standard error (RSE) of 50% or more. Estimates marked with * have an associated RSE of between 25% and 50%. These estimates should be interpretedaccordingly.
Source: AIHW analysis of ABS 1998 Survey of Disability, Ageing and Carers Confidentialised Unit Record File.

31
Table 4.9: People aged 65 years and over with a core activity restriction and using aids, by main disabling condition and type of aid used, 1998
Type of aid
Self-care Mobility Communication HearingMeal
preparation Medical
Main disablingcondition ’000
% allaids ’000
% allaids ’000
% allaids ’000
% allaids ’000
% allaids ’000
% allaids
Total aids(’000)
Total useaids (’000)
Averageno. aids
Physical 395.5 29.1 337.7 28.9 65.3 4.8 195.0 14.4 18.4 1.4 254.0 18.7 1,357.7 559.6 2.4
Circulatory 127.9 38.4 96.0 28.8 16.5 5.0 37.6 11.3 *4.7 *1.4 50.2 15.1 333.0 113.5 2.9
Respiratory 17.4 16.2 20.6 19.2 *3.2 3.0 16.4 15.3 **1.7 **1.6 48.2 44.9 107.4 59.8 1.8
Arthritis 75.5 21.0 53.1 14.8 17.7 4.9 55.8 15.5 *5.5 *1.5 59.6 16.6 358.9 158.2 2.3
Neurological 39.9 46.8 27.0 31.7 **2.4 **2.8 *4.4 *5.1 **1.5 **1.7 10.0 11.7 85.1 23.5 3.6
Other musculoskeletal 64.3 27.4 73.9 31.6 12.7 5.4 39.9 17.0 *2.8 *1.2 40.7 17.4 234.2 109.0 2.1
Other physical 9.4 36.1 11.9 45.3 **1.1 **4.3 **1.3 **5.0 0 0.0 **2.4 **9.3 26.2 5.2 5.0
All other physical 61.1 28.7 53.3 26.0 11.7 5.5 39.7 18.6 **2.2 **1.1 42.8 20.1 212.8 90.4 2.4
ABI *4.3 *45.0 **2.2 **23.0 0 0.0 **1.2 **12.2 0 0.0 **1.9 **19.8 9.6 3.8 2.5
Psychiatric 94.6 46.7 72.7 35.9 *3.5 *1.7 9.5 4.7 0 0.0 22.2 11.0 202.4 60.2 3.4
Intellectual *5.4 *51.0 *3.0 28.3 **1.2 **11.3 **0.2 **2.3 0 0.0 **0.8 **7.1 10.5 2.6 4.1
Sensory/speech 26.6 12.4 33.0 15.4 17.2 8.0 116.3 54.4 *3.3 *1.5 17.5 8.2 213.8 132.8 1.6
Speech 0 0.0 **0.1 **50.0 0 0.0 0 0.0 0 0.0 **0.0 **50.0 **0.1 **0.0 2.0
Vision 18.4 21.6 25.5 29.9 12.4 14.6 16.3 19.2 **2.3 **2.7 10.3 12.1 85.2 37.8 2.3
Hearing *8.2 *6.4 *7.4 *5.8 *4.8 *3.7 100.0 77.8 **0.9 **0.7 *7.2 *5.6 128.5 95.0 1.4
Note: Estimates marked with ** have an associated relative standard error (RSE) of 50% or more. Estimates marked with * have an associated RSE of between 25% and 50%. These estimates should be interpretedaccordingly.
Source: AIHW analysis of ABS 1998 Survey of Disability, Ageing and Carers Confidentialised Unit Record File.

32
activities while ‘All activities’ include core activities plus guidance, meal preparation, healthcare, housework and transport.
Use of aids for daily activitiesPeople aged 0–64 years, with a core activity restriction and who needed assistance with alldaily activities, generally reported a higher proportional use of aids compared with thosewho did not need assistance. This difference between use and non-use of aids was greater forthose who did not need assistance with all daily activities (38% and 62% respectively) thanfor those who did need assistance (52% and 48% respectively) (Table 4.10). This suggests thataids are less likely to be used when assistance is not needed.
Table 4.10: People with a core activity restriction, by use of aids and need for assistance withspecific activities, 1998
0–64 years 65+ years
Needs assistanceDoesn’t need
assistance Needs assistanceDoesn’t need
assistance
’000 % ’000 % ’000 % ’000 %
Core activity restriction
All activities(a)
Uses aids 623.7 52.2 190.8 37.8 468.9 67.6 147.9 59.0
Not using aids 571.8 47.8 314.3 62.2 224.5 32.4 102.7 41.0
Total 1,195.5 100.0 505.3 100.0 693.4 100.0 250.6 100.0
Core activities(b)
Using aids 354.6 56.3 459.9 43.0 250.1 78.7 366.7 58.6
Not using aids 275.7 43.7 610.4 57.0 67.7 21.3 259.5 41.4
Total 630.3 100.0 1,070.3 100.0 317.9 100.0 626.2 100.0
Severe or profound core activity restriction
All activities
Using aids 355.8 56.2 **1.5 59.3 256.2 79.0 **1.1 100.0
Not using aids 277.6 43.8 **1.0 40.7 68.3 21.0 0 0.0
Total 633.4 100.0 **2.5 100.0 324.6 100.0 **1.1 100.0
Core activities
Using aids 354.6 56.3 *2.7 48.1 250.1 78.7 *7.2 92.5
Not using aids 275.7 43.7 *3.0 51.9 67.7 21.3 **0.6 7.5
Total 630.3 100.0 *5.7 100.0 317.9 100.0 *7.8 100.0
(a) All activities include self-care, mobility, communication, health care, housework, guidance, meal preparation and transport.
(b) Core activities include self-care, mobility and communication.
Note: Estimates marked with ** have an associated relative standard error (RSE) of 50% or more. Estimates marked * have an associated relativestandard error of between 25% and 50%. These estimates should be interpreted accordingly.
Source: AIHW analysis of ABS 1998 Survey of Disability, Ageing and Carers Confidentialised Unit Record File.
For persons aged 0–64 years and with a severe or profound restriction, aid use for ‘allactivities’ was slightly higher for those who did not need assistance (59%) compared withthose who did need assistance (56%). However, aid use appeared more important for thosewho needed assistance specifically with the ‘core activities’; 56% used aids compared with48% who did not need assistance. Aid use by the over 65s with a core activity restriction wassignificant, regardless of whether the person needed assistance or not. However, the

33
proportion of aid use was much higher if assistance was needed. For example, 68% and 79%of those who needed assistance with ‘all activities’ or ‘core activities’ respectively used aidscompared with 59% (both activity categories) who did not need assistance.This trend was not so evident for the over 65s with a severe or profound core activityrestriction. Indeed, people reporting no need for assistance used aids more often than thosewho needed assistance. This finding, however, might be a product of low numbers in thisgroup.
Type of aid usedNeeding assistance with a core activity was not necessarily associated with the use of an aidspecific to the activity the aid was designed for (Table 4.11). On average, 40% of people witha severe or profound core activity restriction and reporting a need for assistance with self-care used an aid for self-care purposes. Uptake of self-care aids varied somewhat dependingon age group, from 17% for under 15s to 61% for the over 65s.A similar percentage, i.e. 41%, of people needing assistance with mobility used a mobilityaid. Again, the over 65s showed the highest proportional use of aids (59%), with use by theother groups ranging from 16% to 29%.The majority of people with a communication limitation did not use a communication aid,with only 8% of respondents reporting use of such an aid. The greatest use ofcommunication aids (13%) was found for the age group 30–44 years, the lowest (4%) for the45–64 year olds.
Table 4.11: People with a severe or profound core activity restriction and need for assistance with acore activity, by use of aids specific to the core activity, and age group, 1998
Age group (years)
0–14 15–29 30–44 45–64 65+ Total
Self-care
Needs assistance (’000) 85.9 34.5 87.3 171.5 302.6 681.8
Uses self-care aid (’000) 14.4 9.6 17.8 45.9 183.2 270.9
% 16.8 27.7 20.4 26.8 60.5 39.7
Mobility
Needs assistance (’000) 73.3 64.3 109.0 218.2 408.4 873.2
Uses mobility aid (’000) 11.9 13.1 29.4 62.4 239.1 355.9
% 16.2 20.4 27.0 28.6 58.5 40.8
Communication
Needs assistance (’000) 91.4 25.0 20.0 16.8 133.2 286.3
Uses communication aid(’000) 10.7 **2.3 **2.6 **0.6 *6.8 23.0
% 11.7 **9.3 **12.9 **3.7 *5.1 8.0
Notes
1. These data for each core activity group are not mutually exclusive, i.e. people expressing need for assistance with one core activity may alsoexpress need for assistance with another.
2. Estimates marked with ** have an associated relative standard error (RSE) of 50% or more. Estimates marked * have an associated relativestandard error of between 25% and 50%. These estimates should be interpreted accordingly.
Source: AIHW analysis of ABS 1998 Survey of Disability, Ageing and Carers Confidentialised Unit Record File.

34
Frequency of need for assistanceGenerally, people aged 0–64 years who required frequent need for assistance with a corerestriction (i.e. more than three times a day) were more likely to use aids (Table 4.12). Thiswas particularly true for those with a high need for self-care assistance; 47% of those whoreported using a self-care aid required frequent assistance compared with 19% of those whodid not use a self-care aid. As frequency dropped, so too did the reliance on aids. Around32% and 33% of people reporting use of a self-care and mobility aid respectively neededassistance between twice a week and twice a day. These proportions declined to 21% and26% when assistance was needed once a week or less.The non-use of self-care aids was associated with a lower need for self-care assistance butthis was not the case for people who needed assistance with mobility or communication. Forexample, over half of people needing assistance with mobility but not using a mobility aid(55%) needed assistance between twice a week up to twice a day, compared with 10% whoneeded assistance less than once a week.While there is evidence that the need for assistance with core activities is associated with theuptake of aids, there remains the finding that many people who need assistance with self-care, mobility or communication did not use any form of aid assistance. Reasons given in the1981 Survey of Disability, Ageing and Carers for not using aids included:• the high cost of aids (31%)• the amount of trouble associated with obtaining aids (30%)• the respondent not knowing where to get aids (14%)• the respondent reporting they did not need or cannot use it yet (12%) (ABS 1982).A similar question was not asked in the 1988, 1993 or 1998 surveys.
Table 4.12: People aged 0–64 years with a severe or profound core activity restriction, by use of aidsspecific to core activities, by frequency of need for assistance, 1998
Frequency of need for assistance
1/month to 1/week 2–6/week to 2/day 3–5/day to 6+ day Total
’000 % ’000 % ’000 % ’000 %
Needs assistance withself-care
Uses self-care aid 18.0 20.6 28.1 32.0 41.6 47.4 87.8 100.0
Doesn’t use self-care aid 121.1 41.6 113.6 39.0 56.7 19.4 291.4 100.0
Needs assistance withmobility
Uses mobility aid 30.3 26.0 38.8 33.2 47.7 40.9 116.8 100.0
Doesn’t use mobility aid 34.9 10.0 191.1 54.9 121.9 35.0 348.0 100.0
Needs assistance withcommunication
Uses communication aid *4.0 *5.0 *4.4 *7.1 *7.7 *47.9 16.2 100.0
Doesn’t use communicationaid 36.3 26.5 47.8 34.9 52.9 38.6 137.0 100.0
Notes
1. These data for each core activity group are not mutually exclusive, i.e. people expressing need for assistance with one core activity may alsoexpress need for assistance with another.
2. Estimates marked * have an associated relative standard error of between 25% and 50%. These estimates should be interpreted accordingly.
Source: AIHW analysis of ABS 1998 Survey of Disability, Ageing and Carers Confidentialised Unit Record File.

35
Type of assistanceAnother reason for non-use of aids might be a greater reliance on personal assistance instead.Table 4.13 investigates need for self-care, mobility and communication and the type ofassistance received—aids only, personal care only, a combination of aids and personal care,or no assistance at all.Personal assistance only was by far the most common form of assistance received—44%, 48%and 47% of people aged 0–64 years and who needed help with self-care, mobility andcommunication respectively relied solely on a primary carer. The sole use of aids was,correspondingly, quite low. Only 12% of people with a need for assistance with self-care ormobility used aids only, falling to 5% for those with a need for communication assistance.The use of both aids and personal assistance accounted for similar levels of use as that foundfor aids use only—11% for self-care, 14% for mobility and 5% for communication.Despite considerable reliance on personal assistance, there still exists a large proportion ofpeople who did not receive assistance. Forty three per cent of people who needed assistancewith communication did not use either form of assistance. This percentage declined forpeople needing self-care and mobility assistance but remains significant at 33% and 27% ofall respondents respectively.
Table 4.13: People aged 0–64 years with a severe or profound core activity restriction, by need forassistance with self-care, mobility or communication, by use of aids and primary care, 1998
Type of assistance
Uses aids onlyUses primary
carer onlyUses aids andpersonal carer Uses neither Total
Need forassistance ’000 % ’000 % ’000 % ’000 % ’000
Self-care 46.6 12.3 166.3 43.9 41.2 10.9 125.1 33.0 379.1
Mobility 54.3 11.7 222.7 47.9 62.5 13.5 125.3 27.0 464.8
Communication *7.9 *5.2 72.0 47.0 *8.3 *5.4 65.0 42.5 153.2
Notes
1. These data for each core activity group are not mutually exclusive i.e. people expressing need for assistance with one core activity may alsoexpress need for assistance with another.
2. Estimates marked * have an associated relative standard error of between 25% and 50%. These estimates should be interpreted accordingly.
Source: AIHW analysis of ABS 1998 Survey of Disability, Ageing and Carers Confidentialised Unit Record File.
4.7 Assistance from a primary carerTables 4.14 to 4.16 focus on use of aids and assistance from a primary carer, the carer’srelationship to the person they are caring for, and the hours the primary carer spends inattending to the person’s needs. The ABS defines a primary carer as a person of any age whoprovides the most informal assistance, in terms of help or supervision, to a person with oneor more disabilities. The assistance has to be ongoing, or likely to be ongoing, for at least sixmonths and be provided for one or more of the core activities (communication, mobility andself-care) (ABS 1999).

36
Receiving assistance from a primary carerGenerally, people with primary carers had a higher use of aids compared with people whodid not have carers (Tables 4.15, 4.15 and 4.16). This association held across all severitygroups and age groups although it was the least strong among people with a profound coreactivity restriction.Sixty percent of people aged under 65 years and who had a primary carer used aidscompared with 46% of those who did not have a carer. For the over 65s, this difference was82% and 63% respectively. Having a primary carer may mean the person has greaterassistance requirements and thus is more likely to rely on aids.
Relationship of primary carerThe relationship of the primary carer to the person they were caring for differed somewhatfor users and non-users of aids. Among people under the age of 65 and with a core activityrestriction, a spouse or partner was the most likely primary carer for those using aids (57%)whereas a parent was the more likely carer for people not using aids (49%) (Table 4.14). Thiswas not the case for the over 65s where a spouse or partner was the most common primarycarer regardless of aid use or non-use.
Table 4.14: People with a core activity restriction living in households, by primary carer status,relationship of carer and hours of care per week and use of aids, 1998
0–64 65+
Uses aids Doesn’t use aids Uses aids Doesn’t use aids
’000 % ’000 % ’000 % ’000 %
Primary careassistance
Has primary carer 139.4 60.0 92.9 40.0 102.5 82.4 21.9 17.6
Doesn’t have primarycarer 675.2 46.0 793.1 54.0 514.3 62.8 305.3 37.2
Relationship of carer
Spouse or partner 79.9 57.3 35.9 38.6 65.3 63.7 13.7 62.3
Parent 44.9 32.2 45.8 49.2 0 0.0 0 0.0
Child *8.2 *5.9 *3.6 *3.9 32.2 31.4 *5.8 26.2
Other relative or friend *6.4 *4.6 *7.7 *8.2 *5.0 *4.9 **2.5 **11.5
Hours of care per week
<20 hours 51.8 37.1 31.0 33.4 26.5 25.9 *6.4 *29.4
20–39 hours 25.4 18.2 15.3 16.4 19.1 18.7 *2.7 *12.1
40+ hours 55.0 39.5 40.6 43.7 50.3 49 11.8 53.7
Not stated *4.6 *3.3 *6.1 *6.5 *6.6 *6.4 **1.1 **4.8
Note: Estimates marked with ** have an associated relative standard error (RSE) of 50% or more. Estimates marked * have an associated relativestandard error of between 25% and 50%. These estimates should be interpreted accordingly.
Source: AIHW analysis of ABS 1998 Survey of Disability, Ageing and Carers Confidentialised Unit Record File.
Severity of restrictionAid users with a profound core activity restriction relied relatively equally on parents (50%)or a spouse (44%) to provide primary care, compared with non-users whose parent was theusual primary carer (70%) (Table 4.15). This pattern changed for people with a severe core

37
activity restriction where the spouse was the most important primary care giver for bothusers and non-users but more so for the former group (75% as compared to 64%).
Table 4.15: People aged 0–64 years with a profound or severe core activity restriction living inhouseholds, by primary carer status, relationship of carer and hours of care per week, by severity ofcore activity restriction and use of aids, 1998
Profound Severe
Uses aids Doesn’t use aids Uses aids Doesn’t use aids
’000 % ’000 % ’000 % ’000 %
Primary careassistance
Has primary carer 69.9 57.7 51.1 42.3 61.6 61.9 37.9 38.1
Doesn’t have primarycarer 45.6 56.2 35.5 43.8 180.3 53.9 154.0 46.1
Relationship of carer
Spouse or partner 30.4 43.5 9.7 18.9 44.9 75.2 24.2 63.6
Parent 34.8 49.8 35.9 70.3 *8.7 *14.5 9.2 24.2
Child *2.7 *3.8 **1.7 **3.3 *5.1 *8.6 **1.3 **3.5
Other relative or friend **2.0 **2.9 *3.8 *7.5 *3.1 *5.2 *3.3 *8.7
Hours of care per week
<20 hours 13.6 19.4 *8.0 15.6 33.8 56.7 20.6 54.3
20–39 hours 12.3 17.7 11.2 22.0 10.5 17.5 *4.0 *10.5
40+ hours 42.1 60.3 27.2 53.2 12.6 21.1 12.0 31.6
Not stated **1.2 **1.7 *4.7 *9.2 *2.0 *4.7 **1.4 **3.6
Note: Estimates marked with ** have an associated relative standard error (RSE) of 50% or more. Estimates marked * have an associated relativestandard error of between 25% and 50%. These estimates should be interpreted accordingly.
Source: AIHW analysis of ABS 1998 Survey of Disability, Ageing and Carers Confidentialised Unit Record File.
Age groupsParents tended to be the primary care giver for people aged 0–14 and 15–29 years, regardlessof whether the care recipient used aids or not (Table 4.16). For the older age groups, care wasreceived primarily from a spouse or partner, again regardless of aid use. Around 71% ofprimary care givers for aid users 30–44 years and using aids was a spouse or partner. Thiscontrasts with non-users of the same age group where 44% of primary care givers were aspouse or partner and 32% a parent.
Hours of careAids users aged under 65 received shorter hours of care from the primary carer, albeit onlyslightly less so (Table 4.14). In contrast among the over 65s it was non-users who receivedfewer hours of care.
Severity of restrictionReceiving 40 or more hours of care a week was common for people with a profound coreactivity restriction (Table 4.15). Of those who used aids, 60% reported receiving 40 or morehours of care compared with 53% of those who did not use aids. Hours of care received wereless on average for people with a severe core activity restriction. Just over half received less

38
than 20 hours of care, regardless of aid use. A greater proportion of non-users received 40 ormore hours care a week compared with aid users.
Age groupsSixty three per cent of people aged 14 years or younger and using aids received 40 or morehours of care a week compared to 54% of non-users (Table 4.16). For those over the age of65 years, 49% and 54% of aid users and non-users respectively obtained 40 or more hours ofcare.

39
Table 4.16: People with a core activity restriction living in households by primary carer status, relationship of carer and hours of care per week, by agegroup and use of aids and equipment, 1998
Age group (years)
0–14 15–29 30–44 45–64 65+
Uses aidsDoesn’t use
aids Uses aidsDoesn’t use
aids Uses aidsDoesn’t use
aids Uses aidsDoesn’tuse aids Uses aids
Doesn’t useaids
’000 % ’000 % ’000 % ’000 % ’000 % ’000 % ’000 % ’000 % ’000 % ’000 %
Primary careassistance
Has primary carer 31.3 52.6 28.2 47.4 14.2 51.0 13.6 49.0 32.4 61.9 19.9 38.1 61.5 66.4 31.2 33.6 102.5 82.4 21.9 17.6
Doesn’t haveprimary carer 63.0 42.9 83.4 57.1 85.5 41.9 118.6 58.1 155.3 44.1 196.5 55.9 371.6 48.5 394.6 51.5 514.3 62.8 305.3 37.2
Relationship ofcarer
Spouse or partner 0 0.0 0 0.0 *3.8 *27.1 **1.4 **10.3 23.0 71.1 *8.8 *44.4 53.0 86.2 25.7 82.3 65.3 63.7 13.7 62.3
Parent 29.6 94.3 26.7 94.6 *8.8 62.0 10.9 80.1 *4.5 *13.9 *6.3 *31.5 **2.1 **3.4 **1.9 **5.9 0 0.0 0 0.0
Child 0 0.0 0 0.0 0 0.0 0 0.0 *3.5 *10.8 **1.9 **9.7 *4.7 *7.6 **1.7 **5.4 32.2 31.4 *5.8 *26.2
Other relative orfriend **1.8 **5.7 **1.5 **5.4 **1.5 **10.9 **1.3 **9.6 **1.4 **4.2 *2.9 *14.4 **1.7 **2.8 **2.0 **6.3 *5.0 *4.9 **2.5 **11.5
Hours of care perweek
<20 *4.8 *15.4 *4.9 *17.4 *5.7 *40.1 *4.5 *33.4 14.7 45.4 *8.7 *43.6 26.6 43.2 26.6 41.6 26.5 25.9 *6.4 *29.4
20–39 *5.5 *17.5 *6.8 *24.2 *4.4 *31.0 *4.0 *29.3 *5.6 *17.4 **0.9 **4.3 9.9 16.1 9.9 11.4 19.1 18.7 *2.7 *12.1
40+ 19.8 63.3 15.2 53.8 *3.4 *24.1 *4.4 *32.4 *8.7 *26.7 9.0 45.2 23.1 37.6 23.1 38.4 50.3 49.0 11.8 53.7
Not stated **1.2 **3.8 **1.3 **4.6 **0.7 **4.8 **0.7 **4.9 **1.2 **3.9 **1.4 **6.9 **1.5 **2.4 **1.5 **8.7 *6.6 *6.4 **1.1 **4.8
Note: Estimates marked with ** have an associated relative standard error (RSE) of 50% or more. Estimates marked * have an associated relative standard error of between 25% and 50%. These estimates should beinterpreted accordingly.
Source: AIHW analysis of ABS 1998 Survey of Disability, Ageing and Carers Confidentialised Unit Record File.

40
5 Other environmental factorsThe experience of disability is influenced, at least in part, by the environment in which anindividual lives. This influence might be positive—enabling or facilitating a person with adisability to fulfil roles appropriate to their age, gender, social and cultural identity—ornegative, limiting achievement of daily activities and participation in employment,education, and social, cultural and leisure pursuits. Indeed, the environment has beenidentified as the primary factor that improves or disadvantages the lives of people withdisabilities (Hahn 1986; Barton 1994).The ICF identifies environmental factors as one of three components defining the concept ofdisability, and represents an important new component of the ICF. Environmental factorsrecognised by the ICF as instrumental in affecting functioning and disability includeproducts and technology, the natural and built environment, support, attitudes, and services,systems and policies that aim to provide benefits to people with disabilities.
5.1 Environmental factors and the Survey of Disability, Ageing andCarersAssessing the role the environment plays in the lives of people with disabilities is a complexexercise, as a multitude of environmental factors acting in concert may contribute todisability.The Survey of Disability, Ageing and Carers provides information on some of theenvironmental factors potentially impinging on a person’s quality of life—supportarrangements provided in educational and workplace settings; access to public and privatetransport; home modifications; receipt of assistance with activities of daily living, and theprovision and use of aids and equipment (covered in Chapter 4). However, because of thestructure of the Survey questionnaire, it can be difficult to determine whether exposure toany of these ‘positive’ environmental factors is related to need, what environmental factorsare not but should be available, or indeed the effect these environmental factors have onrespondents and their lives. Also, the Survey does not contain questions on attitudes and thephysical or natural environment or includes only a few questions related to supportrelationships, three key chapters of the ICF Environmental factors component.Because of these limitations in the available data, this chapter will focus solely on the state ofenvironmental factors listed above, rather than investigating effect. Some comment will bemade from supporting literature on how these environmental factors might affect peoplewith disabilities but will not be translated to evaluate results from data analyses.
5.2 Education and support arrangementsThe last 20 years in Australia has seen a strong movement towards educating students withdisabilities in mainstream schools and in mainstream classes. Research has shown thatchildren with disabilities benefit from participating in mainstream educational settings anddo not necessarily learn any better, either socially or academically, in special schools (seeForeman 2001 for a review). These findings, supplemented by an increasingly widespreadacceptance of people with disabilities, have spearheaded this movement into mainstream

41
education. Special education policies recognise the importance of enabling children withdisabilities to receive education in a mainstream classroom, with agreement that childrenshould be educated in the ‘least restrictive environment’ (Foreman 2001).The participation of children with disabilities in primary and secondary schooling in 1998was high in Australia, with over 95% of school-aged children (5–19 years) attending school.The increasing inclusion of children with disabilities in ‘ordinary’ (or mainstream) classes isreflected in the results given in Table 5.1. For children with disabilities, attendance inordinary classes was higher than in special classes or schools, regardless of severity of coreactivity restriction (Table 5.1). Over 70% of children with a severe, moderate or mild coreactivity restriction and 49% of children with a profound core activity restriction attended anordinary classes. Around 60% of children with a schooling restriction only7 also attendedordinary classes.The proportion of children attending special classes was much lower but similar betweencore activity restriction groups, ranging from 22% (mild core activity restriction) to 25%(profound, severe and moderate core activity restriction) of school-aged children. Thehighest level of special class attendance (39%) was found for children with a schoolingrestriction (but see footnote below). The majority of special school attendants were childrenwith profound core activity restrictions (26%).
Table 5.1: People aged 5–19 years with a specific restriction, by type of school/class attended andseverity of restriction, 1998
Profound Severe Moderate Mild
Schoolingrestriction
only
Type of class/school ’000 % ’000 % ’000 % ’000 % ’000 %
Ordinary class 29.1 49.1 36.9 71.0 11.5 73.0 32.1 77.2 27.9 60.1
Special class 14.9 25.2 13.2 25.3 *4.0 *24.9 9.0 21.7 17.9 38.6
Special school 15.2 25.7 **1.9 **3.7 **0.3 **2.1 **0.5 **1.2 **0.6 **1.3
Total attending 59.2 95.9 52.1 95.8 15.7 96.1 42.0 99.0 46.5 100.0
Not attending **2.5 **4.1 **2.3 **4.2 **0.6 **3.9 **0.4 **1.0 0 0.0
Note: Estimates marked with ** have an associated relative standard error (RSE) of 50% or more. Estimates marked with * have an associatedRSE of between 25% and 50%. These estimates should be interpreted accordingly.
Source: AIHW analysis of ABS 1998 Survey of Disability, Ageing and Carers Confidentialised Unit Record File.
Support arrangements in primary and secondary schoolsFor some children, successful participation at school can depend on receiving supportarrangements that enable or improve their ability to learn, write, communicate and get toand around school. Table 5.2 lists the types of support arrangements provided by schools forchildren with a profound or severe core activity restriction. Overall, a higher proportion ofchildren attending special classes and, particularly, special schools, received supportarrangements, compared with children attending ordinary classes. This may reflect either the
7 A person is considered to have a schooling restriction if they are unable to attend school, attend a
special school, attend special classes at an ordinary school, need at least one day a week off schoolon average or have difficulty at school (ABS 1999).

42
higher support needs of children in special education settings and/or a better array offacilities available in special compared with conventional education settingsSpecial tuition was the most common form of support received by children in all threeeducation settings. Around 64% of children in special classes and special schools, and 17% ofchildren in ordinary classes, received special tuition. Another common form of support forchildren was assistance from a disability support person/signing interpreter/counsellor—42%, 17% and 12% of children in special schools and special classes and ordinary classesrespectively received this kind of support. A sizeable proportion (47%) of children attendingspecial schools also benefited from special access or transport arrangements, compared withonly 5% and 2% of children in special and ordinary classes respectively. This difference againmight be related to need, quality and/or quantity of support arrangements.Eighty four per cent of children attending ordinary classes did not receive or need educationsupport arrangements. This figure is lower for children in special classes or special schools at31% and 18% respectively8.
Table 5.2: People aged 5–19 years with a specific restriction by type of support provided and type ofschool/class, 1998
Ordinary class Special class Special school
Support arrangements provided ’000 % ’000 % ’000 %
Signing interpreter, counsellor or disabilitysupport person
15.8 11.5 10.2 17.3 *7.9 *42.3
Special computer or equipment **1.3 **0.9 *4.1 *6.9 *4.9 *26.5
Special tuition 23.1 16.8 37.5 63.6 11.8 63.6
Special assessment procedures *5.1 *3.7 11.3 19.2 *5.4 *29.0
Special access or transport arrangements *3.2 *2.3 *2.9 *4.9 *8.8 *47.4
Other support conditions 14.6 10.6 **1.6 **2.9 *2.7 *14.3
No support conditions received or needed 114.8 83.5 18.1 30.6 *3.3 *17.9
Total attending school(a) 137.5 59.0 18.6
(a) Total may not equal to the sum of the components as more than one answer could be given to question on support arrangements provided.Percentages therefore do not add up to 100%
Note: Estimates marked with ** have an associated relative standard error (RSE) of 50% or more. Estimates marked with * have an associatedRSE of between 25% and 50%. These estimates should be interpreted accordingly.
Source: AIHW analysis of ABS 1998 Survey of Disability, Ageing and Carers Confidentialised Unit Record File.
Support arrangements in post-secondary schoolsSupport provided to students in post-secondary educational settings was mostly in the formof a support person, special assessment procedures, equipment or transport arrangements(Table 5.3). Higher education establishments and TAFE colleges provided the greaterproportion of these support arrangements. Compared with school-aged children,considerably more people in post-secondary education reported not receiving or needingsupport arrangements—76% of people at university, 85% attending TAFE and 91% in otherpost-secondary institutions.
8 The data do not allow separation of children who did not need support arrangements from those
who needed support arrangements but did not receive them.
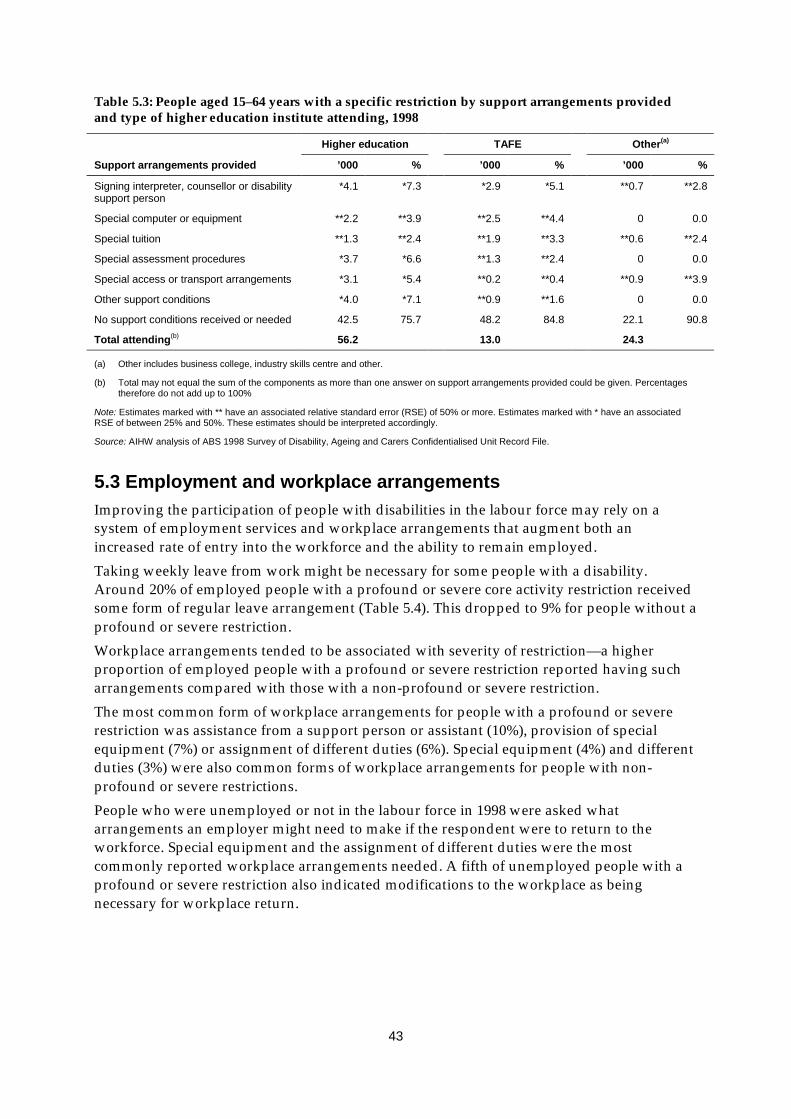
43
Table 5.3: People aged 15–64 years with a specific restriction by support arrangements providedand type of higher education institute attending, 1998
Higher education TAFE Other(a)
Support arrangements provided ’000 % ’000 % ’000 %
Signing interpreter, counsellor or disabilitysupport person
*4.1 *7.3 *2.9 *5.1 **0.7 **2.8
Special computer or equipment **2.2 **3.9 **2.5 **4.4 0 0.0
Special tuition **1.3 **2.4 **1.9 **3.3 **0.6 **2.4
Special assessment procedures *3.7 *6.6 **1.3 **2.4 0 0.0
Special access or transport arrangements *3.1 *5.4 **0.2 **0.4 **0.9 **3.9
Other support conditions *4.0 *7.1 **0.9 **1.6 0 0.0
No support conditions received or needed 42.5 75.7 48.2 84.8 22.1 90.8
Total attending(b) 56.2 13.0 24.3
(a) Other includes business college, industry skills centre and other.
(b) Total may not equal the sum of the components as more than one answer on support arrangements provided could be given. Percentagestherefore do not add up to 100%
Note: Estimates marked with ** have an associated relative standard error (RSE) of 50% or more. Estimates marked with * have an associatedRSE of between 25% and 50%. These estimates should be interpreted accordingly.
Source: AIHW analysis of ABS 1998 Survey of Disability, Ageing and Carers Confidentialised Unit Record File.
5.3 Employment and workplace arrangementsImproving the participation of people with disabilities in the labour force may rely on asystem of employment services and workplace arrangements that augment both anincreased rate of entry into the workforce and the ability to remain employed.Taking weekly leave from work might be necessary for some people with a disability.Around 20% of employed people with a profound or severe core activity restriction receivedsome form of regular leave arrangement (Table 5.4). This dropped to 9% for people without aprofound or severe restriction.Workplace arrangements tended to be associated with severity of restriction—a higherproportion of employed people with a profound or severe restriction reported having sucharrangements compared with those with a non-profound or severe restriction.The most common form of workplace arrangements for people with a profound or severerestriction was assistance from a support person or assistant (10%), provision of specialequipment (7%) or assignment of different duties (6%). Special equipment (4%) and differentduties (3%) were also common forms of workplace arrangements for people with non-profound or severe restrictions.People who were unemployed or not in the labour force in 1998 were asked whatarrangements an employer might need to make if the respondent were to return to theworkforce. Special equipment and the assignment of different duties were the mostcommonly reported workplace arrangements needed. A fifth of unemployed people with aprofound or severe restriction also indicated modifications to the workplace as beingnecessary for workplace return.

44
Table 5.4: People aged 15–65 years with a specific restriction, by employment and restriction status, and workplace arrangements, 1998
Employed Unemployed Not in labour force
Profound/SevereNon
Profound/Severe Profound/SevereNon
Profound/Severe Profound/SevereNon
Profound/Severe
’000 % ’000 % ’000 % ’000 % ’000 % ’000 %
Workplace arrangements
Support person or assistant 14.4 9.5 11.8 1.9 **0.8 **4.3 **1.0 **1.2 10.0 3.1 *6.0 *1.0
Special equipment 10.2 6.7 23.5 3.8 *4.8 *25.8 *7.0 *8.4 11.6 3.6 14.0 2.4
Modifications to workplace *4.9 *3.2 *6.4 *1.0 *3.7 *19.8 *2.7 *3.3 *4.9 *1.5 *5.1 *0.9
Training or retraining **2.5 **1.6 *3.4 *0.5 0 0.0 **1.3 **1.6 *7.7 *2.4 *6.7 *1.2
Different duties *8.9 *5.9 19.9 3.2 **1.1 **5.7 *4.3 *5.3 12.6 3.9 11.3 2.0
Other arrangements *6.6 *4.3 9.1 1.5 **1.6 **8.4 *3.3 *4.0 *5.2 *1.6 *6.7 *1.2
No arrangements given orrequired 71.8 47.2 401.7 64.6 9.0 48.4 62.6 75.1 31.1 9.7 148.9 25.7
Leave arrangements
Leave arrangements 30.6 20.2 53.1 8.5 . . — . . — . . — . . —
Does not need leavearrangements 80.2 52.8 417.9 67.2 . . — . . — . . — . . —
Total with a restriction 151.9 621.7 18.7 83.3 321.7 579.6
Notes
1. Respondents who were unemployed or not in the labour force at the time of the survey were asked about the types of workplace arrangements they would need to return to the workforce.
2. Totals may not equal to the sum of the components, as more than one response could be given. Percentages therefore do not add up to 100%
3. Estimates marked with ** have an associated relative standard error (RSE) of 50% or more. Estimates marked with * have an associated RSE of between 25% and 50%. These estimates should be interpretedaccordingly.
. . not applicable
— rounded to zero, including null cells
Source: AIHW analysis of ABS 1998 Survey of Disability, Ageing and Carers Confidentialised Unit Record File.

45
5.4 Access to public transportSafe and ready access to public transport enables people with disabilities to obtainindependence in transportation, particularly where other forms of transport are not readilyavailable, and to improve participation, by providing the means by which educational, work,and social and cultural settings can be easily reached. In recognition of the importance ofpublic transport to people with disabilities, Parliament passed in October 2002 the DisabilityStandards for Public Transport under the Disability Discrimination Act, which outlinesmeasures transport operators and providers should take to make public transport moreaccessible.
Availability of public transportPublic transport was available to 80% and 72% of all people with a core activity restrictionaged 5–64 years or 65 years and over respectively (Table 5.5). Of those people who usedpublic transport, 90% aged under 65 and 95% aged over 65 reported public transport beingreadily available in their area. The difference between these percentages may be becausesome people who might otherwise use public transport do not do so because of limitedavailability.Ninety eight per cent of people aged over 65 and who used public transport held aconcession card compared to 52% of people under 65. This large difference may be partlyexplained by people over 65 years’ eligibility for the Seniors Cards.
Table 5.5: People with a core activity restriction, by availability and use of public transport, 1998
All with core activityrestriction Users of public transport
Public transportavailable
Public transportavailable
Has concessioncard
Total users
Age group (years) ’000 % ’000 % ’000 % ’000
5–64 1,376.3 79.4 676.0 90.2 391.3 52.2 749.2
65+ 796.0 72.1 397.3 94.8 409.4 97.7 419.0
Source: AIHW analysis of ABS 1998 Survey of Disability, Ageing and Carers Confidentialised Unit Record File.
Problems associated with public transport useThree quarters of people with a core activity restriction aged under 65 years reported beingable to use all forms of transport, 8% some forms of public transport and 13% no form ofpublic transport at all (Table 5.6). In comparison, around 58% of people with a core activityrestriction and over the age of 65 years could use all forms of public transport but similarpercentages reported ability to use only use some forms (10%) or no form at all (16%).Survey respondents reported a range of problems and difficulties associated with their use ofpublic transport. Access difficulties associated with doors, steps or other structural featuresof the mode of transport was the primary problem experienced by both age groups—16% ofpeople aged 5–64 years and 33% of people aged 65 and over (Table 5.6). Being able to get toand from the station or transport stops was another significant problem faced by people withcore activity restrictions.

46
Table 5.6: People with a core activity restriction, by ability to use public transport and problems ordifficulties associated with public transport use, 1998
0–64 years 65+ years
’000 % ’000 %
Ability to use public transport
Can use all forms 1,299.2 75.4 640.8 58.0
Can use some forms 139.8 8.1 108.0 9.8
Can’t use any form 219.0 12.7 175.1 15.9
Doesn’t leave home 11.6 6.7 20.0 1.8
Not applicable 52.3 3.0 160.7 14.6
Reasons or difficulties associated with use
Getting to stops and stations 121.7 7.1 173.6 15.7
Getting in and out of vehicles (steps/doors/other) 267.0 15.5 360.2 32.6
Inadequate access to toilets 13.7 0.8 12.2 1.1
Crowds/poor ventilation 54.5 3.2 19.0 1.7
Lack of seating 76.6 4.5 68.4 6.2
Discomfort associated with seated position 113. 2 6.6 53.7 4.9
Total with a core activity restriction 1,721.7 1,104.8
Source: AIHW analysis of ABS 1998 Survey of Disability, Ageing and Carers Confidentialised Unit Record File.
Transport use in previous fortnightMost respondents relied on private transport as their primary form of transport in thefortnight preceding the survey—around 80% of people with a core activity restriction in bothage groups (Table 5.7). Public transport accounted for 7% and 8% of transport usedrespectively by people aged under 65 and over 65 years. Reasons for using private transportover other forms of transport varied, with 85% of people regardless of age group indicatingthat private transport was more convenient, quicker and/or easier to use. Around 6% ofpeople, however, stated that the absence of public transport in their area meant they had torely on private transport.Problems encountered with public transport was the reason given by a smaller proportion ofpeople (2% of those aged under 65; 3% of those aged over 65) for relying on private ratherthan public transport. Difficulty due to disability was the primary reason most of thesepeople cited as their major problem using public transport: 68% of people aged 5–64 yearsand 85% of people aged over 65 years reported this reason. Problems with the safety,frequency and reliability of services and, in particular, the absence of direct services, werealso identified as barriers to public transport use.

47
Table 5.7: People with a core activity restriction, by transport used in last fortnight and problemsassociated with use of public transport, 1998
0–64 years 65+ years
’000 % ’000 %
Main form of transport used in lastfortnight
Private transport (as passenger or driver) 1,353.99 82.3 694.3 79.5
Public transport 119.4 7.3 70.8 8.1
Other 172.6 8.1 107.8 10.4
Total made journey last fortnight 1,645.9 100.0 873.0 100.0
Reason for using private transport in lastfortnight
Quicker/more easier/convenient 1,146.2 84.7 588.9 84.8
More comfortable 55.2 4.1 27.9 4.0
No public transport available 83.7 6.2 40.3 5.8
Other problems with public transport 22.4 1.7 18.6 2.7
Other reasons 46.4 3.4 18.7 2.7
Total using private transport in last fortnight 1,353.9 100.0 694.3 100.0
Problems with public transport
Too infrequent **2.5 **1.3 **0.7 **3.9
Too unreliable **1.3 **5.8 0 0.0
Overloaded **0.7 **3.0 0 0.0
No direct services *6.2 *27.6 **2.3 **12.3
Safety of services **2.5 **11.2 0 0.0
Difficulty due to disability 15.3 68.4 16.0 85.4
Other problems **0.8 **35.6 **0.6 **3.2
Total citing problems with public transport(a) 22.4 18.6
(a) Percentages do not add up to 100% as more than one response on problems with public transport could be given.
Note: Estimates marked with ** have an associated relative standard error (RSE) of 50% or more. Estimates marked with * have an associatedRSE of between 25% and 50%. These estimates should be interpreted accordingly.
Source: AIHW analysis of ABS 1998 Survey of Disability, Ageing and Carers Confidentialised Unit Record File.
5.5 Assistance with daily activitiesRespondents in the Survey could report type of assistance received as informal only, formalonly or a combination of both. Informal assistance was the main type of assistance receivedby people aged 0–64 years with a core activity restriction, ranging from 52% for health care to88% for meal preparation (Table 5.8). For the core activities, informal assistance accountedfor 81% of self-care and 76% of mobility assistance received. Communication was theexception, where only 36% of assistance came from informal carers. Instead, around 55% ofall assistance for communication was received from a combination of formal and informalservices.Formal services only generally accounted for less than 10% of assistance received for dailyactivities, with the exception of health care services, where 19% of all assistance with healthcare being attributed to formal services.

48
Table 5.8: People aged 0–64 years with a core activity restriction living in households, by need forassistance with daily activities by type of assistance received, 1998
% type of assistance received % extent need for assistance met
Type of activityInformal
onlyFormal
only Both None Fully met Partly met Not metTotal(’000)
Self-care 81.4 2.9 8.2 7.4 87.8 4.7 7.4 361.7
Mobility 75.8 3.2 14.2 6.8 82.2 11.0 6.8 440.4
Communication 35.6 *5.4 54.7 *4.3 62.5 33.2 *4.3 138.3
Health care 52.1 18.6 22.3 7.0 82.8 10.2 7.0 477.2
Transport 84.5 3.1 6.4 6.0 81.8 12.3 5.9 410.0
Housework 80.8 5.6 8.4 5.3 77.9 16.9 5.3 438.4
Meal preparation 88.2 *2.1 *5.3 *4.4 86.0 9.7 *4.4 149.2
Paperwork 79.6 4.6 7.4 8.4 79.1 12.6 8.4 188.0
Property maintenance 68.9 10.8 12.7 7.5 73.8 18.6 7.5 629.0
Note: Estimates marked with * have an associated RSE of between 25% and 50%. These estimates should be interpreted accordingly.
Source: AIHW analysis of ABS 1998 Survey of Disability, Ageing and Carers Confidentialised Unit Record File.
Informal services also tended to be the primary form of assistance for people aged over 65years. However, there was a greater proportion of assistance attributed to formal servicesonly compared with that reported by people under the age of 65 years (Table 5.9). This wasparticularly apparent for housework and property maintenance (25% of all assistance), andhealth care where a higher proportion (48%) of assistance came from formal rather thaninformal services (30%). There was an interesting contrast between age groups in the receiptof assistance for communication; 86% of all assistance for those age over 65 years came frominformal services only whereas just 36% did for people aged under 65 years.
Table 5.9: People aged 65+ years with a core activity restriction living in households by need forassistance with daily activities by type of assistance received, 1998
% type of assistance received % extent need for assistance met
Type of activityInformal
onlyFormal
only Both None Fully met Partly met Not metTotal(’000)
Self-care 68.0 8.6 14.3 9.0 86.1 *4.8 9.0 155.2
Mobility 75.7 4.5 13.9 5.9 81.6 12.5 5.9 273.6
Communication 85.9 0.0 **3.3 *10.8 86.6 **2.5 *10.8 28.6
Health care 30.0 48.0 15.3 5.8 85.2 9.1 5.8 369.0
Transport 76.5 6.1 11.6 5.7 84.5 9.7 5.7 232.2
Housework 51.7 25.4 18.7 4.3 82.2 13.5 4.3 365.3
Meal preparation 71.6 15.7 10.6 *2.2 91.9 6.2 *2.2 135.4
Paperwork 88.2 *3.7 *4.2 *4.0 91.1 *4.9 *4.0 136.0
Property maintenance 50.5 25.2 19.2 5.2 75.8 19.1 *5.2 494.0
Note: Estimates marked with ** have an associated relative standard error (RSE) of 50% or more. Estimates marked with * have an associatedRSE of between 25% and 50%. These estimates should be interpreted accordingly.
Source: AIHW analysis of ABS 1998 Survey of Disability, Ageing and Carers Confidentialised Unit Record File.
In both age groups, a high proportion (more than 70%) of people who required assistancehad their needs fully met, although this was somewhat higher for people aged 65 years andover (Tables 5.8 and 5.9). People aged 0–64 years who needed assistance withcommunication, however, were less likely to report having their needs fully met (63%), and

49
were more likely to report having their needs partly met (33%), compared with peopleneeding assistance with other daily activities. There also remained a substantial proportionof people whose needs were not met at all. Among people aged 0–64 years, this especiallyaffected those needing assistance with self-care (7%), mobility (7%), health care (7%),paperwork (8%) and property maintenance (8%). Self-care and communication were themain activities for which people aged over 65 years reported higher levels of no assistance9,9% and 11% respectively. An absence of adequate assistance is a continuing problem forpeople with disabilities (AIHW 2001), impinging on their potential for participation andquality of life.
5.6 Home modificationsModifications to the home environment can improve the physical independence of peoplewith disabilities, from enhancing mobility in and around the home to facilitating ability toperform self-care activities. These modifications can include alterations to kitchen, bathroomand laundry fixtures, structural and architectural changes, and access alterations.
Table 5.10: People with a core activity restriction living in households by severity of core activityrestrictions, age group, tenure type and type of home modifications, 1998
Have home modifications % type of home modifications(a)
’000 %% use
aidsStructural
changes RampsBathroom
/ laundryHandgrab
railsOther Total
(’000)
Core activity restriction
Profound 122.9 22.8 87.0 22.7 21.9 54.3 63.2 *6.6 537.8
Severe 80.6 13.5 87.3 16.8 14.7 39.4 52.6 *8.3 598.7
Moderate 65.9 10.0 75.6 *9.5 14.4 39.4 54.2 **3.0 656.3
Mild 54.0 5.2 76.9 *7.3 *6.8 29.1 43.6 *9.9 1,026.8
Age group
0–14 22.9 11.1 75.2 *29.6 *14.2 *20.7 *14.2 *11.3 205.7
15–29 15.7 6.7 74.8 *31.3 *22.8 *38.3 *18.1 *24.6 234.7
30–44 33.8 8.2 82.5 *20.2 *18.0 39.8 42.2 *12.1 410.0
45–64 70.8 8.1 82.9 23.8 21.7 36.2 40.8 *7.1 870.8
65+ 180.1 16.3 84.9 9.0 13.1 50.1 72.3 *3.6 1,104.7
Tenure type(a)
Owner 248.0 13.9 82.8 16.1 16.0 41.1 56.3 6.8 1,783.7
Renter 43.4 7.5 86.5 *10.6 *17.3 46.0 52.0 **3.6 575.0
Boarder 15.5 14.6 71.3 *21.5 **10.0 51.7 54.7 **12.6 106.5
Rent-free 13.7 12.7 89.5 **10.9 *18.6 64.0 57.7 **11.9 108.3
Other 2.8 13.9 80.4 *66.0 **24.2 **49.8 **30.7 0.0 20.4
(a) Does not include ‘Not applicable’ responses.
Note: Estimates marked with ** have an associated relative standard error (RSE) of 50% or more. Estimates marked with * have an associatedRSE of between 25% and 50%. These estimates should be interpreted accordingly.
Source: AIHW analysis of ABS 1998 Survey of Disability, Ageing and Carers Confidentialised Unit Record File.
9 Due to the structure of the Survey CURF, it was not possible to separate people who did not need
assistance from those who needed assistance but did not receive it.

50
People with profound or severe core activities were more likely to modify their homes thanthose with a moderate or mild core activity restriction. Around 23% and 14% of people witha profound or severe core activity restriction lived in homes that had received some sort ofmodification (Table 5.10). The occurrence of home modifications generally rose with age,with 16% of people aged 65 and over and with a core activity restriction living in suchhomes. The exception was the age group 0–14 years, where the occurrence of homemodification was second highest at 11%. Rates of home modifications were similar (between13–14% of homes) in the homes of people who either owned the dwelling or lived in it as aboarder or rent-free. The latter may be because individuals are dependent on familymembers. Modifications were less common (8%), however, in the homes of renters.Structural changes, modifications to the toilet, laundry or bath, and the addition of rampswere the most common modifications made to houses for people under 30 years of age. Forpeople aged over 30 years, handgrab rails were the most common type of homemodification, followed by toilet, laundry or bath modifications.Structural modification to the home may not be a cheap option and only those with thefinancial means, either through personal means or from an equipment scheme, may be in theposition to afford such changes. The low occurrence of home modification possibly reflectsthe financial inability of some people to make the changes to the home they need. Ownershipof the home is another potentially confounding factor, with equipment/home modificationschemes (e.g. CAEP) stipulating that the home must be privately owned. People living inrental properties are therefore excluded from making such claims.The occurrence of home modification in the homes of people also reporting the use of aidsand equipment is markedly higher than those who do not use aids and equipment,exceeding 71% regardless of severity of core activity restriction, age or housing tenure. Thissuggests that those who use aids and equipment are more inclined to have their homesmodified, possibly to complement their use of specific aids. However, this does not implythat all those people not using aids and equipment do not need home modifications butrather that some are not in the financial position to have these changes made.
51
Appendix: Detailed tables

52
Table A4.1: Aids used, by types of aids and age group (people with a disability), 1998Age group
0–14 15–29 30–44 45–64 65+
Type of aid ’000 % ’000 % ’000 % ’000 % ’000 %
Eating *7.2 *4.0 **1.7 **0.8 *6.8 *1.9 *6.7 *0.9 46.5 2.5
Showering *7.1 *4.0 *8.2 *4.2 18.2 5.1 55.8 7.2 242.0 13.1
Toilet *6.3 *3.5 *5.5 *2.8 11.6 3.2 25.6 3.3 137.1 7.5
Incontinence *6.2 *3.5 *5.7 *2.9 *4.4 *1.2 14.3 1.8 98.9 5.4
Dressing **1.7 **0.9 *3.3 *1.7 *6.1 *1.7 15.7 2.0 63.3 3.4
Electric wheelchair/ scooter **2.0 **1.1 *4.6 *2.3 *3.4 *1.0 *7.9 *1.0 13.6 0.7
Manual wheelchair *4.9 *2.7 *8.8 *4.5 9.4 2.6 15.5 2.0 85.0 4.6
Cane **0.1 **0.3 ** 0.6 **0.3 *5.5 *1.8 *6.7 *0.9 21.7 1.2
Crutches/walking stick **1.9 **1.1 *3.8 *1.9 14.8 4.1 50.8 6.5 154.0 8.3
Walking frame **2.1 **1.2 **1.5 **0.8 **1.9 **0.5 11.7 1.5 85.8 4.6
Seating/bedding **2.4 **1.3 *5.3 *2.7 *6.5 *1.8 25.1 3.2 101.3 5.5
Car *2.7 *1.5 *2.9 *1.5 *4.6 *1.3 **1.6 **0.2 *3.3 *0.2
Other mobility *4.6 *2.5 *6.1 *3.1 14.0 3.9 18.6 2.4 47.8 2.6
Low-tech reading/writing *8.0 *4.5 *4.2 *2.1 **1.9 **0.5 **1.5 **0.2 12.4 0.7
High-tech reading/writing 11.9 6.7 *4.9 *2.5 *3.8 *1.1 *5.5 *0.7 9.0 0.5
Low-tech speech *5.5 *3.1 **1.2 **0.6 **1.2 **0.3 **0.3 **0.0 **2.0 **0.1
High-tech speech **1.3 **0.7 **0.1 **0.0 **0.7 **0.2 **1.1 **0.1 **0.3 **0.0
Mobile/cordless phone **1.8 **1.0 12.7 6.4 41.0 11.5 94.1 12.1 61.7 3.3
Fax machine 0 0.0 **0.9 **0.5 9.9 2.8 16.6 2.1 **1.8 **0.1
Hearing aids/cochlear implants 10.1 5.6 10.2 5.1 19.0 5.3 73.3 9.4 322.8 17.5
Meal preparation *3.0 *1.7 *4.3 *2.2 13.2 3.7 20.9 2.7 21.7 1.2
Medical 88.1 49.1 101.0 51.2 159.7 44.6 309.5 39.8 314.1 17.0
Total aids used 179.3 100.0 197.4 100.0 357.7 100.0 778.5 100.0 1,846.3 100.0
Note: Estimates marked with ** have an associated relative standard error (RSE) of 50% or more. Estimates marked with * have an associated RSE of between 25% and 50%. These estimates should be interpreted accordingly.
Source: AIHW analysis of ABS 1998 Survey of Disability, Ageing and Carers Confidentialised Unit Record File.

53
Table A4.2: Aids used, by use of types of aids and severity of core activity restriction (people with adisability), 1998
Severity of core activity restriction
Profound Severe Moderate Mild
Type of aid ’000 % ’000 % ’000 % ’000 %
Eating 60.1 4.2 *4.9 *0.7 **1.2 **0.2 *2.7 *0.5
Showering 210.9 14.7 62.3 9.0 41.1 8.2 17.0 2.9
Toilet 133.7 9.3 29.5 4.2 16.4 3.3 *6.4 *1.1
Incontinence 105.1 7.3 12.4 1.8 11.7 2.3 **0.3 **0.1
Dressing 65.3 4.5 18.6 2.7 4.9 1.0 **0.5 **0.1
Electric wheelchair/
scooter
23.7 1.7 *4.7 *0.7 **1.9 **0.4 **1.2 **0.2
Manual wheelchair 109.2 7.6 10.2 1.5 **2.4 **0.5 **1.8 **0.3
Cane 18.9 1.3 *7.6 *1.1 *4.9 *1.0 *3.7 *0.6
Crutches/walking stick 88.3 6.1 71.8 10.3 43.1 8.6 22.2 3.8
Walking frame 86.1 6.0 12.0 1.7 *3.1 *0.6 **1.7 **0.3
Seating/bedding 95.4 6.7 31.5 4.5 11.6 2.3 **2.0 **0.4
Car 10.0 0.7 *3.6 *0.5 **0.8 **0.2 **0.8 **0.1
Other mobility 50.0 3.5 25.6 3.7 9.1 1.8 *6.3 *1.1
Low-tech reading/writing 16.7 1.2 *5.5 *0.8 **1.4 **0.3 *4.3 *0.7
High-tech
reading/writing
15.4 1.1 13.1 1.9 **1.2 **0.2 *5.6 *1.0
Low-tech speech *8.8 *0.6 **1.4 **0.2 0 0 0 0
High-tech speech aids **1.8 **0.1 **0.7 0.09 **0.3 **0.1 **0.7 **0.1
Mobile/cordless phone 46.0 3.2 69.5 10.0 48.8 9.7 38.5 6.7
Fax machine *3.9 *0.3 12.0 1.7 *5.8 *1.2 *5.9 *1.0
Hearing aids/ cochlearimplants
73.9 5.1 44.7 6.4 58.5 11.7 207.5 35.8
Meal preparation 26.3 1.8 20.5 3.0 *6.6 *1.3 *6.6 *1.1
Medical 188.2 13.1 215.5 31.0 216.7 43.2 219.7 37.9
Total aids used 1,437.7 100.0 694.4 100.0 501.5 100.0 579.2 100.0
Note: Estimates marked with ** have an associated relative standard error (RSE) of 50% or more. Estimates marked with * have an associatedRSE of between 25% and 50%. These estimates should be interpreted accordingly.
Source: AIHW analysis of ABS 1998 Survey of Disability, Ageing and Carers Confidentialised Unit Record File.

54
Table A4.3: Grouping of main disabling conditions, using the 1998 ABS Survey of Disability,Ageing and Carers Confidentialised Unit Record File
Main disability group Main disabling conditions
Physical
Circulatory Includes heart disease nfd; angina; myocardial infarction; other heart disease; hypertension; stroke;and other diseases of the circulatory system.
Respiratory Includes bronchitis/bronchiolitis; respiratory allergies; emphysema; asthma and other diseases of therespiratory system.
Arthritis Includes arthritis and related disorders.
Neurological Includes Parkinson’s disease; Alzheimer’s disease; brain disease/disorder—acquired; multiplesclerosis; epilepsy; migraine and other diseases of the nervous system.
Other musculoskeletal Includes back problems (dorsopathies); synovitis; tenosynovitis; repetitive strain injury; occupationaloveruse syndrome; other soft tissue/muscle disorders; osteoporosis; and other disorders ofmusculoskeletal and connective tissue.
Other physical Includes cerebral palsy; paralysis; and spina bifida.
All other physical Includes poliomyelitis; other infections and parasitic diseases; skin cancer; breast cancer; prostatecancer; other malignant tumours; other neoplasms; diseases of the blood and blood-forming organs;disorders of the thyroid; diabetes; high cholesterol; other endocrine; nutritional and metabolicdisorders; stomach/duodenal ulcer; abdominal hernia; enteritis; colitis and other disease of theintestine; other diseases of the digestive system; diseases of the skin and subcutaneous tissue;disorders of the urinary system; disorders of the genital system; other congenital/chromosomalabnormalities; breathing difficulties/shortness of breath; pain, blackouts, fainting and convulsions.
ABI Includes head injury and acquired brain damage
Psychiatric Includes mental and behavioural disorders; psychoses and mood affective disorders; dementia;schizophrenia; depression; other psychoses; phobic and anxiety disorders; nervous tension andstress; other neurotic and stress-related disorders; and other mental and behavioural disorders.
Intellectual/learning Includes intellectual and developmental disorders; mental retardation/intellectual disability; autismand related disorders; development learning disorders; other developmental disorders;ADD/Hyperactivity and Down’s syndrome.
Sensory/speech
Vision Includes cataracts; retinal disorders and defects; glaucoma; sight loss; and other diseases of the eyeand adexna.
Hearing Includes tinnitus; deafness/hearing loss (nfd, noise-induced, congenital, due to accident, and othercause) and other diseases of the ear and mastoid process.
Speech Includes speech impediment and unspecified speech difficulties.

55
ReferencesAustralian Bureau of Statistics (ABS) 1982. Handicapped persons, Australia, 1981. Cat. no.4343.0. Canberra: ABS.Australian Bureau of Statistics (ABS) 1999. Disability, ageing and carers: summary offindings. Cat. no. 4430.0. Canberra: ABS.ACROD 2002. Disability services: polices for the next Federal Government. Available at:www.acrod.org.au/policy.pdf (accessed October 2002).ACT Community Care 2002. Equipment and prosthesis service. Available at:www.communitycare.act.gov.au/comm_rehab/equipment_scheme.html (accessed May2002).Agree EM 1999. The influence of personal care and assistive devices on the measurement ofdisability. Social Science and Medicine 48:427–43.Andersen R & Newman JF 1973. Societal and individual determinants of medical careutilization in the United States. Milbank Memorial Fund Quarterly 51:95–124.Artificial Limb Services within Australia (ALSA) 2002. Artificial limb services withinAustralia. Available at: www.ctie.monash.edu.au/rehabtech/techguide/als/ (accessedAugust 2002).
Australian Hearing Services 2002. About Australian hearing. Available at:www.hearing.com.au/about_aust_home.htm (accessed March 2002).Australian Institute of Health and Welfare (AIHW) 2001. Australia’s welfare 2001. Canberra:AIHW.Australian Institute of Health and Welfare (AIHW) 2002. Unmet need for disability services.Effectiveness of funding and remaining shortfalls. AIHW cat. no. DIS 26. Canberra: AIHW.Barnes L 1997. Provision of prosthetic and orthotic services to remote and rural NorthernTerritorians. Proceedings of the Annual Scientific Meeting of ISPO Australia. Available at:www.latrobe.edu.au/ncpo/ispo/ispo97/contents.html (accessed March 2002).Barton L 1994. Disability, difference and the politics of definition. Australian DisabilityReview 3:8–22.Bates PS, Spencer JC, Young ME & Rintala DH 1993. Assistive technology and the newlydisabled adult: adaptation to wheelchair use. American Journal of Occupational Therapy47:1014–21.Bell P & Hinjosa J 1995. Perception of the impact of assistive devices on daily life of threeindividuals with quadriplegia. Assistive Technology 7:87–94.Bickenbach JE, Chatterji S, Badley EM & Ustun TB 1999. Models of disablement,universalism and the international classification of impairments, disabilities and handicaps.Social Science & Medicine 48:1173–87.Brooks NA 1991. Users’ responses to assistive devices for physical disability. Social Scienceand Medicine 32:1417–424.Carers Australia 2001. National listen to carers day responses, 2001. Available at:www.carers.asn.au/responses.html (accessed March 2002).

56
Center Y & Curry C 1993. A feasibility study of a full integration model for a group ofstudents classified as mildly intellectually disabled. International Journal of Disability,Development and Education 40:217–35.Commonwealth Rehabilitation Service (CRS) Australia 2002. CRS Australian services.Available at: www.crsrehab.gov.au (accessed August 2002).Commonwealth/State Disability Agreement (CSDA): Ernst and Young 1996. The equipmentstudy. CSDA Evaluation Supporting Paper 5. Canberra: AGPS.de Klerk MMY, Huijsman R & McDonnell J 1997. The use of technical aids by elderly personsin the Netherlands: an application of the Anderson and Newman Model. The Gerontologist37(3):363–73.Department of Family and Community Services 2002. Workplace modifications scheme.Available at: www.facs.gov.au/disability/ood/workmods.htm (accessed October 2002).Department of Health and Ageing 2002. Continence aids assistance scheme. Available at:www.health.gov.au/acc/continence/caas.htm (accessed March 2002).Department of Health and Community Services (Northern Territory) 2001. NorthernTerritory disability services directory. Available at: www.nt.gov.au/health/comm_svs/aged_dis_ccs/disable_svs/directory/dis_directory.pdf (accessed December 2001).Department of Health and Human Services (Tasmania) 2001. Community outreach service.Available at: www.dhhs.tas.gov.au/brochure/outreach.html (accessed September 2001).Department of Human Services (Victoria) 2002. Victorian aids and equipment program(A&EP) guidelines. Available at: hnb.dhs.vic.gov.au/ds/disabilityimages.nsf/Downloads/aidsandequipguidelinesJuly2002/ $File/july2002.pdf (accessed July 2002).Department of Veterans Affairs 2001. Rehabilitation Appliances Program. DVA Facts HSV107. Available at: www.dva.gov.au/factsheets/default.htm (accessed September 2001).Disability Services Commission 2001. CAEP manual and imprest list. Policies, proceduresand guidelines. Perth: DSC.Forbes WF, Hayward LM & Agwani N 1993. Factors associated with self-reported use andnon-use of assistive devices among impaired elderly residing in the community. CanadianJournal of Public Health 84(1):53–57.Foreman PJ (ed.) 2001. Integration and inclusion in action. 2nd edn. Sydney: Harcourt.Hahn H 1986. Toward a politics of disability: definitions, disciplines and policies. Disability,Handicap and Society 1:121–38.Hartke RJ, Prohaska TR & Furner SE 1998. Older adults and assistive devices: use, multiple-device use, and need. Journal of Aging and Health 10(1):99–116.Hesse S, Gahein-Sama AL & Mauritz KH 1996. Technical aids in hemeparetic patients:prescription, costs and usage. Clinical Rehabilitation 10:328–33.Independent Living Centre (South Australia) 2001. Client information and guidelines forILEP Equipment. Available at: www.ilc.asn.au/txtsite/ilep.php (accessed August 2002).Kittel A, Di Marco A & Stewart H 2002. Factors influencing the decision to abandon manualwheelchairs for three individuals with a spinal cord injury. Disability and Rehabilitation24(1–3):106–14.
57
Mace RL, Hardie GJ & Place JP 1991. Accessible environments: toward universal design. In:Preiser WE, Vischer JC & White ET (eds). Design intervention: toward a more humanearchitecture. Van Nostrand Reinhold: New York.Mann WC, Hurren D, Tomita M & Charvat BA 1995. The relationship of functionalindependence to assistive device use of elderly persons living at home. Journal of AppliedGerontology 14:225–47.NSW Department of Health 2000. NSW health policy on the Program of Appliances forDisabled People (PADP). Available at: www.health.nsw.gov.au/fcsd/rmc/cib/circulars/2000/cir2000-103.pdf (accessed December 2001).Physical Disability Council of NSW (PDCN) 2000. AQA CAAS Survey—A system in crisis?PDCN Bulletin No. 3 (June 2000). Available at: www.pdcnsw.org.au/Bulletin_3_2000.htm(accessed March 2002).Physical Disability Council of NSW (PDCN) 2001. Supplementary submission to thestanding committee on social issues. Available at: www.pdcnsw.org.au (accessed November2001).Phillips B & Zhao H 1993. Predictors of assistive technology abandonment. AssistiveTechnology 5:36–45.Post MWM, van Asbeck FWA, van Dijk AJ & Schrijvers AJP 1997. Services for spinal cordinjured: availability and satisfaction. Spinal Cord 7:87–94.Private Health Insurance Administration Council (PHIAC) 2003. Statistical trends inmembership and benefits. Available at: www.phiac.gov.au/statistics/trends/index.html(accessed July 2003).Russell JN, Hendershot GE, LeClere F, Howie LJ & Adler M 1997. Trends and differential useof assistive technology devices: United States, 1994. Advance Data 92 (November 13):1–10.Scherer MJ 1996. Outcomes of assistive technology use on quality of life. Disability andRehabilitation 18(9):439–48.Scherer MJ 2000. Living in the state of stuck: how technology impacts the lives of people withdisabilities. 3rd edn. Cambridge, Mass: Brookline Books.Scherer MJ & Cushman LA 2001. Measuring subjective quality of life following spinal cordinjury: a validation study of the assistive technology device predisposition assessment.Disability and Rehabilitation 23(9):387–93.Verbrugge LM & Sevak P 2002. Use, type, and efficacy of assistance for disability. Journal ofGerontology: Social Sciences 57:S366–79.Verbrugge LM, Rennert C & Madans JH 1997. The great efficacy of personal and equipmentassistance in reducing disability. American Journal of Public Health 87(3):384–92.Wang MC & Baker ET 1986. Mainstreaming programs: design features and effects. Journal ofSpecial Education 4:503–21.World Health Organisation (WHO) 2001. International Classification of Functioning,Disability and Health. Geneva: WHO.Uditsky B 2002. Disabilities and the classroom. Transcript from Insight Program (ReporterInga Johansen), SBS Television, 3 October 2002. Available at: www.sbs.com.au/insight/index.php3?archive=1&artmon=10&arty=2002 (accessed October 2002).Zimmer Z & Chappell NL 1994. Mobility restriction and the use of devices among seniors.Journal of Aging and Health 6(2):185–208.