Chapter 1: Demographics - Boston Public Health …€¦ · Chapter 1: Demographics . 50 2014-2015...
13
49 Demographics 2014-2015 Chapter 1: Demographics
Transcript of Chapter 1: Demographics - Boston Public Health …€¦ · Chapter 1: Demographics . 50 2014-2015...
49
Demographics
2014-2015
Chapter 1: Demographics

50
2014-2015 Health of Boston
Demographics Boston’s population has grown in the last decade. Much of this change can be attributed to local and
state policies that have created a strong and well-balanced economy and supported neighborhood
redevelopment (1). With its many colleges and universities, Boston is especially appealing to young and
well-educated people from around the world. In 2012, 26% of the Boston population was foreign-born
compared with only 15% of the Massachusetts population and 13% of the entire US population (2).
Although Boston is a racially and ethnically diverse city in which less than 50% of its residents are
White, Boston was ranked among the top 20% of highly segregated metropolitan areas in the United
States in 2010, alongside Cincinnati, Ohio and Birmingham, Alabama(4). Racial residential segregation
refers to the degree to which two or more racial/ethnic groups live separately from one another in a
geographic area (3). . Segregation affects health by creating different economic, physical, and social
environments that shape the health behaviors and choices individuals make (5,6,7). Evidence exists
that segregation of people of color into poor neighborhoods is associated with increased adult
mortality (6). Whenever possible, health indicators in this report are stratified by individual
socioeconomic (SES) indicators and presented geographically in maps.
Demographic characteristics for children and adolescents differ from the rest of the Boston population.
Black children make up the highest proportion of youth under the age of 18, whereas White individuals
make up the largest proportion of all residents. We give special attention to the subpopulation of
Boston youth for whom many Boston’s programs and policies seek to support and protect.
51
Demographics
2014-2015
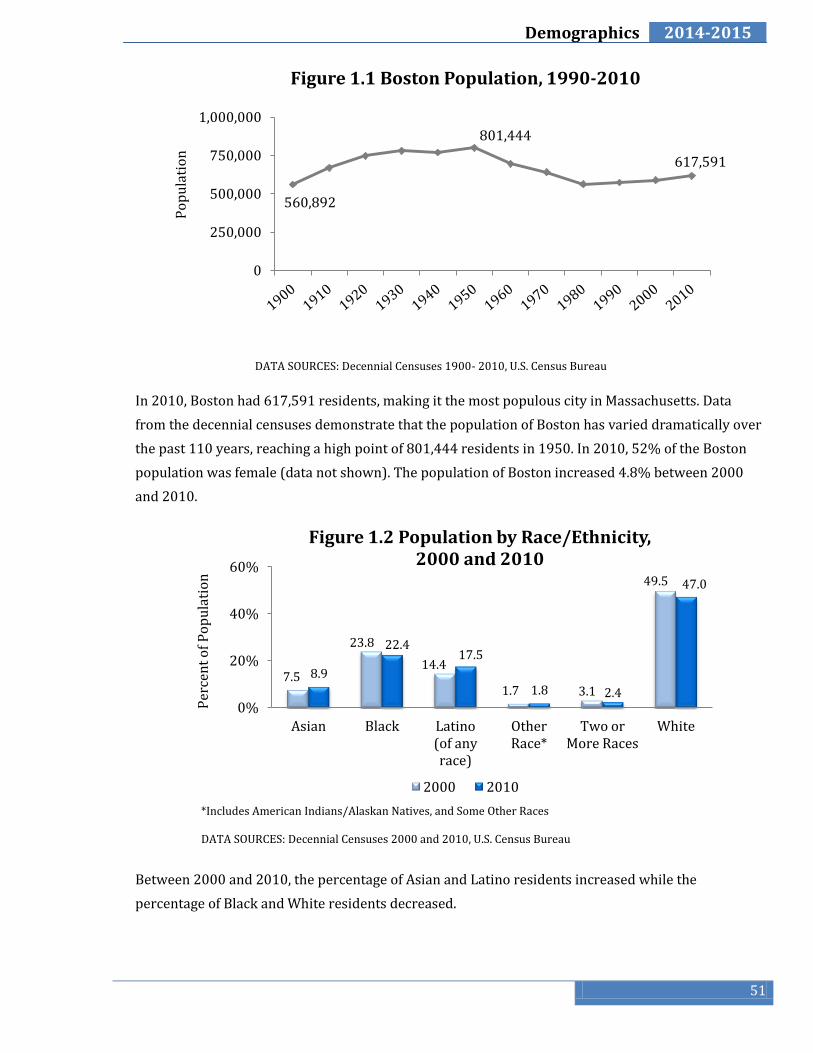
DATA SOURCES: Decennial Censuses 1900- 2010, U.S. Census Bureau
In 2010, Boston had 617,591 residents, making it the most populous city in Massachusetts. Data
from the decennial censuses demonstrate that the population of Boston has varied dramatically over
the past 110 years, reaching a high point of 801,444 residents in 1950. In 2010, 52% of the Boston
population was female (data not shown). The population of Boston increased 4.8% between 2000
and 2010.
Between 2000 and 2010, the percentage of Asian and Latino residents increased while the
percentage of Black and White residents decreased.
560,892
801,444
617,591
0
250,000
500,000
750,000
1,000,000
Po
pu
lati
on
Figure 1.1 Boston Population, 1990-2010
7.5
23.8
14.4
1.7 3.1
49.5
8.9
22.4 17.5
1.8 2.4
47.0
0%
20%
40%
60%
Asian Black Latino (of any race)
Other Race*
Two or More Races
White
Per
cen
t o
f P
op
ula
tio
n
Figure 1.2 Population by Race/Ethnicity, 2000 and 2010
2000 2010
*Includes American Indians/Alaskan Natives, and Some Other Races DATA SOURCES: Decennial Censuses 2000 and 2010, U.S. Census Bureau
52
2014-2015 Health of Boston
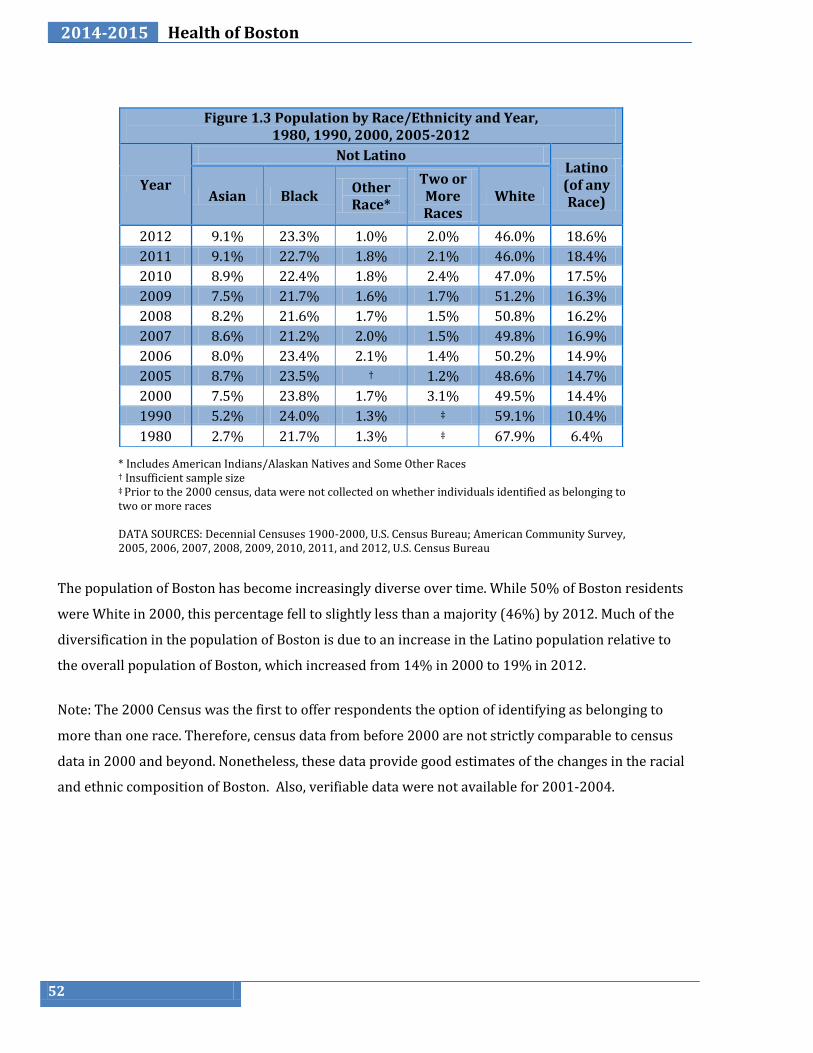
Figure 1.3 Population by Race/Ethnicity and Year, 1980, 1990, 2000, 2005-2012
Year
Not Latino Latino (of any Race) Asian Black
Other Race*
Two or More Races
White
2012 9.1% 23.3% 1.0% 2.0% 46.0% 18.6%
2011 9.1% 22.7% 1.8% 2.1% 46.0% 18.4%
2010 8.9% 22.4% 1.8% 2.4% 47.0% 17.5%
2009 7.5% 21.7% 1.6% 1.7% 51.2% 16.3%
2008 8.2% 21.6% 1.7% 1.5% 50.8% 16.2%
2007 8.6% 21.2% 2.0% 1.5% 49.8% 16.9%
2006 8.0% 23.4% 2.1% 1.4% 50.2% 14.9%
2005 8.7% 23.5% † 1.2% 48.6% 14.7%
2000 7.5% 23.8% 1.7% 3.1% 49.5% 14.4%
1990 5.2% 24.0% 1.3% ‡ 59.1% 10.4%
1980 2.7% 21.7% 1.3% ‡ 67.9% 6.4%
* Includes American Indians/Alaskan Natives and Some Other Races † Insufficient sample size ‡ Prior to the 2000 census, data were not collected on whether individuals identified as belonging to two or more races DATA SOURCES: Decennial Censuses 1900-2000, U.S. Census Bureau; American Community Survey, 2005, 2006, 2007, 2008, 2009, 2010, 2011, and 2012, U.S. Census Bureau
The population of Boston has become increasingly diverse over time. While 50% of Boston residents
were White in 2000, this percentage fell to slightly less than a majority (46%) by 2012. Much of the
diversification in the population of Boston is due to an increase in the Latino population relative to
the overall population of Boston, which increased from 14% in 2000 to 19% in 2012.
Note: The 2000 Census was the first to offer respondents the option of identifying as belonging to
more than one race. Therefore, census data from before 2000 are not strictly comparable to census
data in 2000 and beyond. Nonetheless, these data provide good estimates of the changes in the racial
and ethnic composition of Boston. Also, verifiable data were not available for 2001-2004.

53
Demographics
2014-2015
Neighborhood
Figure 1.4 Population by Neighborhood, 2000 and 2010
2000 2010 % change
Boston 589,141 617,591 +4.8%
Allston/ Brighton
66,467 72,092 +8.5%
Back Bay* 46,504 50,017 +7.6%
Charlestown 15,195 16,439 +8.2%
Chinatown 5,138 7,383 +43.7%
East Boston 38,413 40,508 +5.5%
Fenway 47,449 54,565 +15.0%
Hyde Park 28,392 28,488 +0.3%
Jamaica Plain
36,293 35,401 -2.5%
Mattapan 27,815 25,562 -8.1%
North Dorchester
58,675 59,273 +1.0%
North End 6,401 6,915 +8.0%
Roslindale 32,527 29,826 -8.3%
Roxbury 34,665 40,527 +16.9%
South Boston
30,048 33,889 +12.8%
South Dorchester
75,329 71,262 -5.4%
South End† 27,311 33,881 +24.1%
West Roxbury
24,058 25,861 +7.5%
Between 2000 and 2010, the
overall population of Boston
increased by 4.8%.
Among neighborhoods,
Chinatown, the South End,
and Roxbury experienced the
greatest increases in
population (43.7%, 24.1%,
and 16.9%, respectively)
while Roslindale, Mattapan,
and South Dorchester
experienced the greatest
decreases in population
(-8.3%, -8.1%, and -5.4%,
respectively).
* Includes Beacon Hill, Downtown, the North End, and the West End † Includes Chinatown DATA SOURCES: Decennial Censuses 2000 and 2010, U.S. Census Bureau

Neighborhood
Figure 1.5 Population by Neighborhood and Race/Ethnicity, 2000 and 2010
Total Population Asian Black Latino White Other Race* Two or More Races
2000 2010 2000 2010 2000 2010 2000 2010 2000 2010 2000 2010 2000 2010
Count Count % % % % % % % % % % % %
Boston 589,141 617,591 7.5% 8.9% 23.8% 22.4% 14.4% 17.5% 49.5% 47.0% 1.7% 1.8% 3.1% 2.4%
Allston/ Brighton
66,467 72,092 13.7% 15.2% 4.5% 4.6% 9.2% 9.9% 68.6% 66.2% 1.4% 1.6% 2.6% 2.4%
Back Bay† 46,504 50,017 9.2% 10.1% 5.1% 4.7% 3.8% 5.2% 80.1% 78.0% 0.4% 0.5% 1.4% 1.6%
Charlestown 15,195 16,439 5.0% 8.2% 3.6% 4.7% 11.6% 9.7% 78.6% 75.8% 0.3% 0.5% 0.9% 1.2%
Chinatown 5,138 7,383 59.7% 48.3% 4.2% 3.5% 4.2% 4.1% 30.3% 42.0% 0.3% 0.2% 1.4% 1.8%
East Boston 38,413 40,508 4.0% 3.5% 3.1% 3.2% 39.0% 52.9% 49.7% 37.2% 1.3% 1.8% 2.9% 1.5%
Fenway 47,449 54,565 13.6% 17.3% 6.7% 5.8% 8.2% 9.0% 68.1% 64.7% 0.7% 0.5% 2.7% 2.7%
Hyde Park 28,392 28,488 1.6% 1.8% 32.4% 43.3% 13.4% 22.3% 48.8% 29.5% 0.7% 1.0% 3.1% 2.1%
Jamaica Plain
36,293 35,401 5.1% 5.2% 13.9% 12.0% 24.9% 22.6% 52.9% 57.1% 0.6% 0.7% 2.5% 2.5%
Mattapan 27,815 25,562 1.0% 0.9% 81.9% 80.4% 7.1% 11.7% 4.8% 3.8% 0.7% 0.9% 4.5% 2.4%
North Dorchester
58,675 59,273 6.6% 6.6% 47.8% 44.0% 17.5% 22.6% 18.2% 17.1% 4.9% 5.7% 5.2% 3.8%
North End 6,401 6,915 1.3% 2.5% 0.4% 0.7% 2.0% 3.6% 95.1% 91.8% 0.2% 0.4% 1.1% 0.9%
Roslindale 32,527 29,826 2.6% 2.7% 16.5% 21.3% 20.2% 25.9% 56.8% 47.1% 0.6% 0.9% 3.3% 2.2%
Roxbury 34,665 40,527 3.1% 5.1% 51.1% 41.4% 24.4% 27.0% 13.5% 20.2% 4.0% 3.4% 4.0% 3.0%
South Boston
30,048 33,889 3.9% 4.9% 2.5% 4.6% 7.7% 9.9% 84.3% 78.8% 0.4% 0.5% 1.2% 1.2%
South Dorchester
75,329 71,262 8.3% 9.8% 46.7% 45.8% 11.8% 14.7% 25.7% 22.7% 3.0% 3.6% 4.5% 3.5%
South End‡ 27,311 33,881 19.6% 21.2% 20.2% 15.8% 16.3% 15.5% 40.9% 45.0% 0.7% 0.6% 2.3% 1.9%
West Roxbury
24,058 25,861 4.1% 6.4% 2.1% 5.0% 3.5% 6.8% 88.6% 80.0% 0.4% 0.4% 1.4% 1.5%
* Includes American Indians/Alaskan Natives and Some Other Races † Includes Beacon Hill, Downtown, the North End, and the West End ‡ Includes Chinatown
DATA SOURCES: Decennial Censuses 2000 and 2010, U.S. Census Bureau

N e i g h b o r h o o d
Figure 1.6 Population Counts by Neighborhood and Race/Ethnicity, 2000 and 2010
Asian Black Latino White Other Race* Two or More Races
2000 2010 %
change
2000 2010 %
change
2000 2010 %
change
2000 2010 %
change
2000 2010 %
change
2000 2010 %
change Count Count Count Count Count Count Count Count Count Count Count Count
Boston 44,280 55,028 +24.3% 140,305 138,072 -1.6% 85,089 107,917 +26.8% 291,561 290,310 -0.4% 9,732 11,305 +16.2% 18,174 14,959 -21.5%
Allston/ Brighton
9,123 10,984 +20.4% 2,997 3,341 +11.5% 6,125 7,163 +16.9% 45,582 47,719 +4.7% 910 1,156 +27.0% 1,730 1,729 -0.1%
Back Bay† 4,275 5,039 +17.9% 2,381 2,350 -1.3% 1,780 2,582 +45.1% 37,232 39,014 +4.8% 187 231 +23.5% 649 801 +19.0%
Charlestown 761 1,344 +76.6% 539 764 +41.7% 1,764 1,591 -9.8% 11,946 12,458 +4.3% 46 80 +73.9% 139 202 +31.2%
Chinatown 3,069 3,569 +16.3% 213 259 +21.6% 213 303 +42.3% 1,556 3,100 +99.2% 13 16 +23.1% 74 136 +45.6%
East Boston 1,553 1,413 -9.0% 1,177 1,283 +9.0% 14,990 21,419 +42.9% 19,078 15,051 -21.1% 511 724 +41.7% 1,104 618 -78.6%
Fenway 6,469 9,425 +45.7% 3,177 3,176 -0.0% 3,866 4,922 +27.3% 32,332 35,313 +9.2% 326 258 -20.9% 1,279 1,471 +13.1%
Hyde Park 453 499 +10.2% 9,211 12,338 +33.9% 3,796 6,351 +67.3% 13,861 8,408 -39.3% 191 295 +54.5% 880 597 -47.4%
Jamaica Plain 1,867 1,829 -2.0% 5,052 4,253 -15.8% 9,025 7,983 -11.5% 19,205 20,209 +5.2% 225 251 +11.6% 919 876 -4.9%
Mattapan 265 218 -17.7% 22,768 20,555 -9.7% 1,985 2,978 +50.0% 1,328 959 -27.8% 205 241 +17.6% 1,264 611 -106.9%
North Dorchester 3,855 3,934 +2.0% 28,030 26,085 -6.9% 10,246 13,418 +31.0% 10,659 10,157 -4.7% 2,843 3,401 +19.6% 3,042 2,278 -33.5%
North End 84 175 +108.3% 24 46 +91.7% 127 252 +98.4% 6,086 6,348 +4.3% 13 30 +130.8% 67 64 -4.7%
Roslindale 853 796 -6.7% 5,360 6,342 +18.3% 6,553 7,738 +18.1% 18,473 14,034 -24.0% 204 273 +33.8% 1,084 643 -68.6%
Roxbury 1,059 2,045 +93.1% 17,705 16,785 -5.2% 8,464 10,938 +29.2% 4,681 8,202 +75.2% 1388 1,356 -2.3% 1,368 1,201 -13.9%
South Boston
1,178 1,675 +42.2% 749 1,574 +110.1% 2,298 3,354 +46.0% 25,333 26,704 +5.4% 121 176 +45.5% 369 406 +9.1%
South Dorchester 6,230 6,997 +12.3% 35,156 32,605 -7.3% 8,913 10,471 +17.5% 19,367 16,152 -16.6% 2282 2,558 +12.1% 3,381 2,479 -36.4%
South End‡ 5,358 7,188 +34.2% 5,505 5,338 -3.0% 4,451 5,255 +18.1% 11,165 15,249 +36.6% 194 195 +0.5% 638 656 +2.7%
West Roxbury 981 1,642 +67.4% 498 1,283 +157.6% 833 1,754 +110.6% 21,319 20,681 -3.0% 99 110 +11.1% 328 391 +16.1%
* Includes American Indians/Alaskan Natives and Some Other Races † Includes Beacon Hill, Downtown, the North End, and the West End ‡ Includes Chinatown DATA SOURCES: Decennial Censuses 2000 and 2010, U.S. Census Bureau
56
2014-2015 Health of Boston
Speak only English
Spanish or Spanish Creole
French Creole
Chinese Vietnamese
63.4% (62.1-64.6)
15.9% (15.2-16.7)
5.1% (3.9-6.2)
4.2% (3.5-5.0)
1.7% (1.2-2.1)
DATA SOURCE: American Community Survey, 2012, U.S. Census Bureau
0%
25%
50%
75%
Speak only
English
Spanish or
Spanish Creole
French Creole
Chinese Vietnamese
Per
cen
t o
f P
op
ula
tio
n
5 Y
ears
an
d O
ver
Figure 1.8 Most Frequently Reported Languages Spoken at Home, 2012
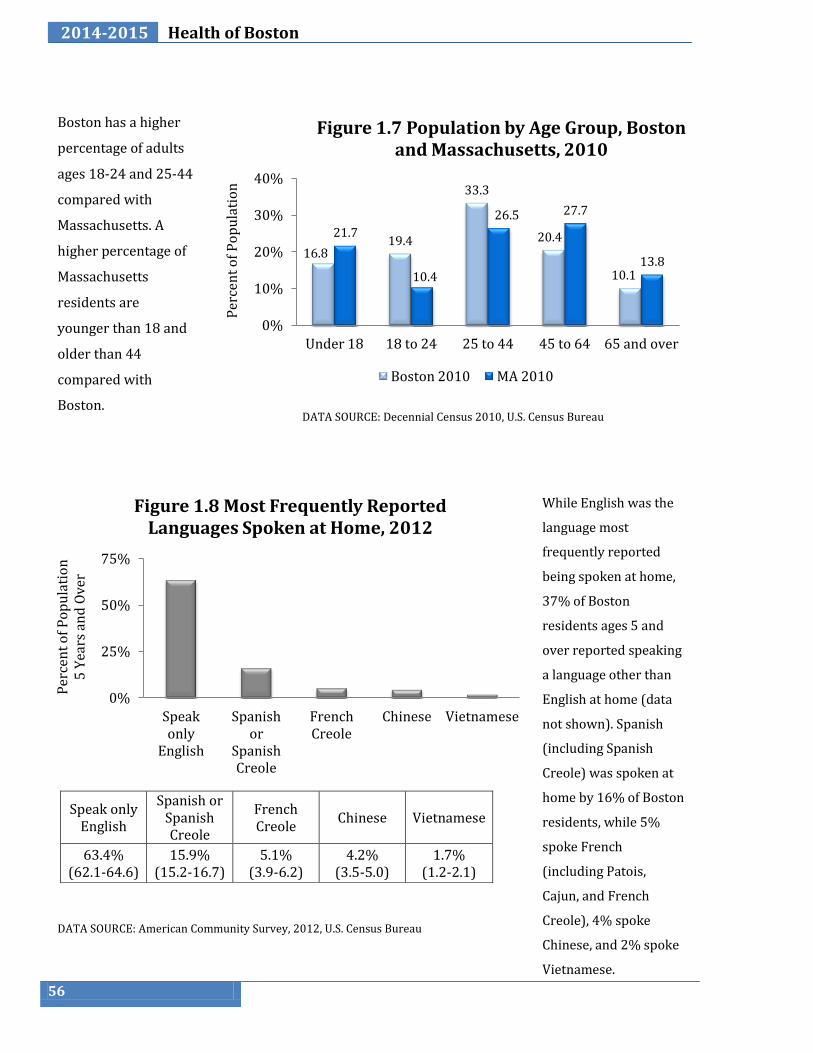
16.8 19.4
33.3
20.4
10.1
21.7
10.4
26.5 27.7
13.8
0%
10%
20%
30%
40%
Under 18 18 to 24 25 to 44 45 to 64 65 and over
Per
cen
t o
f P
op
ula
tio
n
Figure 1.7 Population by Age Group, Boston and Massachusetts, 2010
Boston 2010 MA 2010
DATA SOURCE: Decennial Census 2010, U.S. Census Bureau
Boston has a higher
percentage of adults
ages 18-24 and 25-44
compared with
Massachusetts. A
higher percentage of
Massachusetts
residents are
younger than 18 and
older than 44
compared with
Boston.
While English was the
language most
frequently reported
being spoken at home,
37% of Boston
residents ages 5 and
over reported speaking
a language other than
English at home (data
not shown). Spanish
(including Spanish
Creole) was spoken at
home by 16% of Boston
residents, while 5%
spoke French
(including Patois,
Cajun, and French
Creole), 4% spoke
Chinese, and 2% spoke
Vietnamese.

57
Demographics 2014-2015
Boston Spanish Other Indo-European Languages
Asian and Pacific Island
Languages
Other Languages
12.6% (11.3-13.9)
34.1% (29.9-38.2)
26.5% (20.5-32.6)
46.4% (40.2-52.6)
37.7% (21.9-53.4)
0%
25%
50%
75%
Boston Spanish Other Indo-European languages
Asian and Pacific Island
languages
Other languages
Per
cen
t o
f H
ou
seh
old
s
Figure 1.9 Linguistically Isolated Households by Household Language, 2012
DATA SOURCE: American Community Survey, 2012, U.S. Census Bureau
In 2012, 13% of Boston households were linguistically isolated (defined as having no one within the
household 14 years of age and over who speaks English only, or speaks English very well). Thirty-
four percent of the linguistically isolated households spoke Spanish, 27% percent spoke Other Indo-
European languages, 46% spoke Asian and Pacific Island languages, and 38% spoke other languages.
Note: Other Indo-European languages include: English-based Pidgin Creoles, Germanic, Romance
(excluding Spanish), Celtic, Slavic, Baltic, Iranian, and Indic languages.

58
2014-2015 Health of Boston
During 2008-2012, 12% of Boston households were linguistically isolated. Compared to Boston
overall, a higher percentage of households in East Boston, North Dorchester and the South End were
linguistically isolated (30%, 16%, and 18%, respectively). A lower percentage of households in Back
Bay, Charlestown, Jamaica Plain, South Boston and West Roxbury were linguistically isolated (6%,
8%, 7%, 7%, and 5%, respectively).
Figure 1.10 Linguistically Isolated Households by Neighborhood,
2008-2012 Combined
DATA SOURCE: American Community Survey, 2008-2012, U.S. Census Bureau
59
Demographics 2014-2015
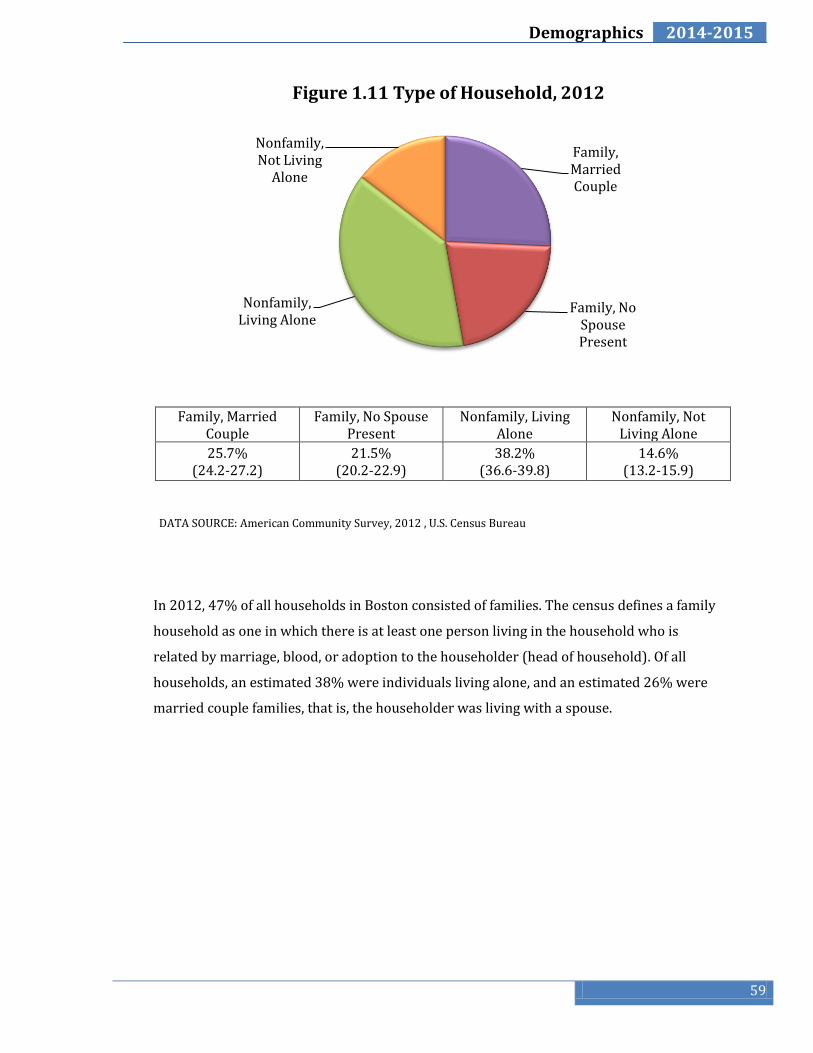
Family, Married Couple
Family, No Spouse Present
Nonfamily, Living Alone
Nonfamily, Not Living Alone
25.7% (24.2-27.2)
21.5% (20.2-22.9)
38.2% (36.6-39.8)
14.6% (13.2-15.9)
Family, Married Couple
Family, No Spouse Present
Nonfamily, Living Alone
Nonfamily, Not Living
Alone
Figure 1.11 Type of Household, 2012
DATA SOURCE: American Community Survey, 2012 , U.S. Census Bureau
In 2012, 47% of all households in Boston consisted of families. The census defines a family
household as one in which there is at least one person living in the household who is
related by marriage, blood, or adoption to the householder (head of household). Of all
households, an estimated 38% were individuals living alone, and an estimated 26% were
married couple families, that is, the householder was living with a spouse.
60
2014-2015 Health of Boston
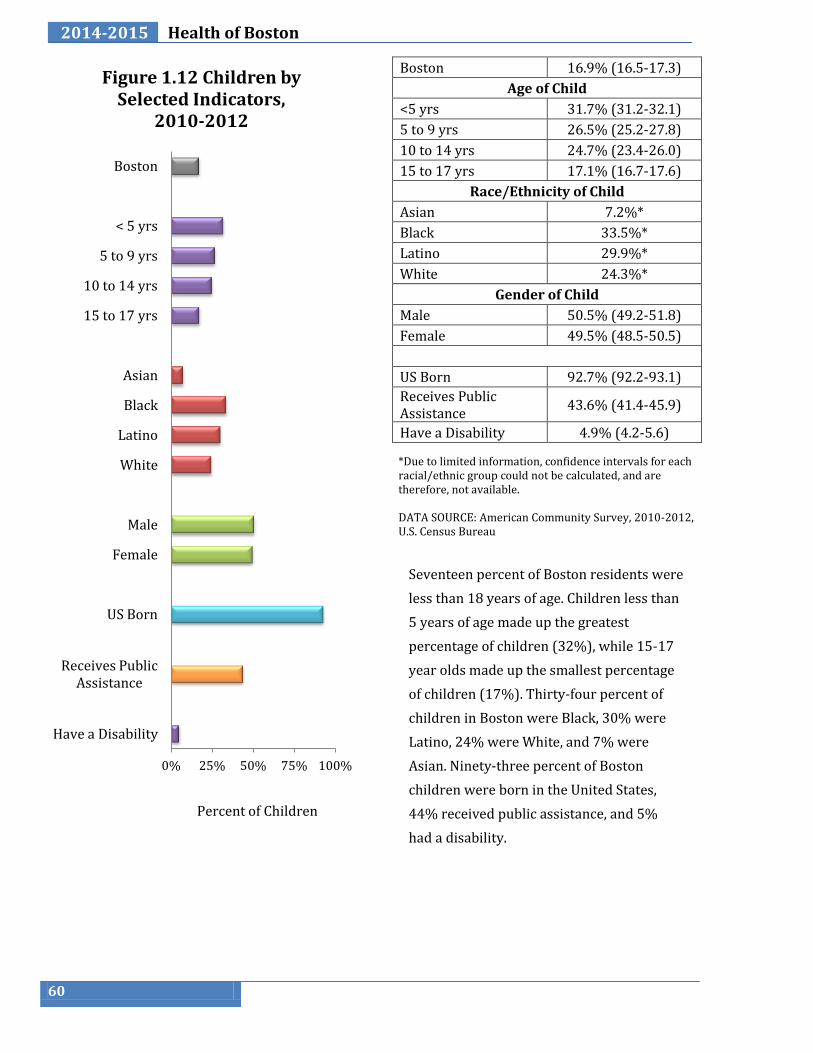
Boston 16.9% (16.5-17.3)
Age of Child
<5 yrs 31.7% (31.2-32.1)
5 to 9 yrs 26.5% (25.2-27.8)
10 to 14 yrs 24.7% (23.4-26.0)
15 to 17 yrs 17.1% (16.7-17.6)
Race/Ethnicity of Child
Asian 7.2%*
Black 33.5%*
Latino 29.9%*
White 24.3%*
Gender of Child
Male 50.5% (49.2-51.8)
Female 49.5% (48.5-50.5)
US Born 92.7% (92.2-93.1)
Receives Public Assistance
43.6% (41.4-45.9)
Have a Disability 4.9% (4.2-5.6)
0% 25% 50% 75% 100%
Have a Disability
Receives Public Assistance
US Born
Female
Male
White
Latino
Black
Asian
15 to 17 yrs
10 to 14 yrs
5 to 9 yrs
< 5 yrs
Boston
Percent of Children
Figure 1.12 Children by Selected Indicators,
2010-2012
*Due to limited information, confidence intervals for each racial/ethnic group could not be calculated, and are therefore, not available. DATA SOURCE: American Community Survey, 2010-2012, U.S. Census Bureau
Seventeen percent of Boston residents were
less than 18 years of age. Children less than
5 years of age made up the greatest
percentage of children (32%), while 15-17
year olds made up the smallest percentage
of children (17%). Thirty-four percent of
children in Boston were Black, 30% were
Latino, 24% were White, and 7% were
Asian. Ninety-three percent of Boston
children were born in the United States,
44% received public assistance, and 5%
had a disability.
61
Demographics 2014-2015
References
1. Lima, A. and Melnik, M. Boston: Measuring Diversity in a Changing City. Boston : Boston Redevelopment Authority, Research Division, 2013.
2. U.S. Census Bureau. Selected Health Characteristics in the United States, 2012 American Community Survey 1-Year Estimates . American Fact Finder. [Online] 2012. [Cited: 2 19, 2014.] http://factfinder2.census.gov/faces/tableservices/jsf/pages/productview.xhtml?pid=ACS_12_1YR_DP02&prodType=table.
3. The Dimensions of Residential Segregation. Massey, D. S. and Denton, N. A. 2, s.l. : Social Forces, q988, Vol. 67. 0037-7732.
4. The Persistence of Segregation in the Metropolis: New Findings from the 2010 Census. Logan, J. R. and Stults, B. J. s.l. : US2010 Project, 2011.
5. Racial/ethnic residential segregation: Framing the context of health risk and health disparities. White, K. and Borrell, L. N. 2, s.l. : Health & Place, 2011, Vol. 17. 1353-8292.
6. Is Segregation Bad for Your Health. Kramer, M. R. and Hogue, C. R. 1, s.l. : Epidemiologic Reviews, 2009, Vol. 31. 0193-936X.
7. Racial residential segregation: a fundamental cause of racial disparities in health. Williams, D. R. and Collins, C. 5, s.l. : Public Health Reports, 2001, Vol. 116. 0033-3549.


![The Greater Boston Housing Report Card 2019 Supply, …...The Greater Boston Housing Report Card 2019 | 13 [DEMOGRAPHICS] Racial diversity is increasing across most of Greater Boston](https://static.fdocuments.net/doc/165x107/5f063b8a7e708231d416f5d6/the-greater-boston-housing-report-card-2019-supply-the-greater-boston-housing.jpg)