Chap 011
35
McGraw-Hill/Irwin © 2006 The McGraw-Hill Companies, Inc., All Rights Reserved. 1
Transcript of Chap 011

McGraw-Hill/Irwin © 2006 The McGraw-Hill Companies, Inc., All Rights Reserved.
1

2
©The McGraw-Hill Companies, Inc., 2006
McGraw-Hill/Irwin
Chapter 11
Strategic Capacity Management

McGraw-Hill/Irwin © 2006 The McGraw-Hill Companies, Inc., All Rights Reserved.
3
Strategic Capacity Planning Defined Capacity Utilization & Best Operating
Level Economies & Diseconomies of Scale The Experience Curve Capacity Focus, Flexibility & Planning Determining Capacity Requirements Decision Trees Capacity Utilization & Service Quality
OBJECTIVES

McGraw-Hill/Irwin © 2006 The McGraw-Hill Companies, Inc., All Rights Reserved.
4
Strategic Capacity Planning
Capacity can be defined as the ability to hold, receive, store, or accommodate
Strategic capacity planning is an approach for determining the overall capacity level of capital intensive resources, including facilities, equipment, and overall labor force size

McGraw-Hill/Irwin © 2006 The McGraw-Hill Companies, Inc., All Rights Reserved.
5
Capacity Utilization
Where Capacity used
– rate of output actually achieved Best operating level
– capacity for which the process was designed
level operating Best
usedCapacity rate nutilizatioCapacity

McGraw-Hill/Irwin © 2006 The McGraw-Hill Companies, Inc., All Rights Reserved.
6
Best Operating Level
Example: Engineers design engines and assembly lines to operate at an ideal or “best operating level” to maximize output and minimize ware
Example: Engineers design engines and assembly lines to operate at an ideal or “best operating level” to maximize output and minimize ware
Underutilization
Best OperatingLevel
Averageunit costof output
Volume
Overutilization
McGraw-Hill/Irwin © 2006 The McGraw-Hill Companies, Inc., All Rights Reserved.
7
Example of Capacity Utilization
During one week of production, a plant produced 83 units of a product. Its historic highest or best utilization recorded was 120 units per week. What is this plant’s capacity utilization rate?
During one week of production, a plant produced 83 units of a product. Its historic highest or best utilization recorded was 120 units per week. What is this plant’s capacity utilization rate?
Answer: Capacity utilization rate = Capacity used .
Best operating level = 83/120 =0.69 or 69%
Answer: Capacity utilization rate = Capacity used .
Best operating level = 83/120 =0.69 or 69%
McGraw-Hill/Irwin © 2006 The McGraw-Hill Companies, Inc., All Rights Reserved.
8
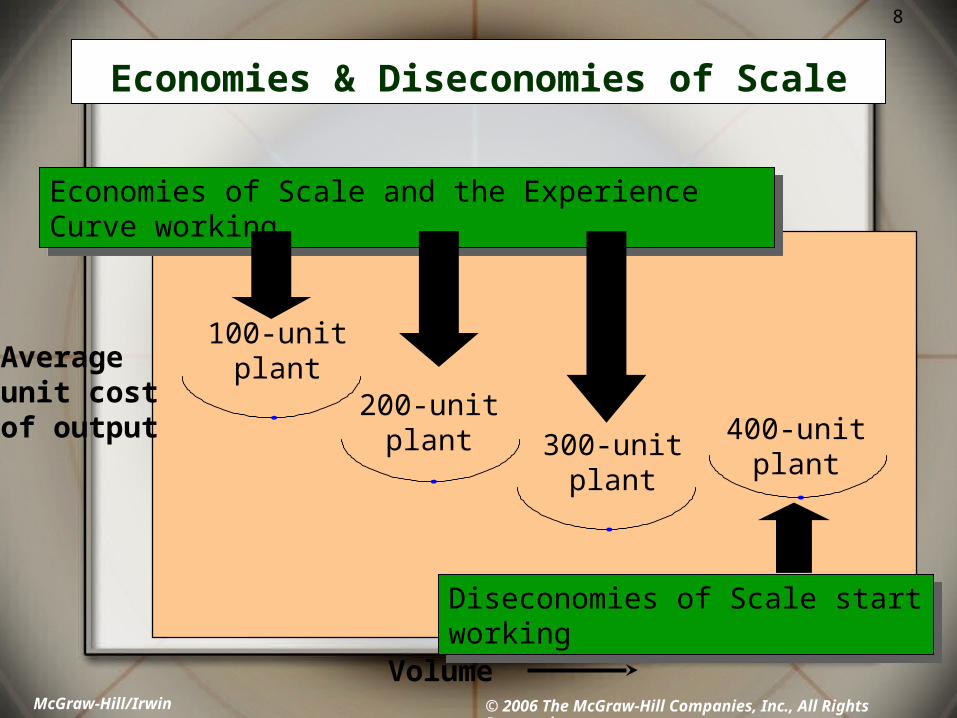
Economies & Diseconomies of Scale
100-unitplant
200-unitplant 300-unit
plant
400-unitplant
Volume
Averageunit costof output
Economies of Scale and the Experience Curve workingEconomies of Scale and the Experience Curve working
Diseconomies of Scale start workingDiseconomies of Scale start working

McGraw-Hill/Irwin © 2006 The McGraw-Hill Companies, Inc., All Rights Reserved.
9
The Experience
Curve
As plants produce more products, they gain experience in the best production methods and reduce their costs per unit
As plants produce more products, they gain experience in the best production methods and reduce their costs per unit
Total accumulated production of units
Cost orpriceper unit
Yesterday
Today
Tomorrow

McGraw-Hill/Irwin © 2006 The McGraw-Hill Companies, Inc., All Rights Reserved.
10
Capacity Focus The concept of the focused factory
holds that production facilities work best when they focus on a fairly limited set of production objectives
Plants Within Plants (PWP) – Extend focus concept to operating
level

McGraw-Hill/Irwin © 2006 The McGraw-Hill Companies, Inc., All Rights Reserved.
11
Capacity Flexibility
Flexible plants
Flexible processes
Flexible workers

McGraw-Hill/Irwin © 2006 The McGraw-Hill Companies, Inc., All Rights Reserved.
12
Capacity Planning: Balance
Stage 1 Stage 2 Stage 3Unitsper
month6,000 7,000 5,000
Unbalanced stages of productionUnbalanced stages of production
Stage 1 Stage 2 Stage 3Unitsper
month6,000 6,000 6,000
Balanced stages of productionBalanced stages of production
Maintaining System Balance: Output of one stage is the exact input requirements for the next stage

McGraw-Hill/Irwin © 2006 The McGraw-Hill Companies, Inc., All Rights Reserved.
13
Capacity Planning
Frequency of Capacity Additions
External Sources of Capacity

McGraw-Hill/Irwin © 2006 The McGraw-Hill Companies, Inc., All Rights Reserved.
14Determining Capacity Requirements
1. Forecast sales within each individual product line
2. Calculate equipment and labor requirements to meet the forecasts
3. Project equipment and labor availability over the planning horizon

McGraw-Hill/Irwin © 2006 The McGraw-Hill Companies, Inc., All Rights Reserved.
15
Example of Capacity RequirementsA manufacturer produces two lines of mustard, FancyFine and Generic line. Each is sold in small and family-size plastic bottles.
The following table shows forecast demand for the next four years.
Year: 1 2 3 4FancyFine
Small (000s) 50 60 80 100Family (000s) 35 50 70 90Generic
Small (000s) 100 110 120 140Family (000s) 80 90 100 110

McGraw-Hill/Irwin © 2006 The McGraw-Hill Companies, Inc., All Rights Reserved.
16
Example of Capacity Requirements (Continued): Product from a Capacity Viewpoint
Question: Are we really producing two different types of mustards from the standpoint of capacity requirements?
Answer: No, it’s the same product just packaged differently.
Question: Are we really producing two different types of mustards from the standpoint of capacity requirements?
Answer: No, it’s the same product just packaged differently.
McGraw-Hill/Irwin © 2006 The McGraw-Hill Companies, Inc., All Rights Reserved.
17
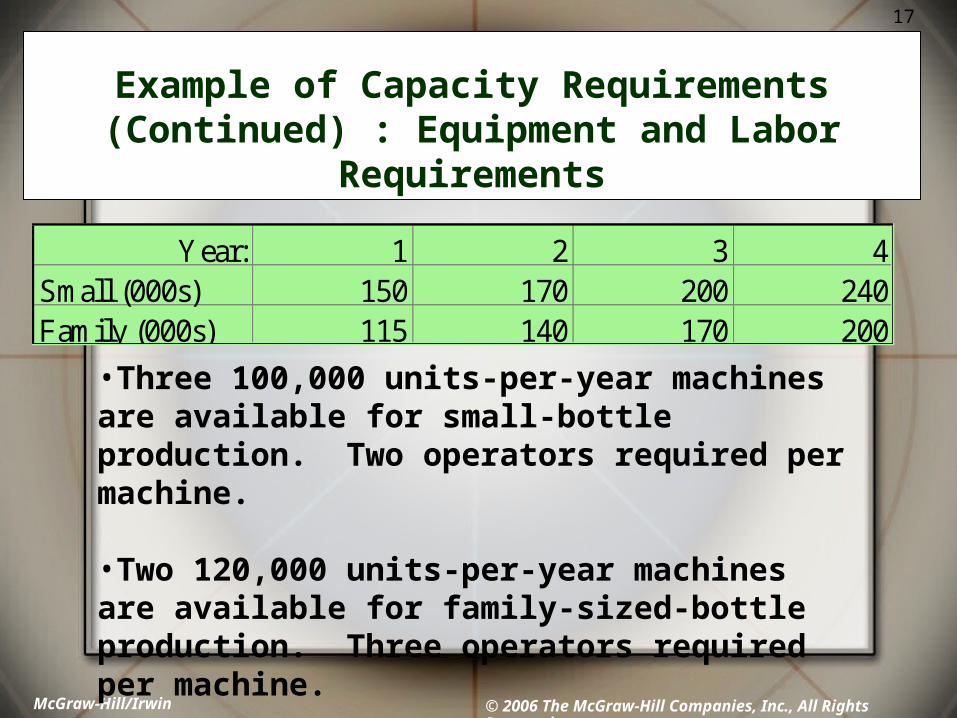
Example of Capacity Requirements (Continued) : Equipment and Labor
Requirements
Year: 1 2 3 4Small (000s) 150 170 200 240Family (000s) 115 140 170 200
•Three 100,000 units-per-year machines are available for small-bottle production. Two operators required per machine.
•Two 120,000 units-per-year machines are available for family-sized-bottle production. Three operators required per machine.

Year: 1 2 3 4Small (000s) 150 170 200 240Family (000s) 115 140 170 200
Small Mach. Cap. 300,000 Labor 6Family-size Mach. Cap. 240,000 Labor 6
Small
Percent capacity used 50.00%Machine requirement 1.50Labor requirement 3.00Family-size
Percent capacity used 47.92%Machine requirement 0.96Labor requirement 2.88
Question: What are the Year 1 values for capacity, machine, and labor?
Question: What are the Year 1 values for capacity, machine, and labor?
150,000/300,000=50%
At 2 operators for 100,000, it takes 3 operators for 150,000
At 1 machine for 100,000, it takes 1.5 machines for 150,000
©The McGraw-Hill Companies, Inc., 2004
18
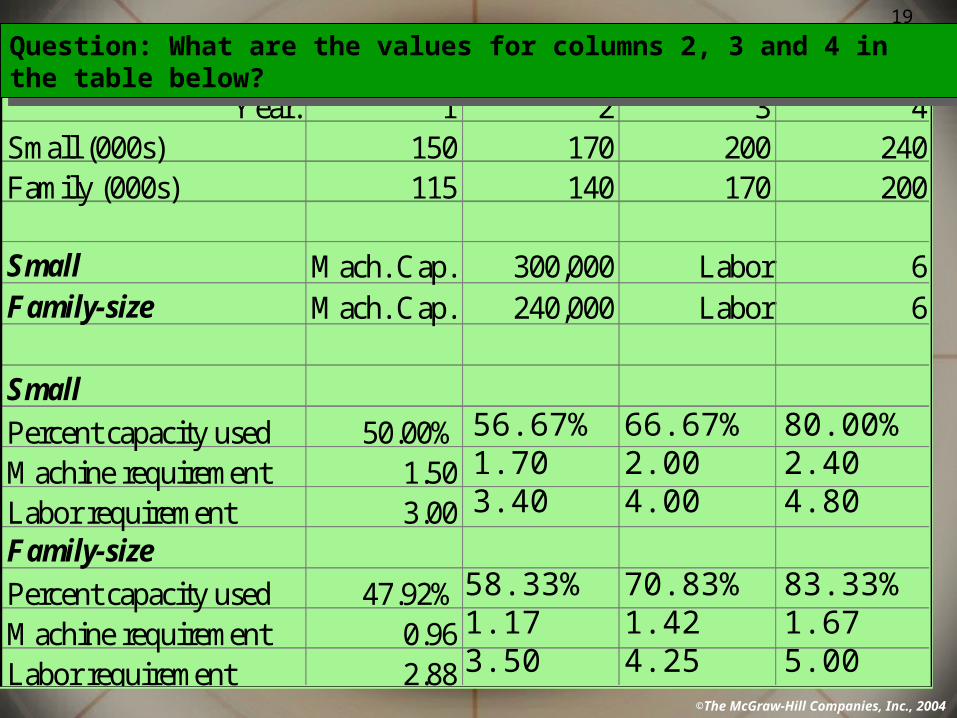
Year: 1 2 3 4Small (000s) 150 170 200 240Family (000s) 115 140 170 200
Small Mach. Cap. 300,000 Labor 6Family-size Mach. Cap. 240,000 Labor 6
Small
Percent capacity used 50.00%Machine requirement 1.50Labor requirement 3.00Family-size
Percent capacity used 47.92%Machine requirement 0.96Labor requirement 2.88
Question: What are the values for columns 2, 3 and 4 in the table below?Question: What are the values for columns 2, 3 and 4 in the table below?
56.67%1.703.40
58.33%1.173.50
66.67%2.004.00
70.83%1.424.25
80.00%2.404.80
83.33%1.675.00
19
©The McGraw-Hill Companies, Inc., 2004

McGraw-Hill/Irwin © 2006 The McGraw-Hill Companies, Inc., All Rights Reserved.
20
Example of a Decision Tree Problem
A glass factory specializing in crystal is experiencing a substantial backlog, and the firm's management is considering three courses of action:
A) Arrange for subcontractingB) Construct new facilitiesC) Do nothing (no change)
The correct choice depends largely upon demand, which may be low, medium, or high. By consensus, management estimates the respective demand probabilities as 0.1, 0.5, and 0.4.

McGraw-Hill/Irwin © 2006 The McGraw-Hill Companies, Inc., All Rights Reserved.
21
Example of a Decision Tree Problem (Continued): The Payoff Table
0.1 0.5 0.4Low Medium High
A 10 50 90B -120 25 200C 20 40 60
The management also estimates the profits when choosing from the three alternatives (A, B, and C) under the differing probable levels of demand. These profits, in thousands of dollars are presented in the table below:
The management also estimates the profits when choosing from the three alternatives (A, B, and C) under the differing probable levels of demand. These profits, in thousands of dollars are presented in the table below:

McGraw-Hill/Irwin © 2006 The McGraw-Hill Companies, Inc., All Rights Reserved.
22
Example of a Decision Tree Problem (Continued): Step 1. We start by drawing the three decisions
A
B
C
McGraw-Hill/Irwin © 2006 The McGraw-Hill Companies, Inc., All Rights Reserved.
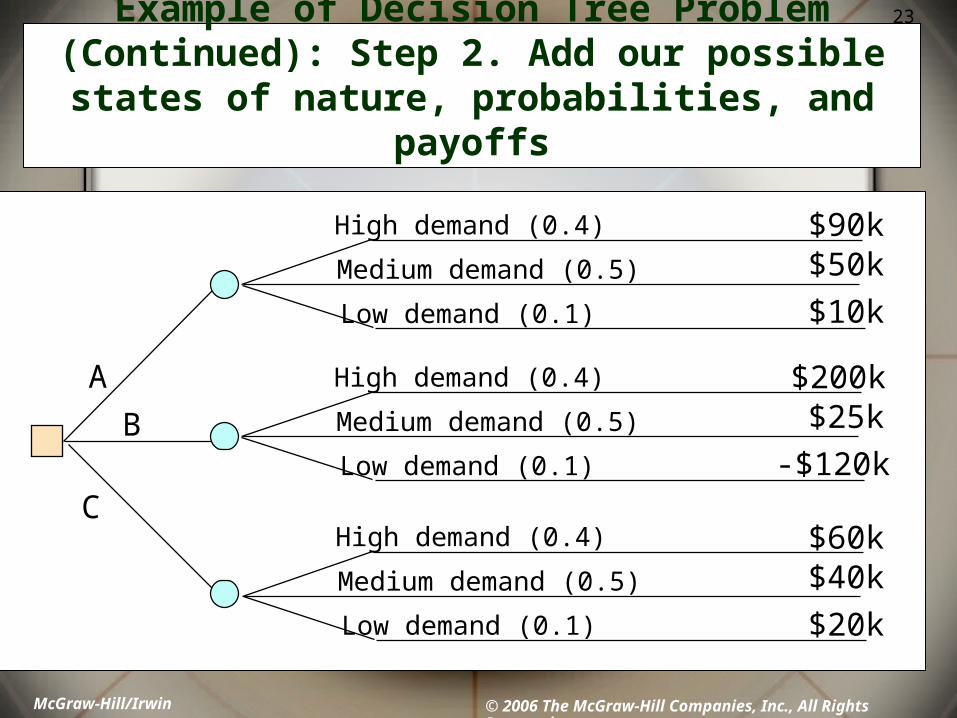
23Example of Decision Tree Problem (Continued): Step 2. Add our possible
states of nature, probabilities, and payoffs
A
B
C
High demand (0.4)
Medium demand (0.5)
Low demand (0.1)
$90k$50k
$10k
High demand (0.4)
Medium demand (0.5)
Low demand (0.1)
$200k$25k
-$120k
High demand (0.4)
Medium demand (0.5)
Low demand (0.1)
$60k$40k
$20k

McGraw-Hill/Irwin © 2006 The McGraw-Hill Companies, Inc., All Rights Reserved.
24
Example of Decision Tree Problem (Continued): Step 3. Determine the expected value of each
decision
High demand (0.4)High demand (0.4)
Medium demand (0.5)Medium demand (0.5)
Low demand (0.1)Low demand (0.1)
AA
$90k$90k
$50k$50k
$10k$10k
EVA=0.4(90)+0.5(50)+0.1(10)=$62kEVA=0.4(90)+0.5(50)+0.1(10)=$62k
$62k$62k

McGraw-Hill/Irwin © 2006 The McGraw-Hill Companies, Inc., All Rights Reserved.
25
Example of Decision Tree Problem (Continued): Step 4. Make decision
High demand (0.4)
Medium demand (0.5)
Low demand (0.1)
High demand (0.4)
Medium demand (0.5)
Low demand (0.1)
A
B
CHigh demand (0.4)
Medium demand (0.5)
Low demand (0.1)
$90k$50k
$10k
$200k$25k
-$120k
$60k$40k
$20k
$62k
$80.5k
$46k
Alternative B generates the greatest expected profit, so our choice is B or to construct a new facility
Alternative B generates the greatest expected profit, so our choice is B or to construct a new facility

McGraw-Hill/Irwin © 2006 The McGraw-Hill Companies, Inc., All Rights Reserved.
26
Planning Service Capacity vs. Manufacturing Capacity
Time: Goods can not be stored for later use and capacity must be available to provide a service when it is needed
Location: Service goods must be at the customer demand point and capacity must be located near the customer
Volatility of Demand: Much greater than in manufacturing

McGraw-Hill/Irwin © 2006 The McGraw-Hill Companies, Inc., All Rights Reserved.
27
Capacity Utilization & Service Quality
Best operating point is near 70% of capacity
From 70% to 100% of service capacity, what do you think happens to service quality?

McGraw-Hill/Irwin © 2006 The McGraw-Hill Companies, Inc., All Rights Reserved.
28
Question BowlThe objective of Strategic Capacity
Planning is to provide an approach for determining the overall capacity level of which of the following?
a. Facilitiesb. Equipmentc. Labor force sized. All of the abovee. None of the above
Answer: d. All of the above

McGraw-Hill/Irwin © 2006 The McGraw-Hill Companies, Inc., All Rights Reserved.
29
Question Bowl
To improve the Capacity Utilization Rate we can do which of the following?
a. Reduce “capacity used”b. Increase “capacity used”c. Increase “best operating level”d. All of the abovee. None of the above
Answer: b. Increase “capacity used” (This increases the numerator in the Capacity Utilization Rate ratio, which is desirable.)

McGraw-Hill/Irwin © 2006 The McGraw-Hill Companies, Inc., All Rights Reserved.
30
Question BowlWhen we talk about Capacity
Flexibility which of the following types of flexibility are included?
a. Plantsb. Processesc. Workersd. All of the abovee. None of the above
Answer: d. All of the above

McGraw-Hill/Irwin © 2006 The McGraw-Hill Companies, Inc., All Rights Reserved.
31
Question Bowl
When adding capacity to existing operations which of the following are considerations that should be included in the planning effort?
a. Maintaining system balanceb. Frequency of additionsc. External sources d. All of the abovee. None of the above
Answer: d. All of the above

McGraw-Hill/Irwin © 2006 The McGraw-Hill Companies, Inc., All Rights Reserved.
32
Question Bowl
Which of the following is a term used to describe the difference between projected capacity requirements and the actual capacity requirements?
a. Capacity cushionb. Capacity utilizationc. Capacity utilization rated. All of the abovee. None of the above
Answer: a. Capacity cushion

McGraw-Hill/Irwin © 2006 The McGraw-Hill Companies, Inc., All Rights Reserved.
33
Question Bowl
In determining capacity requirements we must do which of the following?
a. Address the demands for individual product lines
b. Address the demands for individual plants
c. Allocate production throughout the plant network
d. All of the abovee. None of the above
Answer: d. All of the above

McGraw-Hill/Irwin © 2006 The McGraw-Hill Companies, Inc., All Rights Reserved.
34
Question Bowl
In a Decision Tree problem used to evaluate capacity alternatives we need which of the following as prerequisite information?
a. Expect values of payoffsb. Payoff valuesc. A treed. All of the abovee. None of the above
Answer: b. Payoff values (Expected values are what is computed, not prerequisite to the analysis.)

35
©The McGraw-Hill Companies, Inc., 2006
McGraw-Hill/Irwin
End of Chapter 11