Changing Population - North Somerset · PDF fileBetween the 2001 census and the 2014 mid year...
33
Title: North Somerset JSNA – Changing Population Owner: Nina Robery Version Date: Dec 2015 Version: 4.1 Review Date: Jul 2016 Changing Population Executive Summary According to the 2014 Office for National Statistics (ONS) mid year estimates, the resident population of North Somerset was 208,154. This figure is lower than the GP registered population of 215,010. It has been suggested that this discrepancy has occurred as the mid- year estimates account for the number of residents living in North Somerset, whereas the GP registered estimate accounts for people registered with a North Somerset GP. These people may live slightly outside the North Somerset catchment area but go to the doctors in North Somerset hence will also be included in the figure. The age structure in North Somerset is older with fewer younger dependents and people aged under 40. One in five people in North Somerset are aged over 65 compared to 18% in England. Since 1981 the population of North Somerset has grown from 162,864 to 208,154 in 2014 (28% increase) and is expected to continue growing reaching an estimated population of 250,000 by 2035. The largest increases have been and are expected to continue to be in the older people. Between the 2001 census and the 2014 mid year estimates the number of people aged 65 years and over has increased by 31% and for those aged 85 years and over by 33%. The highest elderly population (aged 65 years and over) is situated in two wards within Clevedon (Clevedon North-36% and Clevedon Walton-35%), Portishead Coast (30.5%) and Easton-in- Gordano (30%); the lowest elderly population is situated in Clevedon Yeo at 13%. The prevalence of various diseases is set to increase, particularly in the older ages, specifically for Chronic Obstructive Pulmonary Disease (COPD), diabetes, Cardiovascular Disease (CVD), which includes stroke and coronary heart disease (CHD), hypertension and dementia. In 2011 there were an estimated 88,200 households, an increase of 10% since the previous census. There was a slight fall in the number of people living in each household going from 2.36 in 2001 to 2.30 in 2011. The composition of households across the county and in North Somerset is changing. In 2001 29% of households in North Somerset consisted of one person, by 2011 this had risen to 31%. Nearly one in three people (29%) aged over 65 in North Somerset lives alone.
Transcript of Changing Population - North Somerset · PDF fileBetween the 2001 census and the 2014 mid year...

Title: North Somerset JSNA – Changing Population
Owner: Nina Robery Version Date: Dec 2015
Version: 4.1 Review Date: Jul 2016
Changing Population
Executive Summary
According to the 2014 Office for National Statistics (ONS) mid year estimates, the resident
population of North Somerset was 208,154. This figure is lower than the GP registered
population of 215,010. It has been suggested that this discrepancy has occurred as the mid-
year estimates account for the number of residents living in North Somerset, whereas the
GP registered estimate accounts for people registered with a North Somerset GP. These
people may live slightly outside the North Somerset catchment area but go to the doctors in
North Somerset hence will also be included in the figure.
The age structure in North Somerset is older with fewer younger dependents and people
aged under 40. One in five people in North Somerset are aged over 65 compared to 18% in
England. Since 1981 the population of North Somerset has grown from 162,864 to 208,154
in 2014 (28% increase) and is expected to continue growing reaching an estimated
population of 250,000 by 2035. The largest increases have been and are expected to
continue to be in the older people.
Between the 2001 census and the 2014 mid year estimates the number of people aged 65
years and over has increased by 31% and for those aged 85 years and over by 33%. The
highest elderly population (aged 65 years and over) is situated in two wards within Clevedon
(Clevedon North-36% and Clevedon Walton-35%), Portishead Coast (30.5%) and Easton-in-
Gordano (30%); the lowest elderly population is situated in Clevedon Yeo at 13%. The
prevalence of various diseases is set to increase, particularly in the older ages, specifically
for Chronic Obstructive Pulmonary Disease (COPD), diabetes, Cardiovascular Disease
(CVD), which includes stroke and coronary heart disease (CHD), hypertension and
dementia.
In 2011 there were an estimated 88,200 households, an increase of 10% since the previous
census. There was a slight fall in the number of people living in each household going from
2.36 in 2001 to 2.30 in 2011. The composition of households across the county and in North
Somerset is changing.
In 2001 29% of households in North Somerset consisted of one person, by 2011 this had
risen to 31%. Nearly one in three people (29%) aged over 65 in North Somerset lives alone.

Title: North Somerset JSNA – Changing Population
Owner: Nina Robery Version Date: Dec 2015
Version: 4.1 Review Date: Jul 2016
In 2011, 6% of all households consisted of a single parent with dependent children, a rise of
35% since 2001 and at a faster rate than in England and Wales (19% rise).
The population of North Somerset is less ethnically diverse than England and Wales with
97% of people living in North Somerset classifying themselves as belonging to a white ethnic
group, a decrease of one percentage point since 2001. Of those from a black or minority
ethnic group 44% classified themselves as Asian and a further 37% classified themselves as
mixed race.
In terms of the Indices of Deprivation (ID) 2015, North Somerset has 18 areas in the most
deprived quartile in the country. All of these areas are in Weston-super-Mare. There are
areas in North Somerset within the most deprived 1% nationally and within the least
deprived 1% nationally. This results in North Somerset having the 3rd largest inequality gap
out of the 326 English districts (calculated using the difference between the highest and
lowest area scores in a district).
Author: Nina Robery, Public Health Intelligence Specialist, North Somerset Council
Date: Jul 2015
Challenges for consideration
Planning services for the predicted growth in the population, particularly in the older
age groups.
Title: North Somerset JSNA – Changing Population
Owner: Nina Robery Version Date: Dec 2015
Version: 4.1 Review Date: Jul 2016
Table of Contents
Executive Summary .............................................................................................................. 1
Table of Contents .................................................................................................................. 3
Introduction ........................................................................................................................... 4
Overall Population ................................................................................................................. 4
Population Change ............................................................................................................... 6
Factors Affecting Change in the Population ....................................................................... 6
Standardised Mortality Ratio (SMR) ...................................................................................... 7
Gender/Ethnicity ................................................................................................................... 8
Newborns .............................................................................................................................. 8
Older People ....................................................................................................................... 11
Local ward level view ....................................................................................................... 13
Future Projections ............................................................................................................... 14
Household Composition ...................................................................................................... 15
Economic Profile ................................................................................................................. 16
Income ................................................................................................................................ 18
Education ............................................................................................................................ 19
Older People Living Alone ................................................................................................... 19
Single parents living alone with children .............................................................................. 21
Levels of deprivation ........................................................................................................... 22
Disability and life limiting illness .......................................................................................... 26
Premature Mortality ............................................................................................................. 27
Disability Adjusted Life Years (DALYs) ............................................................................... 27
Older People with a Limiting Long Term Illness ................................................................... 29
Further information .............................................................................................................. 32
Version Control ................................................................................................................... 33
Title: North Somerset JSNA – Changing Population
Owner: Nina Robery Version Date: Dec 2015
Version: 4.1 Review Date: Jul 2016
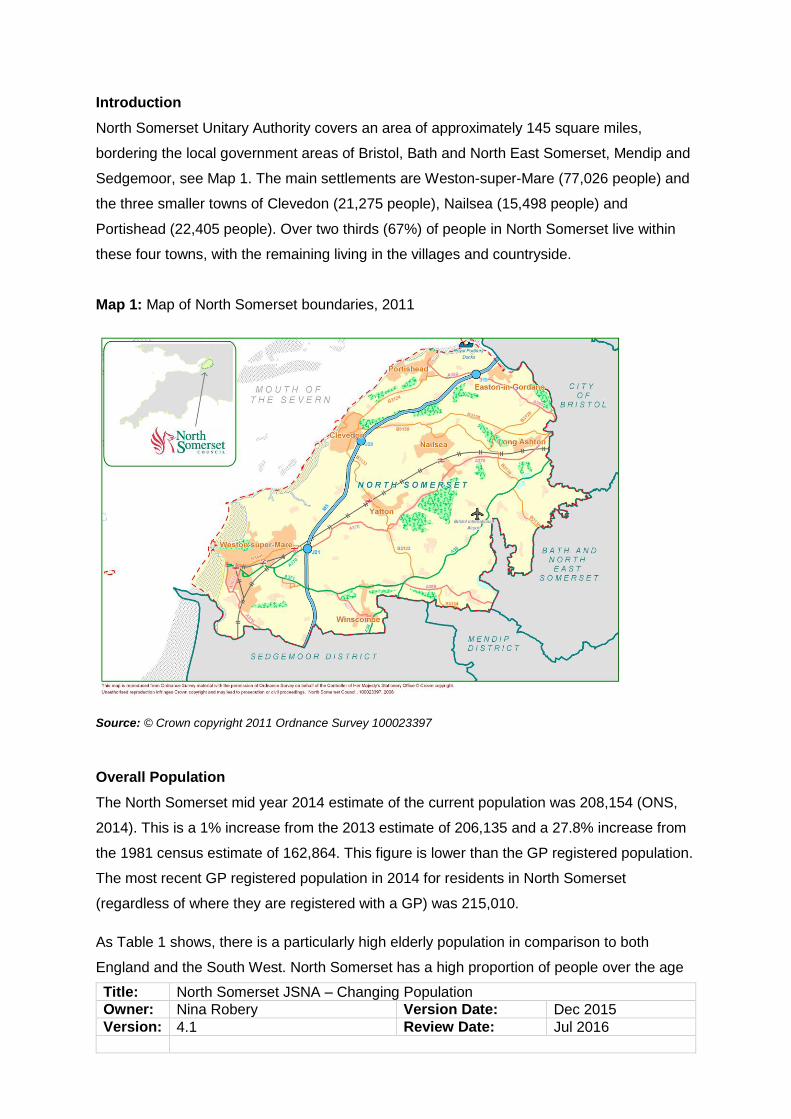
Introduction
North Somerset Unitary Authority covers an area of approximately 145 square miles,
bordering the local government areas of Bristol, Bath and North East Somerset, Mendip and
Sedgemoor, see Map 1. The main settlements are Weston-super-Mare (77,026 people) and
the three smaller towns of Clevedon (21,275 people), Nailsea (15,498 people) and
Portishead (22,405 people). Over two thirds (67%) of people in North Somerset live within
these four towns, with the remaining living in the villages and countryside.
Map 1: Map of North Somerset boundaries, 2011
Source: © Crown copyright 2011 Ordnance Survey 100023397
Overall Population
The North Somerset mid year 2014 estimate of the current population was 208,154 (ONS,
2014). This is a 1% increase from the 2013 estimate of 206,135 and a 27.8% increase from
the 1981 census estimate of 162,864. This figure is lower than the GP registered population.
The most recent GP registered population in 2014 for residents in North Somerset
(regardless of where they are registered with a GP) was 215,010.
As Table 1 shows, there is a particularly high elderly population in comparison to both
England and the South West. North Somerset has a high proportion of people over the age

Title: North Somerset JSNA – Changing Population
Owner: Nina Robery Version Date: Dec 2015
Version: 4.1 Review Date: Jul 2016
of 65, at a rate of one in five, which is higher than the average for England of one in six
(ONS, 2014). This is highlighted in the population pyramid (Figure 1) and shows particularly
high numbers of males and females in the 65-69 age category. There are 6,879 people aged
over 85 in North Somerset (3.3%), which is again higher than the England figure (2.3%).
Figure 1: Population breakdown by sex for North Somerset and England, 2014
The population of over 65's in North Somerset has grown by 31% since 2001, for those aged
over 85 years, there has been an increase of 33%.
Table 1: Age breakdown in North Somerset, England and the South West, 2014
North Somerset England South West
No. % No. % No. %
0-17 42,475 20.4 11,591,701 21.3 1,076,406 19.9
18-64 117,884 56.6 33,187,209 61.1 3,201,097 59.0
65+ 47,795 23.0 9,537,708 17.6 1,145,800 21.1
All Ages 208,154 - 54,316,618 - 5,423,303 -
Source: ONS, 2014

Title: North Somerset JSNA – Changing Population
Owner: Nina Robery Version Date: Dec 2015
Version: 4.1 Review Date: Jul 2016
Population Change
In 1981 the population of North Somerset was 162,864, by 1991 this had risen to 179,213
(10% increase), by 2001 this was 188,840 (16% increase) and by 2011 it was 203,091 (25%
increase since 1981). The increases are similar to those recorded in the South West, but
higher than the average for England and Wales (Table 2).
Table 2: Percentage change in the population in North Somerset, South West and England
and Wales since the 1981 Census
1981 1991 2001 2011
North Somerset 0% 10% 16% 24%
South West 0% 7% 13% 21%
England and Wales 0% 2% 6% 13%
Source: ONS, Census
Factors Affecting Change in the Population
Population change is effected by three factors: the number of babies being born, the number
of deaths and the number of people moving into the area. Overall mortality rates in North
Somerset have been falling. In 1995 the age standardised mortality rate was 1,260 per
100,000 population, by 2013 this had reduced to 1,110 per 100,000 population, a significant
12% decrease.
In contrast the number of births has been increasing at a faster rate than in England. In 1997
the birth rate in North Somerset was lower than England, but by 2009, rates had increased
by 10% and were similar to the England level. In 2013, 2,214 babies were born to mothers
living in North Somerset, compared to 1,924 babies in 1997.
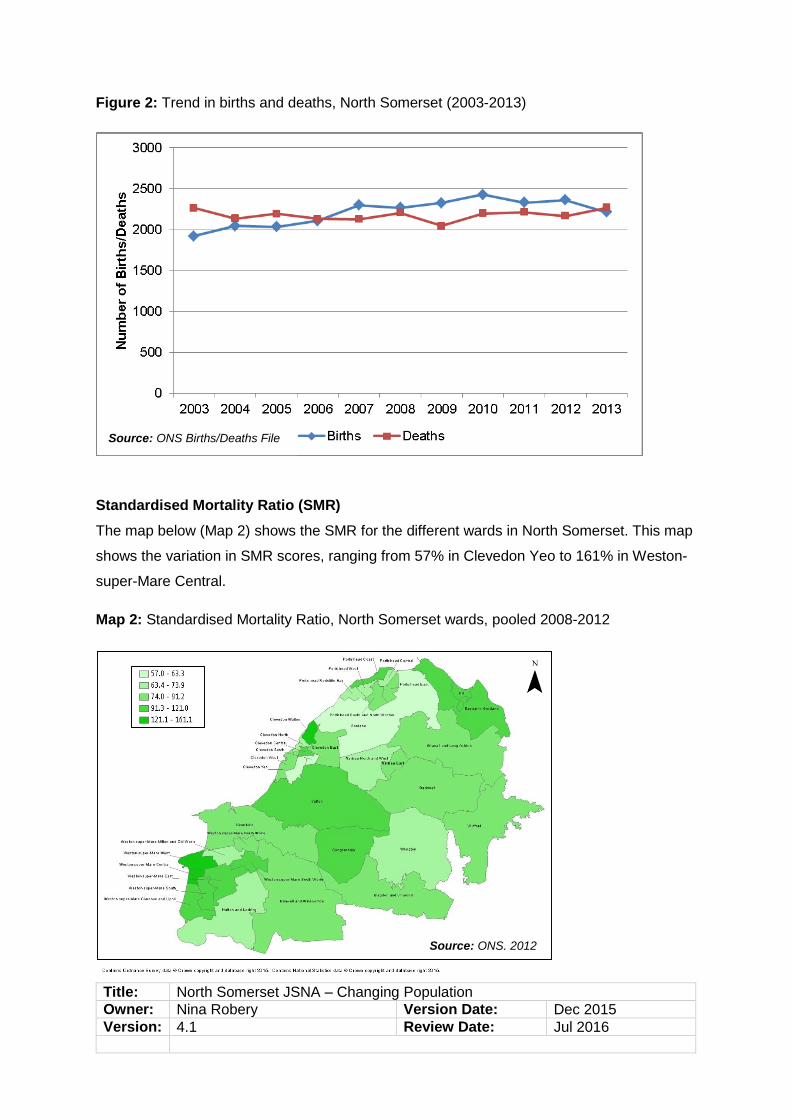
Figure 2 shows the changes in births and deaths between 2003 and 2013. During this period
there were 388 more births than deaths.
Title: North Somerset JSNA – Changing Population
Owner: Nina Robery Version Date: Dec 2015
Version: 4.1 Review Date: Jul 2016
Figure 2: Trend in births and deaths, North Somerset (2003-2013)
Standardised Mortality Ratio (SMR)
The map below (Map 2) shows the SMR for the different wards in North Somerset. This map
shows the variation in SMR scores, ranging from 57% in Clevedon Yeo to 161% in Weston-
super-Mare Central.
Map 2: Standardised Mortality Ratio, North Somerset wards, pooled 2008-2012
Source: ONS Births/Deaths File
Source: ONS, 2013 Source: ONS, 2012

Title: North Somerset JSNA – Changing Population
Owner: Nina Robery Version Date: Dec 2015
Version: 4.1 Review Date: Jul 2016
Gender/Ethnicity
There is an even split in North Somerset between males and females; 101,230 (49%) and
106,924 (51%) respectively (ONS, 2014). The population of North Somerset is less
ethnically diverse than England and Wales with 97% of people living in North Somerset
classifying themselves as belonging to a white ethnic group (including White Irish and Other
White ethnic groups), of those classified as Black or Minority Ethnic group, 44% were Asian
and 37% were mixed race (Census, 2011). The map below (Map 3) shows the variation in
the percentage of the population from a Black or Minority Ethnic group by wards within North
Somerset. Population numbers by ward ranged from 8% in Weston-super-Mare Central to
1% in Clevedon Walton.
Map 3: Population by ethnic group and North Somerset wards, 2011
Newborns
There is an average of 2,214 babies born in North Somerset every year, 1,138 males and
1,076 females, with a crude birth rate of 10.7 births per 1,000 population. This is similar to
the rate for the South West (10.9 births per 1,000 population) and lower than the England
rate of 12.3 births per 1,000 population (ONS, 2013). Figures also record a general fertility
rate (GFR) of 64.0% (This rate is calculated from the number of live births per 1,000 women
aged between 15 and 44). Particularly high GFRs were found in Portishead East (87.8 per
1,000 population), Weston-super-Mare South (84.2 per 1,000 population) and Wraxall and

Title: North Somerset JSNA – Changing Population
Owner: Nina Robery Version Date: Dec 2015
Version: 4.1 Review Date: Jul 2016
Long Ashton (83.9 per 1,000 population). In contrast low GFRs were found in Portishead
Redcliffe Bay (42.8 per 1,000 population) and Nailsea East (44.4 per 1,000 population) (Map
4).
Life expectancy at birth for females is 83.4 years, which is similar to the England average
and for males is 80.1 years, which is better than the England average (Public Health
Outcomes Framework (PHOF), 2013). Healthy life expectancy shows that males are better
than the England average (66.4 years) and females similar to the average (62.6 years).
Map 4: General Fertility Rate per 1,000 women aged between 15 and 44 years, North
Somerset wards, 2012
Source: ONS, 2012
The trend in GFR for North Somerset in comparison to England is shown in Figure 3. This
suggests that there has been a gradual increase in GFR.

Title: North Somerset JSNA – Changing Population
Owner: Nina Robery Version Date: Dec 2015
Version: 4.1 Review Date: Jul 2016
Figure 3: Trend in the rate of babies born per 1,000 women aged 15-44 years (general
fertility rate), North Somerset and England, 2003-2013.
An average of 19.2% (40,040) of the population in North Somerset are 16 years or under.
Within North Somerset the proportion aged under 16 years ranged from 10.3% in Clevedon
North to 25.3% in Portishead East. As can be seen from Map 5 the highest proportions are
concentrated in the Portishead East, Weston-super-Mare East and South, Wraxall and
Gordano areas.
0
10
20
30
40
50
60
70
80
2003 2004 2005 2006 2007 2008 2009 2010 2011 2012 2013Gen
era
l F
ert
ilit
y R
ate
per
1,0
00 w
om
en
ag
ed
15-4
4 y
ears
Year
North Somerset EnglandSource: ONS, 2013

Title: North Somerset JSNA – Changing Population
Owner: Nina Robery Version Date: Dec 2015
Version: 4.1 Review Date: Jul 2016
Map 5: Proportion of the Population aged under 16 by North Somerset wards, 2013
Source: ONS, 2013
In the last decade, North Somerset’s child population (under 16 years of age) rose by 4.2%,
which is similar than the national average of 4.5%. In the last 5 years there has been an
increase of 2.3% in the child population. However, the number of 5-9 year old children has
risen by 7.2% in the same 5 year time period representing the greatest change in the
younger population.
Older People
On average 23% of people living in North Somerset were aged over 65, compared to 21.1%
in the South West and 17.6% in England (ONS, 2014). This equates to a 31% increase from
the 2001 census. Within North Somerset those aged over 65 years ranged from 13% in
Clevedon Yeo to 36% in Clevedon North. As can be seen from Map 6 the highest
proportions are concentrated in two wards within Clevedon (Clevedon North-36% and
Clevedon Walton-35%), Portishead Coast (30.5%) and Easton-in-Gordano (30%).
Title: North Somerset JSNA – Changing Population
Owner: Nina Robery Version Date: Dec 2015
Version: 4.1 Review Date: Jul 2016
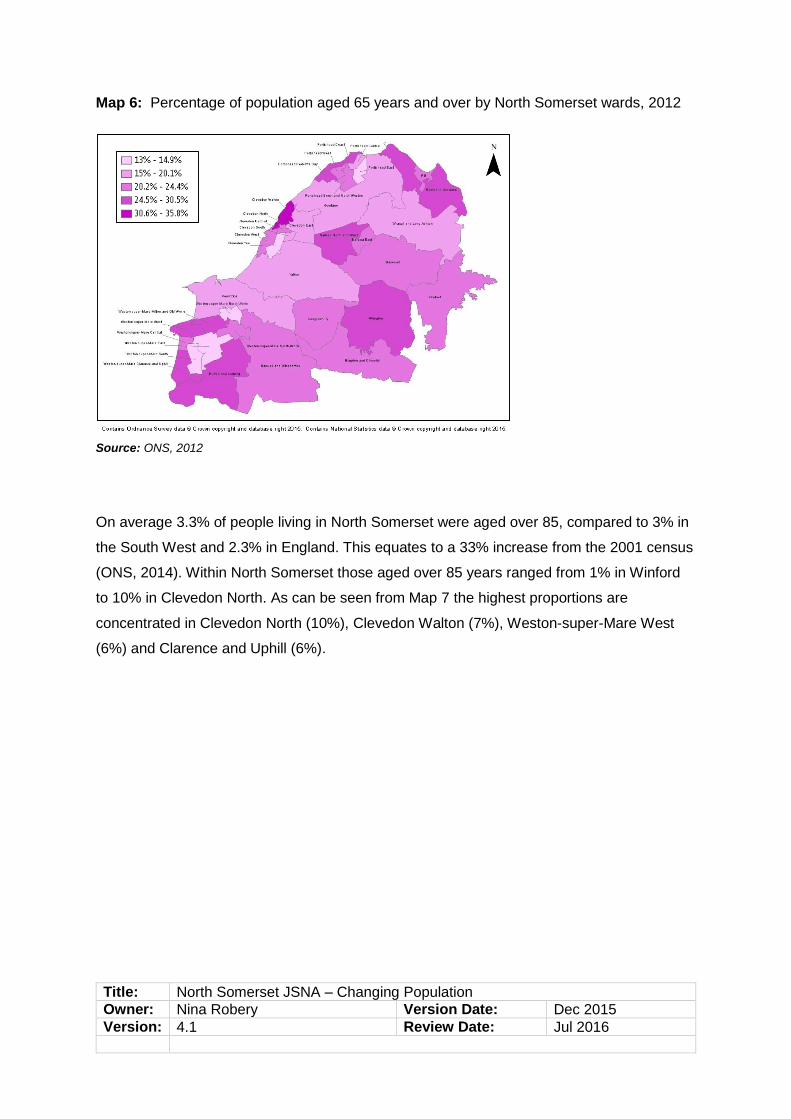
Map 6: Percentage of population aged 65 years and over by North Somerset wards, 2012
Source: ONS, 2012
On average 3.3% of people living in North Somerset were aged over 85, compared to 3% in
the South West and 2.3% in England. This equates to a 33% increase from the 2001 census
(ONS, 2014). Within North Somerset those aged over 85 years ranged from 1% in Winford
to 10% in Clevedon North. As can be seen from Map 7 the highest proportions are
concentrated in Clevedon North (10%), Clevedon Walton (7%), Weston-super-Mare West
(6%) and Clarence and Uphill (6%).

Title: North Somerset JSNA – Changing Population
Owner: Nina Robery Version Date: Dec 2015
Version: 4.1 Review Date: Jul 2016
Map 7: Percentage of population aged 85 years and over, North Somerset wards, 2012
Source: ONS, 2012
Local ward level view
North Somerset consists of a mixture of rural and urban areas so the population density across
North Somerset varies. Results from the 2011 Census show that population numbers by ward,
range from 13,553 in Weston-super-Mare East to 2,531 in Clevedon North. Clevedon Central
and Weston-super-Mare Central are the most densely populated areas with 54 and 53 people
per hectare, whilst Wrington is the most sparsely populated ward in North Somerset with 1
person per hectare (Map 8).

Title: North Somerset JSNA – Changing Population
Owner: Nina Robery Version Date: Dec 2015
Version: 4.1 Review Date: Jul 2016
Map 8: Population density by North Somerset wards, 2011
Future Projections North Somerset faces significant demographic pressures with a population which is both
ageing and growing. Longer term projections suggest the population of North Somerset is
set to increase, from 210,000 in 2015 to 250,000 in 2035; with a particular increase in the
over 65 age group (Figure 4). Between 2015 and 2035 in North Somerset it is projected that
there will be per annum growth of 1.5% across all age groups. The largest increase will be in
the 90+ age group (8.4% per annum), followed by the 85-89 age group (6.3% per annum).
However, the longer the projected time horizon the more inaccurate the modelling is
expected to be, so this should only be used as an indicator.
In respect to the younger age group, the population is projected to rise by 13.8% (an
additional 4,800 children) in the next 10 years. The table below (Table 3) highlights these
changes in the different age groups.
Table 3: 2012-based Sub-national Population Projections for North Somerset, 2012-2022
Age Group 2012 2017 2022 % change 2012-22
0-4 12,000 12,500 12,900 7.5%
5-9 11,300 12,800 13,300 17.7%
10-14 11,400 11,700 13,300 16.7%
15-19 11,400 10,900 11,200 -1.75%
Source: ONS, 2014 (assume trends 2008-2012 continue)

Title: North Somerset JSNA – Changing Population
Owner: Nina Robery Version Date: Dec 2015
Version: 4.1 Review Date: Jul 2016
Figure 4: Population projections for North Somerset, by age categories, 2015-2035.
Household Composition
The 2011 Census showed that there were 88,227 households in North Somerset. Across
North Somerset 45% of households are couples, 31% are one person households, 11% are
all pensioners over the age of 65, 9% are lone parents and 5% are in other types of
households. Household composition is determined by people who live together and their
relationships to one another (Figure 5) (Census, 2011).
Figure 5: Household composition in North Somerset, 2011
Source: Census (2011)
Source: ONS (2014)
Title: North Somerset JSNA – Changing Population
Owner: Nina Robery Version Date: Dec 2015
Version: 4.1 Review Date: Jul 2016
Across North Somerset there were an estimated 27,115 one person households, of which
46% (12,523 people) were aged 65 and over. This indicates that almost one in three people
over the age of 65 are living alone. There was variation in the proportion of one person
households over 65 years of age, ranging from 17% in Clevedon Walton (167 people) to
42% in Portishead Central (308 people) (Census, 2011).
Economic Profile
The proportion of the population in North Somerset who are estimated to be of working age
(aged between 16 and 64 years) is 59.4% (122,500). 79% of the total working age
population are economically active within North Somerset, with unemployment at 5.2%
which is lower than both the South West and Great Britain. 20.9% of people are
economically inactive within North Somerset (Table 4). Of those who are economically
inactive, 30% want a job and 70% do not want a job (NOMIS, 2014).
Of the 16-18 year olds in North Somerset, 3.2% are not in education, employment or training
(NEET), which equates to 210 adolescents.
Table 4: Economic inactivity in North Somerset, compared to the South West and Great Britain, Jul 2013-Jun 2014.
North Somerset
(level) North Somerset
(%) South West
(%) Great Britain
(%)
All people
Total 27,600 20.9 20.6 22.5
Student 6,800 24.5 25.9 26.3
Looking after family/home 6,300 23.0 23.5 25.5
Temporary sick # # 2.6 2.2
Long-term sick 5,300 19.2 19.5 21.4
Discouraged ! ! 0.6 0.6
Retired 5,300 19.2 18.0 15.0
Other 3,500 12.7 10.0 9.0
Wants a job 8,300 30.2 27.0 24.9
Does not want a job 19,300 69.8 73.0 75.1
# Sample size too small for reliable estimate ! Estimate is unavailable as sample size is disclosive Note: Numbers are for those aged 16-64, % is a proportion of those economically inactive, except total, which is a proportion of those aged 16-64
Source: NOMIS, 2014
Those claiming job seekers allowance is at 1.2% (1,449), with a slightly greater proportion of
males (1.5%, 929) claiming than females (0.8%, 520) (NOMIS, 2014). These figures are

Title: North Somerset JSNA – Changing Population
Owner: Nina Robery Version Date: Dec 2015
Version: 4.1 Review Date: Jul 2016
lower than the percentage for Great Britain of 2%. The total number of people claiming
benefits was at 13,640 (11.2%) in North Somerset in May 2014; with the majority on ESA
and incapacity benefits (55%) (Table 5) (NOMIS, 2014).
Table 5: Working-age client group - key benefit claimants in North Somerset, compared to South West and Great Britain, May 2014.
North Somerset
(numbers) North Somerset
(%)
South West (%)
Great Britain
(%)
Total claimants 13,680 11.2 11.0 12.9
By statistical group
Job seekers 1,810 1.5 1.5 2.4
ESA and incapacity benefits 7,480 6.1 5.6 6.2
Lone parents 1,130 0.9 0.9 1.2
Carers 1,330 1.1 1.2 1.4
Others on income related benefits
360 0.3 0.3 0.3
Disabled 1,340 1.1 1.2 1.2
Bereaved 240 0.2 0.2 0.2
Key out-of-work benefits† 10,770 8.8 8.4 10 † Key out-of-work benefits includes the groups: job seekers, ESA and incapacity benefits, lone parents and others on income related benefits. ESA – Employment and Support Allowance Source: NOMIS, 2014
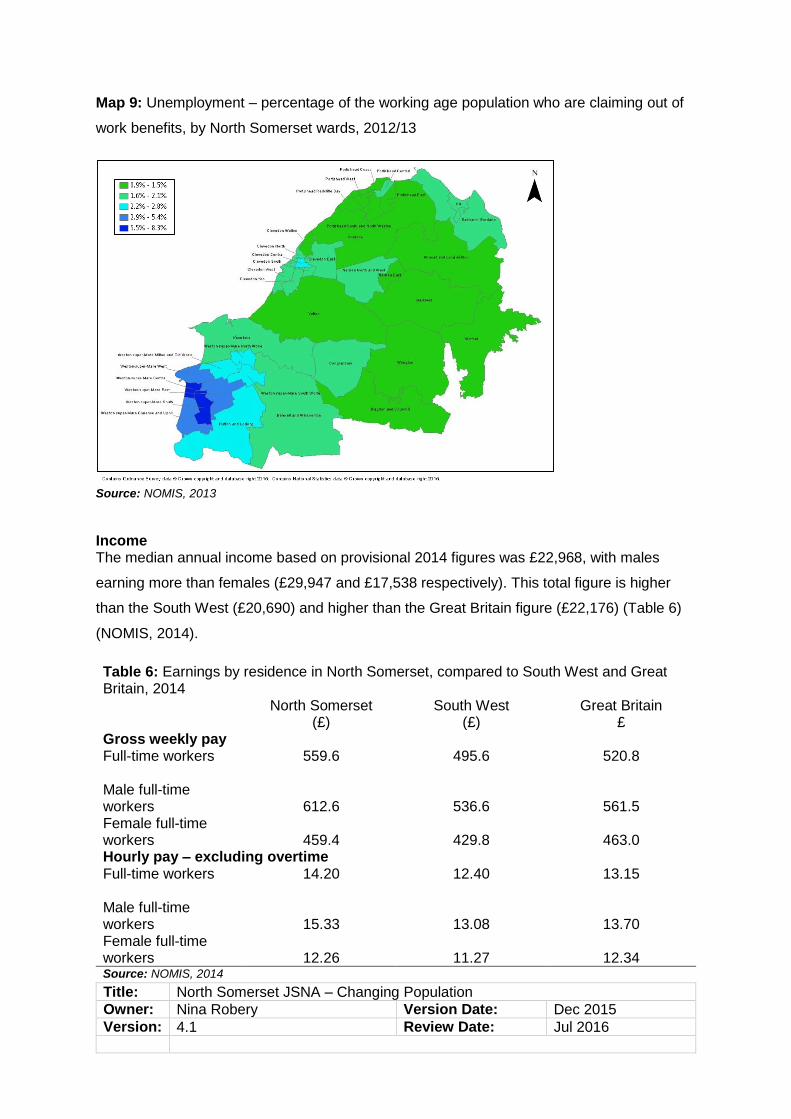
The map below shows the variation in the percentage of the working age population who are
claiming out of work benefits, the highest in Weston-super-Mare Central (8.3%) and lowest
in Backwell (0.9%).
Title: North Somerset JSNA – Changing Population
Owner: Nina Robery Version Date: Dec 2015
Version: 4.1 Review Date: Jul 2016
Map 9: Unemployment – percentage of the working age population who are claiming out of
work benefits, by North Somerset wards, 2012/13
Source: NOMIS, 2013
Income The median annual income based on provisional 2014 figures was £22,968, with males
earning more than females (£29,947 and £17,538 respectively). This total figure is higher
than the South West (£20,690) and higher than the Great Britain figure (£22,176) (Table 6)
(NOMIS, 2014).
Table 6: Earnings by residence in North Somerset, compared to South West and Great Britain, 2014 North Somerset
(£) South West
(£) Great Britain
£ Gross weekly pay Full-time workers
559.6 495.6 520.8
Male full-time workers
612.6
536.6
561.5
Female full-time workers
459.4
429.8
463.0
Hourly pay – excluding overtime Full-time workers
14.20 12.40 13.15
Male full-time workers
15.33
13.08
13.70
Female full-time workers
12.26
11.27
12.34
Source: NOMIS, 2014

Title: North Somerset JSNA – Changing Population
Owner: Nina Robery Version Date: Dec 2015
Version: 4.1 Review Date: Jul 2016
Education
In North Somerset, the distribution of qualifications generally follows the percentages for the
South West and Great Britain, with a lower number of people with no qualifications in North
Somerset than Great Britain (Table 7) (NOMIS, 2014).
Table 7: Qualifications in North Somerset, compared to South West and Great Britain, January 2013-December 2014
North Somerset
(Numbers) North Somerset
(%) South West
(%) Great Britain
(%)
Individual Levels
NVQ4 and above 41,600 31.4 34.1 35.2
NVQ3 and above 73,300 55.4 57.8 55.8
NVQ2 and above 99,600 75.2 75.8 72.5
NVQ1 and above 117,200 88.5 88.5 84.4
Other qualifications 6,100 4.6 4.9 6.3
No qualifications 9,100 6.8 6.6 9.3
Source: NOMIS, 2014
Older People Living Alone
According to the Projecting Older People Population Information System (POPPI), there is
an estimated 10,997 people over the age of 75 living alone in North Somerset, which is
projected to increase to 18,393 by 2030 (Figure 6). The rate for people aged over 75 years
living alone is almost double for females compared to males at 61% and 34% respectively.

Title: North Somerset JSNA – Changing Population
Owner: Nina Robery Version Date: Dec 2015
Version: 4.1 Review Date: Jul 2016
Figure 6: The number of males and females over the age of 75 years predicted to live alone,
2015-2030
The proportion of one person households over the age of 65 varies across North Somerset
ranging from 17% in Clevedon Walton (167 people aged 65+ living alone) to 42% in Portishead
Central (308 people aged 65+ living alone). As can be seen from Map 10 the highest
proportions are concentrated in the Weston-super-Mare area, South Worle, Clevedon North
and Central and Nailsea North and West.
Source: POPPI, 2014

Title: North Somerset JSNA – Changing Population
Owner: Nina Robery Version Date: Dec 2015
Version: 4.1 Review Date: Jul 2016
Map 10: Percentage of older people living alone by North Somerset wards, 2011
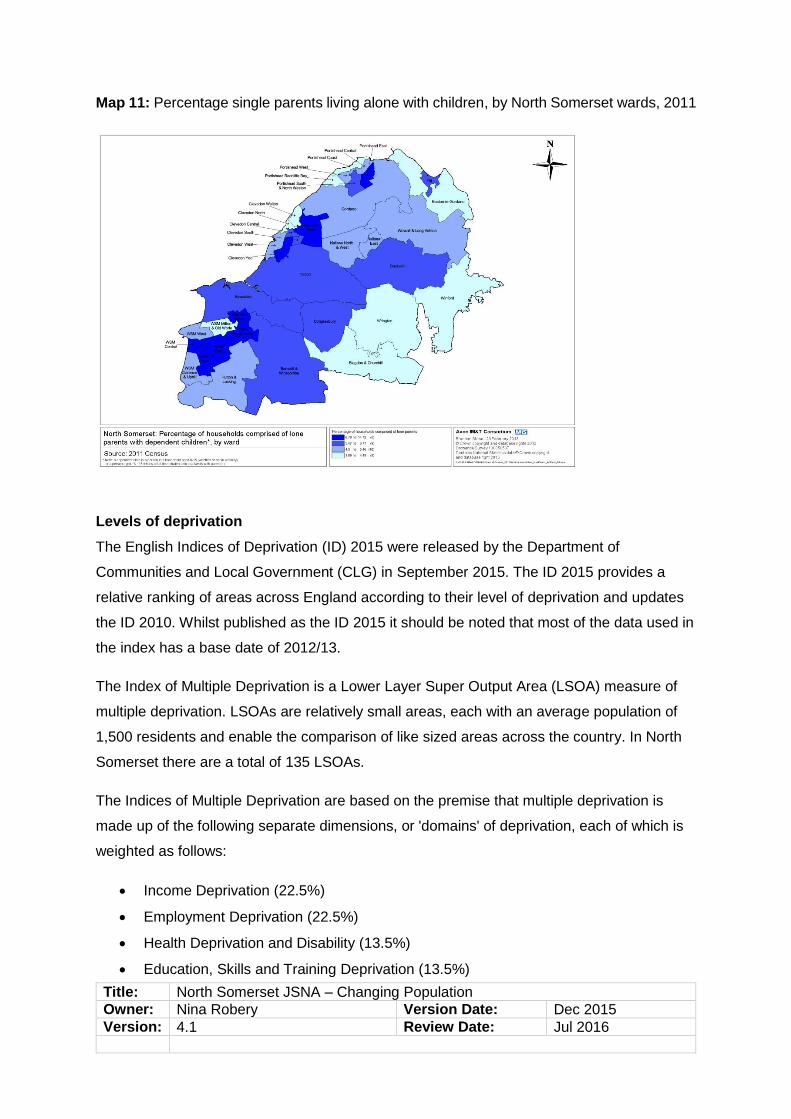
Single parents living alone with children
Across North Somerset the 2011 Census estimated that there were 7,715 single parents. Of
these 70% lived with children who were dependent on them. The number of single parents
living with dependent children has increased by 35% since the 2001 Census. The proportion
of single parents living with dependent children, ranges from 2% in Clevedon Walton to 15%
in Weston-super-Mare South. As can be seen from Map 11 the highest proportions are
concentrated in the Weston-super-Mare area.
Title: North Somerset JSNA – Changing Population
Owner: Nina Robery Version Date: Dec 2015
Version: 4.1 Review Date: Jul 2016
Map 11: Percentage single parents living alone with children, by North Somerset wards, 2011
Levels of deprivation
The English Indices of Deprivation (ID) 2015 were released by the Department of
Communities and Local Government (CLG) in September 2015. The ID 2015 provides a
relative ranking of areas across England according to their level of deprivation and updates
the ID 2010. Whilst published as the ID 2015 it should be noted that most of the data used in
the index has a base date of 2012/13.
The Index of Multiple Deprivation is a Lower Layer Super Output Area (LSOA) measure of
multiple deprivation. LSOAs are relatively small areas, each with an average population of
1,500 residents and enable the comparison of like sized areas across the country. In North
Somerset there are a total of 135 LSOAs.
The Indices of Multiple Deprivation are based on the premise that multiple deprivation is
made up of the following separate dimensions, or 'domains' of deprivation, each of which is
weighted as follows:
Income Deprivation (22.5%)
Employment Deprivation (22.5%)
Health Deprivation and Disability (13.5%)
Education, Skills and Training Deprivation (13.5%)

Title: North Somerset JSNA – Changing Population
Owner: Nina Robery Version Date: Dec 2015
Version: 4.1 Review Date: Jul 2016
Barriers to Housing and Services (9.3%)
Crime (9.3%)
Living Environment Deprivation (9.3%)
Each LSOA in the country is given a score and rank for multiple deprivation and for each
individual domain of deprivation, indicating whether it is relatively more or less deprived than
other LSOAs.
Using this measure, 21 (15.6%) of North Somerset’s LSOAs are in the 10% least deprived
areas in England and nine (6.7%) are in the 10% most deprived areas. Those areas that fall
in the 10% most deprived are located within two wards, Weston-super-Mare Central and
Weston-super-Mare South, apart from one located within Weston-super-Mare West.
There are two areas in North Somerset within the most deprived 1% nationally and three
areas within the least deprived 1%. North Somerset has the third largest range of inequality
of the 326 districts in England (calculated using the difference between the highest and
Map 12: Index of multiple deprivation in North Somerset, 2015
Source: 2015 English Indices of Deprivation, Department for Communities and Local Government
Title: North Somerset JSNA – Changing Population
Owner: Nina Robery Version Date: Dec 2015
Version: 4.1 Review Date: Jul 2016
lowest LSOA score in a district). Eighteen of the LSOAs in North Somerset are within the
most deprived 25% of areas nationally. All of these areas are within Weston-super-Mare
(Map 12).
The current slope of inequality in the gap in life expectancy between the most affluent and
most deprived electoral wards in North Somerset is 9.8 years for men and 6.6 years for
women. This is amongst the largest gaps seen in England (Public Health Profiles, 2014).
In North Somerset there are an estimated 5,459 (14.9%) children (under 16 years) living in
poverty (defined as living in low income families). Statutory homelessness in North Somerset
is approximately 0.6 per 1,000 households with homelessness acceptances at 0.9 per 1,000
households, both of which vary according to geography (PHOF, 2014).
Deprivation generally, and the inequalities that manifest across a variety of indicators are an
important consideration for healthcare planning for a number of reasons:
People in poorer areas die earlier but also spend more of their shorter lives with a
disability, which puts a financial strain on the NHS.
The national cost to the NHS from inequalities is estimated to be £5bn.
The fact that these inequalities exist, suggests in principle that it should be possible
to attain the level of the best.
It is unlikely that further efficiencies in healthcare services can fully address the
impact on health of the wider societal and environmental inequalities and the
increase in the age of the population.
We need to consider how we can influence action on the wider inequalities in order to
reduce future pressure on healthcare services.
The Public Health England Segment tool provides information on the causes of death that
are driving inequalities in life expectancy at local area. The tool shows the breakdown of the
life expectancy gap within North Somerset. It is broken down for males and females.
Circulatory disease is the largest contributor to the gap in life expectancy between the least
and most deprived quintiles, for both males and females at 28.3% and 25.8% respectively.
Specifically for males, the leading contributors to the gap in life expectancy are circulatory
diseases (28.3%), external causes (excluding suicide) 17.8% and cancers 17.6%. When this
is further broken down, coronary heart disease and other cancers (excluding lung cancer)
are particular contributors (Figure 7).

Title: North Somerset JSNA – Changing Population
Owner: Nina Robery Version Date: Dec 2015
Version: 4.1 Review Date: Jul 2016
Figure 7: Life expectancy years gained or lost if North Somerset’s most deprived quintile
had the same mortality rate as the least deprived quintile, by detailed cause of death for
males, 2010-12
Source: Public Health England Segment Tool, 2014
In females the leading contributors excluding the ‘other causes’ category are circulatory
diseases (25.8%), respiratory diseases (15.1%) and cancer (14.1%). Particular contributors
include coronary heart disease, dementia, lung cancer and chronic obstructive airways
disease (Figure 8).

Title: North Somerset JSNA – Changing Population
Owner: Nina Robery Version Date: Dec 2015
Version: 4.1 Review Date: Jul 2016
Figure 8: Life expectancy years gained or lost if North Somerset’s most deprived quintile
had the same mortality rate as the least deprived quintile, by detailed cause of death for
females, 2010-12
Source: Public Health England Segment Tool (2014)
Disability and life limiting illness
In 2011, ONS estimated that there were 1,582 children in North Somerset aged between 0
and 4 years old with a long-standing illness or disability and 13 of those were diagnosed as
severely disabled children. 4,923 children in North Somerset have special needs, of which
486 have statements and 4,437 do not (School Census, 2014).
Of the total population in North Somerset, 8.6% (17,335) have a disability that limits their
day-to-day activities a lot and 10.6% (21,405) have a disability that affects their day-to-day
activities a little. Of these many may need support to continue working (Census, 2011).

Title: North Somerset JSNA – Changing Population
Owner: Nina Robery Version Date: Dec 2015
Version: 4.1 Review Date: Jul 2016
In North Somerset the number of adults with a learning disability known to GPs was 809
(2011-12), creating a value of 4.77 (95% CI 4.45 to 5.11) per 1,000 population (Learning
Disabilities Profile, 2013).
Premature Mortality
Public Health England launched a new website showing large variations in early death rates
across the country. The website, called ‘Longer Lives – Healthier Lives’, is a new initiative to
allow people to see how local mortality rates compare to the rest of the country and their
peer group.
Premature mortality data throughout Longer Lives is based on directly standardised mortality
rates for those aged under 75 years and are compared to peers.
In North Somerset, overall mortality rates for those aged under 75 years are
significantly better than the England average. But when compared to its peer group,
North Somerset has the fourth highest rate at 312 per 100,000 population and is
significantly worse than its peers (12th out of 15).
Rates of cancer, lung and liver disease in North Somerset were better than average
when compared to its peer group and England.
Rates of heart disease and injuries in North Somerset were better than the average
for England but worse when compared to the average for its peer group. However,
neither findings were significantly different and are within the expected range.
Disability Adjusted Life Years (DALYs)
Disability Adjusted Life Years (DALYs) take into account the number of years of a person’s
life are lost but also the amount of time spent with a disability, hence they capture the
impacts of chronic conditions and those associated with pain and morbidity. The table below
(Table 8) shows the DALYs lost in North Somerset by various causes of death. In North
Somerset the leading causes of DALYs lost are cancer (neoplasms), mental health and
behavioural disorders, musculoskeletal conditions and cardiovascular disease; in particular
low back and neck pain (6,249), ischaemic heart disease (4,887), chronic obstructive
pulmonary disease (2,377) and cerebrovascular disease (2,233).

Title: North Somerset JSNA – Changing Population
Owner: Nina Robery Version Date: Dec 2015
Version: 4.1 Review Date: Jul 2016
Table 8: Estimated Disability Adjusted Life Years (DALYs) lost in North Somerset by cause in an average year, per 100,000 population, mid-year population estimates 2014
North Somerset
All causes 56,541
Neoplasms 9,552
Oesophageal cancer 435
Stomach cancer 316
Liver cancer 206
Trachea, bronchus, and lung cancers 2,059
Breast cancer 993
Prostate cancer 493
Colon and rectum cancers 1,093
Pancreatic cancer 473
Hodgkin's disease 42
Congenital anomalies 443
Unintentional injuries other than transport injuries 2,521
Falls 1,790
Road injury 1,045
Musculoskeletal disorders 8,792
Rheumatoid arthritis 356
Osteoarthritis 731
Low back and neck pain 6,249
Gout 12
Other musculoskeletal disorders 1,445
Mental and behavioural disorders 6,521
Schizophrenia 493
Alcohol use disorders 764
Drug use disorders 1,291
Unipolar depressive disorders 1,819
Bipolar affective disorder 362
Alzheimer's disease and other dementias 1,301
Parkinson's disease 239
Migraine 949
Cardiovascular and circulatory diseases 9,109
Ischaemic heart disease 4,887
Cerebrovascular disease 2,233
Diabetes, urogenital, blood, and endocrine diseases 2,714
Diabetes mellitus 701
Title: North Somerset JSNA – Changing Population
Owner: Nina Robery Version Date: Dec 2015
Version: 4.1 Review Date: Jul 2016
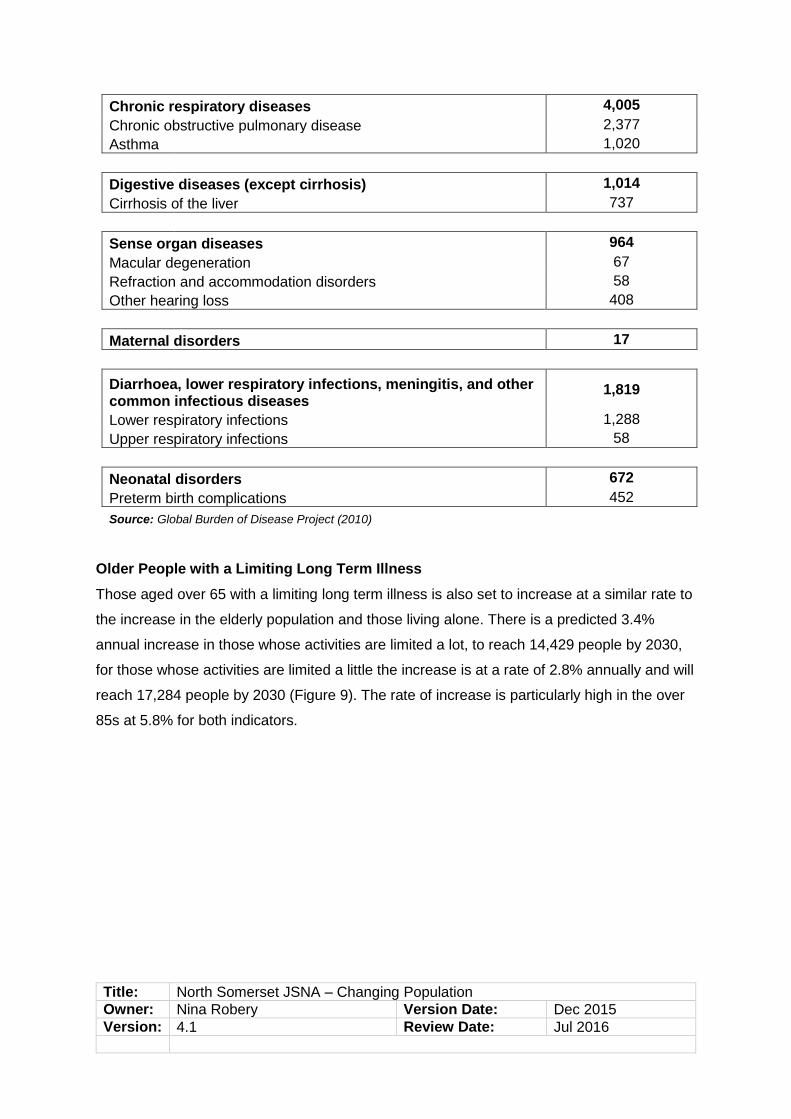
Chronic respiratory diseases 4,005
Chronic obstructive pulmonary disease 2,377
Asthma 1,020
Digestive diseases (except cirrhosis) 1,014
Cirrhosis of the liver 737
Sense organ diseases 964
Macular degeneration 67
Refraction and accommodation disorders 58
Other hearing loss 408
Maternal disorders 17
Diarrhoea, lower respiratory infections, meningitis, and other common infectious diseases
1,819
Lower respiratory infections 1,288
Upper respiratory infections 58
Neonatal disorders 672
Preterm birth complications 452
Source: Global Burden of Disease Project (2010)
Older People with a Limiting Long Term Illness
Those aged over 65 with a limiting long term illness is also set to increase at a similar rate to
the increase in the elderly population and those living alone. There is a predicted 3.4%
annual increase in those whose activities are limited a lot, to reach 14,429 people by 2030,
for those whose activities are limited a little the increase is at a rate of 2.8% annually and will
reach 17,284 people by 2030 (Figure 9). The rate of increase is particularly high in the over
85s at 5.8% for both indicators.
Title: North Somerset JSNA – Changing Population
Owner: Nina Robery Version Date: Dec 2015
Version: 4.1 Review Date: Jul 2016
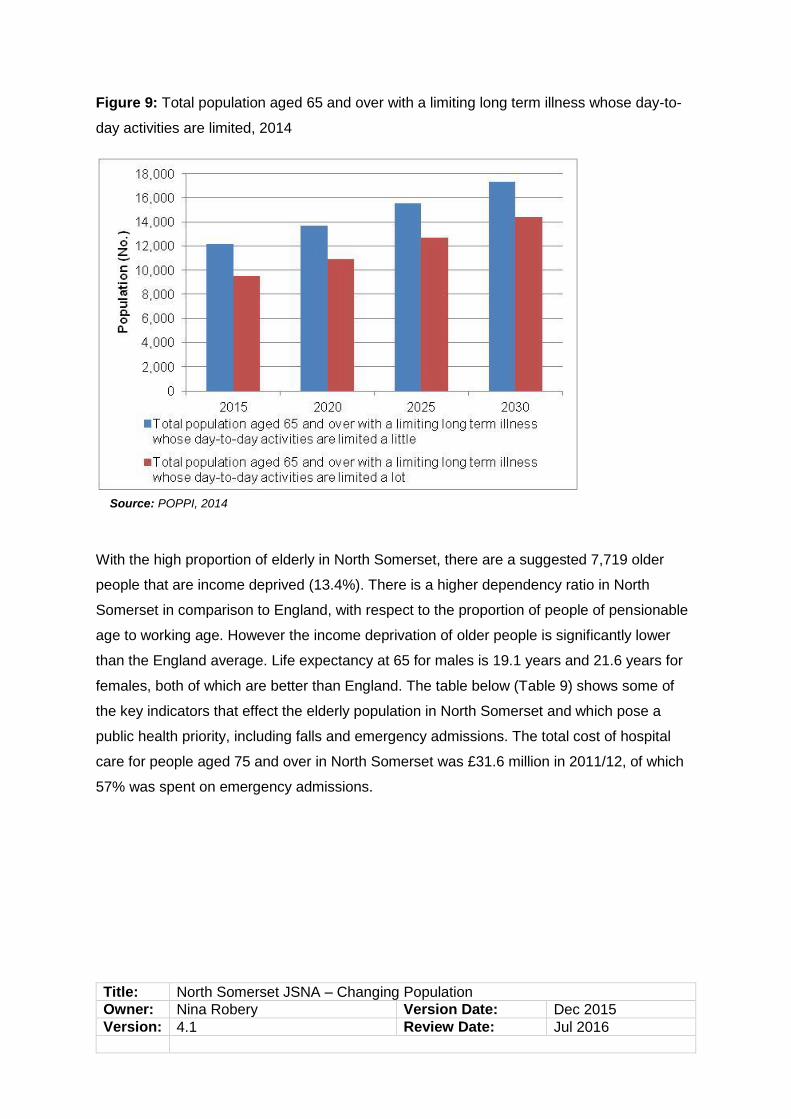
Figure 9: Total population aged 65 and over with a limiting long term illness whose day-to-
day activities are limited, 2014
With the high proportion of elderly in North Somerset, there are a suggested 7,719 older
people that are income deprived (13.4%). There is a higher dependency ratio in North
Somerset in comparison to England, with respect to the proportion of people of pensionable
age to working age. However the income deprivation of older people is significantly lower
than the England average. Life expectancy at 65 for males is 19.1 years and 21.6 years for
females, both of which are better than England. The table below (Table 9) shows some of
the key indicators that effect the elderly population in North Somerset and which pose a
public health priority, including falls and emergency admissions. The total cost of hospital
care for people aged 75 and over in North Somerset was £31.6 million in 2011/12, of which
57% was spent on emergency admissions.
Source: POPPI, 2014
Title: North Somerset JSNA – Changing Population
Owner: Nina Robery Version Date: Dec 2015
Version: 4.1 Review Date: Jul 2016
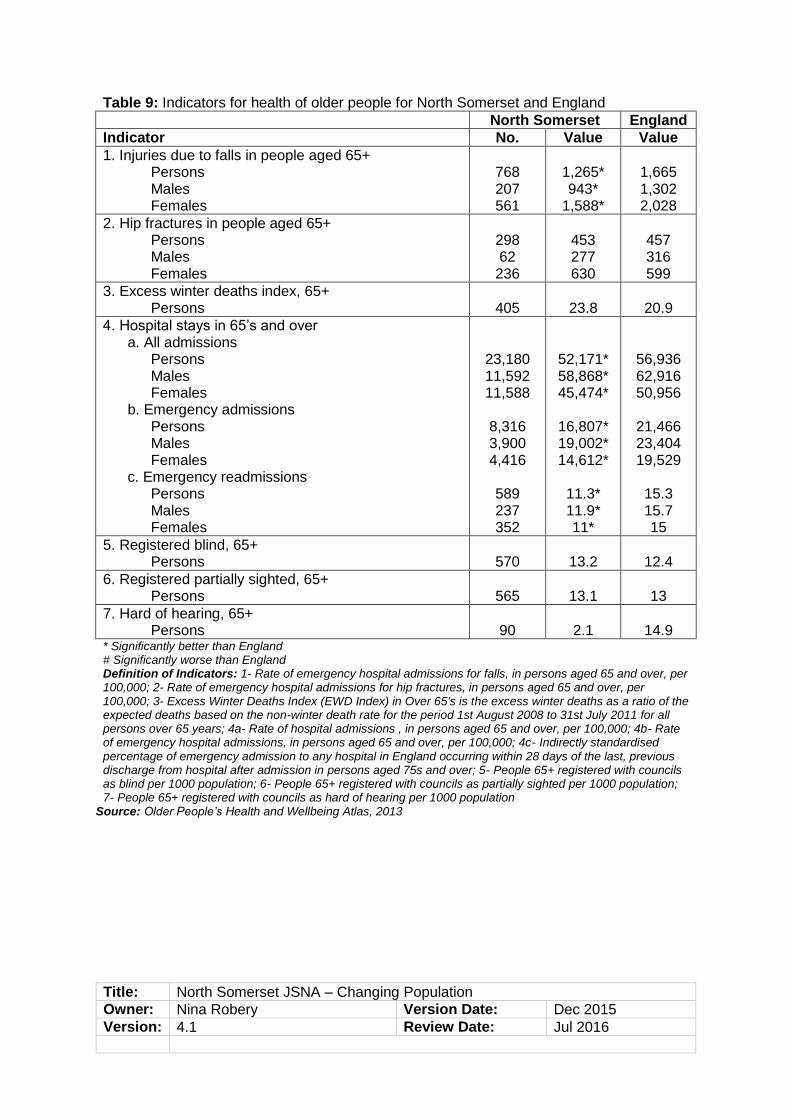
Table 9: Indicators for health of older people for North Somerset and England
North Somerset England
Indicator No. Value Value
1. Injuries due to falls in people aged 65+ Persons Males Females
768 207 561
1,265* 943*
1,588*
1,665 1,302 2,028
2. Hip fractures in people aged 65+ Persons Males Females
298 62 236
453 277 630
457 316 599
3. Excess winter deaths index, 65+ Persons
405
23.8
20.9
4. Hospital stays in 65’s and over a. All admissions
Persons Males Females
b. Emergency admissions Persons Males Females
c. Emergency readmissions Persons Males Females
23,180 11,592 11,588
8,316 3,900 4,416
589 237 352
52,171* 58,868* 45,474*
16,807* 19,002* 14,612*
11.3* 11.9* 11*
56,936 62,916 50,956
21,466 23,404 19,529
15.3 15.7 15
5. Registered blind, 65+ Persons
570
13.2
12.4
6. Registered partially sighted, 65+ Persons
565
13.1
13
7. Hard of hearing, 65+ Persons
90
2.1
14.9
* Significantly better than England # Significantly worse than England Definition of Indicators: 1- Rate of emergency hospital admissions for falls, in persons aged 65 and over, per 100,000; 2- Rate of emergency hospital admissions for hip fractures, in persons aged 65 and over, per 100,000; 3- Excess Winter Deaths Index (EWD Index) in Over 65's is the excess winter deaths as a ratio of the expected deaths based on the non-winter death rate for the period 1st August 2008 to 31st July 2011 for all persons over 65 years; 4a- Rate of hospital admissions , in persons aged 65 and over, per 100,000; 4b- Rate of emergency hospital admissions, in persons aged 65 and over, per 100,000; 4c- Indirectly standardised percentage of emergency admission to any hospital in England occurring within 28 days of the last, previous discharge from hospital after admission in persons aged 75s and over; 5- People 65+ registered with councils as blind per 1000 population; 6- People 65+ registered with councils as partially sighted per 1000 population; 7- People 65+ registered with councils as hard of hearing per 1000 population
Source: Older People’s Health and Wellbeing Atlas, 2013

Title: North Somerset JSNA – Changing Population
Owner: Nina Robery Version Date: Dec 2015
Version: 4.1 Review Date: Jul 2016
Further information
North Somerset Core Strategy
http://www.n-somerset.gov.uk/Environment/Planning_policy_and-research/localplanning/
Pages/Core-Strategy.aspx
2011 Census results
http://www.ons.gov.uk/ons/guide-method/census/2011/index.html
Census Ward profiles
http://www.n-somerset.gov.uk/Environment/Planning_policy_and-
research/researchandmonitoring/Documents/ward%20census%20profiles%20(pdf).pdf
The 2012 English Indices of Deprivation
https://www.gov.uk/government/publications/english-indices-of-deprivation-2010
Further data tables
Registered practice population figures, Dec 2014
2011 Census figures by 5 year age band, North Somerset, South West and England
and Wales

Title: North Somerset JSNA – Changing Population
Owner: Nina Robery Version Date: Dec 2015
Version: 4.1 Review Date: Jul 2016
Version Control
Date Author Version Amended
Sections
Summary of Change Changes to
Recommendations
Sept
11
Helen Yeo
& Natalie
Richards
V 2.0 All updated Census data added and
revised projections and
GP registrations
Mar
13
Helen Yeo
& Natalie
Richards
V 3.0 All updated New census data included
Jul
15
Nina
Robery
V 4.0 All updated Population data, maps,
figures and tables
updated, economic profile,
income, education,
DALYs, premature
mortality and older
people’s health and
wellbeing added
Dec
15
Malcolm
Lane
V 4.1 Levels of
Deprivation
and
Executive
Summary
Updated with new Index of
Multiple Deprivation data