Changing Forage QualityChanging Forage Quality...
42
Changing Forage Quality Changing Forage Quality Changing Forage Quality Changing Forage Quality Testing for Alfalfa Hay Testing for Alfalfa Hay Markets Markets Daniel H. Putnam, PhD Daniel H. Putnam, PhD Daniel H. Putnam, PhD Daniel H. Putnam, PhD Department of Plant Sciences Department of Plant Sciences University of California, Davis University of California, Davis Department of Plant Sciences Department of Plant Sciences University of California, Davis University of California, Davis 2010 CA Alfalfa & Forage Symposium 2010 CA Alfalfa & Forage Symposium
Transcript of Changing Forage QualityChanging Forage Quality...

Changing Forage QualityChanging Forage QualityChanging Forage Quality Changing Forage Quality Testing for Alfalfa Hay Testing for Alfalfa Hay
MarketsMarkets
Daniel H. Putnam, PhDDaniel H. Putnam, PhDDaniel H. Putnam, PhDDaniel H. Putnam, PhDDepartment of Plant SciencesDepartment of Plant SciencesUniversity of California, DavisUniversity of California, DavisDepartment of Plant SciencesDepartment of Plant SciencesUniversity of California, DavisUniversity of California, Davisy ,y ,y ,y ,
2010 CA Alfalfa & Forage Symposium2010 CA Alfalfa & Forage Symposium

Thesis:Thesis:Q li d kQ li d k
Thesis:Thesis:Q li d kQ li d kHay Quality and Markets:Hay Quality and Markets:Hay Quality and Markets:Hay Quality and Markets:
Current System is nearly entirelyCurrent System is nearly entirely Current System is nearly entirelyCurrent System is nearly entirely Current System is nearly entirely Current System is nearly entirely based upon low fiber (ADF, NDF) = based upon low fiber (ADF, NDF) = high qualityhigh quality
Current System is nearly entirely Current System is nearly entirely based upon low fiber (ADF, NDF) = based upon low fiber (ADF, NDF) = high qualityhigh qualityhigh qualityhigh quality
This system is effective to some This system is effective to some degree but misses importantdegree but misses important
high qualityhigh qualityThis system is effective to some This system is effective to some
degree but misses importantdegree but misses importantdegree, but misses important degree, but misses important quality attributesquality attributes
Prone to AbusesProne to Abuses
degree, but misses important degree, but misses important quality attributesquality attributes
Prone to AbusesProne to AbusesProne to AbusesProne to AbusesProne to AbusesProne to Abuses
2010 CA Alfalfa & Forage Symposium2010 CA Alfalfa & Forage Symposium

What is Hay Quality?What is Hay Quality?What is it worth?What is it worth?
What is Hay Quality?What is Hay Quality?What is it worth?What is it worth?What is it worth?What is it worth?
How should it be measured?How should it be measured?What is it worth?What is it worth?
How should it be measured?How should it be measured?
2010 CA Alfalfa & Forage Symposium2010 CA Alfalfa & Forage Symposium
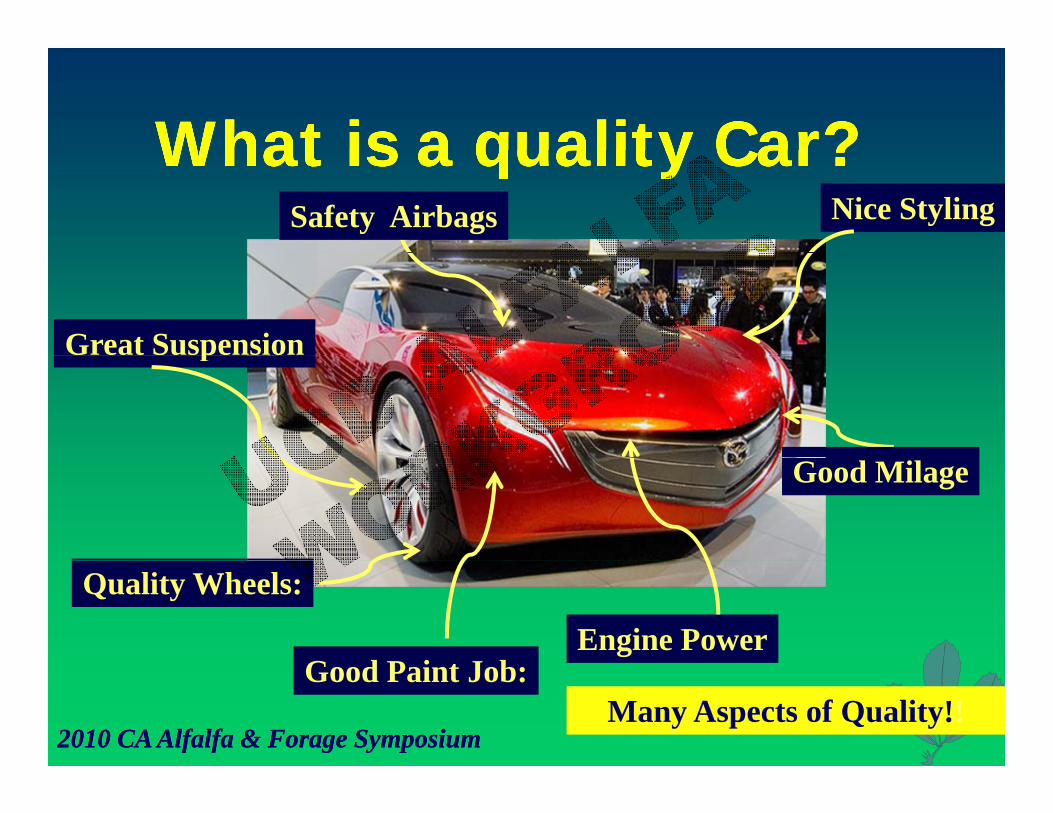
What is a quality Car?What is a quality Car?What is a quality Car?What is a quality Car?What is a quality Car?What is a quality Car?What is a quality Car?What is a quality Car?Nice StylingSafety Airbags
Great Suspensionp
Good Milage
Quality Wheels:
Engine PowerG d P i t J b
2010 CA Alfalfa & Forage Symposium2010 CA Alfalfa & Forage Symposium
Good Paint Job:Many Aspects of Quality!!
What is Quality Hay?What is Quality Hay?What is Quality Hay?What is Quality Hay?
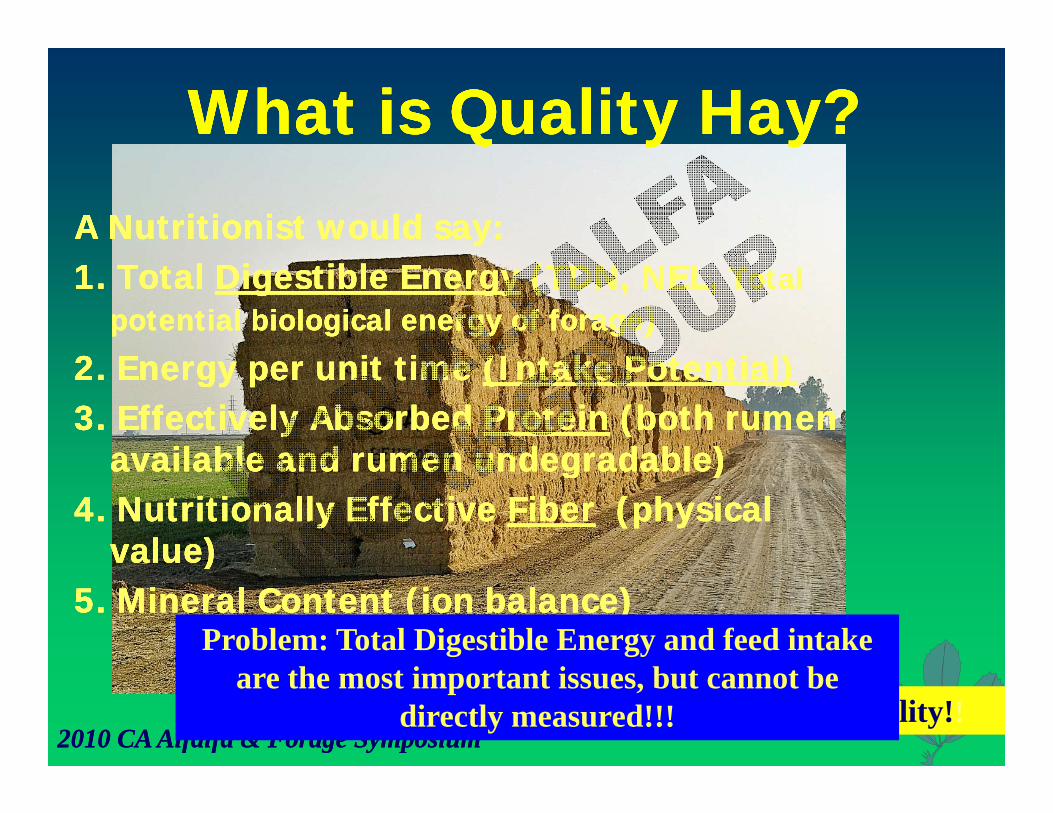
A NutritionistA Nutritionist would say:would say:A NutritionistA Nutritionist would say:would say:1. Total 1. Total Digestible EnergyDigestible Energy (TDN, NEL, (TDN, NEL, Total Total
potential biological energy of foragepotential biological energy of forage))2 E i i2 E i i (I k P i l)(I k P i l)
1. Total 1. Total Digestible EnergyDigestible Energy (TDN, NEL, (TDN, NEL, Total Total potential biological energy of foragepotential biological energy of forage))
2 E i i2 E i i (I k P i l)(I k P i l)2. Energy per unit time 2. Energy per unit time (Intake Potential)(Intake Potential)3. Effectively Absorbed 3. Effectively Absorbed ProteinProtein (both rumen (both rumen
available and rumenavailable and rumen undegradableundegradable))
2. Energy per unit time 2. Energy per unit time (Intake Potential)(Intake Potential)3. Effectively Absorbed 3. Effectively Absorbed ProteinProtein (both rumen (both rumen
available and rumenavailable and rumen undegradableundegradable))available and rumen available and rumen undegradableundegradable))4. Nutritionally Effective 4. Nutritionally Effective FiberFiber (physical (physical
value)value)
available and rumen available and rumen undegradableundegradable))4. Nutritionally Effective 4. Nutritionally Effective FiberFiber (physical (physical
value)value)value)value)5. Mineral Content (ion balance)5. Mineral Content (ion balance)
value)value)5. Mineral Content (ion balance)5. Mineral Content (ion balance)
Problem: Total Digestible Energy and feed intake
2010 CA Alfalfa & Forage Symposium2010 CA Alfalfa & Forage SymposiumMany Aspects of Quality!!
are the most important issues, but cannot be directly measured!!!

A i l P fA i l P fA i l P fA i l P fAnimal PerformanceAnimal Performance(True Feeding Value)(True Feeding Value)
Animal PerformanceAnimal Performance(True Feeding Value)(True Feeding Value)( g )( g )( g )( g )
Potential Forage Potential Forage Potential AnimalPotential AnimalPotential Forage Potential Forage Feeding ValueFeeding Value
SpeciesSpecies
Potential AnimalPotential AnimalPerformancePerformance
Species, BreedSpecies, BreedMaturityMaturity
Leaf/Stem RatioLeaf/Stem RatioWeeds, Climate, Soils,Weeds, Climate, Soils,
Genetics, Age, Sex, Genetics, Age, Sex, Stage of lactation, Stage of lactation,
Health, Climate, Health, Climate,
2010 CA Alfalfa & Forage Symposium2010 CA Alfalfa & Forage Symposium
Pests, Variety, etcPests, Variety, etc.. ManagementManagement

Forage Quality is MultiForage Quality is Multi--Forage Quality is MultiForage Quality is Multi--FacetedFacetedFacetedFaceted
Hi h C d P t iHi h C d P t iHigh Crude ProteinHigh Crude ProteinLow FiberLow FiberHigh Fiber DigestibilityHigh Fiber Digestibility
Hi h TDNHi h TDNHigh TDN High TDN Good mineral balanceGood mineral balanceNo WeedsNo Weeds
2010 CA Alfalfa & Forage Symposium2010 CA Alfalfa & Forage Symposium
Good texture/odorGood texture/odor

B tB tB tB tBut…But…But…But…
Does our marketing System Does our marketing System incorporate important aspects of incorporate important aspects of
Does our marketing System Does our marketing System incorporate important aspects of incorporate important aspects of p p pp p pquality?quality?
Is it subject to abuse?Is it subject to abuse?
p p pp p pquality?quality?
Is it subject to abuse?Is it subject to abuse? Is it subject to abuse?Is it subject to abuse? Is it subject to abuse?Is it subject to abuse?
2010 CA Alfalfa & Forage Symposium2010 CA Alfalfa & Forage Symposium

What is Hay Quality What is Hay Quality What is Hay Quality What is Hay Quality y Q yy Q yWorth?Worth?
y Q yy Q yWorth?Worth?
California markets more hay than California markets more hay than any other stateany other state
California markets more hay than California markets more hay than any other stateany other stateany other stateany other state
>95% of hay is bought, sold>95% of hay is bought, soldLik l >80% f h i t t d t l tLik l >80% f h i t t d t l t
any other stateany other state>95% of hay is bought, sold>95% of hay is bought, sold
Lik l >80% f h i t t d t l tLik l >80% f h i t t d t l t Likely >80% of hay is tested at least Likely >80% of hay is tested at least onceonce
Likely >80% of hay is tested at least Likely >80% of hay is tested at least onceonce
Fiber Based Marketing SystemFiber Based Marketing SystemDomestic: 95%, export <5%Domestic: 95%, export <5% Fiber Based Marketing SystemFiber Based Marketing SystemDomestic: 95%, export <5%Domestic: 95%, export <5%
2010 CA Alfalfa & Forage Symposium2010 CA Alfalfa & Forage Symposium
, p, p, p, p

Long-Term California Hay Prices (1999-2009, all markets)
$250.00
$200.00
$100 00
$150.00
Pric
e/To
n ($
)
$50 00
$100.00P
Supreme
Premium(US Inflation Rate)
$0.00
$50.00Good
Fair
(US Inflation Rate)
2010 CA Alfalfa & Forage Symposium2010 CA Alfalfa & Forage Symposium
$0.001998 1999 2000 2001 2002 2003 2004 2005 2006 2007 2008 2009 2010

TDN is Predicted from ADFTDN is Predicted from ADF
60TDN (90% dm)
57585960
{ ( %)}
GoodPremiumSupreme Fair
54555657 {TDN = 82.38 - (.7515 x ADF%)}
(x.9 for 90% DM)
51525354
5051
24 25 26 27 28 29 30 31 32 33 34 35
2010 CA Alfalfa & Forage Symposium2010 CA Alfalfa & Forage SymposiumPutnam & Tombaugh
ADF (100% dm)

RFV is calculated from RFV is calculated from NDF & ADFNDF & ADF
RFV is calculated from RFV is calculated from NDF & ADFNDF & ADFNDF & ADFNDF & ADFNDF & ADFNDF & ADF
Figure 6. RFV as a function of NDF (CA Data)(CA Data)
270
y = 20032x-1.3297
R2 = 0.992220
V
120
170RF
70
120
25 30 35 40 45 50 55
Although RFV is calculated from ADF and NDF, it can almost entirely be predicted from NDF alone.
2010 CA Alfalfa & Forage Symposium2010 CA Alfalfa & Forage Symposium
25 30 35 40 45 50 55
NDFRFV is essentially = NDF (Weiss, 2002)

$170
Influence of Quality on Alfalfa Hay Price- Ten Year Average, all California Markets, 2000-2009
$150
$160 Average Difference due to Quality: $46/tonAverage Difference per unit ADF: $6.14/unit %ADF
y = -5.816x + 309.1R² = 0.9987
$130
$140
$150
$120
$130
$/to
n
$100
$110 'Supreme' 'Premium' 'Good' 'Fair'
$80
$90 ADF (%)
[<34] [34-36] [36-40] [40-44]NDF (%)
[<27] [27-29] [29-32] [32-35]
2010 CA Alfalfa & Forage Symposium2010 CA Alfalfa & Forage Symposium
$70
[<34] [34 36] [36 40] [40 44]NDF (%)
(Ave. 13 reporting regions, approximate volume 6.5 - 7.5 million tons/year)

Does the FiberDoes the Fiber--Based Based Does the FiberDoes the Fiber--Based Based Marketing System Work?Marketing System Work?Marketing System Work?Marketing System Work? It works mostly, since low fiber It works mostly, since low fiber
hays are largely better in qualityhays are largely better in quality It works mostly, since low fiber It works mostly, since low fiber
hays are largely better in qualityhays are largely better in qualityDoes not incorporate other Does not incorporate other
analysis analysis Does not incorporate other Does not incorporate other
analysis analysis a a ys sa a ys sProne to AbusesProne to Abuses
a a ys sa a ys sProne to AbusesProne to Abuses
2010 CA Alfalfa & Forage Symposium2010 CA Alfalfa & Forage Symposium
Abuses of Current SystemAbuses of Current SystemAbuses of Current SystemAbuses of Current SystemAbuses of Current SystemAbuses of Current SystemAbuses of Current SystemAbuses of Current SystemDemanding Unrealistic Precision Demanding Unrealistic Precision
in lab testsin lab testsDemanding Unrealistic Precision Demanding Unrealistic Precision
in lab testsin lab testsin lab testsin lab testsArguments over a few tenths of a Arguments over a few tenths of a
i l b li l b l
in lab testsin lab testsArguments over a few tenths of a Arguments over a few tenths of a
i l b li l b lpercent in lab valuespercent in lab valuespercent in lab valuespercent in lab values
2010 CA Alfalfa & Forage Symposium2010 CA Alfalfa & Forage Symposium

CommonlyCommonly-- Observed Observed V i i i H T iV i i i H T i
CommonlyCommonly-- Observed Observed V i i i H T iV i i i H T iVariation in Hay Testing Variation in Hay Testing Variation in Hay Testing Variation in Hay Testing
Sampling Between Within LabsSampling Variation
Between Labs
Within Labs
Probe- Lab-Lab Run-RunProbeProbe
Lab Lab Run Run
ADF 3.0 - 8.0 0.7 - 3.0 0.3 - 1.6NDF 4.0 – 9.0 1.0 – 4.0 0.4 – 2.0CP 2 0 6 0 0 5 2 0 0 2 1 0CP 2.0 – 6.0 0.5 – 2.0 0.2 – 1.0TDN 2.0 – 6.0 0.3 – 2.0 0.2 – 1.5
2010 CA Alfalfa & Forage Symposium2010 CA Alfalfa & Forage SymposiumPutnam & Tombaugh

Abuses of Current SystemAbuses of Current SystemAbuses of Current SystemAbuses of Current SystemAbuses of Current SystemAbuses of Current SystemAbuses of Current SystemAbuses of Current SystemTaking a Poor SampleTaking a Poor Sample
F ll P P t lF ll P P t lTaking a Poor SampleTaking a Poor Sample
F ll P P t lF ll P P t l–– Follow Proper Protocols Follow Proper Protocols –– 20 cores, sampling protocols20 cores, sampling protocols–– Follow Proper Protocols Follow Proper Protocols –– 20 cores, sampling protocols20 cores, sampling protocols–– Certify your hay sampleCertify your hay sample–– Certify your hay sampleCertify your hay sample
2010 CA Alfalfa & Forage Symposium2010 CA Alfalfa & Forage Symposium

Variation Between cores Variation Between cores in a stackin a stack
( %d )
5960
TDN (90%dm)
575859
Mean:
545556 56.6
5354
1 3 5 7 9 11 13 15 17 19
2010 CA Alfalfa & Forage Symposium2010 CA Alfalfa & Forage SymposiumPutnam & Tombaugh
Pure alfalfa hay from a single ‘uniform’ stack, 20 separate cores from separate bales

The lab results are only as good as the sample.
2010 CA Alfalfa & Forage Symposium2010 CA Alfalfa & Forage Symposium

Abuses of Current SystemAbuses of Current SystemAbuses of Current SystemAbuses of Current SystemAbuses of Current SystemAbuses of Current SystemAbuses of Current SystemAbuses of Current SystemUse of a Single NumberUse of a Single Number
O h i ( ) TDN RFVO h i ( ) TDN RFVUse of a Single NumberUse of a Single Number
O h i ( ) TDN RFVO h i ( ) TDN RFV–– Overemphasis on (e.g.) TDN or RFV Overemphasis on (e.g.) TDN or RFV ignores protein, ignores protein, digestibiltydigestibilty, ash, or , ash, or other attributesother attributes
–– Overemphasis on (e.g.) TDN or RFV Overemphasis on (e.g.) TDN or RFV ignores protein, ignores protein, digestibiltydigestibilty, ash, or , ash, or other attributesother attributesother attributesother attributes
–– Important to incorporate visual Important to incorporate visual judgementjudgement
other attributesother attributes–– Important to incorporate visual Important to incorporate visual
judgementjudgementjudgementjudgementjudgementjudgement
2010 CA Alfalfa & Forage Symposium2010 CA Alfalfa & Forage Symposium
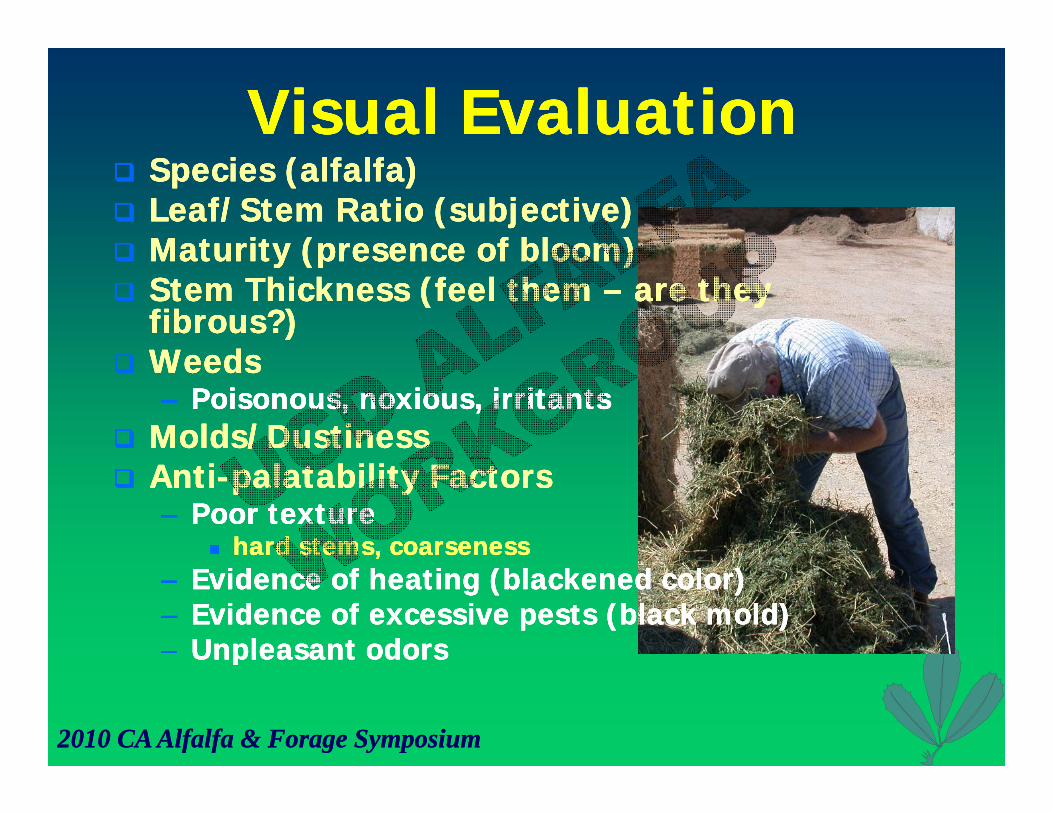
Visual EvaluationVisual EvaluationVisual EvaluationVisual Evaluation Species (alfalfa)Species (alfalfa) Leaf/Stem Ratio (subjective)Leaf/Stem Ratio (subjective) Maturity (presence of bloom)Maturity (presence of bloom)
Species (alfalfa)Species (alfalfa) Leaf/Stem Ratio (subjective)Leaf/Stem Ratio (subjective) Maturity (presence of bloom)Maturity (presence of bloom) Maturity (presence of bloom)Maturity (presence of bloom) Stem Thickness (feel them Stem Thickness (feel them –– are they are they
fibrous?)fibrous?) WeedsWeeds
Maturity (presence of bloom)Maturity (presence of bloom) Stem Thickness (feel them Stem Thickness (feel them –– are they are they
fibrous?)fibrous?) WeedsWeeds WeedsWeeds
–– Poisonous, noxious, irritantsPoisonous, noxious, irritants Molds/DustinessMolds/Dustiness
WeedsWeeds–– Poisonous, noxious, irritantsPoisonous, noxious, irritants
Molds/DustinessMolds/Dustiness AntiAnti--palatability Factorspalatability Factors
–– Poor texturePoor texture hard stems, coarsenesshard stems, coarseness
AntiAnti--palatability Factorspalatability Factors–– Poor texturePoor texture
hard stems, coarsenesshard stems, coarseness–– Evidence of heating (blackened color)Evidence of heating (blackened color)–– Evidence of excessive pests (black mold)Evidence of excessive pests (black mold)–– Unpleasant odorsUnpleasant odors
–– Evidence of heating (blackened color)Evidence of heating (blackened color)–– Evidence of excessive pests (black mold)Evidence of excessive pests (black mold)–– Unpleasant odorsUnpleasant odors
2010 CA Alfalfa & Forage Symposium2010 CA Alfalfa & Forage Symposium
pppp

Relative Reliability of Visual Relative Reliability of Visual Relative Reliability of Visual Relative Reliability of Visual Vs. Lab AnalysisVs. Lab AnalysisVs. Lab AnalysisVs. Lab Analysis
QUALITY FACTORQUALITY FACTOR VISUALVISUAL LABLABQUALITY FACTORQUALITY FACTOR VISUALVISUAL LABLABQUALITY FACTORQUALITY FACTOR VISUALVISUAL LABLABStage of MaturityStage of Maturity PoorPoor ExcellentExcellentLeafinessLeafiness FairFair ExcellentExcellent
QUALITY FACTORQUALITY FACTOR VISUALVISUAL LABLABStage of MaturityStage of Maturity PoorPoor ExcellentExcellentLeafinessLeafiness FairFair ExcellentExcellentLeafinessLeafiness FairFair ExcellentExcellentFiber Fiber PoorPoor ExcellentExcellentP t iP t i PP E ll tE ll t
LeafinessLeafiness FairFair ExcellentExcellentFiber Fiber PoorPoor ExcellentExcellentP t iP t i PP E ll tE ll tProtein Protein PoorPoor ExcellentExcellentMineralsMinerals PoorPoor ExcellentExcellentN i W dN i W d E ll tE ll t PP
Protein Protein PoorPoor ExcellentExcellentMineralsMinerals PoorPoor ExcellentExcellentN i W dN i W d E ll tE ll t PPNoxious WeedsNoxious Weeds ExcellentExcellent PoorPoorTexture/OdorTexture/Odor ExcellentExcellent PoorPoorNoxious WeedsNoxious Weeds ExcellentExcellent PoorPoorTexture/OdorTexture/Odor ExcellentExcellent PoorPoorRecommended: Use Visual Evaluation Plus
2010 CA Alfalfa & Forage Symposium2010 CA Alfalfa & Forage Symposium
Recommended Use V sual Evaluat on lusLab Analysis

Abuses of Current SystemAbuses of Current SystemAbuses of Current SystemAbuses of Current SystemAbuses of Current SystemAbuses of Current SystemAbuses of Current SystemAbuses of Current SystemEncouraging Lab BiasEncouraging Lab Bias
D bl Ch k L b BiD bl Ch k L b BiEncouraging Lab BiasEncouraging Lab Bias
D bl Ch k L b BiD bl Ch k L b Bi–– Double Check Lab BiasDouble Check Lab Bias–– Split Sample testsSplit Sample tests–– Double Check Lab BiasDouble Check Lab Bias–– Split Sample testsSplit Sample tests–– Reduce demandReduce demand--driven biasdriven bias–– Reduce demandReduce demand--driven biasdriven bias
2010 CA Alfalfa & Forage Symposium2010 CA Alfalfa & Forage Symposium

Variation BetweenVariation Between LabsLabs SplitSplitVariation BetweenVariation Between LabsLabs SplitSplitVariation Between Variation Between LabsLabs——Split Split Sample TrialSample Trial
Variation Between Variation Between LabsLabs——Split Split Sample TrialSample Trial
33343536
(A 30 5)
2930313233
DF
(%) (Ave=30.5)
2526272829
AD
(S D without outliers = 0 8 %)2425
1 2 3 4 5 6 7 8 9 10 11 12 13 14 15 16 17 18Lab Number
(S.D. without outliers 0.8 %)
2010 CA Alfalfa & Forage Symposium2010 CA Alfalfa & Forage Symposium
Lab Number
Putnam & Tombaugh

Abuses of Current SystemAbuses of Current SystemAbuses of Current SystemAbuses of Current SystemAbuses of Current SystemAbuses of Current SystemAbuses of Current SystemAbuses of Current SystemMisinterpreting Calculated ValuesMisinterpreting Calculated Values
R b RFV TDN RFQ NEL MER b RFV TDN RFQ NEL MEMisinterpreting Calculated ValuesMisinterpreting Calculated Values
R b RFV TDN RFQ NEL MER b RFV TDN RFQ NEL ME–– Remember, RFV, TDN, RFQ, NEL, ME Remember, RFV, TDN, RFQ, NEL, ME are all calculated valuesare all calculated valuesKnow the origins of theseKnow the origins of these
–– Remember, RFV, TDN, RFQ, NEL, ME Remember, RFV, TDN, RFQ, NEL, ME are all calculated valuesare all calculated valuesKnow the origins of theseKnow the origins of these–– Know the origins of these Know the origins of these calculations, since it can be confusingcalculations, since it can be confusingIf confusion persists refer to actualIf confusion persists refer to actual
–– Know the origins of these Know the origins of these calculations, since it can be confusingcalculations, since it can be confusingIf confusion persists refer to actualIf confusion persists refer to actual–– If confusion persists, refer to actual If confusion persists, refer to actual analyzed values.analyzed values.
–– If confusion persists, refer to actual If confusion persists, refer to actual analyzed values.analyzed values.
2010 CA Alfalfa & Forage Symposium2010 CA Alfalfa & Forage Symposium

Abuses of Current SystemAbuses of Current SystemAbuses of Current SystemAbuses of Current SystemAbuses of Current SystemAbuses of Current SystemAbuses of Current SystemAbuses of Current SystemMisinterpreting DM DataMisinterpreting DM Data
DM d t h ld b d t k t fDM d t h ld b d t k t fMisinterpreting DM DataMisinterpreting DM Data
DM d t h ld b d t k t fDM d t h ld b d t k t f–– DM data should be used to market for DM data should be used to market for YIELD, not for qualityYIELD, not for qualityALL forage analyses should be basedALL forage analyses should be based
–– DM data should be used to market for DM data should be used to market for YIELD, not for qualityYIELD, not for qualityALL forage analyses should be basedALL forage analyses should be based–– ALL forage analyses should be based ALL forage analyses should be based upon 100% DM data for NDF, ADF, upon 100% DM data for NDF, ADF, CP,CP, NDFdNDFd, etc., etc.
–– ALL forage analyses should be based ALL forage analyses should be based upon 100% DM data for NDF, ADF, upon 100% DM data for NDF, ADF, CP,CP, NDFdNDFd, etc., etc.CP, CP, NDFdNDFd, etc., etc.
–– High moisture High moisture –– look for mold or look for mold or other difficultiesother difficulties
CP, CP, NDFdNDFd, etc., etc.–– High moisture High moisture –– look for mold or look for mold or
other difficultiesother difficultiesother difficultiesother difficultiesother difficultiesother difficulties
2010 CA Alfalfa & Forage Symposium2010 CA Alfalfa & Forage Symposium

Abuses of Current SystemAbuses of Current SystemAbuses of Current SystemAbuses of Current SystemAbuses of Current SystemAbuses of Current SystemAbuses of Current SystemAbuses of Current System Failure to Consider Additional Failure to Consider Additional
Analyses which may be moreAnalyses which may be more Failure to Consider Additional Failure to Consider Additional
Analyses which may be moreAnalyses which may be moreAnalyses which may be more Analyses which may be more predictivepredictiveAnalyses which may be more Analyses which may be more predictivepredictive
2010 CA Alfalfa & Forage Symposium2010 CA Alfalfa & Forage Symposium

Intake:Intake:Intake:Intake:Intake:Intake:Intake:Intake:
Very Important to High Very Important to High Producing Dairy CowsProducing Dairy Cows
Very Important to High Very Important to High Producing Dairy CowsProducing Dairy Cowsg yg y
Less important to beef/nonLess important to beef/non--lactating cowslactating cows
g yg y Less important to beef/nonLess important to beef/non--
lactating cowslactating cowslactating cowslactating cowsPrediction difficultPrediction difficult
lactating cowslactating cowsPrediction difficultPrediction difficult
2010 CA Alfalfa & Forage Symposium2010 CA Alfalfa & Forage Symposium

What about Intake??
20
22
d)
16
18
take
(kg/
Multi - MF
12
14
Mat
ter I
nt Primi - MFMulti - HF
6
8
10
Dry
M
6-21 -14 -7 0 7 14 21 28
Time (Day Relative to Calving)
2010 CA Alfalfa & Forage Symposium2010 CA Alfalfa & Forage Symposium

Alfalfa’s Value in a Alfalfa’s Value in a R tiR tiRationRation
AlfalfaAlfalfa CornCorn BermudaBermudaAlfalfaAlfalfa CornCorn BermudaBermudaMilk kg/dayMilk kg/day 2323 2020 1818Concentrate (%)Concentrate (%) 3030 4545 6060( )( )Intake (kg/day)Intake (kg/day) 2424 2020 1919TDN (mix)TDN (mix) 6565 7272 7171Net Energy (NEL)Net Energy (NEL) 1.501.50 1.611.61 1.531.53TDN Intake (kg/d)TDN Intake (kg/d) 14.614.6 12.712.7 11.811.8Milk (kg)/Mcal NEMilk (kg)/Mcal NE 1.441.44 1.401.40 1.371.37(Data from Mertens, 1983)(Data from Mertens, 1983)
2010 CA Alfalfa & Forage Symposium2010 CA Alfalfa & Forage Symposium

The importance of time in The importance of time in ti ti i ldti ti i ldestimating energy yieldestimating energy yield
Timothy
ergy
ib
le E
ne
Alfalfa
Dig
esti
0 12 24 36 48
2010 CA Alfalfa & Forage Symposium2010 CA Alfalfa & Forage SymposiumHours of Fermentation0 12 24 36 48
(Adapted from Van Soest, 1995)

NDF DigestibilityNDF DigestibilityNDF DigestibilityNDF DigestibilityNDF DigestibilityNDF DigestibilityNDF DigestibilityNDF DigestibilityRELATIONSHIP BETWEEN ADF AND NDF DIGESTIBILITY
- 319 Samples, Western Hays
55
60
45
50
35
40
y = 0.0222x2 - 1.8041x + 77.565R 2 = 0.1285
3018 20 22 24 26 28 30 32 34 36 38 40
ADF
2010 CA Alfalfa & Forage Symposium2010 CA Alfalfa & Forage Symposium

Ash Content of AlfalfaAsh Content of AlfalfaAsh Content of AlfalfaAsh Content of Alfalfas Co te t o a as Co te t o a as Co te t o a as Co te t o a aRELATIONSHIP BETWEEN ADF AND ASH - 560 Western hay samples
24
20
22
24
y = 0.0538x + 10.089
R2 = 0.0128
14
16
18
10
12
6
8
18 23 28 33 38 43 48A DF ( %)
2010 CA Alfalfa & Forage Symposium2010 CA Alfalfa & Forage Symposium

PURPOSES OF HAY PURPOSES OF HAY TESTING:TESTING:
1) Formulate 1) Formulate 1) Formulate 1) Formulate RationsRations
2) D t i2) D t iRationsRations
2) D t i2) D t i2) Determine 2) Determine EconomicEconomic
2) Determine 2) Determine EconomicEconomicEconomic Economic WorthWorthEconomic Economic WorthWorth
2010 CA Alfalfa & Forage Symposium2010 CA Alfalfa & Forage SymposiumPutnam & Tombaugh, 2004

A fiberA fiber--based Market System:based Market System:A fiberA fiber--based Market System:based Market System:
EFFECT OF FIBER VALUE ON PRICE - Common Market Curve
$150
$120$130$140$150
(Area of Critical Concern)
A B C
$90$100$110$120
$/to
n
$60$70$80$90
TDN (CA equation, 90%DM):
$50$60
20 22 24 26 28 30 32 34 36 38
ADF
59.3 57.9 56.5 55.2 53.9 52.5 51.1 49.8
2010 CA Alfalfa & Forage Symposium2010 CA Alfalfa & Forage Symposium
ADF

H Q lit C tH Q lit C tH Q lit C tH Q lit C tHay Quality Concepts: Hay Quality Concepts: (evolution of predictive tools)(evolution of predictive tools)
Hay Quality Concepts: Hay Quality Concepts: (evolution of predictive tools)(evolution of predictive tools)
VisualVisualVisualVisual
ProximateProximateProximateProximate
RFV for marketing (Midwest)RFV for marketing (Midwest)
ADFADF TDN (N i i i /M k )TDN (N i i i /M k )
RFV for marketing (Midwest)RFV for marketing (Midwest)
ADFADF TDN (N i i i /M k )TDN (N i i i /M k )ADF ADF –– TDN (Nutritionists/Marketers)TDN (Nutritionists/Marketers)
S ti E ti i lS ti E ti i l
ADF ADF –– TDN (Nutritionists/Marketers)TDN (Nutritionists/Marketers)
S ti E ti i lS ti E ti i l
Major Question: Can Summative Equations be
2010 CA Alfalfa & Forage Symposium2010 CA Alfalfa & Forage Symposium
Summative Equations using many analysesSummative Equations using many analysesSummative Equations using many analysesSummative Equations using many analysesq
used for Marketing? RFQ?

STANDARD HAY TEST REPORT:Dry Matter Basis Dry Matter Basis
Lab Analysis ResultsLab Analysis Results11: : As As Rc’dRc’d 90%dm 100% dm90%dm 100% dmDry Matter (dm)Dry Matter (dm) 87%87% 90%90% 100%100%
Dry Matter Basis Dry Matter Basis Lab Analysis ResultsLab Analysis Results11: : As As Rc’dRc’d 90%dm 100% dm90%dm 100% dmDry Matter (dm)Dry Matter (dm) 87%87% 90%90% 100%100%Dry Matter (dm)Dry Matter (dm) 87%87% 90%90% 100%100%ADFADF 26.126.1 2828 31.031.0NDFNDF 33.533.5 34.734.7 38.538.5CPCP 17.417.4 18.018.0 20.020.0
Dry Matter (dm)Dry Matter (dm) 87%87% 90%90% 100%100%ADFADF 26.126.1 2828 31.031.0NDFNDF 33.533.5 34.734.7 38.538.5CPCP 17.417.4 18.018.0 20.020.0
Calculated ValuesCalculated Values22::TDNTDN 52.152.1 55.255.2 59.859.8NELNEL 0.530.53 0.550.55 0.610.61DDMDDM 57 057 0 59 059 0 65 565 5
Calculated ValuesCalculated Values22::TDNTDN 52.152.1 55.255.2 59.859.8NELNEL 0.530.53 0.550.55 0.610.61DDMDDM 57 057 0 59 059 0 65 565 5DDMDDM 57.057.0 59.059.0 65.565.5RFVRFV 150150CATEGORY:CATEGORY:Supreme (<27 ADF)Supreme (<27 ADF)
DDMDDM 57.057.0 59.059.0 65.565.5RFVRFV 150150CATEGORY:CATEGORY:Supreme (<27 ADF)Supreme (<27 ADF)Premium (27Premium (27--30 ADF)30 ADF)Good (29Good (29--32 ADF)32 ADF)Fair (32Fair (32--35 ADF)35 ADF)1. 1. A minimum of .5 percentage point variation is expected in lab resultsA minimum of .5 percentage point variation is expected in lab results
Premium (27Premium (27--30 ADF)30 ADF)Good (29Good (29--32 ADF)32 ADF)Fair (32Fair (32--35 ADF)35 ADF)1. 1. A minimum of .5 percentage point variation is expected in lab resultsA minimum of .5 percentage point variation is expected in lab results
2010 CA Alfalfa & Forage Symposium2010 CA Alfalfa & Forage Symposium
u o 5 pe ce tage po t a at o s e pected ab esu tsu o 5 pe ce tage po t a at o s e pected ab esu tsRFV = NFTA EquationRFV = NFTA Equation TDN = CA EquationTDN = CA Equation
u o 5 pe ce tage po t a at o s e pected ab esu tsu o 5 pe ce tage po t a at o s e pected ab esu tsRFV = NFTA EquationRFV = NFTA Equation TDN = CA EquationTDN = CA Equation

New Standard Hay Test:New Standard Hay Test:New Standard Hay Test:New Standard Hay Test:Core Hay Analysis:Core Hay Analysis:Core Hay Analysis:Core Hay Analysis:Core Hay Analysis:Core Hay Analysis: DM DM –– Not for quality Not for quality –– but for yieldbut for yield NDF NDF -- Neutral Detergent Neutral Detergent FiberFiber
Core Hay Analysis:Core Hay Analysis: DM DM –– Not for quality Not for quality –– but for yieldbut for yield NDF NDF -- Neutral Detergent Neutral Detergent FiberFiber CP CP -- Crude ProteinCrude Protein NDFdNDFd –– NDF digestibilityNDF digestibility AshAsh
CP CP -- Crude ProteinCrude Protein NDFdNDFd –– NDF digestibilityNDF digestibility AshAsh Ash Ash Additional Analyses:Additional Analyses: Lignin Lignin –– Many nutritionists value ligninMany nutritionists value lignin DCADDCAD CloseClose upup animalsanimals
Ash Ash Additional Analyses:Additional Analyses: Lignin Lignin –– Many nutritionists value ligninMany nutritionists value lignin DCADDCAD CloseClose upup animalsanimals DCAD DCAD –– Close Close up up animalsanimalsCalculate:Calculate: TDN, RFV, RFQ, Summative TDN, RFV, RFQ, Summative Energy Values, Energy Values, NEL, NEL,
RFVRFV RFQ etcRFQ etc
DCAD DCAD –– Close Close up up animalsanimalsCalculate:Calculate: TDN, RFV, RFQ, Summative TDN, RFV, RFQ, Summative Energy Values, Energy Values, NEL, NEL,
RFVRFV RFQ etcRFQ etcRFV, RFV, RFQ, etc.RFQ, etc.Emphasize:Emphasize: What is actually measured!What is actually measured!Remember:Remember: Only as good as the sampling procedureOnly as good as the sampling procedure
RFV, RFV, RFQ, etc.RFQ, etc.Emphasize:Emphasize: What is actually measured!What is actually measured!Remember:Remember: Only as good as the sampling procedureOnly as good as the sampling procedure
2010 CA Alfalfa & Forage Symposium2010 CA Alfalfa & Forage Symposium

What’s in a Forage Plant?Contribution to Energy
Non Fiber Carbohydrates (NSC)S S h P i
100% Dry Matterto Energy(TDN)
100%Sugars, Starches, Pectin
Crude
20-35%
CrudeProtein (soluble, bound)large
When ADF or NDF go up,
15-24%CP
30-50%Structural Carbohydrates (NDF)
(soluble bound)Some
Forage Quality goes down!NFC – Non Fiber
Carbohydrates need NDF 30 50%(soluble, bound)
Fat
ADF
100%
yseveral analyses
1-3%
NDF
2010 CA Alfalfa & Forage Symposium2010 CA Alfalfa & Forage Symposium
AshNone 5-12%
Marketing:Marketing:Marketing:Marketing:Marketing:Marketing:Marketing:Marketing:Use of NDF as the first Use of NDF as the first
approximation of qualityapproximation of qualityUse of NDF as the first Use of NDF as the first
approximation of qualityapproximation of qualityapproximation of qualityapproximation of qualityAdditional interpretation of Additional interpretation of NDFdNDFd, ,
CP d hCP d h
approximation of qualityapproximation of qualityAdditional interpretation of Additional interpretation of NDFdNDFd, ,
CP d hCP d hCP, and ashCP, and ashCP, and ashCP, and ash
2010 CA Alfalfa & Forage Symposium2010 CA Alfalfa & Forage Symposium

Summary:Summary:Summary:Summary:yyyy Quality is a complex trait, not conducive Quality is a complex trait, not conducive
to a single numberto a single numberib b d k i hilib b d k i hil
Quality is a complex trait, not conducive Quality is a complex trait, not conducive to a single numberto a single numberib b d k i hilib b d k i hil Fiber based marketing systems, while Fiber based marketing systems, while
simple and effective, are prone to several simple and effective, are prone to several abusesabuses
Fiber based marketing systems, while Fiber based marketing systems, while simple and effective, are prone to several simple and effective, are prone to several abusesabuses
Shifting Largely to:Shifting Largely to:–– Emphasis on NDF, Drop ADFEmphasis on NDF, Drop ADF
Use 100% DM valuesUse 100% DM values
Shifting Largely to:Shifting Largely to:–– Emphasis on NDF, Drop ADFEmphasis on NDF, Drop ADF
Use 100% DM valuesUse 100% DM values–– Use 100% DM valuesUse 100% DM values–– Incorporate Incorporate NDFdNDFd, Ash, Ash
Use calculated values (TDN, RFV, RFQ) Use calculated values (TDN, RFV, RFQ)
–– Use 100% DM valuesUse 100% DM values–– Incorporate Incorporate NDFdNDFd, Ash, Ash
Use calculated values (TDN, RFV, RFQ) Use calculated values (TDN, RFV, RFQ) ( , , Q)( , , Q)but know where they come from.but know where they come from.
Visual Evaluation still important.Visual Evaluation still important.
( , , Q)( , , Q)but know where they come from.but know where they come from.
Visual Evaluation still important.Visual Evaluation still important.
2010 CA Alfalfa & Forage Symposium2010 CA Alfalfa & Forage Symposium

2010 CA Alfalfa & Forage Symposium2010 CA Alfalfa & Forage Symposium Larry Teuber, photo