Peripheral nerve function – metabolic features, clinical - DiVA

1
DIPLOMARBEIT
Changes in the biological function of peripheral
mononuclear cells in diabetes mellitus - Pilot study
zur Erlangung des akademischen Grades
Doktorin der gesamten Heilkunde
(Dr. med.univ.)
an der
Medizinischen Universität Wien
ausgeführt am
Christian Doppler Labor für Herz- und Thoraxerkrankungen
Universitätsklinik für Innere Medizin III
unter der Anleitung von
Assoc. Prof. Univ.-Doz. Dr.med.univ. Hendrik Jan Ankersmit, MBA
Dr.med.univ. Matthias Zimmermann
eingereicht von
Elisabeth Maria Simader
0952125
Ort, Datum Unterschrift
_______________________ ___________________________

2
Inhalt
Danksagung ................................................................................................................................ 4
1 Abstract (English) ............................................................................................................... 5
2 Abstract (German) .............................................................................................................. 6
3 Background ......................................................................................................................... 7
3.1 Epidemiology ............................................................................................................... 7
3.2 Classification and diagnosis ........................................................................................ 8
3.2.1 Diagnostic threshold values .................................................................................... 9
3.2.2 Haemoglobin A1c ................................................................................................. 11
3.2.3 Symptoms and risk factors ................................................................................... 11
3.3 Pathogenesis .............................................................................................................. 15
3.3.1 Diabetes mellitus type 1 ....................................................................................... 15
3.3.2 Diabetes mellitus type 2 ....................................................................................... 17
3.3.3 Gestational diabetes mellitus (GDM) ................................................................... 18
3.3.4 Other causes of diabetes ....................................................................................... 19
3.4 Complications of Diabetes mellitus ........................................................................... 22
3.4.1 Hypoglycaemia ..................................................................................................... 22
3.4.2 Diabetic ketoacidosis ............................................................................................ 23
3.5 Treatment ................................................................................................................... 24
3.5.1 Physical examination and follow-up .................................................................... 25
3.5.2 Glycemic target values ......................................................................................... 26
3.5.3 Hypertension......................................................................................................... 27
3.5.4 Dyslipidemia......................................................................................................... 28
3.5.5 Cardiovascular disease ......................................................................................... 29
3.5.6 Diabetic nephropathy............................................................................................ 30
3.5.7 Treatment in diabetes mellitus type 1 ................................................................... 31
3.5.8 Medical therapy of diabetes mellitus type 2 ......................................................... 32
3.6 Diabetes and Inflammation ........................................................................................ 34
3.7 Peripheral mononuclear cells ..................................................................................... 34
3.8 Macrophage migration inhibitory factor (MIF) ......................................................... 35
3.9 hsCRP ........................................................................................................................ 37
3.10 MMP-9 ....................................................................................................................... 37
3.11 Tissue inhibitors of metalloproteinases (TIMP-1) ..................................................... 38
4 Materials and Methods ..................................................................................................... 39
3
4.1 Study design .............................................................................................................. 39
4.2 Aim of the Study ........................................................................................................ 39
4.3 Study population ........................................................................................................ 40
4.3.1 Inclusion criteria ................................................................................................... 40
4.3.2 Exclusion criteria .................................................................................................. 41
4.3.3 Ethical and legal aspects ....................................................................................... 41
4.4 Statistical methods ..................................................................................................... 41
4.5 Methods ..................................................................................................................... 41
4.5.1 PBMC separation.................................................................................................. 42
4.5.2 RNA purification and cDNA synthesis ................................................................ 42
4.5.3 Quantitative reverse transcriptase PCR (qPCR) ................................................... 43
4.5.4 Enzyme-linked immunosorbent assay (ELISA) ................................................... 44
5 Results ............................................................................................................................... 45
5.1 Serum levels of hsCRP are elevated in diabetic patients ........................................... 46
5.2 MIF expression is elevated PBMC of diabetic patients ............................................ 47
5.3 Protein levels of MIF in the serum and supernatant .................................................. 49
5.4 Protein levels of MMP-9 in the serum and supernatant ............................................ 51
5.5 Protein levels of TIMP-1 in the serum and supernatant ............................................ 53
6 Discussion ......................................................................................................................... 55
7 Figure legend .................................................................................................................... 58
8 Table Index ....................................................................................................................... 60
9 References ......................................................................................................................... 61
10 Abbreviations .................................................................................................................... 75
11 Curriculum Vitae .............................................................................................................. 78

4
Danksagung
An dieser Stelle möchte ich mich bei allen bedanken, die mich bei der Durchführung der
Diplomarbeit, sowohl methodisch, fachlich und persönlich unterstützt haben.
Mein besonderer Dank gilt Assoc. Prof. Univ.-Doz. Dr.med.univ. Hendrik Ankersmit, MBA,
ohne dessen persönliche, finanzielle und fachliche Unterstützung es diese Arbeit nicht geben
würde. Zudem möchte ich mich bei der Christian Doppler Gesellschaft für die Möglichkeit
der Realisierung dieser Arbeit im Rahmen des CD-Labors für Diagnose und Regeneration von
Herz- und Thoraxerkrankungen bedanken.
Besonders bedanken möchte ich mich bei Dr. Matthias Zimmermann, der mir sowohl das
Arbeiten im Labor, sowie das wissenschaftliche Arbeiten näher gebracht hat und sich auch für
Kleinigkeiten bei der Ausarbeitung immer für mich Zeit genommen hat.
Von Ao.Univ.-Prof. Dr.med.univ. Alois Geßl, habe ich gelernt nicht aufzugeben und er hat
mein Interesse für das Fach der Endokrinologie geweckt. Ich möchte mich hiermit herzlich
für die Unterstützung und Freude am wissenschaftlichen Arbeiten bedanken.
Ass.-Prof. Dr. Michael Mildner möchte ich ebenfalls für die Unterstützung bei der
Durchführung und dem Erlernen der labortechnischen Methoden bedanken, der sehr viel Zeit
in meine Experimente investiert hat.
Zum Schluss möchte ich mich noch herzlich für die Hilfe meiner Eltern und meiner Brüder
bedanken, sowie für die Unterstützung im Labor von Denise Traxler-Weidenauer, Lucian
Beer, und Andreas Mitterbauer welche mir mit Rat und Tat zur Seite standen. Vielen Dank,
dass ihr immer für mich da wart.

5
1 Abstract (English)
Diabetes is a potentially severe, metabolic disease affecting an increasing number of people
worldwide. The prevalence of diabetes is soaring from 177 million people in 2000 to
estimated 366 million in 2030. Diabetes is induced by a life-style of high-calorie nutrition,
genetic predisposition and a lack of physical activity, characterized by insulin resistance and
relatively impaired insulin secretion. Diabetes mellitus type 2 (DM 2), the most common form
appears to be one of the main risk factors for cardiovascular disease. Monocytes represent a
functionally important subpopulation of circulating leukocytes involved in local inflammatory
processes under physiological as well as pathological conditions. Patients suffering from
diabetes demonstrate multiple cellular and molecular alterations and defects, causing inter alia
impairments of wound healing, haemostasis and atherogenesis. Macrophage migration
inhibitory factor (MIF) was found to induce insulin secretion and therefore may play a role in
the pathogenesis of DM 2. Additionally, MIF induces destabilization of atherosclerotic
plaques and therefore may increase the risk for cardiovascular events. According to recent
studies matrix metalloproteinase-9 (MMP-9) leads to increased plaque instability, resulting in
stroke and myocardial infarction.
The aim of this study was the analysis of the altered function of peripheral blood
mononuclear cells (PBMCs) in patients with altered glucose homeostasis. Therefore, we
analysed MMP-9,its inhibitor, tissue inhibitor of metalloproteinases-1 (TIMP-1), MIF and
high sensitivity C-reactive protein (hsCRP) in serum und supernatant of patients' peripheral
blood mononuclear cells (PBMC) using quantitative real time PCR (qPCR) and enzyme
linked immunosorbent assay (ELISA) .
Results: The cardiovascular risk was tested with hsCRP serum concentration quantification in
the serum. Patients with newly diagnosed DM 2 (p=0.0004) and DM 2 under therapy
(p=0.0037), had significantly elevated hsCRP levels compared to the healthy control group.
However, the secreted MIF concentrations were increased exclusively after stimulation with
LPS in patients with initial diagnosis in contrast to healthy donors, indicating an altered
secretion pattern under inflammatory conditions. Further research has to be done, to reveal
whether the proinflammatory effects of MIF play an important role in the pathogenesis of DM
2.
6
2 Abstract (German)
Diabetes ist eine schwere, metabolische Erkrankung, mit steigender Anzahl an Betroffenen
weltweit. Die Prävalenz für Diabetes stiegt von 177 Millionen Menschen im Jahr 2000 bis zu
geschätzten 366 Millionen im Jahr 2030. Diabetes wird durch einen Lebensstil von
hochkalorischer Ernährung, genetischer Prädisposition und Bewegungsmangel induziert und
ist charakterisiert durch Insulinresistenz und gestörter Insulinsekretion. Diabetes Typ 2, die
häufigste Form erscheint als eine der Hauptrisikofaktoren für Erkrankungen des Herz-
Kreislaufsystems. Monozyten repräsentieren eine funktionell wichtige Subpopulation der
Leukozyten und sind in inflammatorischen, physiologischen, sowie pathologischen
Prozzessen involviert. Patienten, die an Diabetes leiden, zeigen multiple zelluläre und
molekulare Veränderungen und Defekte, welche u.a. Störungen der Wundheilung, Hämostase
und Atherogenese verursachen. Es konnte gezeigt werden, dass Macrophage Migration
Inhibitory Factor (MIF) die Insulinsekretion beeinflusst und daher auch eine Rolle in der
Pathogenese des Diabetes Mellitus Typ 2 (DM 2) spielen könnte. Nach einer aktuellen Studie
kann die Matrix Metalloproteinase-9 (MMP-9) und Inflammation zu einer erhöhten
Plaqueinstabilität führen, was zu Herzinfarkten und Schlaganfällen führt. Daher analysierten
wir MMP-9 und seinen Inhibitor, Tissue Inhibitor of Metalloproteinases-1(TIMP-1).
Das Ziel dieser Studie war die Analyse der veränderten Funktion von mononukleären Zellen
des peripheren Blutes (PBMCs) bei Patienten mit veränderter Glukose-Homöostase. Dafür
wurden MMP-9, TIMP-1, MIF und high sensitivity C-reactive protein (hsCRP) im Serum und
Überstand der PBMCs mittels enzyme linked immunosorbent assay (ELISA) gemessen.
Ergebnis: Das kardiovaskuläre Risiko wurde mittels hsCRP Serum-Konzentration
quantifiziert. Patienten mit neu diagnostiziertem DM 2 (p=0.0004) und Patienten mit
bekanntem, therapiertem DM 2 (p=0.0037), zeigten signifikant erhöhte hsCRP
Konzentrationen, im Vergleich zur Kontrollgruppe. Die MIF Konzentration im Überstand der
PBMCs stiegen bei den Patienten mit initialer Diagnose, allerdings nur nach Stimulation mit
LPS an. Was einen Hinweis auf ein verändertes Sekretionsverhalten in einem
inflammatorischen Umfeld geben kann. Allerdings sind weitere in vivo und in vitro Studien
notwendig, um zu beweisen, ob der proinflammatorische Effekt von MIF eine bedeutende
Rolle in der Pathogenese von DM 2 hat.

7
3 Background
3.1 Epidemiology
Diabetes is a collective term for a group of metabolic diseases with elevated blood glucose
with a soaring prevalence worldwide. [1] The different types of diabetes are characterized by
hyperglycemia, impaired insulin sensitivity or insulin secretion. [1] In 2010 the prevalence of
Diabetes was 284 million people globally, which implies 6.4% of the world population. [2]
Predictions for 2030 indicate an increase in the prevalence to an amount of 439 million people
suffering from this ailment, in other words 7.7% of the population worldwide. [2] As a
continually growing economic burden, the overall costs globally reached $376 billion in 2010.
[2] Especially the long-term effects of diabetes, such as myocardial infarction, chronic kidney
failure, blindness, lower limb amputation and stroke, constitute a rising financial and societal
issue. [2, 3] The prevalence of diabetes faces a new worldwide demography, with soaring
numbers (in a period of the last 25 years increase by the factor 3-5) in asian countries as
China, India, Korea, Thailand and Indonesia, depicting social change and all its implications.
[2] The most afflicted regions globally are North America (prevalence 10.2%), the Middle
East and North Africa (9.3%). [2]
According to the World Health Organisation in 2012 about 1,5 million people worldwide died
from diabetes. [3]

8
Fig. 3.1 Nature Outlook, Diabetes in numbers, Tony Scully et al. [4]
3.2 Classification and diagnosis
Diabetes can be divided into 4 major clinical classes according to their pathogenesis.
Type 1 is caused by the destruction of β-cells, due to auto-antibodies, creating
absolute insulin deficiency. [5, 6]
Type 2 is based on a progression of insulin secretion defects, originated by continually
increasing insulin resistance. [5, 6]
Type 3 is actually of multiple origins e.g dysfunction of exocrine pancreas, such as
cystic fibrosis, genetic deficiencies of the β-cells or drug-induced, for example after
cortisone treatment, organ transplantations or HIV treatment. [5, 6]
The last type is gestational diabetes (GDM), occurring during pregnancy and with a
possible aggravation and converting into a diabetes type 2. [5, 6]
Among the type 3 forms we find MODY (Maturity Onset Diabetes of the Young), which can
be subdivided in different types and LADA (Late onset Autoimmune Diabetes in the Adult).
These forms of diabetes will be discussed later in this thesis. Type 3 also combines forms of
diabetes induced by transplantations and cortisone. [6, 7]

9
3.2.1 Diagnostic threshold values
The diagnosis of diabetes mellitus may result from an elevated fasting plasma glucose of ≥
126 mg/dl (7.0 mmol/l), a random plasma glucose above 200 mg/dl (11.1 mmol/l), an oral
glucose tolerance test (OGTT), a test including measurement after the consumption of the
predefined amount of 75g glucose or a HbA1c ≥ 6.5%. [5, 7-9] if reproduced, the patient is
symptomatic. Another possibility is the combination of 2 tests for diagnosis. [6, 7]
3.2.1.1 Impaired fasting glucose
Patients with impaired fasting glucose (IFG), also referred to as „Prediabetes” are
characterised by fasting plasma glucose levels ranging from 100 to 125 mg/dl (5.6–6.9
mmol/l) or an impaired glucose tolerance displaying 2h-glucose levels of 144-199 mg/dl (7.8–
11.0 mmol/l) in an OGTT. Furthermore a HbA1c level from 5.7% up to a value of 6.4% also
represents a status of increased risk for developing diabetes mellitus. [3, 6-11]
3.2.1.2 Diagnosis of gestational diabetes mellitus
For the diagnosis of gestational diabetes much lower thresholds in blood glucose levels are
defined. The screening should be performed at 24-28 weeks of gestation. Two options for
accomplishing diagnosis of gestational diabetes mellitus (GDM) are verified and
recommended: [7, 12]
First the above mentioned OGTT with a 75g glucose uptake after at least 8 hours of fasting,
according to the IADPSG consensus should be performed. Contrary to diabetes mellitus type
2 (DM 2) the necessary plasma glucose levels for diagnosis are lower in GDM. Another
distinguishing feature is the importance of the plasma glucose level 1 hour after glucose
uptake. In DM 2 the 1 hour glucose is not part of the measurement, whereas in GDM it is
adequate for diagnosis in case of enhancement. Fasting plasma glucose ≥92 mg/dl (5.1
mmol), after 1 hour ≥180 mg/dl (10.0 mmol) and after 2 hours ≥ 153 mg/dl (8.5 mmol) are the
criteria for GDM diagnosis. The second option for revealing GDM, according to the NIH
consensus, is the „two step-test”. [7, 12, 13]
The screening for hyperglycaemia and gestational diabetes is proceeded using a two-step
process following the NIH guidelines, including a 1 hour and a 3 hour measurement or as an
alternative method a one-step screening recommended by the IADPSG consensus utilizing an
OGTT. [7, 14]

10
The one-step test is performed with an overnight fasting period of at least 8 hours, followed
by a 75-g oral glucose administration and consecutive measurements of the plasma sugar level
after 1 hour and 2 hours. The one step test is recommended by the IADPSG consensus.[14]
The diagnosis criteria for GDM are reached at following plasma levels [7]:
Fasting period: 92 mg/dL or (5.1 mmol/L)
After 1h: 180 mg/dL or (10.0 mmol/L)
After 2h: 153 mg/dL or (8.5 mmol/L)
These criteria are determined by the IADPSG consensus [7, 14]
Two-step test differs from the one step test in a few characteristics. First of all the patients do
not fast before the application of 50g glucose. If the plasma glucose level of ≥140mg/dL or
(7.8mmol/L) after 1 hour is attained, the second step should be implemented. The American
College of Obstetricians and Gynecologists (ACOG) advises those in charge of diabetes
during pregnancy to use a lower threshold of 135 mg/dL (7.5mmol/L) to avoid under-
diagnosis in ethnic minorities with higher prevalence of GDM. [7, 12, 15, 16]
The second step should be realized under fasting conditions. An OGTT with 100g glucose
administration should be conducted and GDM is considered verified, if the blood glucose
levels have attained the below stated thresholds. Two classifications can be distinguished:
Carpenter/Coustan and from the National Diabetes Data Group (NDDG). [7, 12, 16-18]
Carpenter/Coustan
Fasting: 95 mg/dL (5.3 mmol/L)
After 1 h: 180 mg/dL (10.0 mmol/L)
After 2 h: 155 mg/dL (8.6 mmol/L)
After 3 h: 140 mg/dL (7.8 mmol/L) [7, 12, 16-19]
NDDG
Fasting: 105 mg/dL (5.8 mmol/L)
After 1 h: 190 mg/dL (10.6 mmol/L)
After 2 h: 165 mg/dL (9.2 mmol/L)
After 3 h: 145 mg/dL (8.0 mmol/L)
According to the American Diabetes Association 2014, National Diabetes Data Group
(NDDG) and the NIH consensus [7, 12, 16-19]

11
Only one elevated value above the defined levels is adequate for diagnosis. Treatment of
GDM according to these low levels of glucose shows a beneficial effect on the large-for-
gestational-age (LGA) births. On the contrary the number of primary cesarean delivery could
not be decreased. The two-step alternative is commonly used in the United States of America,
whereas in Austria it is rarely used. [7, 13, 20].
3.2.2 Haemoglobin A1c
The haemoglobin A1c levels are the gold standard for the diagnosis of diabetes, due to
advantages as higher preanalytical stability and less fluctuations during stress and infections,
since it displays the average glucose level of the previous two to three months. This stability
is accomplished by the 120 day life-span of erythrocytes. [7, 21] Further benefits are the
reliability of HbA1c irrespective of fasting and patients' compliance. [7] Yet as every
advantage may carry a disadvantage, HbA1c levels are not reliable in case of haemolysis,
haemoglobinopathies, highly increased red blood cell turnover, pregnancy, blood transfusions,
massive bleeding and anaemia. [7, 21] Another detriment are the higher costs for analysis,
compared to fasting plasma glucose, thus it appears reasoned, that especially in developing
countries HbA1c is not widely used for diagnostics. On the other hand HbA1c has a lower
sensitivity as a fasting plasma glucose of ≤ 126 mg/dl. For final confirmation of the diagnosis,
the same test should be repeated on two different days. For example if the diagnosis is ensued
via random plasma glucose of > 200 mg/dl, a second measurement of the random plasma
glucose should be conducted on a different day. If the cut point has been exceeded for a
second time, the diagnosis is confirmed. An alternative option for diagnosis are two different
tests (e.g. HbA1c and fasting plasma glucose). If both exceed the threshold the diagnosis is
validated. [6-8]
3.2.3 Symptoms and risk factors
Especially in patients with DM 2, symptoms are quite vague (e.g. fatigue, polydipsia and
polyuria) and evolve over a long period of time, therefore most patients seek medical care at a
fulminate state with ketoacidosis or even after the appearance of long-term complications.
Recapitulating it can be said, that despite frequent screening many patients suffering from
diabetes remain still undiagnosed. [7]
Many studies analyzing the number of undiagnosed diabetes mellitus do not distinguish
between DM type 1 or type 2, therefore the following numbers do not differentiate between

12
the various types. Usually the asymptomatic period of time in DM 1 is shorter, than in
patients with DM 2. Due to the lack of insulin in DM 1 a fulminate disposal of symptoms can
be seen at the time of diagnosis, e.g. ketoacidosis. Whereas in DM 2 the hyperglycaemia
caused by insulin resistance is evolving gradually. Thus many people with type 2 remain
undiagnosed for years. [1, 22]
In 2013 according to the paper from Beagly et. al. [22] a total of 174,8 million people
worldwide were suffering from diabetes without diagnosis and therefore without any
treatment. There is a salient contrast in the allocation of undiagnosed diabetes (UDM). The
lowest percentage of UDM of all patients, has been shown in the middle income countries
South and Central America with 24.1%. The highest number of UDM was 75.1% in the low
income countries of Africa. These numbers are reflecting the inadequate screening frequency
or screening opportunities. Based on countries, the highest level of people suffering from
diabetes without diagnosis has been found in Tokelau with 20.5%. Second in line are the
Marshall Islands with a prevalence of UDM of 18.9% and 16.1% has been revealed in the
Federated States of Micronesia. The country displaying the lowest prevalence was Azerbaijan
with 0.8%. The 10 most under diagnosed countries are all pacific islands. The countries with
the highest total number (1000s) of UDM are first of all China with 53238.4 cases, ensued by
India exposing 31920.0. The third highest numbers of UDM in 1000s are exhibited by the
United States of America (6761.7), followed by Indonesia, the Russian Federation, Egypt,
Japan, Pakistan, Brazil and Germany. [22]

13
Map 3.4 Number of people (20-79 years) living with diabetes who are
undiagnosed, 2015
Fig. 3.1. International Diabetes Federation. IDF Diabetes Atlas, 7th edn. Brussels, Belgium: International Diabetes
Federation, 2015. http://www.diabetesatlas.org [11]
As a result the American Diabetes Association (ADA) recommends a screening in
asymptomatic persons with a Body mass index (BMI) of ≥ 25 kg/m2 and additionally
presenting one of the following risk factors: [7]
physical inactivity
a family history of diabetes (first-degree relative affected)
women with previously diagnosed gestational diabetes mellitus
high risk ethnicity
hypertension (defined as ≥ 140 systolic and ≥ 90 diastolic blood pressure) or treated
hypertension
patients suffering from polycystic ovarian syndrome
previous HbA1c, impaired glucose tolerance (IGT), or impaired fasting glucose (IFG)
above diagnostic threshold
patients with cardiovascular diseases [6, 7]
patients with conditions connected to diabetes e.g. acanthosis nigricans, dyslipidemia,
severe obesity, hypertension, polycystic ovarian syndrome [6, 7]
< 50 thousand
50 to 250 thousand
250 to 500 thousand
500 thousand to 5 million
5 to 10 million
> 10 million
IDF Diabetes Atlas · Seventh Edition
14
According to the American Diabetes Association 2014, [6, 7]
One of the main risk factors for diabetes mellitus is the metabolic syndrome, defined by
insulin resistance and at least 2 of the following criteria: Overweight with a waist/hip ratio of
> 0.90 in males and > 0.85 in females, or a BMI > 30 kg/m2; dyslipidemia with elevated
triglycerides ≥ 150mg/dL or HDL <35mg/dL (males), HDL< 39 mg/dL (females) and the last
criterion is hypertension ≥ 140/90 mmHg. This definition is based on the data of the World
Health Organization (WHO). [3, 23-26]
Another definition of the metabolic syndrome with glucose thresholds according to the
American Diabetes Association and the American Heart Association is the Adult Treatment
Panel III criteria (metabolic syndrome has been reached, if at least 3 criteria are met): a waist
circumference of > 102 cm in men and > 88 cm in women. Unlike in the previous definition a
threshold of a HDL cholesterol < 40 mg/dl in men and < 50 mg/dl in women, triglycerides
reaching a value of ≥ 150 mg/dl, an increased blood pressure ≥ 130 mmHg and ≥ 85 mmHg
and a fasting glucose level of ≥ 100 mg/dl. [26, 27]
Each of the mentioned criteria of the metabolic syndrome: impaired glucose tolerance,
obesity, hypertension, dyslipidemia and hypertension can act as separate risk factor. Genetic
predisposition may increase the risk of diabetes mellitus additionally. [28-30]
Individuals presenting a metabolic syndrome are facing a high risk of developing DM 2. The
combination of visceral obesity, elevated triglycerides, hypertension and impaired glucose
tolerance lead to insulin resistance producing a vicious circle.[31] Due to the insulin
resistance, high levels of insulin are secreted, producing the sensation of increased hunger,
leading to weight gain and obesity, further enhancing the insulin resistance. [31]
15
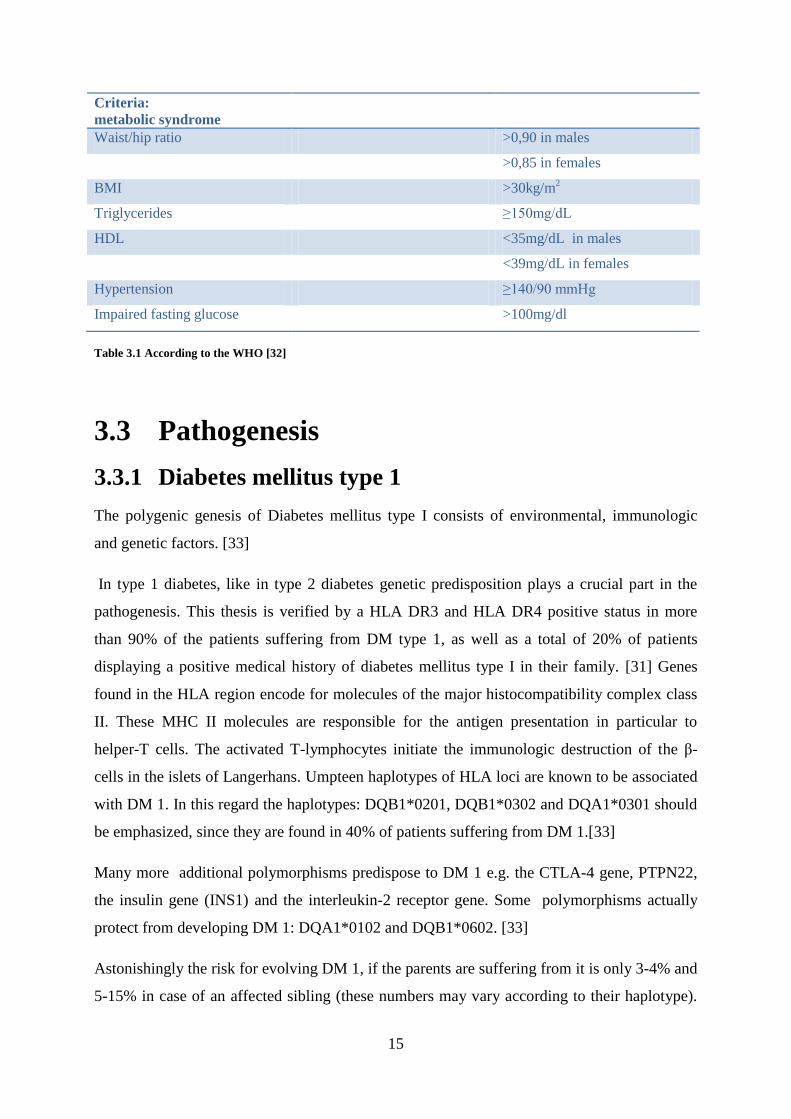
Criteria:
metabolic syndrome
Waist/hip ratio >0,90 in males
>0,85 in females
BMI >30kg/m2
Triglycerides ≥150mg/dL
HDL <35mg/dL in males
<39mg/dL in females
Hypertension ≥140/90 mmHg
Impaired fasting glucose >100mg/dl
Table 3.1 According to the WHO [32]
3.3 Pathogenesis
3.3.1 Diabetes mellitus type 1
The polygenic genesis of Diabetes mellitus type I consists of environmental, immunologic
and genetic factors. [33]
In type 1 diabetes, like in type 2 diabetes genetic predisposition plays a crucial part in the
pathogenesis. This thesis is verified by a HLA DR3 and HLA DR4 positive status in more
than 90% of the patients suffering from DM type 1, as well as a total of 20% of patients
displaying a positive medical history of diabetes mellitus type I in their family. [31] Genes
found in the HLA region encode for molecules of the major histocompatibility complex class
II. These MHC II molecules are responsible for the antigen presentation in particular to
helper-T cells. The activated T-lymphocytes initiate the immunologic destruction of the β-
cells in the islets of Langerhans. Umpteen haplotypes of HLA loci are known to be associated
with DM 1. In this regard the haplotypes: DQB1*0201, DQB1*0302 and DQA1*0301 should
be emphasized, since they are found in 40% of patients suffering from DM 1.[33]
Many more additional polymorphisms predispose to DM 1 e.g. the CTLA-4 gene, PTPN22,
the insulin gene (INS1) and the interleukin-2 receptor gene. Some polymorphisms actually
protect from developing DM 1: DQA1*0102 and DQB1*0602. [33]
Astonishingly the risk for evolving DM 1, if the parents are suffering from it is only 3-4% and
5-15% in case of an affected sibling (these numbers may vary according to their haplotype).

16
As the concordance in identical twins varies between 40-60%, additional triggers are
necessary for the outbreak of DM 1. [33]
The catalyst for the autoimmune process seems to be an environmental stimulus such as an
infection that activates the deterioration of the pancreatic β-cells. The course of time from the
trigger event until clinical symptoms and onset of diabetes may vary among individuals. This
aggravates the search for possible triggers, since the intermediate time may take years.[33]
Presumptive stimuli are bovine milk proteins, coxsackie virus, enteroviruses, rubella and
nitrosourea compounds, but also other early nutritional influences and caesarean section.[33]
From the immunologic aspect DM 1 is caused by primary destruction of β-cells in the
pancreas, due to autoimmune processes, resulting in a lack of insulin. [34] The process is
caused by infiltrating lymphocytes and referred as "Insulitis". Hyperglycaemia or overt
diabetes emerge, when the destruction of β-cells reaches dimensions of 70-80% and the
remaining cells cannot secrete the quantity of insulin necessary for the maintenance of
glycaemic homeostasis. The turnover point between impaired glucose tolerance and manifest
diabetes can be triggered by a stressful event requiring elevated insulin levels, for instance
infections or even puberty. After the initial appearance of DM 1 a period of good response to
small doses of insulin and in some cases even withdrawal of insulin applications can be
observed. This period is referred to as "honeymoon" phase with sufficient insulin secretion
activity of the temporarily recovering islet cells. With progressive deterioration of the β-cells
the demand of increasing insulin doses rises, until the endogenous production has vanished
and all cells are destroyed. At this state the inflammatory process stagnates and the
immunologic markers disperse. [33]
The autoimmune origin of DM 1 is further validated by the detection of the following
antibodies in newly diagnosed patients: [31]
Autoantibodies in DM 1 Antigen
Islet cell autoantibodies (ICA) Gangliosides
GADA Glutamic acid decarboxylase
IA-2 antibody Tyrosine phosphatase IA-2
Anti-insulin-autoantibodies (IAA) (Pro)Insulin
(ZnT-8) antibody β-cells-specific zinc transporter 8
Table 3.2 Adapted from Gerd Herold et al. [31]

17
The isolation of ICA is technically challenging, thus the analysis of GADA, IA-2A is more
common in daily clinical practice. The diagnostic value of GADA and IA-2A combined is
90%, ZnT-8 70% and ICA 80%. IAA is a more complex marker, due to its age dependence
and reaches a fluctuation range of 20-90%. In case of elevated GADA and IA-2 antibodies in
healthy patients with absence of any sign of hyperglycemia, the odds of developing DM 1 in
the following 5 years are about 20%. [31]
Effective trials in animal models deferring or inhibiting DM 1 by immunosuppression,
blockage of cytotoxic cytokines, promoting the resistance of the islet cells towards
destruction, selective T-lymphocyte subset deletion, were not successful in human
applications. [33] Yet patients treated with monoclonal CD3 antibodies, application of
glutamic acid decarboxylase and antibodies working on B-lymphocytes diminish the
abatement of C-peptide values. [33, 34]
3.3.2 Diabetes mellitus type 2
Diabetes mellitus type 2 (DM 2) is characterized by a polygenic origin, deteriorated by
environmental factors. [35] Interestingly, most diabetes predisposing polymorphisms so far
described in genome wide association studies appear to impair insulin production/secretion.
Typical environmental factors are a high calorie uptake and a sedentary lifestyle, implicating
a major lack of physical activity. [2] Patients with DM type 2 display a failure in the
secretion pattern of insulin, after glucose uptake, especially in the first phase of secretion,
postprandially. On the contrary the secretion of other secretagogue agents e.g. glucagon is not
impaired in patients with DM 2. Despite the hyperglycaemia constantly elevated glucagon
levels aggravate the postprandial hyperglycaemia. Furthermore the hyperglycaemia is
supported by the apoptosis of the β-cells, as soon as the apoptotic cells reach a total of 50%.
[7, 31, 36-38]
One potential source of this pancreatic β-cell failure is the insulin resistance of the muscle
and liver tissue, generating a demand for insulin exceeding far beyond physiological
proportions. A higher level of insulin secretion enhances the glucose flow into β-cells of the
pancreas. [35] To gain a sufficient insight in the pathogenesis of diabetes mellitus type 2 the
patterns of insulin and the secretion should be explained. As already indicated insulin is
created by the beta cells of the pancreas as preproinsulin, which is cleaved at the amino-
terminal peptide, resulting in proinsulin. [33] The so processed proinsulin and the finished
insulin resembles the insulin-like growth factors I and II (IGF). The IGFs are stimulated by
18
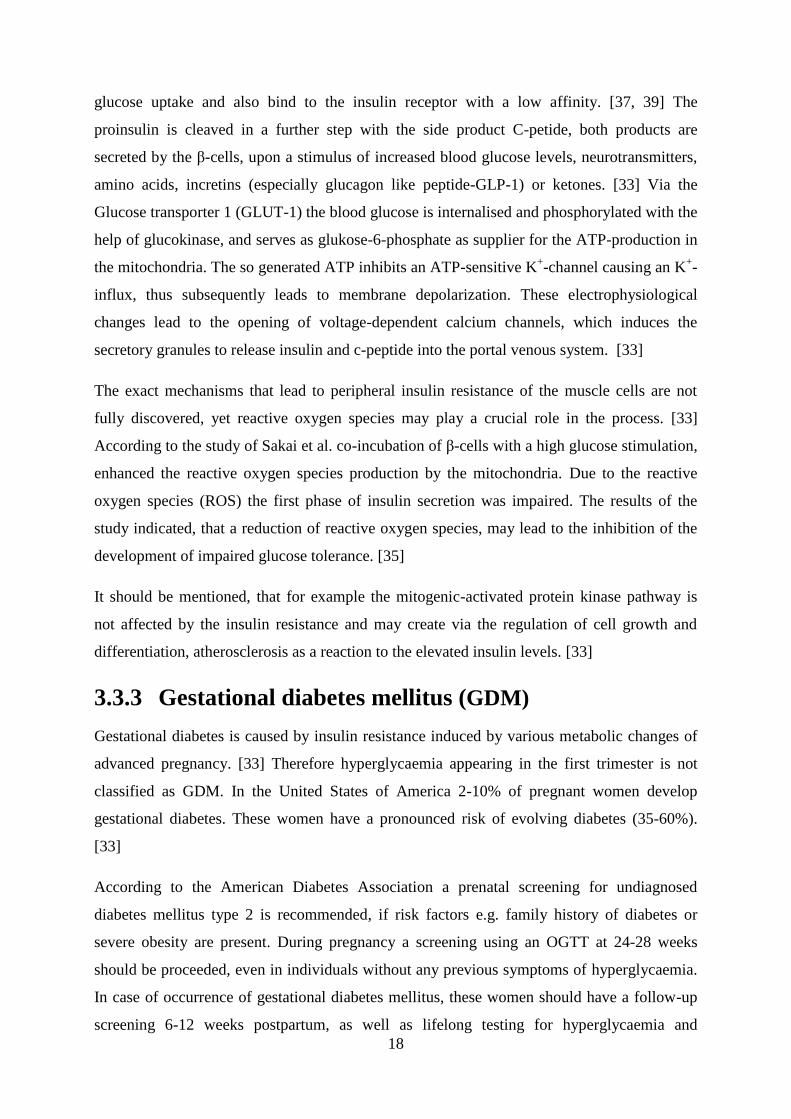
glucose uptake and also bind to the insulin receptor with a low affinity. [37, 39] The
proinsulin is cleaved in a further step with the side product C-petide, both products are
secreted by the β-cells, upon a stimulus of increased blood glucose levels, neurotransmitters,
amino acids, incretins (especially glucagon like peptide-GLP-1) or ketones. [33] Via the
Glucose transporter 1 (GLUT-1) the blood glucose is internalised and phosphorylated with the
help of glucokinase, and serves as glukose-6-phosphate as supplier for the ATP-production in
the mitochondria. The so generated ATP inhibits an ATP-sensitive K+-channel causing an K
+-
influx, thus subsequently leads to membrane depolarization. These electrophysiological
changes lead to the opening of voltage-dependent calcium channels, which induces the
secretory granules to release insulin and c-peptide into the portal venous system. [33]
The exact mechanisms that lead to peripheral insulin resistance of the muscle cells are not
fully discovered, yet reactive oxygen species may play a crucial role in the process. [33]
According to the study of Sakai et al. co-incubation of β-cells with a high glucose stimulation,
enhanced the reactive oxygen species production by the mitochondria. Due to the reactive
oxygen species (ROS) the first phase of insulin secretion was impaired. The results of the
study indicated, that a reduction of reactive oxygen species, may lead to the inhibition of the
development of impaired glucose tolerance. [35]
It should be mentioned, that for example the mitogenic-activated protein kinase pathway is
not affected by the insulin resistance and may create via the regulation of cell growth and
differentiation, atherosclerosis as a reaction to the elevated insulin levels. [33]
3.3.3 Gestational diabetes mellitus (GDM)
Gestational diabetes is caused by insulin resistance induced by various metabolic changes of
advanced pregnancy. [33] Therefore hyperglycaemia appearing in the first trimester is not
classified as GDM. In the United States of America 2-10% of pregnant women develop
gestational diabetes. These women have a pronounced risk of evolving diabetes (35-60%).
[33]
According to the American Diabetes Association a prenatal screening for undiagnosed
diabetes mellitus type 2 is recommended, if risk factors e.g. family history of diabetes or
severe obesity are present. During pregnancy a screening using an OGTT at 24-28 weeks
should be proceeded, even in individuals without any previous symptoms of hyperglycaemia.
In case of occurrence of gestational diabetes mellitus, these women should have a follow-up
screening 6-12 weeks postpartum, as well as lifelong testing for hyperglycaemia and

19
developing diabetes in a 3 year cycle. Patients with newly diagnosed diabetes mellitus during
the first trimester should not falsely be disclaimed as gestational diabetes, but classified as
diabetes mellitus type 2. [7]
The complications for patients with untreated GDM are for instance, large-for-gestational-age
(LGA), neonatal macrosomia or delivery difficulties e.g. shoulder dystocia. [7]
3.3.4 Other causes of diabetes
Additionally to DM 1, DM 2 and GDM, other manifold origins of diabetes exist and are
summarized as "Diabetes mellitus type 3". [7]
Genetic mutations leading to pancreatic β-cell dysfunction
o Defects in mitochondrial DNA
o Genetic variants coding for the protein subunits of the ATP-sensitive
potassium channel
o Mutations of insulin or proinsulin [33]
o Monogeneic mutations leading to MODY
Variants of MODY Mutation of
MODY 1 Hepatocyte nuclear transcription factor 4α
(HNF-4α)
MODY 2 Glukokinase
MODY 3 Hepatocyte nuclear transcription factor 1α
(HNF-1α)
MODY4 Insulin promoter factor-1 (IPF-1)
MODY 5 Hepatocyte nuclear transcription factor 1β
(HNF-1β)
MODY 6 NeuroD1
Table 3.3 Harrison's principles of internal medicine 18th edition volume 2 page 2968-3009 [33]
Impaired insulin action due to genetic variances of
o Type A insulin resistance
o Rabson-Mendenhall syndrome
o Leprechaunism
o Lypodystrophy syndromes

20
Dysfunction or illnesses of the pancreas
o Neoplasia
o Cystic fibrosis
o Pancreatitis
o Haemochromatosis
o Pancreatectomy
o Fibrocalculous pancreatopathy
o Genetically mutated carboxyl ester lipase
Endocrine diseases
o Cushing's syndrome
o Acromegaly
o Glucagonoma
o Phaeochromocytoma
o Hyperthyroidism
o Somatostatinoma
o Aldosteronoma
Iatrogenic-, chemical- or drug-induced DM
o Glucocorticoids
o Pentamidine
o Vacor (a rodenticide)
o Nicotinic acid
o β-adrenergic agonists
o Diazoxide
o Thiazides
o Hydantoins
o α-interferon
o Asparaginase
o Protease inhibitors
o Epinephrine
o Antipsychotics
Immune mediated

21
o Coxsackievirus
o Cytomegalievirus
o Congenital rubella
Genetic syndromes
o Down's syndrome
o Wolfram's syndrome
o Klinefelter's syndrome
o Turner's syndrome
o Huntigton's Chorea
o Friedreich's ataxia
o Laurence-Moon-Biedl syndrome
o Prader-Willi syndrome
o Porphyria
o Myotonic dystrophy
Adapted from the American Diabetes Association 2011 and Harrison's principles of internal
medicine 18th edition volume 2 [33, 40]
3.3.4.1 Maturity Onset Diabetes of the Young (MODY)
The six known variants of MODY originate from autosomal dominant, monogenic defects as
previously described in the Table 3.3 Harrison's principles of internal medicine 18th edition
volume 2 page 2968-3009 [33].The hepatocyte nuclear transcription factors, as the name
already implies, can be found in the liver, but beyond that also in the kidneys and the
pancreatic islets. There they may influence the development of the islet cells, affect the
insulin secretion or regulate the preservation of the β-cell mass. The mutation of HNF-1α
resulting in MODY 3 and a proceeding dysfunction of glycemic homeostasis similar to DM
type 1, yet in contrary to DM 1, patients with MODY 3 are responsive to sylfonylurea.
Patients suffering from MODY 5 (HNF-1β mutation) [31, 33]
3.3.4.2 Latent autoimmune diabetes of adults (LADA)
Patients with LADA typically present with signs of diabetes at the adult ranging from diabetic
ketoacidosis to mild non-insulin dependent diabetes. They typically rapidly require insulin
treatment and have fewer signs of the metabolic syndrome than adults with DM 2. The

22
diagnosis is made by laboratory test of islet cell autoantibody (ICA), glutamic acid
decarboxylase autoantibody (GADA), insulinoma-associated (IA-2) autoantibody, and zinc
transporter autoantibody (ZnT8) which are typically positive. LADA patients have similar
immunological and genetic characteristics as DM 1 patients and DM 2. Therefore it is
currently discussed whether LADA can be seen as a genetic admixture of the two forms for
diabetes. It is especially not known whether LADA reflects an distinct disease entity or is part
of an autoimmune continuum. [41, 42]
3.4 Complications of Diabetes mellitus
Patients suffering from diabetes mellitus type 2 display an increased risk for microvascular,
and macrovascular complications, myocardial infarction, sensory neuropathy, retinopathy,
stroke and an elevated all cause mortality, due to the constant hyperglycaemia. [43]
A stringent glycaemic control from the initial diagnosis onwards is essential for avoiding the
development of cardiovascular disease (CVD). According to the United Kingdom Prospective
Diabetes Study (UKPDS) intensive glycaemic control in initially diagnosed DM 2 patients
showed a decrease in CVD events in the long term (10-year follow-up after the end of the
study). The myocardial infarction rate could be reduced by 15% in the group treated with
sulfonylurea or insulin after initial diagnosis and 33% with metformin. [44] The mortality has
been diminished by 13% and 27% in the metformin group. [44] The UKPDS 35 trial with
4585 participants emphasizes the strong association of vascular complications to
hyperglycaemia by revealing that a reduction of HbA1c of 1% can diminish the deaths caused
by diabetes and its sequelae by 21%. [7, 44, 45]
3.4.1 Hypoglycaemia
When it comes to hypoglycaemia the most important aspect in the prevention is the patients'
awareness for symptoms of low blood glucose. If the hypoglycaemic episodes are
asymptomatic, the risk for serious neurological complications is higher, than in symptomatic
patients. With regard to this lack of symptoms the self-monitoring of blood glucose gains in
importance. The treatment of choice is 15-20g glucose or any kind of rapidly absorbable
carbohydrates, for example a piece of dextrose or a banana. After the consumption a blood
sugar measurement should be preceded. In case the low glucose level has not improved
another portion of carbohydrates should be consumed. In case the glucose level has improved,
a meal should be eaten by the diabetic patient, to avoid relapse of the hypoglycaemia. This

23
action is especially important to diminish ongoing insulin activity or in case the patient uses
insulin secretagogues. An alternative treatment recommendation of the American Diabetes
Association is the application of glucagon. Recurrent episodes of low blood glucose should
lead to a change in the treatment regimen. Severe hypoglycaemia and a high recurrence rate
bears a threat for the patient and also for the patients' environment, if they happen while
driving or operating of machines. Due to neurological damages patients exhibit a higher risk
for dementia and degradation in their cognitive function. Another consequence of recurrent
hypoglycaemic episodes is autonomic failure, leading to impaired hormone release and in
further consequence to deficient counter-regulation. Thus hypoglycaemia induces subsequent
hypoglycaemia. [7, 46, 47]
According to the American Diabetes Association and The Endocrine Society the definition of
a severe hypoglycaemia is an incident necessitating the assistance of another person. [7, 48]
In this regard children suffering from DM 1 and older people are especially vulnerable to this
condition. This may be also true as children are not capable of interpreting the symptoms
correctly and taking the right action in seeking help. These events make it necessary to change
the insulin application regimen, simplify it and if possible reduce the quantity of rapid-acting
insulin to a minimum. Further education of the patients in the correct use of insulin,
particularly in situations of decreased demand of insulin e.g. sports or fasting periods prior to
medical tests or interventions, is recommended. Alterations in the alimentary habits may also
play an important part in the avoidance of severe hypoglycaemia. Patients may eat a snack at
night to reduce nocturnal lowering of the glucose levels. Teaching of the patients to avoid
going to sleep beneath a certain glucose level threshold is equally important. [7, 48]
3.4.2 Diabetic ketoacidosis
Diabetic ketoacidosis is characterised by a hyperglycemic state, due to a relative or absolute
lack of insulin. The fulminate clinical ketoacidosis is depicted by a ketonemia and metabolic
acidosis. The characteristics for the diagnosis are a plasma glucose level of above 250mg/dl.
A decreased pH lower than 7.30 and a reduced serum bicarbonate level < 18 (mEq/L). Ketone
in the urine and the blood should be measured in every patient. The electrolytes and
biochemical derangement is also a typical sign of the diabetic ketoacidosis and especially in
the process of insulin-substitution it is essential to measure the K+-
levels, to avoid an
intracellular shift. An adequate fluid therapy is also of high importance. An aggravation of the
ketoacidosis leads to changes in the mental state of the patient, culminating in coma. Yet the

24
mortality in the diabetic ketoacidosis is mostly due to the co-morbidities or failure in insulin
dosage. Due to the widespread guidelines and knowledge in the treatment of the ketoacidosis
the mortality could be reduced to 17.3% in the US. [49-55]
3.5 Treatment
Diabetes care involves several clinical professions and the patients' environment, including
dietitians, physicians, dentists, nurses, in some cases mental health professionals and last but
not least the family of the patients. First of all I would like to emphasize the patients'
responsibility and involvement in the therapy, since there are comparatively few diseases,
where the patient is capable of influencing the outcome to such a high extent. The
deterioration or amelioration of the illness strongly depends on the patients' knowledge and
training in dealing with this ailment. DM 2 affords a high degree of patients' savoir faire and
diabetes self-management education (DSME). The most important example is the behaviour
during hypoglycemia, the ability of the patient to sense the symptoms, such as weakness,
sweating etc. and the adequate reaction to hypoglycemia with blood sugar measurement and
fast acting glucose uptake, avoidance of extensive physical activity or risky actions e.g.
driving. Equally important is the patients' capability to handle hyperglycemia and the
appropriate calculation of the necessary insulin dose. Life-style and dietary changes are a
necessity in the appropriate diabetes care, yet the work schedule, individual or cultural
patterns should be taken into consideration. Due to increased rates of infections among
diabetic patients, annual influenza vaccination is recommended, as well as a pneumococcal
polysaccharide immunization. Repeated vaccination makes sense, if the patients display
nephrotic syndrome, diabetic nephropathy or signs of a depleted immune system (e.g. induced
by immunosuppressive drugs). Clinicians should control the vaccination of hepatitis B either.
This recommendation is based on the fact that the prevalence of infected persons doubles in
the demographic population of diabetic patients, compared to the non-diabetic population.
The cause for this effect may be the characteristic, that the Hepatitis B Virus survives even in
old and dried blood stains and the higher risk for infection is induced by the wounds of
patients with DM 2 after blood glucose measurement. [56] The Vaccination of Influenza leads
to the diminution of hospitalizations of diabetic patients by 79%, in times of increased
incidences of influenza. [7, 57]
A substantial part for the adequate treatment is the self-monitoring of blood glucose (SMBG),
especially if the treatment consists of multiple-dose insulin applications or is administered

25
with the help of an insulin pump. Recommendations for the measurement of the blood sugar
level are given before ingestion, in case of an assumed hypoglycaemia or before demanding
physical activities. If hypoglycaemia has already taken place several measurements are
required until the blood sugar attains a normal level. Additionally nocturnal hypoglycaemia
can be averted by blood glucose measurement before going to sleep. Every once in a while
postprandial glucose levels should be measured. The blood sugar measuring of the patients
plays a crucial part in the treatment optimization, the patients' self management and the
avoidance of hypoglycaemic episodes. [7]
3.5.1 Physical examination and follow-up
3.5.1.1 Examination
The physical examination should include at least ambulatory recording of the body mass
index (BMI), therefore also weight and height. For cardiovascular risk factor calculation it is
also very important to measure the blood pressure on a regular basis. The thyroid function
should be observed by palpation and the TSH parameter, when it comes to patients with
dyslipidemia, DM type I and women aged 50 or older. To avoid discovering diabetic
retinopathy at a late stage an annual fundoscopic screening is recommended by the American
Diabetes Association (ADA). [7] Every person affected should have a nutritional consultation
at a specialized dietitian. A skin inspection should be proceeded on the one hand to control if
any lipohypertrophy occurred due to insulin injection or if signs of acanthosis nigricans are
visible. On the other hand special attention should be paid on the feet and their perfusion of
diabetic patients. Diabetic neuropathy, microvascular and macrovascular angiopathy
(peripheral artery disease) and a possible resulting wound healing disorder should be averted
by examining the dorsalis pedis as well as the posterior tibial pulse, achilles and patellar
reflexes, monofilament sensation, sensitivity for vibration and proprioception. [7]
Subsequent laboratory parameters should be monitored annually: triglycerides, LDL, HDL
cholesterol, liver function parameters to reveal any abnormality e.g. steatosis hepatis. To test
if any nephropathy is emerging the serum creatinine, albumin-to-creatinine ratio in the spot
urine and the calculated glomerular filtration rate (GFR) should be analyzed. The above
mentioned TSH and HbA1c, whereas the HbA1c is very important for planning the treatment
schedule and should not be older than 2-3 months. [7]

26
3.5.1.2 Anamnesis
First of all the question for the initial diagnosis is essential and provides a rich source of
further questions for the treatment schedule. If the initial diagnosis for a patient with DM 2
was 20 years ago the question for long-term complications has a different emphasis, than for a
middle-aged patient newly diagnosed with DM 2, 2 years ago. The age of the initial diagnosis
is equally important and the status of the auto antibodies in DM 1 or LADA or analysis for
gene mutations resulting in MODY. Of particular importance is the life-style of the patient in
concern of the alimentary habits, physical activity, BMI and any abnormality in the growth
pattern during childhood or adolescence. Another simple but important question is the
patients' education regarding his own disease and possible alimentary changes discussed with
a dietitian. The previous and current treatment is vital for the further treatment decisions,
especially when it comes to drug incompatibilities or insufficient therapies. The records of the
self-monitoring the patient's blood glucose and HbA1c notations are one of the most
informative basis for the choice of treatment schedule. Errors in therapy and their cause such
as diabetic ketoacidosis or hypoglycemic episodes should be assessed and the consciousness
for these blood glucose derailments inquired and promoted. The long term consequences and
complications enquired concerning microvascular, macrovascular (e.g. peripheral artery
disease), periodontal, autonomic dysfunctions for instance gastroparesis or erectile
dysfunction and psychosocial problems. [7]
3.5.2 Glycemic target values
According to the American Diabetes Association, for the treatment surveillance the HbA1c
and the plasma glucose are of particular significance for reaching an adequate metabolic
control and reduction of the risk factors for long term complications. [7]
As mentioned above the HbA1c should not be measured with a frequency less than 3 months.
Unless the patient is in a critical, unstable phase of its treatment, for instance pregnant women
suffering from type 1 diabetes. In patients displaying a good response to the therapy analysis
twice a year are sufficient. On the contrary in patients with inadequate response to therapy
HbA1c should be performed trimestrially. In patients vulnerable to strong fluctuations of
blood glucose values, the best approach for planning the treatment schedule is a combination
of HbA1c and self-monitoring of blood glucose (SMBG). In case of HbA1c levels are at
variance with the self measured blood glucose, the proper handling of the measurement
device should be validated or a haemoglobinopathy excluded. [7]

27
The glycemic goal for reduction of the likelihood of macrovascular complications in adults is
a HbA1c less or equal 7%. Exceptional cases with a target value of ≤ 8% HbA1c are patients
with severe hypoglycemic episodes in their anamnesis or already existing grave microvascular
and/or macrovascular complications, reduced life expectancy, poor general condition,
multiple diseases and long-lasting diabetes or insulin treatment. [7]
3.5.3 Hypertension
Patients showing an elevated blood pressure of more than 140 mmHg of systolic pressure and
more than 90 mmHg of diastolic pressure should be treated with changes in their lifestyle, as
well as pharmacological treatment. Control of blood pressure, especially in diabetic patients,
is an effective method to prevent long term complications, such as cardiovascular disease and
microvascular complications. Hypertension should be verified by measurement on two
separate days. If a White-Coat induced hypertension is suspected, a 24h blood pressure
monitoring may reveal the actual pressure levels. For correct measurements the adequate size
of the blood pressure cuff has to be chosen. The mentioned lifestyle alterations include
increased physical activity, weight loss, diminution of alcohol consumption, reduction of
sodium-uptake and increased potassium-uptake. Antihypertensive pharmacological therapy
should consist of an angiotensin-converting-enzyme (ACE) inhibitor, or alternatively an
angiotensin receptor blocker (ARB). Usually monotherapy is insufficient to reach the
recommended treatment goal of less than 140/80 mmHg. A meta-analysis comparing blood
pressure levels to DM 2 complications, revealed, that 130-135 of systolic pressure was
adequate. A more strict regulation of <130mmHg was associated with a lower rate of strokes,
a decrease of mortality of 10% and a later onset and slower aggravation of albuminuria. [7,
58] Multiple combinations are possible with β-blockers, calcium channel blockers or diuretic
agents and are verified to have a positive effect on the decrease of cardiovascular
complications. A pharmacological treatment of hypertension is usually based on changes in
electrolyte shifting and therefore a routinely control of potassium, the estimated glomerular
filtration rate and serum creatinine should be examined. [59] Pregnancy requires special
attention to the blood pressure, on the one hand due to contraindication of ARBs and ACE
inhibitors and on the other hand, due to the lower treatment aim of 110-129 mmHg systolic
pressure and 65-79 mmHg diastolic pressure. Alternatively to the ACE-inhibitors and the
ARBs, several pharmacological drugs such as diltiazem, methyldopa, clonidine, prazosin or
labetalol are indicated and verified as safe during pregnancy. The origin of hypertension
differs between the various types of diabetes. Whereas in DM 1 the elevated pressure levels

28
are a consequence of the diabetic nephropathy, in DM 2 the hypertension is usually part of a
multitude of cardiovascular risk factors associated with adiposity, high caloric and sodium-
rich alimentation and a lack of physical exercise. A systolic blood pressure exceeding
120mmHg may be a prognostic marker for end-stage renal disease, after years of DM 2. [7,
60-63]
3.5.4 Dyslipidemia
Patients with DM 2 display an increased risk in developing lipid abnormalities. Vice versa
many patients under statin therapy have a higher risk for evolving an impaired fasting glucose
or diabetes mellitus. [64, 65] According to a meta-analysis comparing 14 randomized studies,
including 18.000 patients, therapeutical use of a statin resulted in a 9% decrease of all-cause
mortality and 13% decrease in mortality caused by vascular complication, for every reduced
mmol/l. [7, 66] Once in a year a screening for elevated fasting lipids should be proceeded. In
patients with a low risk for dyslipidemia, displaying a lipid profile of HDL > 50, LDL < 100
and triglycerids <150 mg/dl, a screening rate of once in two years is sufficient. The first-line
therapy is a life-style modification of the patient. These changes in the habits of the patients
include weight loss, increased physical activity, diminution of trans fat, saturated fat and
cholesterol consumption. Alimentation should include a higher part of plant stenols, viscous
fiber, and n-3 fatty acids. [7] Statin therapy is indicated as second line therapy, after
insufficient amelioration after life-style changes. One exception is severe
hypertriglyceridemia, especially if the level is high enough to induce pancreatitis. Another
exception are diabetic patients with a history of a cardiovascular complication, or aged above
40 and additional risk factors of CVD. [7, 66-68]
The target goal for lipid levels in patients lacking any CVD in their medical history is a LDL
<100mg/dl. Patients with events of CVD in their history may benefit from a lower LDL level
of <70mg/dl. In case the target levels cannot be achieved with the highest dose tolerated by
the patient, a decrease of 30-40% from baseline levels are adequate. Triglyceride levels
should not exceed 150mg/dl. Yet the lipid therapy is based on the evaluation of LDL
cholesterol. A two-drug combination with a fibrate has failed to show additional effects on the
decrease of CVD. [69] Addition of fibrates or niacin to a statin therapy may decrease levels of
all lipid fractions, yet this positive effect has a high price of a relevantly elevated risk for
rhabdomyolysis, renal insufficiency and increased transaminase levels. [7, 10, 70, 71]

29
3.5.5 Cardiovascular disease
Prevention of cardiovascular disease in diabetic patients is way more important, than the
screening for it. Thus as above mentioned, the strict control of lipid-levels, hypertension,
smoking, albuminuria or other risk factors for complications of the cardiovascular system
(e.g. a positive family history of CVD) is of high priority. [7, 72] Cigarette smoking is one of
the major risk factors for developing cardiovascular complications, which induces further
development of risk factors. A study enrolled diabetic patients at initial diagnosis and
analysed the effects of smoking. Smoking cessation leads to improved metabolic parameters,
lower blood pressure levels and decreased albuminuria after 1 year. [73] After a myocardial
infarction the recommendation of the American Diabetes Association is a continuing β-
blocker therapy for 2 years, it may be prolonged, but 2 years are the minimum duration.
Screening for coronary artery disease in diabetic patients is recommended, if patients display
cardiac symptoms and/or pathological ECG. [7, 74]
3.5.5.1 Anticoagulant medication
Anticoagulant medication (e.g. Aspirin 75–162 mg/day or ThromboAss) is recommended for
diabetic patients displaying an elevated risk for CVD. The application of antiplatelet drugs
should be prescribed for patients with a 10 year risk of developing a CVD of more than 10%.
This indication adresses men over 50 years and women over 60 years with one or more risk
factors for complications of the cardiovascular system or an CVD event in their medical or
family history. Alternatively if aspirin is not tolerated, due to allergy or contraindications (e.g.
Reye-syndrome in patients under 21 years of age) clopidogrel is recommended. In case an
acute coronary syndrome has occurred, a dual antiplatelet drug application for one year
should be proceeded. Possible combinants are clopidogrel or ticagrelor, regardless of whether
a percutaneous coronary intervention was performed. Prasugrel is only indicated after
percutaneous coronary intervention of an acute coronary syndrome. The effect of a decreasing
cardiovascular mortality of aspirin as secondary prevention has been verified, yet the data for
a preventive indication for patients without CVD events are widely discussed. [7, 75, 76]
A meta-analysis of 6 studies combining a total of 95.000 participants (only 4000 diabetic
patients) revealed a 12% diminution in the risk for vascular complications (Antithrombotic
Trialists’ collaborators). An essential difference in the effect of antiplatelet therapy between
men and women was shown. Whereas aspirin was able to diminish CVD events in men, this
positive outcome was not valid for women. On the contrary the incidence of stroke was

30
reduced in the female study population, but not in the male participants.[75] Summarizing the
data, the most ferocious side effects of antiplatelet medication is gastrointestinal bleeding with
a prevalence of 1-5 out of 1000 patients. For patients with a risk higher than 1% for CVD, the
rate of averted CVD events equals or outweighs the possible bleedings, induced by
anticoagulant medication. According to an agreement of 2010 of the American Diabetes
Association, the American College of Cardiology Foundation and the American Heart
Association, a dose of 75–162 mg/day of aspirin is reasonable and adequate as primary
prevention for diabetic patients with a risk exceeding 10% for CVD events in 10 years, if they
lack any bleeding tendency. [7, 72, 76]
3.5.6 Diabetic nephropathy
The prevention or inhibiting of the aggravation of diabetes-induced nephropathy is closely
related to the blood glucose control and hypertension treatment. [10, 45, 60, 77, 78] The
screening for nephropathy is conducted with the albumin excretion in the urine. The
recommended screening test is the albumin-to-creatinine ratio in a random urine sample. [79,
80] The analysis of urinary albumin alone is vulnerable to measurement errors, due to
exsiccosis, hypertension, exercise within 24h prior to the evaluation, infections and resulting
fever and last but not least hyperglycaemia. It is crucial to test the albuminuria in every DM 2
patient, due to their long asymptomatic period prior to diagnosis and in every patient with DM
1 with a diabetic medical history of more than 5 years. Below a level of <30mg of
albuminuria in 24 hours, a medical therapy with neither angiotensin receptor blockers or ACE
inhibitors are indicated, as long as no hypertension is verifiable. In moderate albuminuria
ranging from >30mg to <300mg per 24h and severe albuminuria >300mg a pharmaceutical
therapy is recommended by the American Diabetes Association. The common definitions
"microalbuminuria" and "macroalbuminuria" are not mentioned on purpose, according to new
trends in medicine to avoid the intermittent character and emphasize the permanence of
elevated urinary albumin excretion. Adequate drugs are ACE inhibitors or ARBs, yet a
combination is not indicated, due to the higher risk of adverse events, that outnumber the
benefit of reduced rates of urinary albumin excretion. [81] Alternatively β-blockers, diuretics
or calcium channel blockers can be administered, if ACE inhibitors are contraindicated [7, 81-
87]
In case the origin of the kidney disease is not completely evidenced, or if aggravation
including possible dialysis takes place, an expert in nephrology should be consulted. A

31
permanent moderate albuminuria not exceeding 300mg per day is an accepted risk factor for
developing CVD and already considered as a mild form of nephropathy in patients suffering
from DM 1. [88-90] Yet unlike the common aggravation from an albuminuria of >300mg to
end-stage renal disease, patients with a moderate level of urine albumin excretion from 30-
299mg display an amelioration to normal renal function in nearly 40% of patients with DM 1.
Another 40% maintain at this level, without diminution of the kidney function at least for 5-
10 years. [7, 83, 91-95]
Stages of chronic kidney disease GFR (mL/min/1.73 m2 body
surface area)
Stage 1 ≥90 GFR
Stage 2 60–89
Stage 3 30–59
Stage 4 15–29
Stage 5 <15( kidney failure)
Table 3.4 Stages of chronic kidney disease, adapted from Levey et al. [7, 80]
3.5.7 Treatment in diabetes mellitus type 1
Most important for patients suffering from diabetes mellitus type 1 is the information and
training of the correct usage of basal and prandial insulin. Therefore it is crucial to measure
the blood glucose levels preprandially and acting accordingly. The Diabetes control and
complications trial (DCCT) highlights the necessity of strict glycemic control and insulin
application 3-4 times per day, or a continuous subcutaneous insulin infusion e.g. insulin
pumps. [96] The insulin application, if not given continuously should be divided in basal and
prandial insulin to simulate a nearly normal insulin secretion pattern of the pancreas, to the
highest possible level. To achieve this goal, a precise matching of preprandial glucose, insulin
dosage and food uptake/ consume of carbohydrates should be conducted. Of equal importance
is the adjustment of physical activity and also physical stress, such as febrile infections etc.
An injection rate of at least 3-4 times is recommended by the DCCT study to achieve
adequate glucose levels and a decrease in long term complications, especially microvascular
deficiencies. Yet the avoidance of hypoglycemia is of equal importance as a strict glycemic
control, therefore insulin analogues offer an important advantage, compared to conventional
insulin. When it comes to hypoglycemia the choice of the adequate insulin pump should
consider hypoglycemic patterns, e.g. nocturnal hypoglycemia, a lack of symptoms and

32
awareness of the patient for a low glucose level. In these cases a pump with a low glucose
sensor and a fixated treshold controlled release of insulin should be advised. [7, 96-98]
Comparing applications of insulin/insulin analogues and insulin pumps, no evident
differences in the HbA1c levels could be shown so far. [99] Yet when it comes to nocturnal
hypoglycemia a sensoring, threshold-suspended insulin pump can decrease the rate of
hypoglycemic episodes, whereas the achieved level of HbA1c does not differ significantly
from the values of patients using intensified insulin therapy [97]. Equally important is the
compliance and support of the patients' family. [7]
Due to the autoimmune aspect of DM 1 the screening for further diseases caused by
immunologic processes is eminently important. In this aspect a screening for autoimmune
processes of the thyroid, celiac disease and a lack of vitamin B12 is necessary, due to a strong
correlation in the prevalence of these diseases with DM 1 has been revealed. [7]
3.5.8 Medical therapy of diabetes mellitus type 2
According to the guidelines of the American Diabetes Association [6, 7] the basis for
pharmacological treatment of DM 2 is metformin. If no allergies or contraindications inhibit
the use of metformin, it is recommended as initial medication. Yet after the initial diagnosis of
symptomatic patients, displaying high glucose and HbA1c levels insulin therapy at the
beginning should be taken into consideration. In case Insulin therapy is not sufficient initially,
additional oral anti-diabetics can be added. [6, 7]
Metformin dosage should be increased in case the target goal of HbA1c cannot be achieved
within 3 months. In case the metformin therapy has reached the maximum and the treatment
goals are still not achieved, a second oral antidiabetic drug can be started e.g. sulfonylurea,
Thiazolidinedione or a DPP-4 inhibitor. Alternatively a GLP-1 receptor agonist, SGLT-2
inhibitors or insulin can be used as additional medication to metformin. Due to the
pathogenesis of DM 2 and the inevitable deterioration of insulin sensitivity and
hyperglycaemia, additional drug applications are quite inevitable. Therefore it is important to
ascertain the ideal combination of antidiabetics for every patient individually. This decision
should be based on the side effects, pharmacological characteristics, financial aspects, risk for
hypoglycaemia, possible weight loss and the individual risk for comorbidities and last but not
least the patients' personal preferences. In case the two drug combination is not leading to a
reduction in HbA1c, a change of the second agent, next to metformin is necessary. Every
class of antidiabetic medication (except for insulin) leads to an average HbA1c reduction of

33
0,9 to 1,1%. [100] In case a combination of metformin and all of the above mentioned drugs
fails in reaching the treatment goals, a three drug medication should be initialised. The
follow-up consultation should be realised every 3-6 months after changes in the drug
prescription. Should a three drug combination fail in lowering the plasma glucose to an
adequate level, a more complex insulin application schedule should be implemented. This
schedule is based on multiple insulin doses and a combination of basal insulin and a rapid
acting insulin. Optionally an additional oral antidiabetic agent can be added (or a GLP-1
receptor agonist). [6, 7, 100]
No matter which pharmacological agents the patients get, lifestyle changes, physical activity,
weight reduction (in case of obesity) and a healthy diet is recommended for every patient. In
order to achieve an effective change in the alimentary habits of the patients, a nutrition
counselling by a dietitian, conversant with diabetes is strongly recommended. Alcohol bears a
risk of delayed hypoglycaemic episodes for diabetic patients, thus the patients should be
informed about the consequents of alcohol. When it comes to physical activity the
recommendation for patients suffering from DM 2 is a weekly amount of 150 min of
moderate training, three days a week. The exercising routine should be constant with a
maximum of 2 days in a row without training. On average constant and structured exercise, if
performed for 8 consecutive weeks show a HbA1c reduction of 0,66%. [6, 7, 101]
Patients suffering from diabetes have a high rate of self management responsibility in coping
with their chronic disease. To guarantee an improvement in glucose levels and a reduction in
long term complication the psychosocial wellbeing is of high interest for the medical
management. Psychological and social problems as depression, financial problems, eating
disorders, support of the social environment and a handicap of the cognitive abilities should
be taken into consideration. For example 20-25% of diabetic patients suffer from depression,
which can raise the overall mortality.[7, 102-104] Diabetes as a chronic, life-long disease also
requires management of intermittent trauma, infections or surgery. Thus the treatment of
diabetes may be varied according to actual situations and be adapted to comorbidities or
iatrogen changes e.g. cortisone, which leads to hyperglycaemia. Febrile infections necessitate
an insulin adaption, as well as the fact that metformin should be paused prior to a surgical
intervention, due to the risk of ketoacidosis. The treatment regimen should be adapted in
situations of aggravated glycemic control (e.g. trauma) and the frequency of blood glucose
values, urine and blood ketone measurement should be increased in times of elevated physical
stress. Under the circumstances of illnesses, patients using solely oral antidiabetic agents may
34
need temporary insulin application. Special attention should be paid on the fluid in
hyperglycemic episodes. Dehydration and nonketotic hyperosmolar state during infections are
common reasons for hospitalization of patients with diabetes. [7]
3.6 Diabetes and Inflammation
As shown in previous studies, the murine and human adipose tissue contain a high number of
macrophages. These macrophages play a role in insulin resistance and the pathogenesis of
diabetes. [105-107] The macrophages as part of the innate immune system secrete tumor
necrosis factor-α (TNF-α) and interleukin-6 (IL-6), cytokines that have been proved, to
augment insulin resistance in adipocytes. [108-110] Taking the adaptive immune system into
consideration, a study in mice with absent T- or B-lymphocytes, severe combined
immunodeficiency (SCID), revealed that mice with impaired adaptive immune system
developed a decreased insulin sensitivity and diminished glucose tolerance, under high fat diet
and control diet either. Therefore also an effect on the glucose homeostasis can be identified,
as the lack of B- and T-lymphocytes could not inhibit the progression of impaired glucose
levels. [111] Oxidative stress also affects the development of insulin resistance and diabetes
mellitus type 2. [112] A study measuring the risk for diabetes, has revealed the association
between elevated markers of oxidative stress and DM 2. [113] MIF, as an inflammatory
cytokine may also play an important role in the evolvement of glucose intolerance as it is
involved in the glucose metabolism[114] [111, 113, 115-120] [121]
3.7 Peripheral mononuclear cells
Peripheral blood mononuclear cells (PBMCs) are a cell population demonstrating significant
importance in the immune system, consisting of monocytes and lymphocytes. Both
monocytes and lymphocytes play a crucial role in inflammation, particularly by secretion of
cytokines and chemokines affecting migration, vascular adhesion and coagulation. Monocytes
as an example secrete among various other cytokines interleukin-1 (IL-1), tumor necrosis
factor-α (TNF-α), activate multiple endothelial cells (promoting them to secrete adhesion
molecules like vascular cell adhesion molecule-1,VCAM-1) and immune cells by presenting
antigens to T-cells. Lymphocytes also activate other immune cells (for instance macrophages
with IFN-γ, granulocyte macrophage-colony stimulating factor GM-CSF or TNF-α), release
proinflammatory cytokines like interferon-γ (IFN-γ), tumor necrosis factor-α (TNF-α) and
IL-6 or cytotoxins produced by CD8 T-cells e.g. Perforin, Granzymes or Granulysin.

35
Activated PBMCs appear to be an important factor in the pathogenesis of various diseases,
such as atherosclerosis, asthma, diabetes, cancer and congestive heart failure. MIF is secreted
by monocytes, macrophages and among various others, even cells of the anterior pituitary
gland. MIF is a proinflammatory cytokine, that regulates the innate and adaptive immune
system and induces the activation of macrophages and T-lymphocytes. The stimulation of
MMPs is enhanced by inflammatory cytokines, such as tumor necrosis factor-α (TNF-α)
secreted by monocytes and macrophages. In a study of White et al. was shown, that PBMCs
regulated the expression of MID and MMP-9. The inhibition of MIF lead to lower levels of
MMP-9 expression. MMP-9 was also induced by IL-1β. [122-127]
3.8 Macrophage migration inhibitory factor
(MIF)
Macrophage migration inhibitory factor is a well-known pleiotropic actor of innate immunity.
The strong link to the glucose metabolism has been shown, in various studies. [127-130] On
the one hand a high glucose level leads to an enhanced MIF expression, on the other hand
MIF may contribute to the counter regulation by supporting the insulin secretion. This
mechanism may play a role especially at the beginning of the development of diabetes
mellitus, when the pancreatic beta cells start to fail, or an evolving insulin resistance demands
a higher level of insulin for maintaining sufficient values. MIF can be secreted by peripheral
mononuclear cells (PBMCs) and also from adipocytes, therefore a correlation between obesity
and increased MIF levels is not surprising. [129-135]
Due to the secretion by PBMCs the question how a subclinical, chronic activation of the
immune system effects the secretion patterns in diabetes mellitus, or if an additional
inflammatory impulse is necessary to release the full impact of MIF on the pathogenesis of
impaired fasting glucose and diabetes mellitus. Under physiological conditions, the regulation
of insulin secretion of MIF has no sign of pathology, yet under the circumstances of a chronic
systemic inflammatory environment and altered glucose levels, this enhanced insulin release
may lead to apoptosis of the pancreatic beta cells. [129, 136-140] Further questions arise
when it comes to cause and effect in concern to diabetes mellitus. Is the elevated MIF level
the cause or a consequence of diabetes mellitus. In a study with high-fructose diet for rats,
with the aim to induce impaired glucose homeostasis, the analysed systemic MIF levels in the
plasma depicted a trend to higher concentrations and significantly higher levels in the adipose
tissue of the fructose-fed animals. [127-136]

36
In the study of Herder et al. investigating the study population of KORA Augsburg, a cox
proportional hazard model revealed a correlation of an increased risk for diabetes mellitus
type 2 and systemic MIF levels in women. However this effect could not be seen in the male
population, actually the opposite was the case. [128, 129, 134]
MIF plays a crucial role in inflammatory pathologies such as sepsis, various types of cancer
and diseases with autoimmune origin. [141, 142] MIF has a strong impact on the cell
migration by binding to the receptor CD74 and regulates TNF-α and interferon γ and acts
through this pathway as a proinflammatory cytokine. In combination with glucocorticoids,
MIF is even able to adhere their antiinflammatory effect. Ironically MIF is induced by low
levels of glucocorticoids. [133, 141-145]
MIF is also associated with multiple complex coronary lesions. The study from Hao et al.
compared MIF serum levels from patients with simple and complex coronary lesions. The
lesions were angiographically verified and a total of 308 participants were enrolled. The
conclusion of the study was a significantly higher concentration of MIF in the patients
displaying complex lesions. The study population with stable angina pectoris presented higher
MIF serum values than the healthy control group. This may indicate a role of inflammatory
markers (MIF) in plaque instability and vulnerability in plaque rupture. [146, 147]
MIF is also a strong regulator of proinflammatory cytokines, such as MCP-1, TNF-α
VCAM1, IL-6, ICAM1 and MCP-1. These cytokines additionally play a role in the genesis of
and destabilization of atherosclerotic plaques. The possible coherence of MIF and
atherosclerotic plaques was also basis for the research of Sun et.al.. He induced diabetes in
apolipoprotein E-deficient mice with streptozotocin, a drug used in the therapy of insulinoma.
One third of the diabetic mice received an adenovirus-mediated MIF interference injection,
another third Ad-enhanced green fluorescent protein (EGFP) injections and the last third was
the diabetic control group and injections of normal saline were applied. A group without
induction of diabetes made up the control group. After the sacrifice of the mice, the plaque
measurements were controlled in the histological The results in the MIF-gene silenced mice
showed a decrease in the ratio of the plaque area/total cross sectional are of the vessel wall
compared to the control group in the aortic root, as well as the abdominal aorta and the carotid
artery. [148] Thus MIF might play an important role in the development of plaques, when it
comes to diabetic patients. Furthermore the plaque instability index was diminished (Oil Red
O+ area plus MAC+ area)/(a-SMA+ area plus collagen I+ area) significantly in the mice after
the gene silencing of MIF and the Collagen I/III ratio was reduced. [148] Summarizing it can

37
be said, that in the MIF-gene silenced mice, formation of atherosclerotic plaques was
evidently reduced and the plaques were stabilized, due to the diminution of inflammatory
cytokines usually induced by MIF. [147, 148]
3.9 hsCRP
hsCRP is an inflammatory marker, that indicates the cardiovascular risk of patients, similar to
known risk factors, for example as mentioned above hypertension and dyslipidemia. [149,
150]
The origin of atherosclerotic plaques and thrombosis is not restricted to the haemostasis and
thrombotic system. The immune system and in this context especially the mononuclear cells,
the secreted cytokines and the vessel endothelium play an important part in the development
of atherosclerotic lesions. [151] The risk for cardiovascular events, such as myocardial
infarction and stroke is linked to changes in the immune system and the secretion patterns of
mononuclear cells and these distinctions are not fully discovered yet. The marker hsCRP is
used in the clinical daily routine for the probability assessment in primary prevention
confirming the indication for the start of statin therapy in the US. [152] A study by Ridker et
al. revealed, that the chronic low-grade inflammation plays a role in the cardiovascular rsik
and is detected by hsCRP. Aspirin with its antiinflammatory effect, may reduce the vascular
event risk not only via the anticoagulant effect, but by the reduction of the inflammation.
[153] The marker hsCRP is more specific for plaque instability and thromboembolic events,
than to the mere presence of atherosclerosis. The predictive value is comparable to LDL
cholesterol. [149, 152, 154]
3.10 MMP-9
Matrix Metalloproteinases (MMP) are endopeptidases with a total of 24 known, various
subtypes. To avoid uncontrolled cleavage, most MMPs circulate in the vascular system as
inactive proMMPs. An activation is necessary after the secretion. The stimulation of MMPs is
enhanced by inflammatory cytokines, such as tumor necrosis factor-α (TNF-α) secreted by
monocytes and macrophages. As a result the cleavage of extracellular matrix is induced by the
stimulated MMPs, leading to elevated migration of inflammatory cells into the vascular vessel
wall and vascular tissue. Therefore MMPs play a crucial part in the vascular remodelling in an
inflammatory environment. [126, 155, 156]

38
3.11 Tissue inhibitors of metalloproteinases
(TIMP-1)
The main function of the tissue inhibitors of the metalloproteinases (TIMPs) is the regulation
of the, as the name already indicates, matrix metalloproteinases and disintegrin
metalloproteinases (ADAMS) or disintegrin metalloproteinases with thrombospondin motifs
(ADAMTS) in the remodelling processes of the extracellular matrix. Aside from this main
task TIMPs play a role as signaling molecules. In the last decades more and more functions of
the TIMPs have been discovered, among them apoptosis, carcinogenic effects, angiogenesis
and cell growth. These regulatory effects are implemented by a cytokine-like behaviour of the
TIMPs and binding to specific receptors. Four different types of TIMPs, are established in the
literature (TIMP-1, TIMP-2, TIMP-3, TIMP-4). From these TIMP-1 and TIMP-2 are the most
conversant proteins. [157-161] TIMP-1 exists in a soluble form and also as a cell surface
protein. TIMP-1 was able to induce cell growth in multiple cell lines, e.g. fibroblasts,
epithelial cells, keratinocytes, chondrocytes and various cancer cell lines. TIMP-1 was
discovered to be elevated in patients with heart failure and also rising with disease
aggravation, indicating a possible utility as biomarker for disease severity. Increased levels of
TIMP-1 were also found in patients with ischemic heart failure. [162] [163]

39
4 Materials and Methods
4.1 Study design
The study was conducted as a double centre explorative basic science pilot-study. The
contributing centres were the Department of Endocrinology, division of Internal Medicine III,
of the Medical University of Vienna and the "Wiener Gebietskrankenkasse-
Gesundheitszentrum Wien-Süd" (WGKK). Additionally Dr. Maria Gremmel was informing
patients about the opportunity of the study at the Department of Endocrinology, division of
Internal Medicine. The rationale of the study was to evaluate changes in gene expression and
cytokine secretion pattern in peripheral blood mononuclear cells (PBMCs) in patients with
impaired fasting glucose, patients with fulminate diabetes mellitus type 2 under therapy,
patients at initial diagnosis without therapy and healthy volunteers. Ethical approval from the
institutional review board on human research of the Medical University of Vienna was
obtained (Voting Nr. 1510/2013).
The laboratory work and scientific measurements were performed at the Department of
Surgery (surgical research facilities) of the Medical University of Vienna and with the support
of the Christian Doppler Laboratory for Diagnosis and Regeneration of Cardiac and Thoracic
diseases.
4.2 Aim of the Study
The aims of this study were:
(a) the analysis of changes in the physiological function, gene expression and secretion
pattern of PBMCs in patients with diabetes
(b) the identification of possible correlations with disease severity.
Fibrinolytic dysfunction mediates the increased risk of coronary artery disease in individuals
with metabolic syndrome [164, 165]. Adipose tissue induces thrombocyte activation by the
production of adipokines, of which some, such as leptin and adiponectin have been shown to
directly interfere with platelet function. Increased adipose tissue mass induces insulin
resistance and systemic low-grade inflammation, also affecting platelet function [164-166].

40
Beside cells of the adipose tissue, circulating mononuclear cells seem to contribute to
enhanced coagulation in diabetic patients as well. Changes in insulin or blood glucose levels
may result in a pro-inflammatory phenotype and altered secretion patterns of PBMCs.
However cross-talk between platelets and monocytes is now regarded as a crucial
pathophysiological mechanism linking thrombosis and inflammation. In vitro studies show
that formation of monocyte-platelet aggregates increases cytokine and prostanoid production
by monocytes [166]. According to the data of a recently conducted study of our research
group, we hypothesized that the secretory product of PBMCs was underestimated in disease
development by inducing hepatic insulin resistance as well as in formation of
hypercoagulability in diabetic patients. Altered synthesis of soluble factors affecting
coagulation, fibrinolysis and vascular endothelium seemed to play a crucial role in the
prothrombotic state observed in obese and diabetic patients.
4.3 Study population
Blood samples (2 heparin-tubes and 1 serum-tube, each containing 9ml) were collected during
routine consultation. Patients’ history, demographics and diagnostic criteria of diabetes,
plasma glucose and current treatment were obtained from their clinical record.
4.3.1 Inclusion criteria
Group 1 (n=11): Patients with initially diagnosed type 2 diabetes without therapy (fasting
plasma glucose ≥ 126mg/dl and/or two-hour plasma glucose ≥ 200mg/dL during an oral
glucose-tolerance-test (OGTT) and/or hemoglobin A1C ≥ 6.5%)
Group 2 (n=15): Patients with diagnosed type 2 diabetes (hemoglobin A1C ≥ 6.5%) under
therapy (oral antidiabetic drugs / insulin / analogues)
Group 3 (n=13): Patients with an impaired fasting glucose (IFG) or impaired glucose
tolerance (IGT) (fasting plasma glucose 100mg/dl to 125mg/dl and/or two-hour plasma
glucose 140mg/dl to 199mg/dl during an OGTT)
Group 4 (n=15): Insulin sensitive patients (fasting plasma glucose < 100mg/dl and/or two-
hour plasma glucose < 140mg/dl during an OGTT)

41
4.3.2 Exclusion criteria
Patients with leukocytosis or leucopenia, chronic inflammatory diseases, acute infection,
tumor or malignant neoplasm in the last 5 years, pregnancy, chronic cardiac insufficiency,
peripheral arterial disease and unstable angina pectoris could not be included in the study.
4.3.3 Ethical and legal aspects
4.3.3.1 Risks
The expected risk for the healthy volunteers involved in the study was considered as minimal.
Blood was drawn by standard procedure. Possible adverse effects from the venipuncture were
local hematomas, redness, pain and infection.
4.3.3.2 Protection of data privacy
All data obtained from the subjects in this study were handled with care and were not passed
to a third person. Every subject was given a unique code to ensure the protection of personal
data sample evaluation.
4.3.3.3 Written informed consent
Written informed consent was obtained from every patient. Every participating patient was
informed thoroughly about the study. Every subject was able to withdraw from the study at
any time without giving reasons.
4.4 Statistical methods
All data collected in this study was evaluated statistically using SPSS (SPSS Inc., Chicago,
USA) and GraphPad Prism 5 (GraphPad Software Inc., California, USA). Data are expressed
as mean +/-SEM and assessed, depending on the data’s distribution, using t-test, MANN-
Whitney U-test, one-way analysis of variance (one-way ANOVA) or Kruskal-Wallis one-way
ANOVA. For nominal or ordinal data chi-squared test was used. P-values below 0.05 were
considered as statistically significant, those below 0.01 as statistically highly significant.
4.5 Methods
Serum samples of the patients were obtained, (1450g for 15min) and stored at -20°C. A
differential blood count was implemented for every obtained sample. Peripheral blood
mononuclear cells (PBMCs) were separated from the heparinized blood samples by Ficoll

42
Paque-density gradient centrifugation (800g for 15min) and incubated for 24 hours at
different conditions in cell culture medium (2,5x10⁶ cells/ml). The supernatant and the
isolated RNA of the PBMCs were stored at -80°C until further processing.
4.5.1 PBMC separation
Peripheral blood mononuclear cells (PBMC) were purified by Ficoll-Paque PLUS (GE
Healthcare Bio-Sciences AB, Sweden) density gradient centrifugation. Anticoagulant-treated
(heparinized) blood was diluted with one third of balanced salt solution and layered carefully
over 15ml of Ficoll-Paque PLUS in a centrifuge tube. After centrifugation at room
temperature (800g, 15min) lymphocytes, monocytes and platelets were obtained from the
buffy coat and the interface between the Ficoll-Paque PLUS and the sample layers. This
material was then centrifuged twice in balanced salt solution to purify the lymphocytes (400g,
9min). The resulting cell pellet was then resuspended with CellGro serum-free medium (Cell
Genix, Freiburg, Germany) and incubated for 24h at a concentration of 2,5x10⁶ cells/ml. One
third of the cells were incubated in a native state, the second third was stimulated with the
addition of 12µl of diluted lipopolysaccharide (LPS) to mimic an inflammatory environment.
In the last third proliferation was induced by applying 12µl of diluted phytohaemagglutinin
(PHA).
Serum levels of the mentioned cytokines were measured using ELISA. The role of PBMCs
and their secretion pattern was evaluated by measuring the concentration in cell culture
supernatant after incubating the PBMCs in medium for 24h. To examine the changes in the
secretion pattern in an inflammatory environment, one third of the PBMCs was induced by
LPS, a polysaccharide that can be found in gram negative bacteria and therefore simulating a
state of infection. To complete the analysis under a proliferative stimulus was tested in the last
third of cultured PBMCs with addition of PHA.
After 24 hours of incubation the cells were removed from the medium by centrifugation
(400g, 9min). The supernatant was stored at -80°C. The cells were further processed to isolate
the RNA.
4.5.2 RNA purification and cDNA synthesis
To isolate purified RNA from the cells using Trizol (life technologies, Invitrogen™ Ambion
Thermo Fisher Scientific), the samples were first lysed with 1ml Trizol Reagent, according to

43
the protocol. After adequate mixing of the suspension, the lysed cells were stored at -80°C,
to avoid degradation of the RNA.
The addition of 200µl chloroform to the sample and incubation for 5 min on ice followed.
Thereafter samples were centrifuged for 20min to separate the RNA in the aqueous phase
and the lower phenol-containing organic phase. The upper aqueous phase was carefully
transferred to a new tube. The equal amount of propanol was added to the sample. This step
was followed by the addition of 75% ethanol and centrifugation. 1ml of 100% ethanol to each
tube was added followed by a further centrifugation step.. Thereafter, the supernatant was
discarded and the RNA pellet was allowed to dry at normal atmosphere. Finally the RNA
pellet was resuspended in 30µlH2O and stored for further processing at -80°C.
4.5.3 Quantitative reverse transcriptase PCR (qPCR)
mRNA expression of human PBMCs was evaluated using qPCR with Light Cycler Fast Start
DNA Master SYBR Green I (Roche Applied Science, Penzberg, Germany) according to the
manufacturer´s instruction. In brief a PCR cycle conditions were set as follows: 10 minutes
pre-incubation with 95°C, followed by 55 cycles, with each cycle including 10 seconds at
95°C. Light Cycler Software 1.5.0 (Roche Applied Science) was used for calculation of
crossing points (Cp) values that characterise the cycle number at with the fluorescence signal
of the sample exceeds a background fluorescence value. Two no template controls were run at
each PCR plate. [167]
Total RNA was reverse-transcribed with IScript cDNA synthesis kit (BioRad, Hercules, CA,
USA) according to the manufacturer’s instructions. Intron-spanning primers were designed
using primer3 software (http://bioinfo.ut.ee/primer3-0.4.0/). NIH nucleotide blast software
was used to evaluate the specifity of primers (https://blast.ncbi.nlm.nih.gov/). The primer
pairs were synthesised by Microsynth AK (Vienna, Austria). The following sequences where
used: MIF forward: 5´-GTTCCTCTCCGAGCTCACC-3´ reverse: 5´-
TGCTGTAGGAGCGGTTCTG-3´; B2M forward: 5′-GATGAGTATGCCTGCCGTGTG-3′
reverse: 5′-CAATCCAAATGCGGCATCT-3′. [167]
Amplification of each target gene was performed using 3µl of diluted cDNA, 5 pmole of each
primer, 4µl H2O, 7.5µl Light-Cycler SYBR Green I (Roche Applied Science, Penzberg,
Germany) in a final volume of 15µl in 96 well reaction plates. β-2-microglobulin (B2M)
served as a house-keeping gene. [167]

44
4.5.4 Enzyme-linked immunosorbent assay (ELISA)
Levels of MMP-9, TIMP-1, Lipocalin, MIF, (all Duoset kits, R&D systems, Minneapolis,
USA) and hsCRP following the manufacturer’s instructions were quantified in the serum and
supernatant of PBMCs.
An ELISA assay detects systemic antigens in human fluids. In this study we used serum and
the cell culture supernatants for protein detection. Analysed protein concentrations completed
our gene expression data and indicated if changes in the gene expression actually lead to
secretion of proteins and possible differences in circulating serum levels between the different
groups.
First of all, the capture antibody specific to the antigen of interest was sealed on the plate, by
diluting according to the manufacturers’ protocol, and incubating overnight at room
temperature. After 24 hours and a washing step, plates were blocked with blocking buffer to
avoid unspecific binding. After another washing step, samples and the predefined standard
were applied on the 96 well plate. During the incubation time of 2 hours the proteins in the
sample and the standard bind to the specific capture antibody. Plates were then washed and
the enzyme (biotin)-linked, detection antibody was added.. To visualise the amount of bound
detection antibody, a fluorescent signal must be induced. This was realised by the application
of streptavidin-horse radish peroxidase (HRP). The HRP bound to the biotin, which is linked
to the detection antibody. To initialise the necessary colour reaction 3,3′,5,5′-
Tetramethylbenzidine (TMB) was added and created a blue colour by cleaving the
streptavidin-HRP. This reaction is vulnerable to light exposition and was therefore protected
from direct light. The reaction was finally stopped by the addition of 50 µl of 2% sulphuric
acid. By photometric analysis with the Wallac Multilabel counter 1420 (PerkinElmer,
Boston, Massachusetts, USA) the optical density was measured by a laser with a determined
wavelength of 450nm. The deflection in combination with the defined standard curve defined
the quantity of protein detected in the samples.
45
5 Results
To test our hypothesis, that PBMCs displaying an altered secretion pattern and increased
levels of proinflammatory cytokines play an important role in the pathogenesis of diabetes
mellitus type 2 and in the increase of cardiovascular risk, we obtained serum and heparinised
blood samples from 53 volunteers.
The study population was composed of patients at different aggravation levels. From a group
with impaired fasting glucose (n=13), patients with newly diagnosed diabetes mellitus type 2
without medication (n=11), a group with DM 2 under therapy (n=15), and healthy volunteers
(n=15). Thus we were able to detect changes under the conditions of normal secretion,
inflammation and increased proliferation.
In Fehler! Verweisquelle konnte nicht gefunden werden. the concentrations are quoted for
very condition tested with the mean and the standard deviation. Following cytokines were
measured during the study: hsCRP, MIF, MMP-9 and TIMP-1. The protein concentrations
were measured in serum and supernatant at different conditions. hsCRP in the supernatant
was below the detection limit of the ELISA and therefore not shown. The Table 5.1 is
intended to provide an overview on the protein concentrations in the serum and supernatant of
the PBMCs. The protein concentrations will be described in detail in the results section.

46
Cytokine Condition Healthy
Control
IFG Under
Therapy
Initial
Diagnosis
Mean (SD)
Serum
hsCRP (µg/ml)
1586 (±1871) 2212 (±2157) 6301* (±3871) 3636* (±2580)
MIF (pg/ml)
1727 (±1264) 2451 (±2102) 2214 (±986) 1629 (±688)
MMP-9 (µg/ml)
450 (±346) 415 (±188) 432 (±141) 407 (±192)
TIMP-1 (ng/ml)
328* (±65) 373 (±95) 458 (±155) 402 (±101)
Supernatant
MIF (pg/ml) native 1355 (±1225) 1194 (±1034) 1327 (±920) 1283 (±590)
LPS 1678 (±1259) 1498 (±707) 2638 (±733) 1629* (±998)
PHA 1517 (±1193) 1194 (±831) 2003 (±1328) 1225 (±806)
MMP-9 (pg/ml) native 1695 (±1472) 1560 (±1176) 1308 (±747) 1184 (±705)
LPS 2853 (±2615) 2235 (±1984) 1786 (±709) 1731 (±1294)
PHA 6597 (±1872) 5344 (±1714) 5111* (±2524) 4352 (±1993)
TIMP-1 (ng/ml) native 9.37 (±2.91) 9.02 (±3.14) 8.88 (±4.68) 7.79 (±2.40)
LPS 19.98 (±7.40) 26.05 (±11.64) 27.24 (±12.51) 16.46 (±5.62)
PHA 14.16 (±5.22) 15.51 (±9.38) 18.07 (±6.85) 13.64 (±5.13)
Table 5.1 Cytokine concentrations in serum and supernatant of PBMCs * marks values with significant difference compared to the control group and will be described in the
results section, IFG=Impaired fasting glucose, SD=Standard deviation
5.1 Serum levels of hsCRP are elevated in
diabetic patients
To test the cardiovascular risk of the various groups a measurement of hsCRP in the serum
was measured for every participant (n=54). Significantly elevated levels were found in
diabetic patients under treatment (p=0.0037), as well as in the diabetic patients after initial
diagnosis, without any medication (p=0.0004) compared to the healthy volunteers. The
D'Agostino and Pearson normality test was calculated and a Kruskal Wallis test and Mann
Whitney test was performed. These increased values of hsCRP depict a clearly elevated
cardiovascular risk in diabetic patients and further research for possible causes and additional
variances in the gene expression should be conducted. HsCRP values of patients with initial

47
diagnosis, compared to patients with impaired fasting glucose, are increased (p=0.0012). Fig.
5.1
Fig. 5.1. Serum concentrations (µg/ml) of hsCRP in patients with initial diagnosis (without
therapy, n=11), under treatment of diabetes mellitus type 2 (n=15), impaired fasting glucose
(n=13) and healthy volunteers (n=15). IFG=Impaired fasting glucose
5.2 MIF expression is elevated PBMC of
diabetic patients
To test our theory of the impact of altered MIF values on the evolvement of diabetes mellitus
type 2 we performed a qPCR analysis of MIF expression in the PBMCs of the different
groups under native conditions and under an inflammatory stimulus (LPS) the result was an
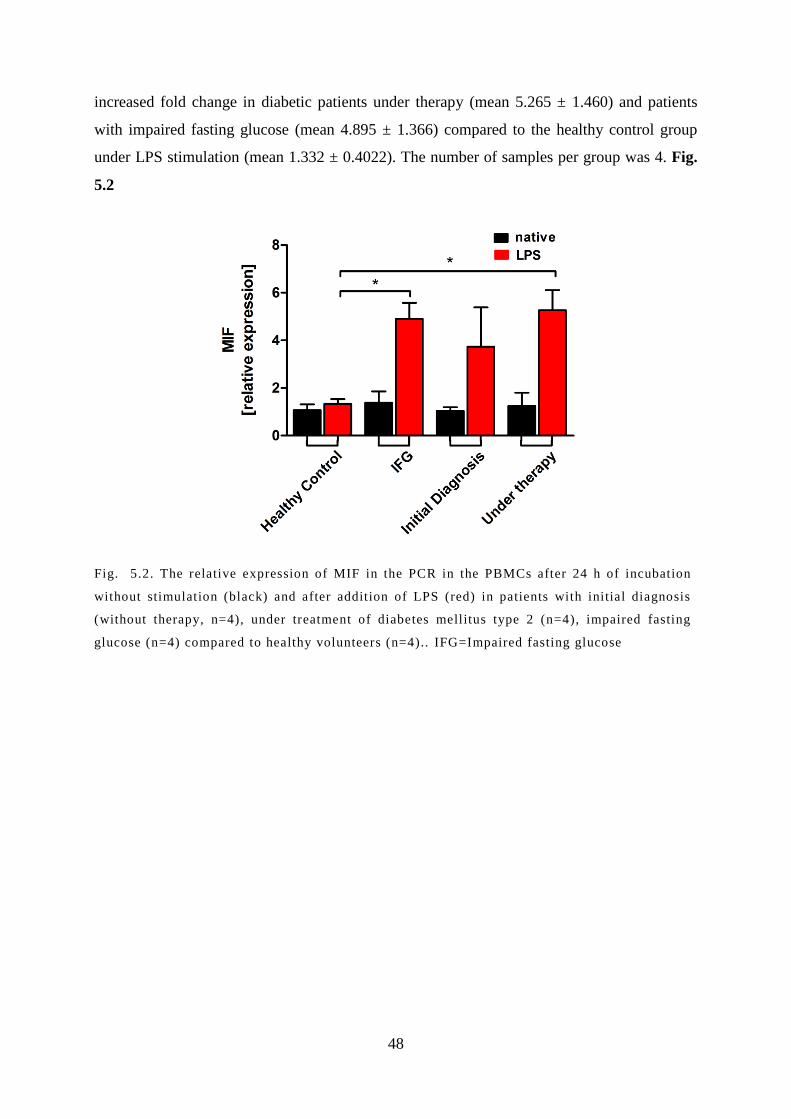
48
increased fold change in diabetic patients under therapy (mean 5.265 ± 1.460) and patients
with impaired fasting glucose (mean 4.895 ± 1.366) compared to the healthy control group
under LPS stimulation (mean 1.332 ± 0.4022). The number of samples per group was 4. Fig.
5.2
Fig. 5.2. The relative expression of MIF in the PCR in the PBMCs after 24 h of incubation
without stimulation (black) and after addition of LPS (red) in patients with initial diagnosis
(without therapy, n=4), under treatment of diabetes mellitus type 2 (n=4), impaired fasting
glucose (n=4) compared to healthy volunteers (n=4).. IFG=Impaired fasting glucose

49
5.3 Protein levels of MIF in the serum and
supernatant
The protein concentration was tested in the serum and in the supernatant of the PBMCs, after
24h of incubation. One third of the PBMCs were incubated without any stimulation (native),
the second third was stimulated with LPS and the last third was stimulated with PHA. The
cytokine concentrations are depicted in pg/ml. A significant difference was seen between the
MIF concentration after LPS stimulation of cells from patients with initial diagnosis (2638 ±
732.9) versus healthy controls (1678 ± 1259) (p= 0.0170). No difference was displayed under
native condition, and after induction of proliferation.
In the serum no significant changes in the protein levels (pg/ml) could be found between
patients with initial diagnosis 2214 ± (986.2), diabetic patients under therapy 1629 ± (688.3)
impaired fasting glucose 2451 ± (2102) and the healthy controls 1727 ± (1264).
Fig. 5.3

50
Fig. 5.3. Levels of MIF in the a) serum, b) supernatant of PBMCs after 24h of incubation,
without stimulation, c) after stimulation with LPS and d) after PHA stimulation in patients
with initial diagnosis (without therapy), under treatm ent of diabetes mellitus type 2 , impaired
fasting glucose compared to healthy volunteers. IFG=Impaired fasting glucose

51
5.4 Protein levels of MMP-9 in the serum and
supernatant
Measured protein concentrations in the serum evinced no significant distinctions between the
groups. The only disparity was seen in the MMP-9 secretion between diabetic patients under
therapy (4352 ± 1993) and the healthy volunteers (6597 ± 1872) after PHA stimulation. A
significant reduction in the protein level of MMP-9 in the diabetic patients with treatment
could be seen (p= 0.0036).
In the serum no significantly altered changes in the protein levels (µg/ml) could be found
between patients with initial diagnosis 431,7 ± (140,5) , diabetic patients under therapy 407,2
± (192,4), impaired fasting glucose 414,8 ± (188,2) and the healthy controls 449,6 ± (346,2).
Analysing the supernatant after 24h of incubation no alterations between the patients with
initial diagnosis 1308 ± (746.8), DM 2 under therapy 1184 ± (704.9) and impaired fasting
glucose 1560 ± (1176) compared to the healthy control group 1695 ± (1472) were found in
the unstimulated supernatant (pg/ml). Stimulation with LPS displayed a similar result with no
significant distinctions. Fig. 5.4
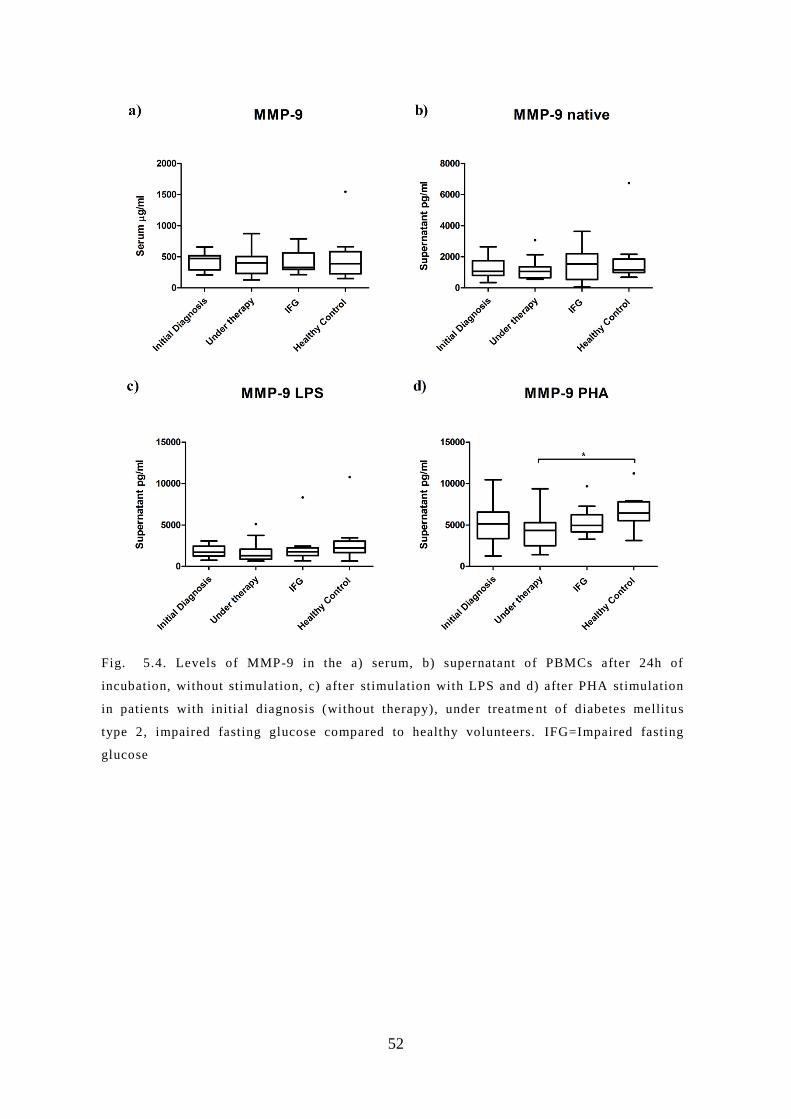
52
Fig. 5.4. Levels of MMP-9 in the a) serum, b) supernatant of PBMCs after 24h of
incubation, without stimulation, c) after stimulation with LPS and d) after PHA stimulation
in patients with initial diagnosis (without therapy), under treatme nt of diabetes mellitus
type 2, impaired fasting glucose compared to healthy volunteers. IFG=Impaired fasting
glucose

53
5.5 Protein levels of TIMP-1 in the serum and
supernatant
Serum concentrations (ng/ml) of TIMP were significantly higher in the group of diabetic
patients with initial diagnosis (457.5 ± 155) in comparison to the healthy control group
(328.1 ± 64.49) (p= 0.0285).
This effect could not be seen in the supernatant of the PBMCs after 24h of incubation in
native culture medium between the participants with initial diagnosis 8.883 ± (4,684), DM 2
under therapy 7,788 ± (2,395), with impaired fasting glucose 9.021 ± (3.141) and the healthy
controls 9.37 ± (2.914).
After stimulation with LPS the PBMCs of the patients with initial diagnosis revealed a
significantly elevated secretion level of TIMP 27.24 ± (12.51), compared to the patients under
therapy 16.46 ± (5.62), (p= 0.0073). After the stimulation with PHA there was no difference
between the groups. Fig. 5.5

54
Fig. 5.5. Levels of TIMP-1 in the a) serum, b) supernatant of PBMCs after 24h of incubation,
without stimulation, c) after stimulation with LPS and d) after PHA stimulation in patients
with initial diagnosis (without therapy), under treatm ent of diabetes mellitus type 2 , impaired
fasting glucose compared to healthy volunteers. IFG=Impaired fasting glucose

55
6 Discussion
The pathogenesis of DM 2 is characterised by two principles. First of all the insulin resistance
and secondly the relative lack of insulin. This impaired insulin sensitivity is induced by high
levels of blood glucose, which lead to higher levels of secreted insulin. This mechanism of
regulation and counter regulation creates a vicious circle, where higher doses of secreted
insulin, aggravate the insulin resistance of the cells. Thus the glucose uptake of the cells is
deranged and a state of hyperglycaemia is generated. This elevated circulating blood glucose
values lead to further insulin secretion. [7, 33, 168, 169]
Yet the origin of diabetes is not that simple, since a high calorie uptake, a sedentary lifestyle
and obesity is widely spread and not every obese patient develops a fulminate diabetes
mellitus type 2. [2, 11] As previously described, in diabetes mellitus type 1 an immunological
trigger plays a crucial role in the outbreak of DM 1. [33] So is the immune system also
involved in the evolvement of DM 2?
A recent study revealed that MIF is an autocrine regulator of insulin secretion and enhances
glykolysis in muscle cells via the enhancement of fructose 2,6-bisphosphate (F2,6BP). [170]
These findings may encourage our hypothesis of its role in the vicious circle of insulin
resistance resulting in DM 2. In previous studies from Herder et al. higher levels of MIF were
discovered in patients with DM 2 and impaired fasting glucose. [171] Another important
aspect of MIF is its contribution to the proinflammatory state in adipose tissue. [141] A case-
cohort study showed no significant difference in the serum levels of MIF in diabetic males
compared to healthy controls. [128] Therefore we hypothesized, that the increased MIF-level
is not a constantly elevated value, but a trigger is needed to provoke the rise in circulating
MIF concentrations. Due to the chronic inflammation in adipose tissue, we wanted to show,
that this trigger may be an infection and would be a possible explanation, that in some studies
MIF was significantly elevated in diabetic patients and in other studies not. [115, 121, 128]
To analyse the function of the cells in a native and proinflammatory state we included only
patients without any acute or chronic infections, antiinflammatory medication, leukopenia or
leukocytosis.
56
LPS, also known as endotoxins, are found in the outer membrane of gram-negative bacteria
with induce a strong inflammatory immune response in humans [172] Using LPS for the
stimulation of PBMC we aimed to mimic the processes of bacterial infection in humans. After
the LPS stimulation the PBMCs of the patients with initial diagnosis secreted significantly
higher levels of MIF, than the healthy controls. This altered secretion pattern might indicate
that MIF expression is only de-regulated in diabetic patients during bacterial infection
whereas under normal conditions the systemic levels of MIF were comparable between
diabetic patients and healthy controls. However as diabetic patients are prone to develop
bacterial infections such as chronic wounds it would be interesting to investigate whether MIF
levels are elevated systemically or locally at the site of infection in these patients. [173-177]
If MIF is elevated its role in orchestrating the immune response should be evaluated. Further
research is necessary for verification of this hypothesis with a higher number of persons
included. Yet if these results could be confirmed, new possibilities in the prevention of
Diabetes mellitus type 2 with antiinflamatory medication could be conceivable.
Additionally the diabetic patients included in the study exposed a higher level of hsCRP, an
inflammatory marker for cardiovascular events, important in the primary prevention. Patients
with a medical history of peripheral artery disease, thrombosis, myocardial infarction or
stroke were excluded from the study population. MIF had a significant impact on the
development of atherosclerotic plaques and plaque instability as shown in a MIF knockout
mice [148]. Therefore, elevated hsCRP levels and MIF concentrations in diabetic patients
during infection might additionally increase the risk for cardiovascular complications, such as
myocardial infarction or stroke. [76, 125, 146, 151-153]
Beside hsCRP and MIF we evaluated the matrix metallopeptidase-9 (MMP-9). MMP-9 was
selected in this study as it is associated with the genesis and rupture of atherosclerotic
plaques, acute myocardial infarction and unstable angina. [178]
Therefore we wanted to investigate whether the levels of MMP-9 are increased in an early
level of diabetes in serum or in the supernatant after LPS or PHA stimulation. However, we
could not detect any difference in the MMP-9 levels in the serum or in the supernatant with
the solitary exception of significant reduced MMP-9 concentrations in diabetic patients under
therapy in comparison to the healthy controls.
On the other hand the levels of TIMP-1 (the inhibitor of MMP-9) were significantly elevated
in the serum of patients with newly diagnosed diabetes, in contrast to the healthy volunteers.

57
TIMP-1 for a long time was solely seen as the inhibitor of the MMPs. However, nowadays a
growing body of evidence indicates that TIMP-1 exerts several immunological functions
beside those of MMP inhibition [157, 179, 180] TIMP-1 is also associated with heart failure
and left ventricular hypertrophy [162] and elevated levels are related to mortality risk after
myocardial infarction and stroke. [180, 181] Furthermore TIMP-1 leads to a reduced
degradation of the insulin-like growth factor -binding protein 3 (IGF-BP3). The resulting
higher levels of IGF-BP3 reduce the amount of IGF-II and cause a decreased IGF-I receptor
signalling. [182] It might be speculated that the insulin resistance is increased by this
mechanism. Yet further in vitro and in vivo analysis are necessary to explore the role of
TIMP-1 in the pathogenesis of diabetes.
Conclusion
Our results further substantiate previous observations that diabetic patients have higher levels
of hsCRP, indicating a higher risk for cardiovascular events. In addition we were able to show
that PBMC of diabetic patients in response to endotoxins secrete higher amounts of MIF, as
compared to healthy controls. Additional studies assessing the role of MIF in the pathogenesis
of diabetes are warranted.

58
7 Figure legend
Fig. 3.1 Nature Outlook, Diabetes in numbers, Tony Scully et al. [4], License number
3865971319884, Nature Publishing Group ................................................... 8
Fig. 3.2. International Diabetes Federation. IDF Diabetes, 7 ed. Brussels, Belgium:
International Diabetes Federation, 2015. http://www.diabetesatlas.org,
Map3.4, IDF approval of copyright request confirmed 12.05.16 ................ 13
Fig. 5.1. Serum concentrations (µg/ml) of hsCRP in patients with initial diagnosis (without
therapy, n=11), under treatment of diabetes mellitus type 2 (n=15), impaired
fasting glucose (n=13) and healthy volunteers (n=15). IFG=Impaired fasting
glucose ......................................................................................................... 47
Fig. 5.2. The relative expression of MIF in the PCR in the PBMCs after 24 h of incubation
without stimulation (black) and after addition of LPS (red) in patients with
initial diagnosis (without therapy, n=4), under treatment of diabetes mellitus
type 2 (n=4), impaired fasting glucose (n=4) compared to healthy volunteers
(n=4) IFG=Impaired fasting glucose. .......................................................... 48
Fig. 5.3. Levels of MIF in the a) serum, b) supernatant of PBMCs after 24h of incubation,
without stimulation, c) after stimulation with LPS and d) after PHA
stimulation in patients with initial diagnosis (without therapy), under
treatment of diabetes mellitus type 2 , impaired fasting glucose compared to
healthy volunteers. IFG=Impaired fasting glucose ...................................... 50
Fig. 5.4. Levels of MMP-9 in the a) serum, b) supernatant of PBMCs after 24h of incubation,
without stimulation, c) after stimulation with LPS and d) after PHA
stimulation in patients with initial diagnosis (without therapy), under
treatment of diabetes mellitus type 2, impaired fasting glucose compared to
healthy volunteers. IFG=Impaired fasting glucose. ..................................... 52
Fig. 5.5. Levels of TIMP-1 in the a) serum, b) supernatant of PBMCs after 24h of incubation,
without stimulation, c) after stimulation with LPS and d) after PHA
stimulation in patients with initial diagnosis (without therapy), under
treatment of diabetes mellitus type 2, impaired fasting glucose compared to
healthy volunteers. IFG=Impaired fasting glucose ...................................... 54

59
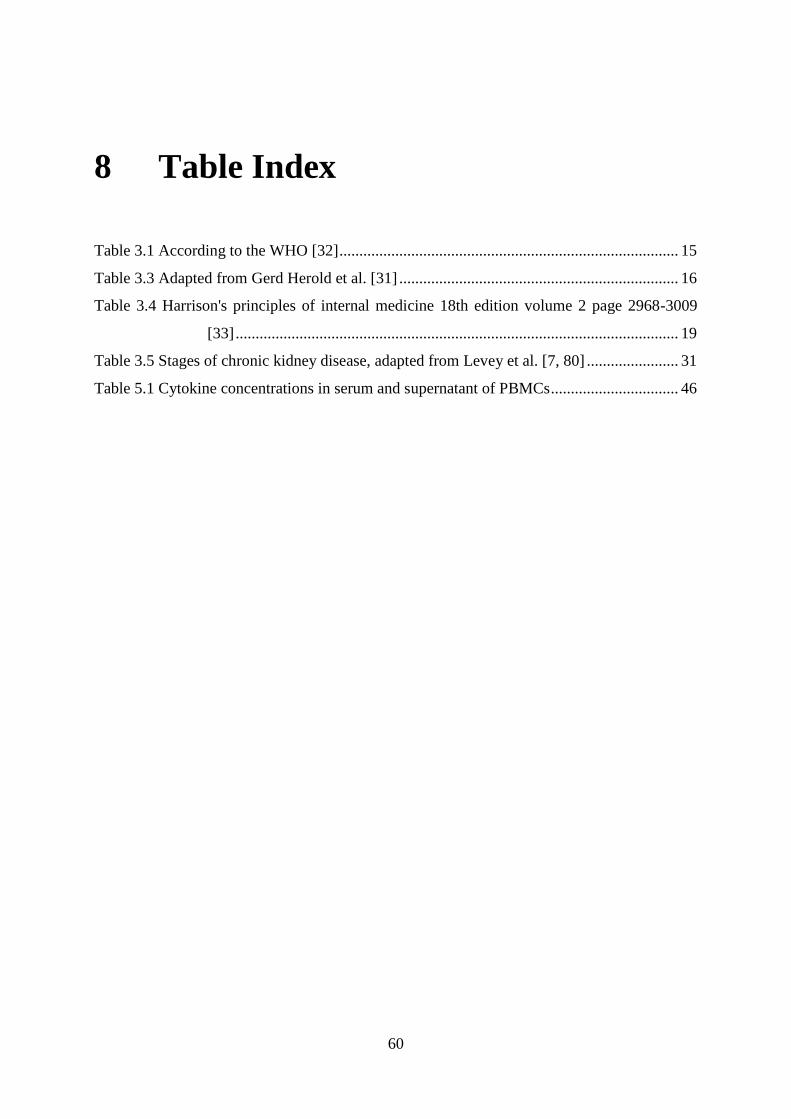
60
8 Table Index
Table 3.1 According to the WHO [32] ..................................................................................... 15
Table 3.3 Adapted from Gerd Herold et al. [31] ...................................................................... 16
Table 3.4 Harrison's principles of internal medicine 18th edition volume 2 page 2968-3009
[33] ............................................................................................................... 19
Table 3.5 Stages of chronic kidney disease, adapted from Levey et al. [7, 80] ....................... 31
Table 5.1 Cytokine concentrations in serum and supernatant of PBMCs ................................ 46

61
9 References
1. Association, A.D., Diagnosis and classification of diabetes mellitus. Diabetes Care,
2010. 33 Suppl 1: p. S62-9.
2. Farag, Y.M. and M.R. Gaballa, Diabesity: an overview of a rising epidemic. Nephrol
Dial Transplant, 2011. 26(1): p. 28-35.
3. WHO, GLOBAL STATUS REPORT on noncommunicable diseases 2014. 2014:
Geneva. p. 1-298.
4. Scully, T., Diabetes in numbers. Nature, 2012. 485(7398): p. S2-3.
5. Association, A.D., Standards of medical care in diabetes--2013. Diabetes Care, 2013.
36 Suppl 1: p. S11-66.
6. Standards of Medical Care in Diabetes-2016 Abridged for Primary Care Providers.
Clin Diabetes, 2016. 34(1): p. 3-21.
7. Association, A.D., Standards of medical care in diabetes--2014. Diabetes Care, 2014.
37 Suppl 1: p. S14-80.
8. International Expert Committee report on the role of the A1C assay in the diagnosis of
diabetes. Diabetes Care, 2009. 32(7): p. 1327-34.
9. Diagnosis and classification of diabetes mellitus. Diabetes Care, 2014. 37 Suppl 1: p.
S81-90.
10. Ismail-Beigi, F., et al., Effect of intensive treatment of hyperglycaemia on
microvascular outcomes in type 2 diabetes: an analysis of the ACCORD randomised
trial. Lancet, 2010. 376(9739): p. 419-30.
11. International Diabetes Federation. IDF Diabetes, 7 ed. Brussels, Belgium:
International Diabetes Federation, 2015. http://www.diabetesatlas.org. p. S1-144.
12. Vandorsten, J.P., et al., NIH consensus development conference: diagnosing
gestational diabetes mellitus. NIH Consens State Sci Statements, 2013. 29(1): p. 1-31.
13. Horvath, K., et al., Effects of treatment in women with gestational diabetes mellitus:
systematic review and meta-analysis. BMJ, 2010. 340: p. c1395.
14. Weinert, L.S., International Association of Diabetes and Pregnancy Study Groups
recommendations on the diagnosis and classification of hyperglycemia in pregnancy:
comment to the International Association of Diabetes and Pregnancy Study Groups
Consensus Panel. Diabetes Care, 2010. 33(7): p. e97; author reply e98.

62
15. Simmons, D., et al., Gestational diabetes mellitus: NICE for the U.S.? A comparison
of the American Diabetes Association and the American College of Obstetricians and
Gynecologists guidelines with the U.K. National Institute for Health and Clinical
Excellence guidelines. Diabetes Care, 2010. 33(1): p. 34-7.
16. Lawrence, J.M., et al., Trends in the prevalence of preexisting diabetes and
gestational diabetes mellitus among a racially/ethnically diverse population of
pregnant women, 1999-2005. Diabetes Care, 2008. 31(5): p. 899-904.
17. Classification and diagnosis of diabetes mellitus and other categories of glucose
intolerance. National Diabetes Data Group. Diabetes, 1979. 28(12): p. 1039-57.
18. Carpenter, M.W. and D.R. Coustan, Criteria for screening tests for gestational
diabetes. Am J Obstet Gynecol, 1982. 144(7): p. 768-73.
19. Berggren, E.K., et al., National Diabetes Data Group vs Carpenter-Coustan criteria
to diagnose gestational diabetes. Am J Obstet Gynecol, 2011. 205(3): p. 253 e1-7.
20. Metzger, B.E., et al., Hyperglycemia and adverse pregnancy outcomes. N Engl J Med,
2008. 358(19): p. 1991-2002.
21. Bunn, H.F., et al., The biosynthesis of human hemoglobin A1c. Slow glycosylation of
hemoglobin in vivo. J Clin Invest, 1976. 57(6): p. 1652-9.
22. Beagley, J., et al., Global estimates of undiagnosed diabetes in adults. Diabetes
Research and Clinical Practice, 2014 Feb. 103(2): p. 150-160.
23. WHO. Diabetes Factsheet N°312. 2015 January 2015 [cited 2015 19.04.2015];
Available from: http://www.who.int/mediacentre/factsheets/fs312/en/.
24. Vykoukal, D. and M.G. Davies, Biology of metabolic syndrome in a vascular patient.
Vascular, 2012. 20(3): p. 156-65.
25. Vykoukal, D. and M.G. Davies, Vascular biology of metabolic syndrome. J Vasc Surg,
2011. 54(3): p. 819-31.
26. Franco, O.H., et al., Trajectories of entering the metabolic syndrome: the framingham
heart study. Circulation, 2009. 120(20): p. 1943-50.
27. Grundy, S.M., et al., Definition of metabolic syndrome: report of the National Heart,
Lung, and Blood Institute/American Heart Association conference on scientific issues
related to definition. Arterioscler Thromb Vasc Biol, 2004. 24(2): p. e13-8.
28. American Diabetes, A., Diagnosis and classification of diabetes mellitus. Diabetes
Care, 2009. 32 Suppl 1: p. S62-7.
29. Polonsky, K.S., The Past 200 Years in Diabetes. New England Journal of Medicine,
2012. 367(14): p. 1332-1340.

63
30. Soriguer, F., et al., Metabolically healthy but obese, a matter of time? Findings from
the prospective Pizarra study. Journal of Clinical Endocrinology & Metabolism, 2013.
31. Herold, G., Innere Medizin 2014. 2014, Köln: Gerd Herold 719-747.
32. Vykoukal, D. and M.G. Davies, Vascular biology of metabolic syndrome. Journal of
Vascular Surgery, 2011. 54(3): p. 819-831.
33. Longo, D.L., Harrison's principles of internal medicine. 18th ed. Vol. II. 2012, New
York Mc Graw Hill Medical Companies, Inc. 2968-3009.
34. Kaul, K., M. Apostolopoulou, and M. Roden, Insulin resistance in type 1 diabetes
mellitus. Metabolism, 2015.
35. Sakai, K., et al., Mitochondrial reactive oxygen species reduce insulin secretion by
pancreatic beta-cells. Biochem Biophys Res Commun, 2003. 300(1): p. 216-22.
36. Zeeshan, H.M., et al., Endoplasmic Reticulum Stress and Associated ROS. Int J Mol
Sci, 2016. 17(3).
37. Sadaba, M.C., et al., Insulin-like growth factor 1 (IGF-1) therapy: Mitochondrial
dysfunction and diseases. Biochim Biophys Acta, 2016.
38. Koene, R.J., et al., Shared Risk Factors in Cardiovascular Disease and Cancer.
Circulation, 2016. 133(11): p. 1104-14.
39. De Meyts, P. and J. Whittaker, Structural biology of insulin and IGF1 receptors:
implications for drug design. Nat Rev Drug Discov, 2002. 1(10): p. 769-83.
40. Standards of medical care in diabetes--2011. Diabetes Care, 2011. 34 Suppl 1: p.
S11-61.
41. Laugesen, E., J.A. Ostergaard, and R.D. Leslie, Latent autoimmune diabetes of the
adult: current knowledge and uncertainty. Diabet Med, 2015. 32(7): p. 843-52.
42. Pipi, E., M. Marketou, and A. Tsirogianni, Distinct clinical and laboratory
characteristics of latent autoimmune diabetes in adults in relation to type 1 and type 2
diabetes mellitus. World J Diabetes, 2014. 5(4): p. 505-10.
43. Stratton, I.M., et al., Association of glycaemia with macrovascular and microvascular
complications of type 2 diabetes (UKPDS 35): prospective observational study. BMJ,
2000. 321(7258): p. 405-12.
44. Holman, R.R., et al., 10-year follow-up of intensive glucose control in type 2 diabetes.
N Engl J Med, 2008. 359(15): p. 1577-89.
45. Intensive blood-glucose control with sulphonylureas or insulin compared with
conventional treatment and risk of complications in patients with type 2 diabetes

64
(UKPDS 33). UK Prospective Diabetes Study (UKPDS) Group. Lancet, 1998.
352(9131): p. 837-53.
46. Whitmer, R.A., et al., Hypoglycemic episodes and risk of dementia in older patients
with type 2 diabetes mellitus. JAMA, 2009. 301(15): p. 1565-72.
47. Cryer, P.E., Diverse causes of hypoglycemia-associated autonomic failure in diabetes.
N Engl J Med, 2004. 350(22): p. 2272-9.
48. Seaquist, E.R., et al., Hypoglycemia and diabetes: a report of a workgroup of the
American Diabetes Association and the Endocrine Society. Diabetes Care, 2013.
36(5): p. 1384-95.
49. Nyenwe, E.A. and A.E. Kitabchi, The evolution of diabetic ketoacidosis: An update of
its etiology, pathogenesis and management. Metabolism, 2016. 65(4): p. 507-21.
50. Dhatariya, K.K., et al., National survey of the management of Diabetic Ketoacidosis
(DKA) in the UK in 2014. Diabet Med, 2016. 33(2): p. 252-60.
51. Rodriguez-Gutierrez, R., et al., Severe Ketoacidosis (pH </= 6.9) in Type 2 Diabetes:
More Frequent and Less Ominous Than Previously Thought. Biomed Res Int, 2015.
2015: p. 134780.
52. Scott, A.R., Management of hyperosmolar hyperglycaemic state in adults with
diabetes. Diabet Med, 2015. 32(6): p. 714-24.
53. Munro, J.F., et al., Euglycaemic diabetic ketoacidosis. Br Med J, 1973. 2(5866): p.
578-80.
54. Burge, M.R., K.J. Hardy, and D.S. Schade, Short-term fasting is a mechanism for the
development of euglycemic ketoacidosis during periods of insulin deficiency. J Clin
Endocrinol Metab, 1993. 76(5): p. 1192-8.
55. Kitabchi, A.E. and E.A. Nyenwe, Hyperglycemic crises in diabetes mellitus: diabetic
ketoacidosis and hyperglycemic hyperosmolar state. Endocrinol Metab Clin North
Am, 2006. 35(4): p. 725-51, viii.
56. Use of hepatitis B vaccination for adults with diabetes mellitus: recommendations of
the Advisory Committee on Immunization Practices (ACIP). MMWR Morb Mortal
Wkly Rep, 2011. 60(50): p. 1709-11.
57. Colquhoun, A.J., et al., Effectiveness of influenza vaccine in reducing hospital
admissions in people with diabetes. Epidemiol Infect, 1997. 119(3): p. 335-41.
58. Bangalore, S., et al., Blood pressure targets in subjects with type 2 diabetes
mellitus/impaired fasting glucose: observations from traditional and bayesian

65
random-effects meta-analyses of randomized trials. Circulation, 2011. 123(24): p.
2799-810, 9 p following 810.
59. Buse, J.B., et al., Primary prevention of cardiovascular diseases in people with
diabetes mellitus: a scientific statement from the American Heart Association and the
American Diabetes Association. Diabetes Care, 2007. 30(1): p. 162-72.
60. Tight blood pressure control and risk of macrovascular and microvascular
complications in type 2 diabetes: UKPDS 38. UK Prospective Diabetes Study Group.
BMJ, 1998. 317(7160): p. 703-13.
61. Hansson, L., et al., Effects of intensive blood-pressure lowering and low-dose aspirin
in patients with hypertension: principal results of the Hypertension Optimal Treatment
(HOT) randomised trial. HOT Study Group. Lancet, 1998. 351(9118): p. 1755-62.
62. Adler, A.I., et al., Association of systolic blood pressure with macrovascular and
microvascular complications of type 2 diabetes (UKPDS 36): prospective
observational study. BMJ, 2000. 321(7258): p. 412-9.
63. Chobanian, A.V., et al., The Seventh Report of the Joint National Committee on
Prevention, Detection, Evaluation, and Treatment of High Blood Pressure: the JNC 7
report. JAMA, 2003. 289(19): p. 2560-72.
64. Sattar, N., et al., Statins and risk of incident diabetes: a collaborative meta-analysis of
randomised statin trials. Lancet, 2010. 375(9716): p. 735-42.
65. Rajpathak, S.N., et al., Statin therapy and risk of developing type 2 diabetes: a meta-
analysis. Diabetes Care, 2009. 32(10): p. 1924-9.
66. Kearney, P.M., et al., Efficacy of cholesterol-lowering therapy in 18,686 people with
diabetes in 14 randomised trials of statins: a meta-analysis. Lancet, 2008. 371(9607):
p. 117-25.
67. Taylor, F., et al., Statins for the primary prevention of cardiovascular disease.
Cochrane Database Syst Rev, 2013. 1: p. CD004816.
68. Carter, A.A., et al., Risk of incident diabetes among patients treated with statins:
population based study. BMJ, 2013. 346: p. f2610.
69. Ginsberg, H.N., et al., Effects of combination lipid therapy in type 2 diabetes mellitus.
N Engl J Med, 2010. 362(17): p. 1563-74.
70. Riddle, M.C., et al., Epidemiologic relationships between A1C and all-cause mortality
during a median 3.4-year follow-up of glycemic treatment in the ACCORD trial.
Diabetes Care, 2010. 33(5): p. 983-90.

66
71. Jones, P.H. and M.H. Davidson, Reporting rate of rhabdomyolysis with fenofibrate +
statin versus gemfibrozil + any statin. Am J Cardiol, 2005. 95(1): p. 120-2.
72. Pignone, M., et al., Aspirin for primary prevention of cardiovascular events in people
with diabetes: a position statement of the American Diabetes Association, a scientific
statement of the American Heart Association, and an expert consensus document of
the American College of Cardiology Foundation. Diabetes Care, 2010. 33(6): p. 1395-
402.
73. Voulgari, C., N. Katsilambros, and N. Tentolouris, Smoking cessation predicts
amelioration of microalbuminuria in newly diagnosed type 2 diabetes mellitus: a 1-
year prospective study. Metabolism, 2011. 60(10): p. 1456-64.
74. Bax, J.J., et al., Screening for coronary artery disease in patients with diabetes.
Diabetes Care, 2007. 30(10): p. 2729-36.
75. Baigent, C., et al., Aspirin in the primary and secondary prevention of vascular
disease: collaborative meta-analysis of individual participant data from randomised
trials. Lancet, 2009. 373(9678): p. 1849-60.
76. Perk, J., et al., European Guidelines on cardiovascular disease prevention in clinical
practice (version 2012). The Fifth Joint Task Force of the European Society of
Cardiology and Other Societies on Cardiovascular Disease Prevention in Clinical
Practice (constituted by representatives of nine societies and by invited experts). Eur
Heart J, 2012. 33(13): p. 1635-701.
77. Effect of intensive therapy on the development and progression of diabetic
nephropathy in the Diabetes Control and Complications Trial. The Diabetes Control
and Complications (DCCT) Research Group. Kidney Int, 1995. 47(6): p. 1703-20.
78. Effect of intensive blood-glucose control with metformin on complications in
overweight patients with type 2 diabetes (UKPDS 34). UK Prospective Diabetes Study
(UKPDS) Group. Lancet, 1998. 352(9131): p. 854-65.
79. Eknoyan, G., et al., Proteinuria and other markers of chronic kidney disease: a
position statement of the national kidney foundation (NKF) and the national institute
of diabetes and digestive and kidney diseases (NIDDK). Am J Kidney Dis, 2003.
42(4): p. 617-22.
80. Levey, A.S., et al., National Kidney Foundation practice guidelines for chronic kidney
disease: evaluation, classification, and stratification. Ann Intern Med, 2003. 139(2):
p. 137-47.

67
81. Yusuf, S., et al., Telmisartan, ramipril, or both in patients at high risk for vascular
events. N Engl J Med, 2008. 358(15): p. 1547-59.
82. Patel, A., et al., Intensive blood glucose control and vascular outcomes in patients
with type 2 diabetes. N Engl J Med, 2008. 358(24): p. 2560-72.
83. Ravid, M., et al., Long-term renoprotective effect of angiotensin-converting enzyme
inhibition in non-insulin-dependent diabetes mellitus. A 7-year follow-up study. Arch
Intern Med, 1996. 156(3): p. 286-9.
84. Lewis, E.J., et al., The effect of angiotensin-converting-enzyme inhibition on diabetic
nephropathy. The Collaborative Study Group. N Engl J Med, 1993. 329(20): p. 1456-
62.
85. Laffel, L.M., J.B. McGill, and D.J. Gans, The beneficial effect of angiotensin-
converting enzyme inhibition with captopril on diabetic nephropathy in normotensive
IDDM patients with microalbuminuria. North American Microalbuminuria Study
Group. Am J Med, 1995. 99(5): p. 497-504.
86. Remuzzi, G., M. Macia, and P. Ruggenenti, Prevention and treatment of diabetic
renal disease in type 2 diabetes: the BENEDICT study. J Am Soc Nephrol, 2006. 17(4
Suppl 2): p. S90-7.
87. Haller, H., et al., Olmesartan for the delay or prevention of microalbuminuria in type
2 diabetes. N Engl J Med, 2011. 364(10): p. 907-17.
88. Krolewski, A.S., et al., Early progressive renal decline precedes the onset of
microalbuminuria and its progression to macroalbuminuria. Diabetes Care, 2014.
37(1): p. 226-34.
89. Garg, J.P. and G.L. Bakris, Microalbuminuria: marker of vascular dysfunction, risk
factor for cardiovascular disease. Vasc Med, 2002. 7(1): p. 35-43.
90. Klausen, K., et al., Very low levels of microalbuminuria are associated with increased
risk of coronary heart disease and death independently of renal function,
hypertension, and diabetes. Circulation, 2004. 110(1): p. 32-5.
91. de Boer, I.H., et al., Long-term renal outcomes of patients with type 1 diabetes
mellitus and microalbuminuria: an analysis of the Diabetes Control and
Complications Trial/Epidemiology of Diabetes Interventions and Complications
cohort. Arch Intern Med, 2011. 171(5): p. 412-20.
92. Molitch, M.E., et al., Development and progression of renal insufficiency with and
without albuminuria in adults with type 1 diabetes in the diabetes control and

68
complications trial and the epidemiology of diabetes interventions and complications
study. Diabetes Care, 2010. 33(7): p. 1536-43.
93. de Boer, I.H., et al., Intensive diabetes therapy and glomerular filtration rate in type 1
diabetes. N Engl J Med, 2011. 365(25): p. 2366-76.
94. Foundation, N.K., KDOQI Clinical Practice Guideline for Diabetes and CKD: 2012
Update. Am J Kidney Dis, 2012. 60(5): p. 850-86.
95. Gall, M.A., et al., Risk factors for development of incipient and overt diabetic
nephropathy in patients with non-insulin dependent diabetes mellitus: prospective,
observational study. BMJ, 1997. 314(7083): p. 783-8.
96. The effect of intensive treatment of diabetes on the development and progression of
long-term complications in insulin-dependent diabetes mellitus. The Diabetes Control
and Complications Trial Research Group. N Engl J Med, 1993. 329(14): p. 977-86.
97. Bergenstal, R.M., et al., Threshold-based insulin-pump interruption for reduction of
hypoglycemia. N Engl J Med, 2013. 369(3): p. 224-32.
98. Nathan, D.M., et al., Intensive diabetes treatment and cardiovascular disease in
patients with type 1 diabetes. N Engl J Med, 2005. 353(25): p. 2643-53.
99. Yeh, H.C., et al., Comparative effectiveness and safety of methods of insulin delivery
and glucose monitoring for diabetes mellitus: a systematic review and meta-analysis.
Ann Intern Med, 2012. 157(5): p. 336-47.
100. Bennett, W.L., et al., Comparative effectiveness and safety of medications for type 2
diabetes: an update including new drugs and 2-drug combinations. Ann Intern Med,
2011. 154(9): p. 602-13.
101. Inzucchi, S.E., et al., Management of hyperglycemia in type 2 diabetes: a patient-
centered approach: position statement of the American Diabetes Association (ADA)
and the European Association for the Study of Diabetes (EASD). Diabetes Care, 2012.
35(6): p. 1364-79.
102. Scherrer, J.F., et al., Increased risk of myocardial infarction in depressed patients with
type 2 diabetes. Diabetes Care, 2011. 34(8): p. 1729-34.
103. Bot, M., et al., Association of coexisting diabetes and depression with mortality after
myocardial infarction. Diabetes Care, 2012. 35(3): p. 503-9.
104. Sullivan, M.D., et al., Depression predicts all-cause mortality: epidemiological
evaluation from the ACCORD HRQL substudy. Diabetes Care, 2012. 35(8): p. 1708-
15.

69
105. Curat, C.A., et al., From blood monocytes to adipose tissue-resident macrophages:
induction of diapedesis by human mature adipocytes. Diabetes, 2004. 53(5): p. 1285-
92.
106. Patsouris, D., et al., Ablation of CD11c-positive cells normalizes insulin sensitivity in
obese insulin resistant animals. Cell Metab, 2008. 8(4): p. 301-9.
107. Wu, H., et al., CD11c expression in adipose tissue and blood and its role in diet-
induced obesity. Arterioscler Thromb Vasc Biol, 2010. 30(2): p. 186-92.
108. Weisberg, S.P., et al., Obesity is associated with macrophage accumulation in adipose
tissue. J Clin Invest, 2003. 112(12): p. 1796-808.
109. Hotamisligil, G.S., et al., Tumor necrosis factor alpha inhibits signaling from the
insulin receptor. Proc Natl Acad Sci U S A, 1994. 91(11): p. 4854-8.
110. Rotter, V., I. Nagaev, and U. Smith, Interleukin-6 (IL-6) induces insulin resistance in
3T3-L1 adipocytes and is, like IL-8 and tumor necrosis factor-alpha, overexpressed in
human fat cells from insulin-resistant subjects. J Biol Chem, 2003. 278(46): p. 45777-
84.
111. Bronsart, L.L. and C.H. Contag, A role of the adaptive immune system in glucose
homeostasis. BMJ Open Diabetes Res Care, 2016. 4(1): p. e000136.
112. Shah, S., et al., Oxidative stress, glucose metabolism, and the prevention of type 2
diabetes: pathophysiological insights. Antioxid Redox Signal, 2007. 9(7): p. 911-29.
113. Odegaard, A.O., et al., Oxidative stress, inflammation, endothelial dysfunction and
incidence of type 2 diabetes. Cardiovasc Diabetol, 2016. 15(1): p. 51.
114. Nowlin, S.Y., M.J. Hammer, and G. D'Eramo Melkus, Diet, inflammation, and
glycemic control in type 2 diabetes: an integrative review of the literature. J Nutr
Metab, 2012. 2012: p. 542698.
115. Lee, B.C. and J. Lee, Cellular and molecular players in adipose tissue inflammation in
the development of obesity-induced insulin resistance. Biochim Biophys Acta, 2014.
1842(3): p. 446-62.
116. Schrover, I.M., et al., Adipose Tissue Dysfunction: Clinical Relevance and Diagnostic
Possibilities. Horm Metab Res, 2016. 48(4): p. 213-25.
117. Nishimoto, S., et al., Obesity-induced DNA released from adipocytes stimulates
chronic adipose tissue inflammation and insulin resistance. Sci Adv, 2016. 2(3): p.
e1501332.
118. Boutens, L. and R. Stienstra, Adipose tissue macrophages: going off track during
obesity. Diabetologia, 2016. 59(5): p. 879-94.

70
119. Palmer, A.K. and J.L. Kirkland, Aging and adipose tissue: potential interventions for
diabetes and regenerative medicine. Exp Gerontol, 2016.
120. Donath, M.Y., Multiple benefits of targeting inflammation in the treatment of type 2
diabetes. Diabetologia, 2016. 59(4): p. 679-82.
121. Morettini, M., et al., Effects of walking on low-grade inflammation and their
implications for Type 2 Diabetes. Prev Med Rep, 2015. 2: p. 538-47.
122. Maes, E., et al., Interindividual variation in the proteome of human peripheral blood
mononuclear cells. PLoS One, 2013. 8(4): p. e61933.
123. Hryniewicz-Jankowska, A., P.K. Choudhary, and S.R. Goodman, Variation in the
monocyte proteome. Exp Biol Med (Maywood), 2007. 232(7): p. 967-76.
124. Satoh, M., et al., Increased expression of tumor necrosis factor-α converting enzyme
and tumor necrosis factor-α in peripheral blood mononuclear cells in patients with
advanced congestive heart failure. European Journal of Heart Failure, 2004. 6(7): p.
869-875.
125. White, D.A., et al., Pro-inflammatory action of MIF in acute myocardial infarction via
activation of peripheral blood mononuclear cells. PLoS One, 2013. 8(10): p. e76206.
126. Chen, Q., et al., Matrix metalloproteinases: inflammatory regulators of cell behaviors
in vascular formation and remodeling. Mediators Inflamm, 2013. 2013: p. 928315.
127. Calandra, T. and T. Roger, Macrophage migration inhibitory factor: a regulator of
innate immunity. Nat Rev Immunol, 2003. 3(10): p. 791-800.
128. Herder, C., et al., Effect of macrophage migration inhibitory factor (MIF) gene
variants and MIF serum concentrations on the risk of type 2 diabetes: results from the
MONICA/KORA Augsburg Case-Cohort Study, 1984-2002. Diabetologia, 2008. 51(2):
p. 276-84.
129. Waeber, G., et al., Insulin secretion is regulated by the glucose-dependent production
of islet beta cell macrophage migration inhibitory factor. Proc Natl Acad Sci U S A,
1997. 94(9): p. 4782-7.
130. Waeber, G., et al., A role for the endocrine and pro-inflammatory mediator MIF in the
control of insulin secretion during stress. Diabetes Metab Res Rev, 1999. 15(1): p. 47-
54.
131. Plaisance, V., et al., The mif gene is transcriptionally regulated by glucose in insulin-
secreting cells. Biochem Biophys Res Commun, 2002. 295(1): p. 174-81.

71
132. Sakaue, S., et al., Regulation of macrophage migration inhibitory factor (MIF)
expression by glucose and insulin in adipocytes in vitro. Mol Med, 1999. 5(6): p. 361-
71.
133. Baugh, J.A. and S.C. Donnelly, Macrophage migration inhibitory factor: a
neuroendocrine modulator of chronic inflammation. J Endocrinol, 2003. 179(1): p. 15-
23.
134. Ghanim, H., et al., Circulating mononuclear cells in the obese are in a
proinflammatory state. Circulation, 2004. 110(12): p. 1564-71.
135. Skurk, T., et al., Production and release of macrophage migration inhibitory factor
from human adipocytes. Endocrinology, 2005. 146(3): p. 1006-11.
136. Velickovic, N., et al., Tissue-specific regulation of inflammation by macrophage
migration inhibitory factor and glucocorticoids in fructose-fed Wistar rats. Br J Nutr,
2013. 110(3): p. 456-65.
137. Atsumi, T., et al., The proinflammatory cytokine macrophage migration inhibitory
factor regulates glucose metabolism during systemic inflammation. J Immunol, 2007.
179(8): p. 5399-406.
138. Saksida, T., et al., Macrophage migration inhibitory factor deficiency protects
pancreatic islets from palmitic acid-induced apoptosis. Immunol Cell Biol, 2012.
90(7): p. 688-98.
139. Stojanovic, I., et al., Macrophage migration inhibitory factor deficiency protects
pancreatic islets from cytokine-induced apoptosis in vitro. Clin Exp Immunol, 2012.
169(2): p. 156-63.
140. Fingerle-Rowson, G.R. and R. Bucala, Neuroendocrine properties of macrophage
migration inhibitory factor (MIF). Immunol Cell Biol, 2001. 79(4): p. 368-75.
141. Kim, B.S., et al., The macrophage migration inhibitory factor protein superfamily in
obesity and wound repair. Exp Mol Med, 2015. 47: p. e161.
142. Grieb, G., et al., Macrophage migration inhibitory factor (MIF): a promising
biomarker. Drug News Perspect, 2010. 23(4): p. 257-64.
143. Calandra, T., et al., MIF as a glucocorticoid-induced modulator of cytokine
production. Nature, 1995. 377(6544): p. 68-71.
144. Bernhagen, J., et al., MIF is a noncognate ligand of CXC chemokine receptors in
inflammatory and atherogenic cell recruitment. Nat Med, 2007. 13(5): p. 587-96.
145. Merk, M., et al., D-dopachrome tautomerase (D-DT or MIF-2): doubling the MIF
cytokine family. Cytokine, 2012. 59(1): p. 10-7.

72
146. Hao, Y., S.L. Yi, and J.Q. Zhong, Serum macrophage migration inhibitory factor
levels are associated with angiographically complex coronary lesions in patients with
coronary artery disease. Genet Test Mol Biomarkers, 2015. 19(10): p. 556-60.
147. Drakopoulou, M., et al., Vulnerable plaque and inflammation: potential clinical
strategies. Curr Pharm Des, 2011. 17(37): p. 4190-209.
148. Sun, H., et al., Attenuation of atherosclerotic lesions in diabetic apolipoprotein E-
deficient mice using gene silencing of macrophage migration inhibitory factor. J Cell
Mol Med, 2015. 19(4): p. 836-49.
149. Kaptoge, S., et al., C-reactive protein concentration and risk of coronary heart
disease, stroke, and mortality: an individual participant meta-analysis. Lancet, 2010.
375(9709): p. 132-40.
150. Yo, C.H., et al., Value of high-sensitivity C-reactive protein assays in predicting atrial
fibrillation recurrence: a systematic review and meta-analysis. BMJ Open, 2014. 4(2):
p. e004418.
151. Libby, P., P.M. Ridker, and G.K. Hansson, Progress and challenges in translating the
biology of atherosclerosis. Nature, 2011. 473(7347): p. 317-25.
152. Ridker, P.M., A Test in Context: High-Sensitivity C-Reactive Protein. J Am Coll
Cardiol, 2016. 67(6): p. 712-23.
153. Ridker, P.M., et al., Inflammation, aspirin, and the risk of cardiovascular disease in
apparently healthy men. N Engl J Med, 1997. 336(14): p. 973-9.
154. Ridker, P.M., et al., Comparison of C-reactive protein and low-density lipoprotein
cholesterol levels in the prediction of first cardiovascular events. N Engl J Med, 2002.
347(20): p. 1557-65.
155. Siasos, G., et al., Inflammatory mechanisms in atherosclerosis: the impact of matrix
metalloproteinases. Curr Top Med Chem, 2012. 12(10): p. 1132-48.
156. Parks, W.C., C.L. Wilson, and Y.S. Lopez-Boado, Matrix metalloproteinases as
modulators of inflammation and innate immunity. Nat Rev Immunol, 2004. 4(8): p.
617-29.
157. Stetler-Stevenson, W.G., Tissue inhibitors of metalloproteinases in cell signaling:
metalloproteinase-independent biological activities. Sci Signal, 2008. 1(27): p. re6.
158. Murphy, G., Tissue inhibitors of metalloproteinases. Genome Biol, 2011. 12(11): p.
233.
159. Lambert, E., et al., TIMPs as multifacial proteins. Crit Rev Oncol Hematol, 2004.
49(3): p. 187-98.

73
160. Brew, K. and H. Nagase, The tissue inhibitors of metalloproteinases (TIMPs): an
ancient family with structural and functional diversity. Biochim Biophys Acta, 2010.
1803(1): p. 55-71.
161. Ries, C., Cytokine functions of TIMP-1. Cell Mol Life Sci, 2014. 71(4): p. 659-72.
162. Kramer, F. and H. Milting, Novel biomarkers in human terminal heart failure and
under mechanical circulatory support. Biomarkers, 2011. 16 Suppl 1: p. S31-41.
163. Mardare, C., et al., Endurance and Resistance Training Affect High Fat Diet-Induced
Increase of Ceramides, Inflammasome Expression, and Systemic Inflammation in
Mice. J Diabetes Res, 2016. 2016: p. 4536470.
164. Anand, S.S., et al., Relationship of metabolic syndrome and fibrinolytic dysfunction to
cardiovascular disease. Circulation, 2003. 108(4): p. 420-5.
165. Anand, S.S., et al., Relationship of metabolic syndrome and fibrinolytic dysfunction to
cardiovascular disease. Circulation, 2003. 108(4): p. 420-5.
166. Weyrich, A.S., et al., Activated platelets signal chemokine synthesis by human
monocytes. J Clin Invest, 1996. 97(6): p. 1525-34.
167. Beer, L., et al., Bioinformatics approach for choosing the correct reference genes
when studying gene expression in human keratinocytes. Exp Dermatol, 2015. 24(10):
p. 742-7.
168. Bacha, F., et al., In vivo insulin sensitivity and secretion in obese youth: what are the
differences between normal glucose tolerance, impaired glucose tolerance, and type 2
diabetes? Diabetes Care, 2009. 32(1): p. 100-5.
169. Diabetes Prevention Program Research, G., REDUCTION IN THE INCIDENCE OF
TYPE 2 DIABETES WITH LIFESTYLE INTERVENTION OR METFORMIN. The New
England journal of medicine, 2002. 346(6): p. 393-403.
170. Benigni, F., et al., The proinflammatory mediator macrophage migration inhibitory
factor induces glucose catabolism in muscle. J Clin Invest, 2000. 106(10): p. 1291-
300.
171. Herder, C., et al., Association of systemic concentrations of macrophage migration
inhibitory factor with impaired glucose tolerance and type 2 diabetes: results from the
Cooperative Health Research in the Region of Augsburg, Survey 4 (KORA S4).
Diabetes Care, 2006. 29(2): p. 368-71.
172. Kemna, E., et al., Time-course analysis of hepcidin, serum iron, and plasma cytokine
levels in humans injected with LPS. Blood, 2005. 106(5): p. 1864-6.
74
173. Wilke, T., et al., Epidemiology of urinary tract infections in type 2 diabetes mellitus
patients: An analysis based on a large sample of 456,586 German T2DM patients. J
Diabetes Complications, 2015. 29(8): p. 1015-23.
174. Chen, P.C., et al., An Elevated Glycemic Gap is Associated With Adverse Outcomes in
Diabetic Patients With Community-Acquired Pneumonia. Medicine (Baltimore), 2015.
94(34): p. e1456.
175. Hamilton, E.J., et al., Incidence and predictors of hospitalization for bacterial
infection in community-based patients with type 2 diabetes: the fremantle diabetes
study. PLoS One, 2013. 8(3): p. e60502.
176. Butranova, O.I. and T.N. Razdrogina, Antibiotics for skin and soft tissues infections in
type 2 diabetes mellitus. Int J Risk Saf Med, 2015. 27 Suppl 1: p. S57-8.
177. Dos Santos, V.P., D.R. da Silveira, and R.A. Caffaro, Risk factors for primary major
amputation in diabetic patients. Sao Paulo Med J, 2006. 124(2): p. 66-70.
178. Jefferis, B.J., et al., Prospective study of matrix metalloproteinase-9 and risk of
myocardial infarction and stroke in older men and women. Atherosclerosis, 2010.
208(2): p. 557-63.
179. Moore, C.S. and S.J. Crocker, An alternate perspective on the roles of TIMPs and
MMPs in pathology. Am J Pathol, 2012. 180(1): p. 12-6.
180. Vanhoutte, D. and S. Heymans, TIMPs and cardiac remodeling: 'Embracing the
MMP-independent-side of the family'. J Mol Cell Cardiol, 2010. 48(3): p. 445-53.
181. Hansson, J., et al., Biomarkers of extracellular matrix metabolism (MMP-9 and TIMP-
1) and risk of stroke, myocardial infarction, and cause-specific mortality: cohort
study. PLoS One, 2011. 6(1): p. e16185.
182. Martin, D.C., et al., Insulin-like growth factor II signaling in neoplastic proliferation
is blocked by transgenic expression of the metalloproteinase inhibitor TIMP-1. J Cell
Biol, 1999. 146(4): p. 881-92.

75
10 Abbreviations
ACE Angiotensin-converting-enzyme
ACOG American College of Obstetricians and Gynecologists
ADA American Diabetes Association
ADAMs A disintegrin and metalloproteinase
ADAMTS Disintegrin metalloproteinases with thrombospondin motifs
ARB Angiotensin receptor blocker
a-SMA Alpha-Smooth muscle actin
ATP Adenosine triphosphate
BMI Body mass index
CD Cluster of differentiation
cDNA Complementary deoxyribonucleic acid
CVD Cardiovascular disease
DCCT Diabetes control and complications trial
DM Diabetes mellitus
DSME Diabetes self-management education
ECG Electrocardiogram
EGFP Enhanced green fluorescent protein
ELISA Enzyme-linked immunosorbent assay (ELISA)
F2,6BP Fructose 2,6-bisphosphate
GADA Glutamic acid decarboxylase
GDM Gestational diabetes mellitus
GFR Glomerular filtration rate
GLP-1 Glucagon like peptide-1
GLUT-1 Glucose transporter 1
GM-CSF Granulocyte macrophage-colony stimulating factor
HbA1c Haemoglobin A1c

76
HDL High-density lipoprotein
HIV Human immunodeficiency virus
HNF-1α Hepatocyte nuclear transcription factor 1α
HNF-1β Hepatocyte nuclear transcription factor 1β
HNF-4α Hepatocyte nuclear transcription factor 4α
HRP Horse-radish peroxidase
hsCRP High sensitivity C-reactive protein
IA-2A Islet antigen-2 antibody
IAA Anti-insulin-autoantibodies
IADPSG International Association of Diabetes and Pregnancy Study
Groups
ICA Islet cell autoantibodies
IFG Impaired fasting glucose
IFN-γ Interferon-γ
IGF Insulin-like growth factor
IGF-BP3 Insulin-like growth factor -binding protein 3
IGT Impaired glucose tolerance
IL-1 Interleukin-1
IL-6 Interleukin-6
INS1 Insulin gene 1
IPF-1 Insulin promoter factor-1
LADA Late onset Autoimmune Diabetes in the Adult
LDL Low-density lipoprotein
LGA Large-for-gestational-age
LPS Lipopolysaccharide
MAC Anti-macrophage antibody
MCP-1 Monocyte chemoattractant protein-1
MHC Major histocompatibility complex
MIF Macrophage migration inhibitory factor
MMP-9 Matrix metalloproteinase-9
77
MODY Maturity Onset Diabetes of the Young
NDDG National Diabetes Data Group
NIH National Institutes of Health
OGTT Oral glucose tolerance test
PBMC Peripheral Blood Mononuclear Cell
PCR Polymerase chain reaction
PHA Phytohaemagglutinin
qPCR Quantitative polymerase chain reaction
RNA Ribonucleic acid
ROS Reactive oxygen species
RT-PCR Real-time polymerase chain reaction
SCID Severe combined immunodeficiency
SMBG Self-monitoring of blood glucose
TIMP Tissue inhibitors of metalloproteinases
TMB 3,3′,5,5′-Tetramethylbenzidine
TNF-α Tumor necrosis factor-α
TSH Thyroid-stimulating hormone
UDM Undiagnosed diabetes
UKPDS UK Prospective Diabetes Study
VCAM-1 Vascular cell adhesion molecule-1,
WGKK Wiener Gebietskrankenkasse
WHO World Health Organisation
ZnT-8 Zinc transporter 8

78
11 Curriculum Vitae
Elisabeth Maria Simader
PERSONAL BACKGROUND
Nationality: Austria
Family Status: unmarried
Date and Place of Birth: August 24th
, 1990, Vöcklabruck, Austria
EDUCATION
1997 – 2001 Elementary School, Vöcklamarkt, Austria
2001 – 2009 Federal Austrian High School (BG Vöcklabruck) with emphasis on
modern languages, Austria
2009 Matura (high school graduation)
2009 – 2010 Student at the University of Business and Administration of Vienna,
WU, Austria
2010 – Present Medical Student at the Medical University of Vienna, MUW Austria
2013 – 2015
2016 – Present
Student Research Fellow at the Christian Doppler Laboratory for
Diagnosis and Regeneration of Cardiac and Thoracic Diseases, Medical
University of Vienna, Austria
Student Research Assistant at the FFG-Project "Aposec", Medical
University of Vienna, Austria
CLINICAL TRAINING
2012/07 Clinical Clerkship at the Department of Surgery, Empress Elisabeth
Hospital, Vienna, Austria (4 weeks)
2012/08 Clinical Clerkship in Primary Care, Dr. Maria Gremmel, Vienna,
Austria (2 weeks)
2013/07 Clinical Clerkship at the Department of Emergency Medicine, State

79
Hospital Vöcklabruck, Austria (2 weeks)
2013/08 Clinical Clerkship at the Department of Cardiology, Hospital of
Merciful Sisters, Vienna, Austria (4 weeks)
2013/02
2014/08
Student Surgery Assistant at the University Clinic of Transplantation,
General Hospital Vienna, Medical University of Vienna, Austria
Clinical Clerkship at the Department of General Surgery, Prince of
Wales Hospital, Chinese University of Hong Kong, Hong Kong (4 weeks)
CONTINUING EDUCATION
2013/01 Internal intensive medicine-training, Univ.-Prof. Dr.med.univ. Thomas
Staudinger, Medical University of Vienna, Austria
2013/07
Summer School/Emergency Simulation Training, General Hospital Linz,
Austria
2014/04
2014/05
2014/11
Methodenseminar: “Molekularbiologie“- Methods Seminar „Molecular
Biology“, Medical University of Vienna, Austria
Methodenseminar: “Statistik” – Methods Seminar “Statistics”-
Dr.rer.nat. Angelika Geroldinger, Medical University of Vienna, Austria
Biometry II: Statistical Testing, PE-Seminar, Medical University of
Vienna
ETHICS COMMITTEE APPROVAL
“Changes in the biological function of peripheral mononuclear cells in diabetes mellitus”
EK Nr. 1510/2013, Ethics Committee Medical University of Vienna
CONGRESSES AND MEETINGS
2014/6
2014/12
55. Österreichischer Chirurgenkongress, Gesellschaft für Chirurgie, Graz
Poster Presentation as representative of Dr. Matthias Zimmermann -
Bone conditioned medium increases proteoglycan-4 (lubricin) in
mesenchymal cells via TGF-betaR1
4th EACTS Meeting on Cardiac and Pulmonary Regeneration and Stem
Cell Technology, Bern
80
2015/6
Jahrestagung der ÖKG - Österreichische Kardiologische Gesellschaft,
Salzburg
Poster presentation in basic science -
Difference in MIF production by PBMC in patients with Diabetes
mellitus type II
AWARDS AND GRANTS
2014/01 Advancement Scholarship – Medical University Vienna, Austria
2014/01 Research Scholarship – Christian Doppler Laboratory for Cardiac and
Thoracic Diagnosis and Regeneration, Medical
University of Vienna, Austria
2014/07
2015/01
2015/07
Research Scholarship – Christian Doppler Laboratory for Cardiac and
Thoracic Diagnosis and Regeneration, Medical
University of Vienna, Austria
Research Scholarship – Christian Doppler Laboratory for Cardiac and
Thoracic Diagnosis and Regeneration, Medical
University of Vienna, Austria
Research Scholarship – Christian Doppler Laboratory for Cardiac and
Thoracic Diagnosis and Regeneration, Medical
University of Vienna, Austria
TEACHING ACTIVITY
2016/02 – 2016/07
2016/02 – 2016/07
2015/10 – 2016/02
Tutor at the Medical University of Vienna,
University Clinic of medical Education and Training
OSCE exam preparation assistant for Surgical skills
Tutor at the Medical University of Vienna,
University Clinic of Anaesthesia for Dyspnoea
Tutor at the Medical University of Vienna,
University Clinic of Anaesthesia for Surgical skills, Blood serology,
Performance diagnostics

81
2015/09 – 2015/09
2015/07 – 2015/07
2015/02 – 2015/07
2014/10 – 2015/02
2013/10 – 2014/02
Tutor at the Medical University of Vienna,
University Clinic of medical Education and Training
Return Week exam assistant
Tutor at the Medical University of Vienna,
University Clinic of medical Education and Training
Return Week exam assistant
Tutor at the Medical University of Vienna,
University Clinic of medical Education and Training
OSCE exam preparation assistant for Surgical skills
Tutor at the Medical University of Vienna,
University Clinic of Anaesthesia, Surgical skills, Blood serology, ECG,
Spirometry
Tutor at the Medical University of Vienna,
University Clinic of Anaesthesia, Surgical skills, Blood serology
SCIENTIFIC EXCURSIONS
2013/7 APOSEC study, Kaposvar, Hungary
CURRENT STUDIES
Diploma thesis on: Changes in the protein secretion and gene expression of peripheral blood
mononuclear cells in diabetic patients
PUBLICATIONS
Analysis of the Secretome of Apoptotic Peripheral Blood Mononuclear Cells: Impact of
Released Proteins and Exosomes for Tissue Regeneration.
Beer L, Zimmermann M, Mitterbauer A, Ellinger A, Gruber F, Narzt MS, Zellner M,
Gyöngyösi M, Madlener S, Simader E, Gabriel C, Mildner M, Ankersmit HJ.
Scientific Reports 2015 Nov 16;5:16662. doi: 10.1038/srep16662.

82
METHODS
Cultivation of human cell lines
Immunohistochemistry
ELISA
PCR