
CHANGES IN SOIL CARBON STOCKS OF A NEW …flrc/workshops/15/Manuscripts/... · carbon sequestration...
19
1 CHANGES IN SOIL CARBON STOCKS OF A NEW ZEALAND GRAZED PASTURE IN RESPONSE TO VARIATIONS IN MANAGEMENT AND ENVIRONMENTAL FACTORS Miko U.F. Kirschbaum 1 , Susanna Rutledge 2 , Paul L. Mudge 3 , Nicolas Puche 1 , Louis A. Schipper 2 , David I. Campbell 2 1 Landcare Research, Private Bag 11052, Palmerston North, New Zealand; [email protected] 2 School of Science, University of Waikato, Private Bag 3105, Hamilton 3240, New Zealand 3 Landcare Research, Private Bag 3127, Hamilton 3240, New Zealand Abstract. Dairy farming is New Zealand‟s pre-eminent primary industry. It achieves large export earnings but is also responsible for a large proportion of the country‟s greenhouse gas emissions. One of those greenhouse gases is CO 2 , and in order to lower New Zealand‟s net greenhouse gas emissions, it is important to identify any management options that can lead to carbon sequestration in pasture soils and thereby minimise net CO 2 emissions to the atmosphere. It is equally important to understand what factors could lead to losses of soil carbon from pasture soils and thereby add further to New Zealand‟s CO 2 emissions. We addressed these questions by using two years of observations from an eddy-covariance system on a dairy farm in the Waikato that provided estimates of the exchanges of water and CO 2 with the atmosphere. We used CenW 4.1, a process-based ecosystem model, to describe these observations in terms of their biophysical drivers and the interactions between them. Agreement between the model and observations was excellent, especially for evapotranspiration and net photosynthesis, for which 91% and 79% of observed daily variations could be explained. The validated model was then used to run different scenarios to assess the effects on soil organic carbon of changes in the application of fertiliser and irrigation water, grazing scheduling, differences in plant-internal resource allocation, and changes in temperature and CO 2 concentration. We found that it was important to consider the combined effect of changes in net primary production, the amount of carbon taken off-site through grazing, the proportion of carbon allocated to pools, especially pools in the soil, that facilitates the stabilisation of carbon in organic matter, and any changes in the rate of organic matter decomposition. Soil organic carbon stocks were positively correlated with rates of fertiliser application and with the rate of water application (rain or irrigation) up to some moderate water application rates. For other changes in key properties, changes in soil organic carbon were often negatively correlated with changes in milk production. That was clearly evident for changes in the grazing regime and in plant root:shoot ratios. Anticipated environmental changes, such as increases in temperature and CO 2 concentration, and both increases and decreases in precipitation from moderate values had either neutral or detrimental effects on soil organic carbon stocks. Milk production was generally more positively affected under most environmental changes. Key words: CenW, CO 2 concentration, fertiliser, grazing, irrigation, model, temperature
Transcript of CHANGES IN SOIL CARBON STOCKS OF A NEW …flrc/workshops/15/Manuscripts/... · carbon sequestration...
1
CHANGES IN SOIL CARBON STOCKS OF A NEW ZEALAND
GRAZED PASTURE IN RESPONSE TO VARIATIONS IN
MANAGEMENT AND ENVIRONMENTAL FACTORS
Miko U.F. Kirschbaum1, Susanna Rutledge
2, Paul L. Mudge
3, Nicolas Puche
1,
Louis A. Schipper2, David I. Campbell
2
1Landcare Research, Private Bag 11052, Palmerston North, New Zealand;
[email protected] 2School of Science, University of Waikato, Private Bag 3105, Hamilton 3240, New Zealand
3Landcare Research, Private Bag 3127, Hamilton 3240, New Zealand
Abstract.
Dairy farming is New Zealand‟s pre-eminent primary industry. It achieves large export
earnings but is also responsible for a large proportion of the country‟s greenhouse gas
emissions. One of those greenhouse gases is CO2, and in order to lower New Zealand‟s net
greenhouse gas emissions, it is important to identify any management options that can lead to
carbon sequestration in pasture soils and thereby minimise net CO2 emissions to the
atmosphere. It is equally important to understand what factors could lead to losses of soil
carbon from pasture soils and thereby add further to New Zealand‟s CO2 emissions.
We addressed these questions by using two years of observations from an eddy-covariance
system on a dairy farm in the Waikato that provided estimates of the exchanges of water and
CO2 with the atmosphere. We used CenW 4.1, a process-based ecosystem model, to describe
these observations in terms of their biophysical drivers and the interactions between them.
Agreement between the model and observations was excellent, especially for
evapotranspiration and net photosynthesis, for which 91% and 79% of observed daily
variations could be explained.
The validated model was then used to run different scenarios to assess the effects on soil
organic carbon of changes in the application of fertiliser and irrigation water, grazing
scheduling, differences in plant-internal resource allocation, and changes in temperature and
CO2 concentration. We found that it was important to consider the combined effect of changes
in net primary production, the amount of carbon taken off-site through grazing, the proportion
of carbon allocated to pools, especially pools in the soil, that facilitates the stabilisation of
carbon in organic matter, and any changes in the rate of organic matter decomposition.
Soil organic carbon stocks were positively correlated with rates of fertiliser application and
with the rate of water application (rain or irrigation) up to some moderate water application
rates. For other changes in key properties, changes in soil organic carbon were often
negatively correlated with changes in milk production. That was clearly evident for changes
in the grazing regime and in plant root:shoot ratios. Anticipated environmental changes, such
as increases in temperature and CO2 concentration, and both increases and decreases in
precipitation from moderate values had either neutral or detrimental effects on soil organic
carbon stocks. Milk production was generally more positively affected under most
environmental changes.
Key words: CenW, CO2 concentration, fertiliser, grazing, irrigation, model, temperature

2
Introduction
Dairy farming is New Zealand‟s largest export-earning primary-industry sector. The
profitability of dairying compared to sheep farming or commercial forestry, in particular, has
increased over recent decades, and it has become the dominant primary industry sector
(DairyNZ, 2012).
However, dairy farming is also the biggest contributor to New Zealand‟s net greenhouse gas
emissions, with emissions primarily due to nitrous oxide and methane (Kirschbaum et al.,
2012; MfE, 2014). Concern also relates to potential losses of soil organic carbon, and
Schipper et al. (2007) analysed archived soil samples and reported significant soil carbon
losses of 21 ± 18 (95% confidence intervals) tC ha-1
from flat dairy pastures in New Zealand.
At the same time, grazed pastures in hill country appear to have gained similar amounts of
carbon as those lost on flat dairy land (Schipper et al., 2010). In further more refined analyses,
Schipper et al. (2014) found that significant losses on flat land were confined to gley and
allophanic soils, with no significant differences between dairy and drystock. To date, no
readily apparent, and well-substantiated, reasons for either of those patterns have been
identified, but they clearly show that soil carbon stocks are not inherently constant, but can be
changed through pasture management or environmental changes.
The management of farms has been changing over the last few decades, with much greater
use of fertilisers (Parfitt et al., 2012), leading to higher pasture productivity and, together with
inclusion of increasing amounts of supplemental feed, have allowed higher stocking rates
(MacLeod and Moller, 2006; DairyNZ, 2012). Increasing areas of pasture are also being
irrigated. Environment conditions are also changing, with gradually rising temperatures and
slow, but persistent, increases in CO2 concentration (Hartmann et al., 2013). There is interest
in understanding how any of these external factors may have changed soil carbon stocks, or
whether management can be purposefully modified to increase soil carbon stocks and thereby
assist in the task of reducing net carbon emissions to the atmosphere and mitigate climate
change.
The challenge lies in understanding the
complex array of interacting factors (Fig. 1)
that together determine the trajectory of future
soil C. Individual external factors may change
any or all of the following:
1) the rate of carbon gain of the system,
principally through net primary
production, but it can also be
supplemented through imported feed. A
higher rate of carbon gain will make
more carbon available for organic
matter formation;
2) the proportion of biomass that is
harvested and taken off site, thereby
making it unavailable for organic matter
formation, versus the fraction retained
on site and remaining available for
organic matter formation. This also
affects nitrogen stocks and may thereby have an indirect effect on subsequent
productivity;
Figure 1: Conceptual interaction between the
different steps and components that together
determine soil C stocks.
Carbon gain
Export
N exportedRetained
SOC poolsLabile pools
OM turn-over
Environmentaland management
conditions
C lost
C lost
C lost SOCstocks

3
3) the proportion of carbon allocated to labile or more resistant pools. Surface deposition
of carbon, for example, can be relatively easily respired without organic matter
formation. Soil deposited carbon can more easily be incorporated into organic matter;
4) the specific rate of organic matter decomposition that can changes the rate at which
organic matter is lost from the soil.
The challenge lies in describing and quantifying each of these factors and weighing up their
combined net effect on soil carbon stocks. In the present work, we have used the ecosystem
model CenW vers. 4.1 to explore the carbon storage consequences of different feasible
management options. CenW is a detailed ecosystem model that includes all the essential
controlling factors of the gas exchange of any kind of vegetated surface and the interactions
between these factors (Kirschbaum, 1999). That includes detailed modelling of the soil, plant
canopy and animal grazing and follows the interacting cycles of carbon, water and nutrients
(Fig. 2).
We tested the model for an intensively studied
dairy farm located near Hamilton in New
Zealand‟s Waikato region. (Kirschbaum et al.,
2015). We then used the model to study
changes in soil carbon stocks in response to any
changes in key input variables.
It is important to keep in mind what a model
can and cannot do. Any model is essentially just
a sophisticated form of combining assumptions
and interpretations of the observed reality. We
can test it against observations under
experimental conditions, and that can build
confidence that the actual model
implementation provides a set of assumptions
and interpretations that are consistent with
observations. However, other assumptions
could be equally valid in explaining the set of available observations.
This presents a challenge when the model is used to extrapolate to conditions outside the
range of observation, which is being done in any kind of scenario analysis. The strength of the
model is its grounding in a set of fundamental relationships, such as conservation of mass -
that should hold under any circumstances - but other factors are less well constrained, such as
assumptions about plant-internal connections between different physiological variables, such
as resource allocation to different plant organs. It is necessary to include such inter-
connections, because realistic simulations about a wide range of external conditions must
include any relevant feedback processes, but it is often difficult to test the veracity of these
system-internal interactions that may not be directly observable, especially when the range of
observations covers only a narrow range of conditions.
The present simulations use the currently considered best set of assumptions about the
functioning of the system, but our scenario analysis would have led to different outcomes if
different assumptions about the system had been made that might have been equally adequate
in explaining the set of available present-day observations. Modelling is always a work in
progress. Models are continuously refined through testing against newer sets of observations.
That may force changes in the underlying assumptions, with possible implications for
scenario runs. The results shown here are the outcomes obtained using our best current
understanding, but that may have to be modified under emerging new knowledge.
Figure 2: Overview of CenW, showing the
major pools and fluxes in the system (modified
from Kirschbaum, 1999).

4
Materials and Methods
Modelling Details
CenW (Carbon, Energy, Nutrients, Water) is a process based model, combining the major
carbon, energy, nutrient and water fluxes in an ecosystem as shown in Figure 2 (Kirschbaum,
1999; Kirschbaum et al., 2015). The model‟s soil organic matter component is based on the
CENTURY model (Parton et al., 1987) which was originally developed for pasture systems.
The model combines these fluxes to simulate the carbon balance of a system over time. For
the present work, we used CenW version 4.1, which is available, together with its source code
and a list of relevant equations, from http://www.kirschbaum.id.au/Welcome_Page.htm.
The model runs on a daily time step. Major processes are carbon gain by plants through
photosynthesis and losses through autotrophic plant respiration, heterotrophic respiration by
soil organisms and respiration by grazing animals. These fluxes are modified through nutrient
and water balances. The model contains a fully integrated nitrogen cycle which allowed the
testing of the interaction between nutrient gains through fertiliser additions and biological
nitrogen fixation and nutrient losses from produce removal, leaching and gaseous losses.
Biological nitrogen fixation was assumed to be inversely proportional to the extent of
nitrogen limitation on plant productivity. When nitrogen was completely non-limiting, as it
might be with heavy fertiliser additions, biological nitrogen fixation reduces to zero. With
lower fertiliser additions, pastures become progressively more nitrogen limited, with
biological fixation rates commensurately increasing.
Soil water balances are also modelled in detail and can constitute an important constraint on
productivity. Water balances are affected by soil depth and water-holding capacity. Water is
gained by rainfall or irrigation and lost through evaporation from the soil surface or wet
foliage after rainfall, or through plant transpiration. If soil water exceeds the soil‟s water-
holding capacity, the excess is lost by deep drainage beyond the root zone.
To model grazed pastures, it was essential to appropriately deal with grazing events. At each
grazing event, it was assumed that animals consumed 55% of foliage (Pal et al., 2012), of
which 50% was assumed to be lost by respiration, 5% as methane (Kelliher and Clark, 2010)
and 18% removed in milksolids (Crush et al., 1992; Soussana et al., 2010; Zeeman et al.,
2010), with the conversion between carbon and milksolids based on Wells (2001). The
remaining 27% was assumed to be returned to the paddock in dung and urine. This separation
of fluxes was important for modelling carbon-stock changes as any removed carbon is not
available for soil carbon formation.
CenW was used and tested using detailed measurements from an experimental grazed dairy
farm in the Waikato region (Scott Farm 37.46°S 175.22°E). The experiment was conducted
over 2 years (2008-2009) with continuous measurements of carbon and water fluxes with an
eddy covariance tower. The paddocks were predominantly covered with perennial ryegrass
(Lolium perene) and white clover (Trifolium repens), the species that dominate New
Zealand‟s typical pastoral systems. Full details are provided by Mudge et al. (2011) and
Kirschbaum et al. (2015).
Statistics
The overall goodness of fit was described by giving model efficiency (EF), which was
determined as (Nash and Sutcliffe, 1970):

5
EF = 1 – 2
2
)(
)(
yy
yy
o
mo
where yo are the individual observations, ym the corresponding modelled values and y the
mean of all observations.
This statistical measure quantifies both tightness of the relationship between measured and
modelled data and assesses whether there is any consistent bias in the model. High model
efficiency can only be achieved when there is a tight relationship with little unexplained
random variation and little systematic bias.
Scenarios Used
The simulations shown here are all based on
the soil and environmental conditions
observed at our experimental site in the
Waikato. We used an 8-year weather sequence
that was used repeatedly for longer runs. That
approach ensured representation of inter-
annual variability while avoiding any
confounding effects by any climate-change
signal that might have been present in a longer
weather sequence.
Base plant and management conditions were
as specified in Table 1, including key
environmental variables (CO2 concentrations
and annual precipitation), management choices (fertiliser addition and grazing thresholds) and
empirically fitted target root:shoot ratios under nutrient-unstressed and stressed conditions as
obtained by Kirschbaum et al. (2015).
The model was run for 50 years under those base conditions which allowed all system
properties to come to some pseudo equilibrium state. Conditions were then changed according
to specified scenarios as detailed below, and the system was run for a further 50 years under
the new conditions. Reported responses for properties other than soil carbon stocks are the
average over the final 8 years of those simulations. Reported changes in soil organic carbon
are the average rates of change over the full 50-year simulation period under the new
conditions.
Fertiliser Addition
The base condition used an annual fertiliser application rate of 200 kgN ha-1
yr-1
, and we here
explored the effect of varying that application rate between 0 and 300 kgN ha-1
yr-1
. Fertiliser
was applied in three annual applications in late summer, early spring and early summer. It was
assumed that 25% of applied fertiliser would be lost by volatilisation as ammonia.
Grazing Threshold
To deal with the variable availability of animal feed, we used a flexible grazing routine that
assumed that grazing would commence when a certain threshold amount of feed was available
and that cows would graze 55% (Pal et al., 2012) of that available feed. The base condition
assumed that the feeding threshold was 2 tDM ha-1
. We explored the effect of varying that
threshold between 500 kgDM ha-1
to 3 tDM ha-1
, with the consistent assumption that cattle
would remove 55% of available feed before being moved off the grazed paddock.
Table 1: Base conditions for the simulations
shown here.
Variable Value
CO2 concentration 400 µmol mol-1
Annual precipitation 1214 mm yr-1
Fertiliser addition 200 kgN ha-1
yr-1
Grazing threshold 2 tDM ha-1
Target root:shoot (high N) 0.96
Target root:shoot (low N) 1.86

6
Target Root:Shoot Ratio
Plant biomass allocation was calculated based on the assumption that carbon allocation would
be varied by plants towards achieving certain target root:leaf ratios. Those target ratios
themselves are assumed to be variable, with more root growth under nutrient-limited
conditions, while allocation shifts towards more leaf growth when nutrition is adequate.
Without grazing, plants can generally maintain root:leaf ratios close to any set target values.
However, grazing removes foliage while leaving root biomass largely undisturbed. Grazing
thus alters root:leaf ratios to greatly exceed their target values. Following grazing, new growth
is then preferentially allocated to leaf growth until target root:leaf ratios are met again. Details
of this routine are described in Kirschbaum et al. (2015).
Under base conditions, root:leaf ratios were set to 0.96 for nutrient-sufficient conditions and
1.86 for notionally extremely nutrient-limited plants (Table 1) based on the parameter fitting
for our experimental site (Kirschbaum et al., 2015). We then explored the effect of changing
the non-stressed target ratios over the range from 0.5 to 2, while keeping the ratio of the
stressed and unstressed target ratios to that obtained in our parameter fitting (1.94 = 1.86 /
0.96).
These changes essentially correspond to changes in species composition towards species that
may naturally grow more or less roots, or changes within the dominant species through plant
breeding. This scenario thus does not describe a readily-implementable management change,
but explores the potential consequences of a more fundamental change in a system property.
Temperature Change
Temperature affects the rate of soil organic matter decomposition, plant processes through
direct physiological effects and indirectly through the rate of water loss in evapotranspiration
(e.g. Kirschbaum, 2000). We used the weather conditions observed at our experimental site
near Hamilton as the base condition and explored the effect of changes in temperature from a
cooling by 1°C to warming by 5°C.
To the extent that warming has indirect effects through changed water relations, it is critically
important to consider any changes in the absolute atmospheric humidity. If absolute humidity
remains constant while temperature is increasing, it would greatly increase the rate of water
loss and dry the soil, with possible effects on plant productivity and organic matter
decomposition rates. However, it is likely that atmospheric water vapour will increase with
any general increase in temperature so as to maintain a fairly constant relative humidity with
warming (Trenberth et al., 2007). This corresponds to maintaining a constant temperature
difference between daytime and overnight minimum temperatures.
In practice, this was done by taking absolute vapour pressures from the observed weather
record and calculating the dewpoint temperatures corresponding to those observed vapour
pressures. Dewpoint temperatures were then changed in line with any given temperature-
change scenario, and new absolute vapour pressures were calculated from the adjusted
dewpoint temperatures (Kirschbaum, 2000).
Atmospheric CO2 Concentration
The CO2 concentration has reached nearly 400 µmol mol-1
by 2014 and is increasing further
by about 2 µmol mol-1
yr-1
(Hartmann et al., 2013). We used 400 µmol mol-1
as the base
condition and explored the effect of varying CO2 concentration from 300 to 800 µmol mol-1
.
This covers the approximate range of CO2 concentrations from pre-industrial values to those
that might be experienced by the end of the 21st century.

7
Rainfall Plus Irrigation
The average annual rainfall at our standard site was 1214 mm yr-1
(Table 1), and we explored
the effects of the site receiving between half and twice as much as the actually observed
annual rainfall. To simulate rainfall less than the standard amount, observed daily rainfall was
simply reduced by an appropriate fraction to achieve respective target values.
To simulate rainfall in excess of the standard amount, additional irrigation water was added at
weekly intervals to achieve to respective annual target amounts. This approach ensured that
rainfall in excess of the standard amount also progressively eliminated any periods of drought.
If rainfall had simply been increased by a fractional amount, if would not have prevented
droughts from occurring. There are obvious problems in constructing scenarios of water
supply since the distribution of any rainfall + irrigation can have a strong bearing on the
effectiveness with which any amount of supplied water can be utilised. The specific scenario
given here therefore gives only one possible scenario under a given total amount of annual
water supply.
Results and Discussion
Model validation
The model was tested against 2 years of daily aggregated eddy covariance data and one year
of foliar biomass measurements (Fig. 3). Details of the experiment, the parameter fitting and
the challenges of appropriately capturing all carbon losses during grazing events have been
described by Kirschbaum et al. (2015). Evapotranspiration was modelled extremely well (Fig.
3a), with a model efficiency of 0.91 for daily comparisons and 0.96 for weekly averaged data
in a validation data set. The model was thus able to simulate the interaction between seasonal
and plant factors as well as short-term phenomena, such as responses to day-to-day changes in
the weather.
Photosynthetic carbon gain was also very well modelled, with model efficiencies of 0.79 and
0.84 for daily and weekly comparisons (Fig. 3b). This covered a wide range of values ranging
from near zero during a severe drought period in the first summer of the experiment, low
values of about 25 kgC ha-1
d-1
in the middle of winter and peaks of up to 125 kgC ha-1
d-1
during summer periods without water shortages Kirschbaum et al., 2015).
Getting agreement between modelled and observed respiratory carbon losses was more
problematic. Much of that related to the capture of grazing events that were highly episodic
and could release carbon at rates that were an order of magnitude greater than combined plant
and soil respiration rates. The challenges inher ent in the correct capture of these events
was described and illustrated in detail by Kirschbaum et al. (2015). Weekly-averaged
respiration rates could still be reasonably well described, with a model efficiency of 0.84,
while daily respiration rates could be described with a model efficiency of only 0.63, probably
owing to the challenge of full capture of all grazing events (Kirschbaum et al., 2015).
As a consequence, the simulation of combined carbon fluxes was not as good as the
simulation of carbon gain alone with model efficiencies of 0.54 and 0.56 for weekly and daily
values, respectively (Fig. 3c). The adequate modelling of carbon gain and loss with their
seasonal dynamics and response to important aspects of pasture management then allowed an
adequate description (EF=0.58) of the dynamics of foliar biomass (Fig. 3d). Overall, the
comparisons confirmed that CenW is an appropriate tool for describing the key dynamics of
grazed pastures and allowed its application for scenario analyses.

8
Changed Driving Variables
Having parameterised the model for our experimental site, it became possible to explore the
effect of some changes in key driving variables. These are presented and discussed in the
following.
Figure 3: Observed versus modelled rates of evapotranspiration (a), gross primary production (b), net
ecosystem production (c) and foliar biomass (d). Small symbols in (a) to (c) show daily observations
and larger symbols show weekly averaged data. Data in (a), (c) and (d) are shown for a
calibration data set with up-arrows and a validation data set with down-arrows. Gross primary
production was not explicitly included for model optimisation so that a distinction between
calibration and validation data sets would not be relevant. Net ecosystem production is the net
CO2 exchange of the pasture as a whole, with positive values indicated net uptake. The figure
has been drawn based on the data of Kirschbaum et al. (2015). “EF” refers to model
efficiency, and the subscripts „d‟ and „w‟ refer to daily and weekly data.
(c)
-60 -30 0 30 60-60
-30
0
30
60
Ob
serv
ed
net
eco
syste
m
pro
du
cti
vit
y (
kg
C h
a-1
d-1
)
Modelled net ecosystem
productivity (kgC ha-1
d-1
)
0 50 100 150
Ob
serv
ed
ph
oto
syn
thesis
rate
(kg
C h
a-1 d
-1)
0
50
100
150
Modelled photosynthesis
rate (kgC ha-1
d-1
)
(a)
0 2 4 6
0
2
4
6
Ob
serv
ed
evap
otr
an
sp
ira
tio
n
rate
(m
m d
-1)
Modelled evapotranspiration
rate (mm d-1
)
(b)
(d)
0 1000 2000 3000 4000
Ob
serv
ed
folia
r bio
mass
(kg
C h
a-1)
0
1000
2000
3000
4000
Modelled foliar
biomass (kgC ha-1
)
EFd = 0.56
EFw = 0.54
EFd = 0.91
EFw = 0.96
EFd = 0.79
EFw = 0.84
EF = 0.58
9
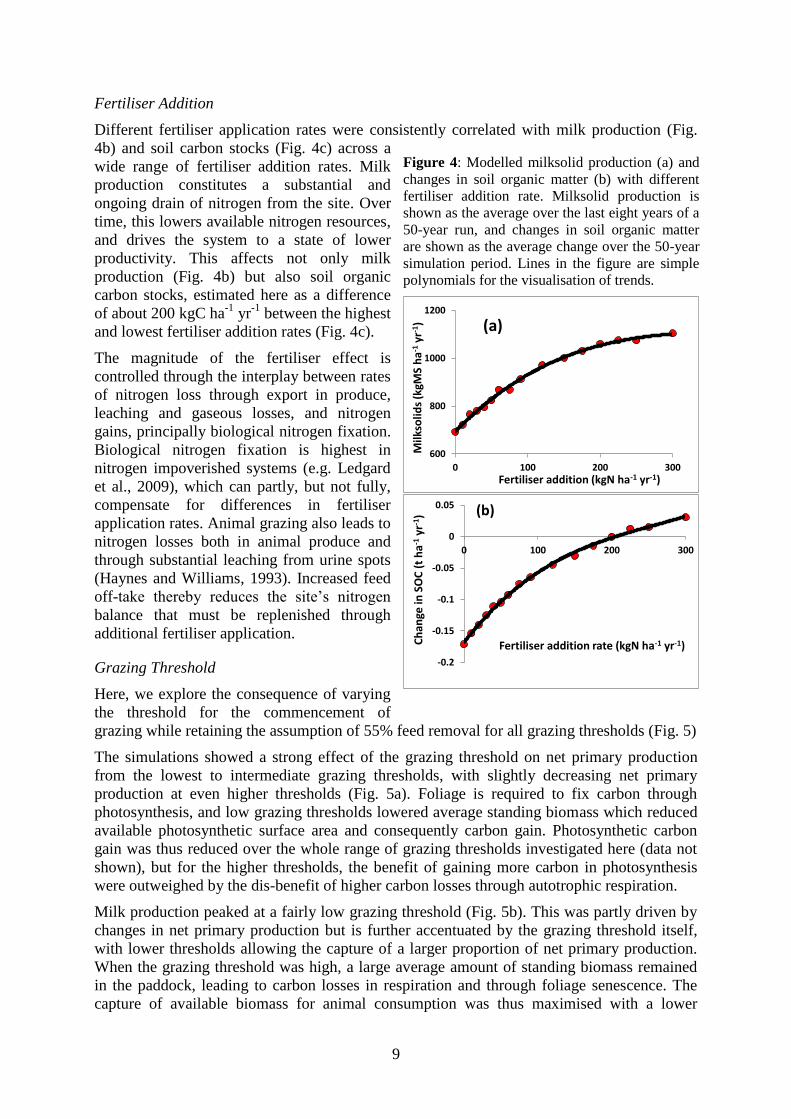
Fertiliser Addition
Different fertiliser application rates were consistently correlated with milk production (Fig.
4b) and soil carbon stocks (Fig. 4c) across a
wide range of fertiliser addition rates. Milk
production constitutes a substantial and
ongoing drain of nitrogen from the site. Over
time, this lowers available nitrogen resources,
and drives the system to a state of lower
productivity. This affects not only milk
production (Fig. 4b) but also soil organic
carbon stocks, estimated here as a difference
of about 200 kgC ha-1
yr-1
between the highest
and lowest fertiliser addition rates (Fig. 4c).
The magnitude of the fertiliser effect is
controlled through the interplay between rates
of nitrogen loss through export in produce,
leaching and gaseous losses, and nitrogen
gains, principally biological nitrogen fixation.
Biological nitrogen fixation is highest in
nitrogen impoverished systems (e.g. Ledgard
et al., 2009), which can partly, but not fully,
compensate for differences in fertiliser
application rates. Animal grazing also leads to
nitrogen losses both in animal produce and
through substantial leaching from urine spots
(Haynes and Williams, 1993). Increased feed
off-take thereby reduces the site‟s nitrogen
balance that must be replenished through
additional fertiliser application.
Grazing Threshold
Here, we explore the consequence of varying
the threshold for the commencement of
grazing while retaining the assumption of 55% feed removal for all grazing thresholds (Fig. 5)
The simulations showed a strong effect of the grazing threshold on net primary production
from the lowest to intermediate grazing thresholds, with slightly decreasing net primary
production at even higher thresholds (Fig. 5a). Foliage is required to fix carbon through
photosynthesis, and low grazing thresholds lowered average standing biomass which reduced
available photosynthetic surface area and consequently carbon gain. Photosynthetic carbon
gain was thus reduced over the whole range of grazing thresholds investigated here (data not
shown), but for the higher thresholds, the benefit of gaining more carbon in photosynthesis
were outweighed by the dis-benefit of higher carbon losses through autotrophic respiration.
Milk production peaked at a fairly low grazing threshold (Fig. 5b). This was partly driven by
changes in net primary production but is further accentuated by the grazing threshold itself,
with lower thresholds allowing the capture of a larger proportion of net primary production.
When the grazing threshold was high, a large average amount of standing biomass remained
in the paddock, leading to carbon losses in respiration and through foliage senescence. The
capture of available biomass for animal consumption was thus maximised with a lower
Figure 4: Modelled milksolid production (a) and
changes in soil organic matter (b) with different
fertiliser addition rate. Milksolid production is
shown as the average over the last eight years of a
50-year run, and changes in soil organic matter
are shown as the average change over the 50-year
simulation period. Lines in the figure are simple
polynomials for the visualisation of trends.
600
800
1000
1200
0 100 200 300
Milk
solid
s (k
gMS
ha
-1yr
-1)
Fertiliser addition (kgN ha-1 yr-1)
(a)
-0.2
-0.15
-0.1
-0.05
0
0.05
0 100 200 300
Ch
ange
in S
OC
(t
ha
-1yr
-1)
Fertiliser addition rate (kgN ha-1 yr-1)
(b)

10
grazing threshold. Large reductions in milk production were then seen both for the lowest and
highest grazing thresholds (Fig. 5b).
In contrast, soil carbon stocks increased
monotonically across the range of
investigated thresholds (Fig. 5c). Since a
lower grazing threshold allowed a greater
capture of biomass for animal feed, it thereby
reduced the amount available for organic
matter formation. Grazing not only removed
carbon off-site in produce (18% of ingested
feed), but it also enhanced carbon losses in
animal respiration (50% of ingested feed;
Soussana et al., 2010; Zeeman et al., 2010)
and methane emissions (5% of ingested feed;
Kelliher and Clark, 2010). Overall, trends in
milk production and soil organic carbon
stocks went largely in opposite directions
other than for very low grazing thresholds.
Target Root:Shoot Ratio
The simulations suggested that milk
production could be strongly affected by
changes in the root:shoot allocation ratio
(Fig. 6b), which is largely driven by a strong
effect of the root:shoot ratio on total net
primary production (Fig. 6a). In addition, the
changing ratio of biomass allocation itself
even further extends the effect on milk
production. Pastures with a high root:shoot
ratio not only fix less carbon than pastures
with lower ratios, but proportionately less of
that smaller amount of carbon is allocated to
foliage that can be grazed.
At the same time, the changes in soil organic
carbon are remarkably small, with changes of
less than 0.1 tC ha-1
yr-1
at all but the most
extreme ratios. Soil carbon is at a maximum
at an intermediate target root:shoot ratio
because at low root:shoot ratios, too little
carbon is allocated below ground with most carbon grazed and removed off-site. With higher
root:shoot ratios, the reduced productivity reduces the amount of carbon that is available for
organic matter formation. Soil carbon changes are so small because of the compensating
changes in net primary production (Fig. 6a) that decrease with increasing ratio and the
increasing below-ground allocation that obviously increases with the target ratio. With the
two key processes changing in opposite directions, there is relatively little overall change.
Plants need roots to obtain water and nutrients from the soil, and leaves to fix carbon, but
from a fodder production point of view, it could be beneficial if plants could allocate less of
their resources to roots and more to leaves that can be grazed and turned into economic
Figure 5: Modelled net primary production (a),
milksolid production (b), and changes in soil
organic matter (c) for different grazing thresholds.
Other details as described in the Legend of Fig. 4.
10
12
14
16
18
20
0 1000 2000 3000
Net
pri
mar
y p
rod
uct
ion
(t
DM
ha
-1yr
-1)
Grazing threshold (kgDM ha-1)
(a)
0
200
400
600
800
1000
0 1000 2000 3000
Milk
solid
s (k
gMS
ha
-1yr
-1)
Grazing threshold (kgDM ha-1)
(b)
-0.6
-0.5
-0.4
-0.3
-0.2
-0.1
0
0.1
0.2
0 1000 2000 3000
Ch
ange
in S
OC
(t
ha
-1yr
-1)
Grazing threshold (kgDM ha-1)
(c)

11
produce provided that there are enough roots for effective water and nutrient uptake. The
simulations here are based on systems limited by water or nitrogen limitations. Both of these
are very mobile in the soil (e.g. Wilkinson and Lowrey, 1973) so that sufficient water and
nutrient uptake could be achieved with a much smaller root system. It means that whole-
sward productivity could be maximised with less investment in root growth. However,
systems limited by phosphorus, which is much less mobile in the soil (e.g. Wilkinson and
Lowrey, 1973), may require greater root mass in the soil to adequately access available
resources for optimum sward growth.
Increased sward productivity with less root
allocation may thus not eventuate in
phosphorus-limited systems. However, the
modelled effects are likely to be only realistic
under conditions where the primary non-
photosynthetic limitations of net primary
production are through water and nitrogen
availability. Greater proliferation of roots is
of little use for overall pasture production
because both water and nitrogen (in NO3-
form) are very mobile in the soil and their
availability and uptake would not be
increased by greater proliferation of roots.
Increased rooting depth might well be
beneficial but greater abundance of roots in
the primary upper soil-layer root zone would
not be. This situation would change
somewhat if the primary limitation were
phosphorus or other less-mobile elements in
the soil, but the simulations shown here are
based on limitation by nitrogen as the
primary mineral limitation.
And one may further ask why pasture plants
have such extensive root systems if it is of
little benefit for overall production. That is
where optimality between individual-plant
and total swards needs to be considered (see
King, 1993). While total swards would not
obtain increasing amounts of nitrogen or
water through greater root proliferation, any
individual plants with more roots will
nonetheless obtain a greater share of the
available resources, thus forcing individual
plants into a growth strategy that would be
less than optimal for stands as a whole (King,
1993).
The simulations here also retain a constant relative depth distribution with changing overall
root allocation. There may, however, be benefits for plants to access deeper water in the soil
during drought periods, but that is related to the vertical distribution of roots in the soil rather
than the proportional allocation of plant resources to roots versus shoots. These simulations
Figure 6: Modelled net primary production (a),
milksolid production (b), and changes in soil
organic matter (c) for different root:shoot
allocation ratios.
10
12
14
16
18
20
22
0 0.5 1 1.5 2
Net
pri
mar
y p
rod
uct
ion
(t
DM
ha
-1yr
-1)
Target root:shoot
(a)
0
500
1000
1500
0 0.5 1 1.5 2
Milk
solid
s (k
gMS
ha-1
yr-1
)
Target root:shoot
(b)
-0.15
-0.1
-0.05
0
0.05
0 0.5 1 1.5 2
Ch
ange
in S
OC
(t
ha
-1yr
-1)
Target root:shoot
(c)

12
thus provide no information, and do not discount the possibility, of any possible positive
effects if roots could grow to greater depths than their typical more shallow growth habit.
Temperature Change
Peak production was modelled for a warming
by about 1 °C, but for moderate temperature
changes between -1 to +3 °C, changes in net
primary production were only slight (Fig. 7a).
Productivity decreased more strongly for
even larger temperature increases (> 3°C) due
to a combination of direct physiological
temperature effects and indirect effects
through increased rates of water use that
could eventually lead to increased water
stress.
Milk production showed a trend similar to
that for net primary production (Fig. 7b), but
it was even slightly more strongly affected by
warming because of seasonal shifts in
productivity. With warming, productivity was
reduced in summer and autumn, mainly due
to increasing water stress, while production
was increased in winter and spring (data not
shown). Overall, these shifts caused a slight
reduction in the efficiency with which fixed
carbon could be utilised in grazing and milk
production. Any possible direct effects of
heat stress on cow metabolism were not
included in these simulations.
At the same time, while the total amount of
carbon gained did not change much with
temperature (Fig. 7a), soil organic carbon
stocks nonetheless decreased monotonically
with increasing temperature. This was
principally related to the stimulation of
organic matter decomposition rates with
increasing temperature, which led to an
increasing rate of carbon loss from the system
(Fig. 7c). That rate of loss was even further
steepened at the highest temperatures when
lowered productivity further added to the adverse effects on soil carbon dynamics.
Figure 7: Modelled net primary production (a),
milksolid production (b), and changes in soil
organic matter (c) in response to changing
temperature. Simulation runs as described in the
text and the Legend of Fig. 4.
10
12
14
16
18
20
-1 1 3 5N
et p
rim
ary
pro
du
ctio
n
(tD
M h
a-1
yr-1
)Temperature change (oC)
(a)
0
200
400
600
800
1000
1200
-1 1 3 5
Milk
solid
s (k
gMS
ha
-1yr
-1)
Temperature change (oC)
(b)
-0.5
-0.3
-0.1
0.1
-1 1 3 5
Ch
ange
in S
OC
(t
ha
-1yr
-1) Temperature change (oC)
(c)

13
Atmospheric CO2 Concentration
In these simulations, we assessed the
response to changes in atmospheric CO2
concentration from a pre-industrial 300 to a
likely late-21st century concentration of 800
µmol mol-1
, which is twice the current
concentration. These changes in the
atmospheric CO2 concentration had a
moderate effect on net primary production
with a change by about 20% across this wide
range of CO2 concentrations (Fig. 8a), while
milk production changed almost two-fold
(Fig. 8b). The strong stimulation of milk
production was related to a changing
proportion of fixed carbon that could be
captured in grazing (Fig. 8d). At the lowest
CO2 concentration, only about 50% of net
primary production was grazed and used for
milk production, but that proportion could be
increased to almost 70% at the highest CO2
concentration.
There was a synergistic effect with greater net
primary productivity also enhancing the ease
with which that carbon could be captured in
grazing. Under the defined grazing regime,
total biomass remained similar irrespective of
changes in productivity – the key difference
was the number of times that it was grazed.
With low productivity, standing biomass
remained on site for an extended period while
continuing to lose carbon through respiration
and (mainly root-) senescence. That loss
adversely affected the ratio of removed to
total produced biomass. Increasing
productivity shortened the interval between
grazing events thus reducing those
unproductive losses. Hence, the proportion of
biomass grazed increased with increasing
productivity, leading to a double benefit of
increased CO2 concentration on milk
production.
It was even further enhanced through some
changes in the seasonality of production, with
elevated CO2 shifting productivity from
winter and spring towards increased
productivity in summer and autumn by
preventing water stress and thereby allowing greater productivity in the seasons that are
currently partly limited by water availability.
Figure 8: Modelled net primary production (c),
milksolid production (b), changes in soil organic
matter (c), and the fraction of NPP that is grazed
(d) under different atmospheric CO2
concentrations.
14
16
18
20
22
200 400 600 800
Net
pri
mar
y p
rou
ctio
n
(tD
M h
a-1yr
-1)
CO2 (mmol mol-1)
(a)
600
800
1000
1200
1400
1600
200 400 600 800
Milk
solid
s (k
gMS
ha
-1yr
-1)
CO2 (mmol mol-1)
(b)
y = 1.766E-09x3 - 3.086E-06x2 + 1.670E-03x - 2.989E-01R² = 7.820E-01
-0.05
-0.03
-0.01
0.01
200 400 600 800
Ch
ange
in S
OC
(t
ha
-1yr
-1) CO2 (mmol mol-1) (c)
0.4
0.5
0.6
0.7
200 400 600 800
Frac
tio
n o
f N
PP
gra
zed
CO2 (mmol mol-1)
(d)

14
At the same time, increasing CO2 concentration had almost no effect on soil carbon stocks
(Fig. 8c). While more carbon came into the system under elevated CO2 (Fig. 8a), a greater
proportion was also being removed (Fig. 8b) for only a trivial remaining effect on soil carbon.
Rainfall Plus Irrigation
With rainfall+irrigation of less than 500 mm
yr-1
, the model predicts no milk production at
all (Fig. 9b). Productivity was reduced to
such an extent that foliar biomass could not
reach the grazing threshold at all. Milk
production then increased sharply with
increasing rainfall+irrigation to reach
maximal values with about 1000-1500 mm
yr-1
and plateaued with further increases in
rainfall+irrigation.
Net primary production followed a similar
pattern (Fig. 9a), but was reduced to a lesser
extent at the lowest amounts of
rainfall+irrigation, with nearly half maximal
productivity still possible with 500 mm yr-1
,
and with rainfall+irrigation above 1000 mm
yr-1
, net primary production actually
decreased marginally with further increases in
rainfall due to increased nitrate leaching and
some decrease in productivity caused by
water-logging.
Soil organic carbon stocks also increased
with rainfall+irrigation for low annual totals,
but showed a peak at rainfall+irrigation of
about 750 mm yr-1
before falling quite
sharply with further increases in
rainfall+irrigation (Fig. 9c). This was due to
the combination of effects on net primary
production and a direct stimulation of organic
matter decomposition by preventing moisture
limitations of decomposition, especially over
the summer months.
With increasing rainfall+irrigation from 500
to 700 mm yr-1
, the positive effect of
increasing carbon input dominated the
response and led to increasing soil organic carbon. However, for increases in
rainfall+irrigation beyond 700 mm yr-1
, effects on net primary production became minor, yet
the soil remained moist for more of the year and conducive for organic matter decomposition,
which led to a loss of soil organic carbon. Consequently, for soil organic carbon stocks, the
most favourable combination of carbon input and decomposition rate was found at an
intermediate level of rainfall+irrigation (Fig. 9c).
Figure 9: Modelled net primary production (c),
milksolid production (b), and changes in soil
organic matter (b) with different amounts of
rainfall + irrigation. Simulation runs as described
in the text and the Legend of Fig. 4.
0
5
10
15
20
0 500 1000 1500 2000 2500
Net
pri
mar
y p
rod
uct
ion
(t
DM
ha
-1yr
-1)
Rainfall + irrigation (mm yr-1)
(a)
0
500
1000
1500
0 500 1000 1500 2000 2500
Milk
solid
s (k
gMS
ha
-1yr
-1)
Rainfall + irrigation (mm yr-1)
(b)
-0.3
-0.2
-0.1
0
0.1
0.2
0 500 1000 1500 2000 2500
Ch
ange
in S
OC
(t
ha-1
yr-1
) Rainfall + irrigation (mm yr-1) (c)

15
General Discussion
It was generally possible to obtain good agreement between model and measurements,
including evapotranspiration rates, photosynthetic carbon gain, net ecosystem carbon
exchange and resultant foliar biomass (Fig. 3). The model structure includes relevant within-
system feedbacks and interactions between key processes and system component (Fig. 2). In
particular, it explicitly models the key processes where changes in external conditions or
internal aspects of the system could affect soil organic carbon storage. This model structure,
together with the good agreement with observations, gives us the necessary confidence to
model the response of the system to changes in various key drivers.
In principle, soil carbon stocks can be changed as a result of changes in the total amount of
carbon fixed by plants, through the proportion of carbon retained on the site vs the amount
exported and removed from the site in animal produce, through a change in the allocation of
carbon to resistant or more labile carbon pools, or through the rate at which organic matter
can decompose and be lost from the soil (Fig. 1). All of these can be important and may play a
greater or lesser role in controlling overall system carbon balances in response to specific
changes, and the ultimate effect on carbon storage is determined by the interplay between all
of them.
One of the simplest and most direct consequences of management decisions on soil carbon
stocks is related to fertiliser application rates as fertility affects soil-carbon stocks primarily
through changing the rate of net primary production. The export of milksolids removes not
only carbon but also nitrogen which, together with gaseous and leaching losses of nitrogen,
can impoverish the system over time as biological nitrogen fixation is not generally sufficient
to match the heavy rate of nutrient removal in a highly productive system. To prevent such
impoverishment requires consistent and large fertiliser inputs. With large fertiliser inputs, the
system can maintain high productivity (Fig. 4a, b) associated with high soil carbon stocks
(Fig. 4c). With lower fertiliser inputs, the system degrades and reaches a new steady state
with lower productivity and lower carbon stocks.
The situation is more complex if one considers the effect of the grazing threshold (Fig. 5) on
soil-carbon stocks. For very low grazing thresholds, productivity is reduced because pastures
are kept so short that they only inefficiently absorb available radiation (Fig. 5a), but that effect
saturates at reasonably low grazing thresholds, and there is little effect on productivity for
further changes in the threshold. Milk production, however, decrease with further increasing
thresholds (Fig. 5b) because larger standing biomass lead to the loss of carbon in
unproductive respiration and senescence as well as encouraging greater root growth. Reduced
milk production, however, benefits the carbon stocks on the site through increased on-site
carbon retention (Fig. 5c).
Increases in root:shoot ratios reduced total net primary production (Fig. 6a) because low
allocation to foliage kept the swards with insufficient leaf area for maximum photosynthetic
carbon gain while maintaining a large root system constituted and on-going respiratory carbon
loss that further reduced the net primary production of the sward. Greater root allocation
further reduced the amount foliage available for animal feed, thus further reducing milk
production (Fig. 6b).
Soil organic carbon stocks increased with increasing root:shoot ratios from the lowest ratios
up to a ratio of about 1 because the effect of gaining a greater share of fixed carbon (through
roots senescence and exudation) outweighed the disadvantage of reduced total net primary
production. At higher ratios, the negative effect of reduced overall net primary production
dominated, for highest soil organic carbon stocks at intermediate root:shoot ratios of about 1
to1.5.

16
In terms of the effects of changes in environmental factors, there was only a minor change in
net primary or milk production for moderate temperature changes by up to 3 °C, but
productivity was more sharply affected by temperature increases of 4° or more (Fig. 7a, b).
Despite there being only relatively minor temperature effects on carbon gain and a reduced
export of carbon in milk production, soil organic carbon stocks decreased monotonically for
any increases in temperature, in this case driven by the direct effect of temperature in
stimulating organic matter decomposition rates (Kirschbaum, 2000).
Under varying CO2 concentrations, modelled net primary production increase by about 20%
(Fig. 8a) over the wide range of CO2 concentrations from a pre-industrial 300 to a likely late-
21st century concentration of 800 µmol mol
-1, but, together with a substantial increase in the
proportion of carbon captured in grazing (Fig. 8d), this led to a very large increase in milk
production (Fig. 8b) with only trivial changes in soil organic carbon stocks. Soil carbon stocks
changed little because the effect of increased carbon gain at elevated CO2 (Fig. 8a) was
almost completely negated by the increased capture in grazing (Fig. 8d) and thus reduced
retention of carbon on-site.
It is thus quite remarkable that while the primary effect of elevated CO2 was to increase
carbon gain, both directly through increasing photosynthesis and indirectly by increasing
water use efficiency, yet the ultimate effects were dominated by the secondary effects related
to changed productivity, especially the substantial shift in the proportion of fixed carbon
captured in grazing, thus making it unavailable for on-site storage. Increased carbon gain thus
did not increase soil-carbon stocks at all. It highlights most starkly how the net effect of the
response to any change in the system can be anticipated only through consideration of the
comined effect of all direct and indirect effects and their interactions.
The response to precipitation was also quite complex. Starting from very low and very
limiting rainfall+irrigation of 500 mm yr-1
, net primary production, milk production and soil
organic carbon stocks all increased (Fig. 9). Further increases beyond about 1000 mm yr-1
had
only minor further effects on net primary production and milk production, but soil organic
carbon stocks decreased (Fig. 9a). This must have been primarily due to stimulation of
organic matter decomposition with increasing wetness of the soil, especially over the summer
months, that allowed ongoing decomposer activity throughout the year.
Overall, the simulations presented a very diverse picture, with overall responses that could be
dominated by direct effects on primary production, such as in the case of fertiliser additions
(Fig. 4), through changes in the proportion of carbon retained on-site, which was most
strongly expressed in response to changing CO2 concentration (Fig. 8), through the effect on
within site allocation patterns, such as in the response to varying root:shoot ratios (Fig. 6), or
through a stimulation of organic matter decomposition rates, which was most clearly seen in
the response to changing temperature (Fig. 7) or precipitation (Fig. 9). All of these are
important mechanisms, and the overall responses to any changes in any external or system
property can only be understood if all direct and indirect effects are simultaneously
considered in a combined assessment.
This work pointed to few management or environmental changes that might change to lead to
useful increases in soil organic carbon. Soil carbon was predicted to increase with increasing
fertiliser application rates (Fig. 4), but fertiliser application rates in New Zealand are already
high (Parfitt et al., 2012) so that there is little scope for further increases to increase either
productivity or carbon stocks, and even current application rates already lead to a raft of
environmental problems.

17
The simulations did suggest that soil carbon could be increased through increasing the grazing
threshold (Fig. 5), but only at the expense of significant reductions in milk production.
Similarly, modifications to target root:shoot ratios (Fig. 6) hold some promise in terms of
increasing milk production, but organic carbon stocks are likely to decrease for either
increases or decreases in root:shoot ratios (Fig. 6c) either because of adverse effects on the
total amount of carbon fixed in net primary production or on the proportion of carbon retained
on-site.
Changes in rainfall+irrigation provide some scope for increasing soil carbon stocks (Fig. 9), at
least up to some intermediate level of water application. Irrigation is typically applied only on
sites that naturally receive very limiting amounts of rain. Under those conditions, added water
can substantially increase net primary production (Fig. 9a), milk production (Fig. 9b) and soil
organic carbon stocks (Fig. 9c).
The other environmental changes tested here showed little promise for increasing soil carbon
in future. In response to warming, there is the expected loss of soil carbon due to increasing
stimulation of organic matter decomposition by increasing temperature (Fig. 7). Increasing
CO2, however, is normally expected to lead to increasing carbon storage, but even with an
increase in net primary production (Fig. 8c), effects on soil carbon storage failed to
materialise (Fig. 8c) as the benefit of extra carbon gain was negated by a reduced proportion
of carbon retained within the site. With respect to rainfall changes, staring from moderate
amounts of natural rainfall, as is currently observed in Hamilton, both increases and decreases
in rainfall could lead to losses in soil organic carbon (Fig. 9).
Model testing, refinement and application to scenario testing is ongoing and continuing work.
That will use new data sets to test the currently used assumptions about system performance
and feedbacks, and explore addition scenarios for their potential to enhance site carbon
storage. Mitigation of greenhouse gas emissions continues to be an important task, and our
work continues to search for ways to harness the potential of the biosphere to assist in that
mission.
Conclusions
The work here showed that CenW simulations can provide modelling results that are
consistent with available observations, especially for water fluxes and photosynthetic carbon
gain. An important challenge in capturing all carbon fluxes in grazed systems are the episodic
large carbon emissions related to the respiration by grazing animals. Agreement between
modelled and observed data was therefore poorer for measures that include a large respiratory
component.
In assessing changes in soil organic carbon, we found that it was important to consider the
combined effect of changes in net primary production, the amount of carbon taken off-site
through grazing, the proportion of carbon allocated to pools, especially pools in the soil, that
facilitates the stabilisation of carbon in organic matter, and any changes in the rate of organic
matter decomposition. The modelling tool employed separately quantified the effect of any
perturbation on all of these aspects of the system‟s carbon balance.
We found that soil organic carbon stocks were positively correlated with rates of fertiliser
application and with the rate of water application (rain or irrigation) across a range of low
water application rates. For other changes in key system properties, changes in soil organic
carbon were often negatively correlated with changes in milk production. That was clearly
evident for changes in the grazing regime and for changes in plant root:shoot ratios that might
be achieved through plant breeding or changes in species mixtures.

18
Anticipated environmental changes, such as increases in temperature and CO2 concentration,
and both increases and decreases in precipitation, had either neutral or detrimental effects on
soil organic carbon stocks. Effects were more positive for milk production, with mostly
positive effects under most environmental changes.
Acknowledgments
We would like to thank the New Zealand Agricultural Greenhouse Gas Research Centre
Funding for support for this work, including a Ph.D. scholarship for Nicolas Puche.
References
Crush JR, Waghorn GC, Rolston MP (1992). Greenhouse gas emissions from pasture and arable
crops grown on a Kairanga soil in the Manawatu, North Island, New Zealand. New Zealand
Journal of Agricultural Research 35: 253–257.
DairyNZ (2012). New Zealand dairy statistics 2011–12.
http://www.lic.co.nz/lic/user/File/DAIRY-STATISTICS-2011-12.pdf {Last accessed 1
December 2014}
Hartmann DL, Klein Tank AMG, Rusticucci M, Alexander LV, Brönnimann S, Charabi Y,
Dentener FJ, Dlugokencky EJ, Easterling DR, Kaplan A, Soden BJ, Thorne PW, Wild M,
Zhai PM (2013): Observations: Atmosphere and Surface. In: Climate Change 2013: The
Physical Science Basis. Contribution of Working Group I to the Fifth Assessment Report of
the Intergovernmental Panel on Climate Change [Stocker TF, Qin D, Plattner G-K, Tignor M,
Allen SK, Boschung J, Nauels A, Xia Y, Bex V, Midgley PM (eds.)]. Cambridge University
Press, Cambridge, United Kingdom and New York, NY, USA, pp. 159–254.
Haynes RJ, Williams PH (1993) Nutrient cycling and soil fertility in the grazed pasture
ecosystem. Advances in Agronomy 49: 119–199.
Kelliher FM, Clark H (2012). Ruminants. In Methane and climate change, Reay D, Smith P, van
Amstel A, editors. Earthscan, London, UK, pp. 136–150.
King DA (1993). A model analysis of the influence of root and foliage allocation on forest
production and competition between trees. Tree Physiology 12: 119–135.
Kirschbaum MUF (1999). CenW, a forest growth model with linked carbon, energy, nutrient
and water cycles. Ecological Modelling 118: 17–59.
Kirschbaum MUF (2000). Forest growth and species distributions in a changing climate. Tree
Physiology 20: 309–322.
Kirschbaum MUF, Saggar S, Tate KR, Giltrap DL, Ausseil A–GE, Greenhalgh S, Whitehead D
(2012). Comprehensive evaluation of the climate–change implications of shifting land use
between forest and grassland: New Zealand as a case study. Agriculture, Ecosystems and
Environment 150: 123–138.
Kirschbaum MUF, Rutledge S, Kuijper IA, Mudge PL, Puche N, Wall AM, Roach CG, Schipper
LA, Campbell DI (2015). Modelling carbon and water exchange of a grazed pasture in New
Zealand constrained by eddy covariance measurements. Science of the Total Environment
512–513: 273–286.
Ledgard S, Schils R, Eriksen J, Luo J (2009). Environmental impacts of grazed clover/grass
pastures. Irish Journal of Agricultural Food Research 48: 209–226.
MacLeod, CJ, Moller, H (2006). Intensification and diversification of New Zealand agriculture
since 1960: An evaluation of current indicators of land use change. Agriculture Ecosystems &
Environment 115: 201–218.

19
MfE (2014). New Zealand‟s Greenhouse Gas Inventory 1990–2012. Ministry for the
Environment, Wellington, New Zealand, 2014; also available online:
http://www.mfe.govt.nz/sites/default/files/media/Climate Change/ghg-inventory-1990-
2012.pdf [Verified 21 January 2015].
Mudge PL, Wallace DF, Rutledge S, Campbell DI, Schipper LA, Hosking CL (2011). Carbon
balance of an intensively grazed temperate pasture in two climatically contrasting years.
Agriculture, Ecosystems and Environment 144: 271–280.
Nash JE, Sutcliffe JV (1970). River flow forecasting through conceptual models part 1. A
discussion of principles. Journal of Hydrology 10: 282–290.
Pal P, Clough TJ, Kelliher FM, van Koten C, Sherlock RR (2012). Intensive cattle grazing
affects pasture litter-fall: an unrecognized nitrous oxide source. Journal of Environmental
Quality 41: 444–448.
Parfitt RL, Schipper LA, Baisden WT, Elliott AH (2012). Nitrogen inputs and outputs for New
Zealand from 1990 to 2010 at national and regional scales. New Zealand Journal of
Agricultural Research 55: 241–262.
Parton WJ, Schimel DS, Cole CV, Ojima DS (1987). Analysis of factors controlling soil organic‐matter levels in Great‐Plains grasslands. Soil Science Society of America Journal 51:1173‐1179.
Schipper LA, Baisden WT, Parfitt RL, Ross C, Claydon JJ, Arnold G (2007). Large losses of soil
C and N from soil profiles under pasture in New Zealand during the past 20 years. Global
Change Biology 13: 1138–1144.
Schipper LA, Parfitt RL, Ross C, Baisden WT, Claydon JJ, Fraser S (2010). Gains and losses in
C and N stocks of New Zealand pasture soils depend on land use. Agriculture, Ecosystem and
Environment 139: 611–617.
Schipper LA, Parfitt RL, Fraser S, Littler RA, Baisden WT, Ross C (2014). Soil order and
grazing management effects on changes in soil C and N in New Zealand pastures. Agriculture
Ecosystems and Environment 184: 67–75.
Soussana JF, Tallec T, Blanfort V (2010). Mitigating the greenhouse gas balance of ruminant
production systems through carbon sequestration in grasslands. Animal 4: 334–350.
Trenberth KE, Jones PD, Ambenje P, Bojariu R, Easterling D, Klein Tank A, Parker D,
Rahimzadeh F, Renwick JA, Rusticucci M, Soden B, Zhai P (2007). Observations: Surface
and atmospheric climate change. In: Solomon S, Qin D, Manning M, Chen Z, Marquis M,
Averyt K B, Tignor M and Miller H L (eds). Climate change 2007: The physical science
basis. Contribution of Working Group I to the Fourth Assessment Report of the
Intergovernmental Panel on Climate Change. Cambridge University Press, Cambridge, UK,
pp. 235–336.
Wells C, 2001. Total energy indicators of agricultural sustainability: farming case study. MAF
Technical Paper 2001/3. Ministry of Agriculture and Fisheries, Wellington, New Zealand.
Wilkinson SR, Lowrey RW (1973). Cycling of mineral nutrients in pasture ecosystems. In:
Butler BW, Bailey RW (Editors), Chemistry and biochemistry of herbage, Volume 2,
Academic Press, London, pp. 247–315.
Zeeman MJ, Hiller R, Gilgen AK, Michna P, Pluss P, Buchmann N, Eugster W (2010).
Management and climate impacts on net CO2 fluxes and carbon budgets of three grasslands
along an elevational gradient in Switzerland. Agricultural and Forest Meteorology 150: 519–
530.


