Changes in Mirror Lake, Northwestern Washington,kula.geol.wwu.edu/rjmitch/Tracy.pdf · Figure 18....
106
Changes in Mirror Lake, Northwestern Washington, as a Result of the Diversion of Water from the Nooksack River A Thesis Presented to The Faculty of Western Washington University In Partial Fulfillment of the Requirements for the Degree Master of Science by Karel Tracy November 2001
Transcript of Changes in Mirror Lake, Northwestern Washington,kula.geol.wwu.edu/rjmitch/Tracy.pdf · Figure 18....
Changes in Mirror Lake, Northwestern Washington, as a Result of the Diversion of Water from the Nooksack River A Thesis Presented to The Faculty of Western Washington University In Partial Fulfillment of the Requirements for the Degree Master of Science by Karel Tracy November 2001
Changes in Mirror Lake, Northwestern Washington, as a Result of the Diversion of Water from the Nooksack River BY KAREL TRACY Accepted in Partial Completion of the Requirements for the Degree Master of Science ________________________________ Moheb Ghali, Dean of the Graduate School ADVISORY COMMITTEE _______________________________ Chair, Dr. Christopher A. Suczek _______________________________ Dr. Robert J. Mitchell _______________________________ Dr. Douglas H. Clark

MASTER’S THESIS In presenting this thesis in partial fulfillment of the requirements for a master’s degree at Western Washington University, I agree that the Library shall make its copies freely available for inspection. I further agree that copying of this thesis in whole or in part is allowable only for scholarly purposes. It is understood, however, that any copying or publication of this thesis for commercial purposes or for financial gain shall not be allowed without my written permission. Signature __________________
Date _____________________

Abstract
Mirror Lake, a small lake in northwest Washington, has been used as a settling pond
for water diverted from the Middle Fork of the Nooksack River since 1962. In this thesis,
I combine bathymetric data and sediment sampling to document the changes in
sedimentation that have resulted from this diversion, and compare these results to a
previous study conducted in 1991.
To document the change in the bathymetry of Mirror Lake since 1991, I surveyed the
lake in the summer of 2000 using a theodolite and sonar depth gauge. I compared a
contour map generated from this survey to the map from the survey of 1991. However,
inconsistency in measurement of x-y position between the two surveys prevented
accurate comparison of the bathymetry except in an area near the delta.
Four cores collected from three locations in the lake, and 14 grab samples from the
uppermost bottom sediments allowed analysis of the post-diversion sediments and
comparison to the pre-diversion sediments. The deposits since 1962 were analyzed for
the thickness of the strata, grain size, organic content and magnetic susceptibility, and
compared to the pre-diversion sediments. The sediments from the diverted water have a
thickness of about 1.3 meters near the middle of the lake. The sediments are characterized
by very fine to medium sand (diameter 0.063 to 0.5 mm) at the delta and by medium to
coarse silt (0.016 to 0.063 mm) near the center of the lake. In contrast, the pre-diversion
sediment is primarily organic sediment that has a median grain size equivalent to very
fine sand (0.063 to 0.125 mm).
Between 1991 and 2000, about 15,000 +/- 2000 cubic meters of sediment have been
deposited; this estimate translates to about 1700 +/- 200 cubic meters per year, or about
0.6% of the lake volume. The estimate is based on the change in bathymetry from 1991
to 2000 in the places where this change was significantly greater than measurement error.
For the majority of the lake, I estimated sediment thicknesses from water depth and the

sediment thickness at nearby coring sites. My estimate of error for this rate combines
errors in estimating the stratigraphic location of the 1991 strata and in estimating
sediment thickness where neither coring nor bathymetric comparison provided this
information. Five radiocarbon dates from three cores, as well as the presence of Mazama
tephra, suggest that organic sediment accumulated at a rate on the order of 40 cubic
meters per year prior to the diversion.

ACKNOWLEDGMENTS
I produced this thesis with research preparation, document preparation and editorial
assistance from my thesis committee of Christopher Suczek, Douglas Clark and Robert
Mitchell. Field assistance was provided by George Mustoe, Bert Rubash, Matt Chase,
Eric Bilderback, Ben Cashman and Douglas Clark. Help in preparing and processing
samples was provided by George Mustoe, Douglas Clark and Eric Bilderback. Robin
Matthews provided photographs for my thesis.
The City of Bellingham provided financial assistance through the Lake Whatcom
Project. Western Washington University’s Bureau for Faculty Research provided
support, as did the WWU Geology Department.

TABLE OF CONTENTS Section Page Abstract iv Acknowledgments vi List of tables ix List of figures ix Mirror Lake Introduction 1 Purpose of Study 1 Background 1 Sedimentation in Small Lakes 1 Effects of the Diversion on Sedimentation 4 Diversion History 8 Site Geology and History Notes 11 Bathymetric Survey of Mirror Lake 12 Methods Used in 2000 12 Field Methods 12 Reference Mark Placement 12 Survey of Perimeter 12 Bathymetry Measurements 16 Accuracy of Results 18 Data Analysis Methods 21 Map Production 21 Map Calculations 24 Problems with Map Production 24 Orientation of Mirror Lake 26 Comparison with Previous Surveys 28 Comparison with 1991 Survey 28 Comparison of Survey Techniques in 1991 and 2000 32 Matching Horizontal Locations, 1991 to 2000 33 Estimating Lake Level of 1991 33 Calculation of Changes in Bathymetry, 1991 to 2000 34 Comparisons with 1946 survey 36 Comparison of 1991 Survey with 1946 36 Comparison of 2000 Survey with 1946 37 Sediment Collection and Analysis 38 Sample Collection 38

Grab Sample Collection 38 Sediment Coring 38 Sediment Analysis 42 Core Logging 42 Production 42 Stratigraphy and Comparison with Other Lakes 51 Loss on Ignition 53 Dating Control 58 Particle Size Analysis 58 Magnetic Susceptibility 68 Results of Tests 68 Comparison of Magnetic Susceptibility Results 69 Discussion of Sedimentation Rates 71 Pre-diversion Rates 71 Post-diversion Rates 72 Conclusions and Recommendations 76 References 78 Appendix 81
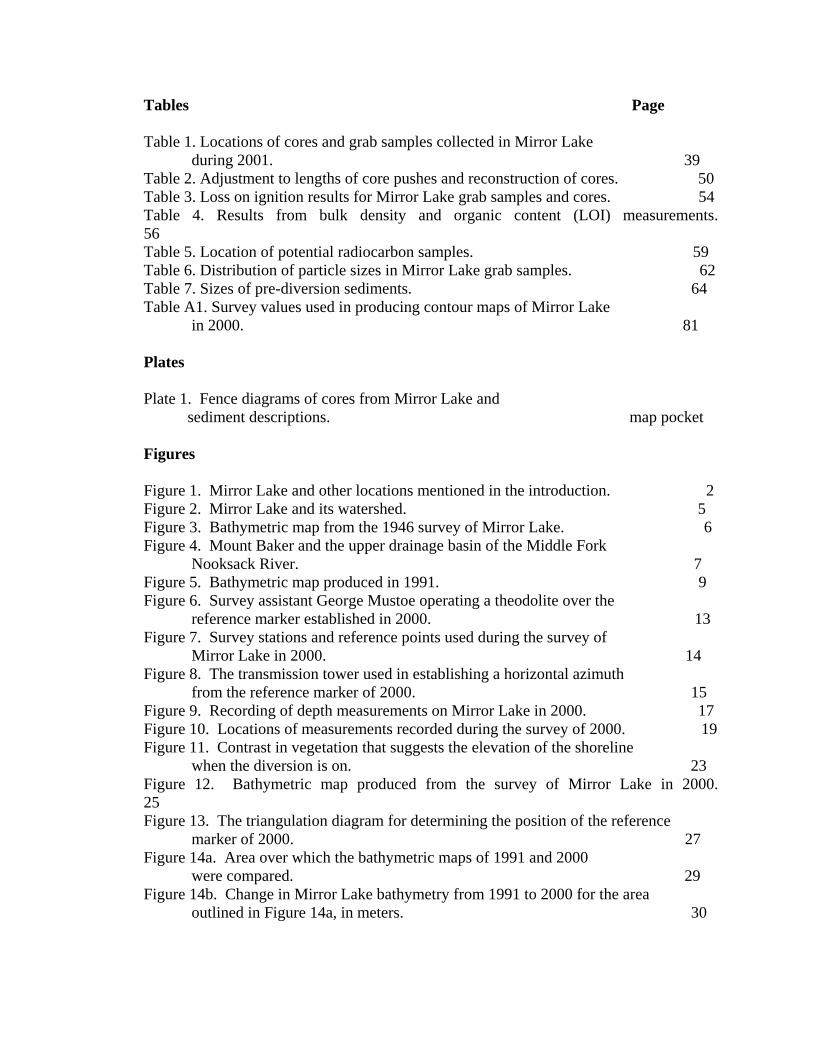
Tables Page Table 1. Locations of cores and grab samples collected in Mirror Lake during 2001. 39 Table 2. Adjustment to lengths of core pushes and reconstruction of cores. 50 Table 3. Loss on ignition results for Mirror Lake grab samples and cores. 54 Table 4. Results from bulk density and organic content (LOI) measurements. 56 Table 5. Location of potential radiocarbon samples. 59 Table 6. Distribution of particle sizes in Mirror Lake grab samples. 62 Table 7. Sizes of pre-diversion sediments. 64 Table A1. Survey values used in producing contour maps of Mirror Lake in 2000. 81 Plates Plate 1. Fence diagrams of cores from Mirror Lake and sediment descriptions. map pocket Figures Figure 1. Mirror Lake and other locations mentioned in the introduction. 2 Figure 2. Mirror Lake and its watershed. 5 Figure 3. Bathymetric map from the 1946 survey of Mirror Lake. 6 Figure 4. Mount Baker and the upper drainage basin of the Middle Fork Nooksack River. 7 Figure 5. Bathymetric map produced in 1991. 9 Figure 6. Survey assistant George Mustoe operating a theodolite over the reference marker established in 2000. 13 Figure 7. Survey stations and reference points used during the survey of Mirror Lake in 2000. 14 Figure 8. The transmission tower used in establishing a horizontal azimuth from the reference marker of 2000. 15 Figure 9. Recording of depth measurements on Mirror Lake in 2000. 17 Figure 10. Locations of measurements recorded during the survey of 2000. 19 Figure 11. Contrast in vegetation that suggests the elevation of the shoreline when the diversion is on. 23 Figure 12. Bathymetric map produced from the survey of Mirror Lake in 2000. 25 Figure 13. The triangulation diagram for determining the position of the reference marker of 2000. 27 Figure 14a. Area over which the bathymetric maps of 1991 and 2000 were compared. 29 Figure 14b. Change in Mirror Lake bathymetry from 1991 to 2000 for the area outlined in Figure 14a, in meters. 30

Figure 15. Overlay of bathymetric maps of 1991 and 2000. 31 Figure 16. Sites of cores and grab samples taken from Mirror Lake in winter of 2001. 40 Figure 17. Raft used with the Livingstone coring system on Mirror Lake. 41 Figure 18. Stratigraphy and measurements on core 1. 44 Figure 19. Stratigraphy and measurements on core 2. 45 Figure 20. Stratigraphy and measurements on core 3. 46 Figure 21. Stratigraphy and measurements on core 4. 47 Figure 22. Photographs of post-diversion sediments. 48 Figure 23. Photographs of pre-diversion sediments. 49 Figure 24. Median grain size of grab samples (GS) and samples from the upper 5 centimeters at each coring site. 63 Figure 25. Comparison of grain size distribution in portions of core 4. 66 Figure 26. Log of core farthest from delta before removal of repeat sequence. 67 Figure 27. Sedimentation in Mirror Lake from 1991 to 2000. 74
MIRROR LAKE INTRODUCTION
Purpose of Study
The rate at which sediment accumulates in Mirror Lake has increased as a result of
diversion of water from the Nooksack River drainage basin. Mirror Lake, which is about
1 kilometer northwest of Wickersham, Washington (Figure 1), is within the Lake
Whatcom drainage basin of northwestern Washington and has been used as a settling
pond for water that has augmented the city of Bellingham’s water supply. The purpose of
this thesis was to characterize the changes in sedimentation rates and patterns that have
occurred in Mirror Lake since the diversion began.
The first objective of this study was to produce a new map of Mirror Lake bathymetry
and compare the new bathymetry with that of the next most recent survey, which was
completed in 1991. The rate of sediment deposition was calculated from changes in
bathymetry and from sediment coring, both for the lake as a whole, and as a function of
position on the lake bed. The cored sediments were analyzed for changes in organic
content and magnetic properties so as to identify the boundary between sediments
deposited before and after the diversion began. A second objective was to characterize
changes in the sizes of sediment deposited in the lake as a function of distance from the
location where the diversion discharges into the lake.
Background
Sedimentation in Small Lakes
Sediment in small lakes is usually silt or mud, organic-rich silt or mud, or gyttja,
which is a combination of fine organic detritus and fine silicate sediment. The amount
and energy of inflow can affect the particle sizes deposited in the lake. In humid low
energy, low inflow environments, gyttja or peat usually predominates, depending on
whether the lake is shallow enough to allow emergent vegetation (Reeves, 1968). The
amount of organic matter depends on the organic productivity of the lake and whether the

bottom is anoxic (Reading, 1996). The proportion of clay in lake deposits can be used to
determine the climatic history of a lake basin because this proportion reflects the ratio of
inflow to lake volume, and therefore residence time (e.g., Campbell, 1998). Campbell
(1998) states that an increase in the finest sediments correlated with warmer periods,
whereas an increase in aeolian activity should deposit more silts and sands. The deposits
in a lake are influenced by the characteristics of both the drainage basin and the lake, and
can reflect climate-induced changes in vegetation, such as at Lake Sinnda, in the southern
Congo, where an upward grade from muds to organic-rich muds with plant fragments
suggests a more humid climatic regime (Vicens et al., 1998). A decrease in organic
content, for example in the sediments described by Leonard and Reasoner (1999) in
Crowfoot Lake of Alberta, Canada, has been used to infer increases in clastic
sedimentation as glacial activity increases in a drainage basin. When lake sediment
records are combined with studies of modern lakes and watersheds, they can be used to
help reconstruct past physiographic changes and historical ecosystems (Oldfield, 1977).
However, the chemical and biological evolution of lakes is currently not as well
understood as succession sequences on land (Kling, 2000).
In some lakes, such as those near glaciers, deposition may vary seasonally to produce
varves; in modern lakes that contain varves, there is a relationship between the early
summer temperature and the thickness of varves (Rittenour et al., 2000). Varves are a
type of rhythmite, or alternating pattern of sedimentation; rhythmite sequences are well
preserved in lakes that have a high sedimentation rate and a flat bottom (Reading, 1996).
Varves can be correlated between different areas, but Coleman (1929) advises caution in
matching varve sets solely on the basis of similarities in strata thickness. Varves can also
form in areas far from glaciers, such as in the playa lake described by Anderson and
Kirkland (1969), where alternating laminae of calcium carbonate and clay were deposited
as an alkaline lake contracted and expanded. The post-diversion sediments in Mirror

Lake are rhythmites, but the strata do not clearly represent yearly cycles of deposition.
Effects of the Diversion on Sedimentation
The watershed of Mirror Lake is slightly greater than 0.5 square kilometers (Figure 2).
The heavily vegetated character of the drainage area and the lack of input streams
comparable in size to the diversion input suggests that production of clastic sediment is
low in the drainage area. Therefore, the yearly rate of sedimentation in Mirror Lake is
probably substantially greater now than before the diversion from the Middle Fork
existed. When the lake was first surveyed in 1946 (Figure 3), it had an area of 5.46
hectares and a volume of about 324,000 cubic meters (Wolcott, 1973).
The drainage area of the Middle Fork of the Nooksack, above the diversion to Mirror
Lake, is about 193 square kilometers (Nicholson, 1981). The river originates at the
Deming Glacier (Figure 4), and Carpenter et al. (1992) state that this glacier is the main
source of fine sediment to the Middle Fork of the Nooksack. Other glaciers are shown on
maps of the Middle Fork Basin, and these glaciers account for a third of the total
glaciated area in the basin.
According to Bill McCourt (2000, oral communication), water diverted from the
Middle Fork is first filtered to remove coarse material by passing it through a set of bars
that are spaced 15 cm apart and a 6 1/4 mm hardware cloth screen. The filtered water
then enters a 30 meter settling tank, and this removes most material coarser than fine
sand. Mirror Lake is used as a natural settling pond for much of the sediment that is not
removed in the settling tank. According to Carpenter et al. (1992), this is mostly silt-
sized. The silt content of the water at the diversion site is probably highest after heavy
rains in the Middle Fork drainage basin. Silt content is also high in late summer, when
the debris-rich ice of the Deming Glacier is melting rapidly and the contribution from
relatively clean snowmelt and groundwater is low.
From a survey in 1991 (Figure 5) and assumptions about the lake area and water level

in the 1946 survey, Carpenter et al. (1992) estimated a yearly sedimentation rate of 250
cubic meters per year for the period 1962 to 1991. The calculation of this value assumed
that the volume of sediment deposited each year was negligible before 1962, relative to
the sedimentation rate after water diversion, and that the sediment input from the
drainage basin of Mirror Lake was also negligible relative to the diversion input. This
estimate did not consider compaction and subsidence of the underlying sediments, and
coring of the lake in 2001 has shown that the average yearly sedimentation rate in the
lake is far greater than 250 cubic meters per year. Since the generation of electricity at
the site identified by “Power Plant” in Figure 1 began in 1985, the diversion has been on
for longer periods outside the summer months. The change in yearly sediment input to
the lake as a result of the operation of the diversion during the fall, winter and spring has
probably been less than the increase in operating time would indicate because, as
Carpenter et al. (1992) indicated, the silt content of the water is normally much lower
outside the period of glacial melting, except after heavy rain.
Deposition of very fine to medium sand where the diverted water enters Mirror Lake
has produced a delta (Figure 5). The authors of previous studies did not determine the
distribution of grain sizes at this delta or at other locations in the lake. I was not able to
determine the degree to which an increase in bedload in the Middle Fork during heavy
precipitation events affects the maximum grain size deposited at the delta in Mirror Lake.
There is no delta shown on the bathymetric map of 1946 (Figure 3), and the lack of
significant tributary steams around the lake suggests that there was no delta in 1946
comparable in size to the present delta.
Diversion History
Demand for water by industrial and residential users has increased in most areas of the
United States during the past century. Lake Whatcom is currently the main water source
for the City of Bellingham in Whatcom County, Washington (Figure 1). Lake Whatcom

has an area of about 2020 hectares (Barrett Consulting Group, 1995). In 1953, a court
order was issued that prevented the city from raising the level of Lake Whatcom above an
elevation of 96 meters above sea level (Superior Court of the State of Washington, 1953).
Because the city has the right to store 24.7 million cubic meters of water, which
corresponds to a depth of 1.22 meters when averaged over the 2020 hectare lake area, the
lake level has been maintained above 94.78 meters above sea level, even though there is
no legal restriction on minimum water level (Barrett Consulting Group, 1995).
In order to satisfy water demand while minimizing fluctuations of the level of Lake
Whatcom, the City of Bellingham began diverting water from the Middle Fork of the
Nooksack River (Figure 1). After leaving the diversion site (Figure 1), the water flows
2700 meters through a 2.1 by 2.4 meter tunnel, which has a capacity of 7.1 cubic meters
per second. The water then flows 15.3 kilometers through a 102 centimeter pipe, which
has a capacity of 2.7 meters per second. This water is then discharged 165 meters
upstream from Mirror Lake (Barrett Consulting Group, 1995). Turbines, identified by
“Power Plant” in Figure 1, were installed in 1985; they are used to generate up to 1000
kilowatts of electrical power. The maximum flow diverted is reduced to 1.9 cubic meters
per second while they are in operation (Barrett, 1995). After the turbines were installed,
the diversion was often operated in the fall, winter and spring, when no water was
required to maintain the level of Lake Whatcom (Carpenter et al., 1992).
Since the year 1962, the diversion has accounted for 20% of the City’s water
consumption on a yearly basis. However, it may supply as much as 80% of the surface
inflow to Lake Whatcom during the summer (Bill McCourt, 2000, oral communication).
The volume of the diversion averaged about 3 to 4 million cubic meters per month for
most of the 1990s, except for 1999, when the volume was about 1 to 1.5 million cubic
meters per month (Bill McCourt, 2000, oral communication).
In 1999, the U.S. Fish and Wildlife Service listed the Chinook salmon as an
endangered species, and a minimum flow of water must now be sustained in the Middle
Fork of the Nooksack for these salmon. The Lummi and Nooksack Nations, among other
groups (Bill McCourt, 2000, oral communication), have also been working to reduce the
volume of water diverted in order to provide a minimum flow of 335 cfs for salmon
swimming up the Middle Fork to spawn. The diversion has been operated less often in
2000 and 2001. It is probable that the volume of water diverted will remain much lower
than pre-1999 levels because of the status of the Chinook salmon.
Site Geology and History Notes
The area of Mirror Lake is underlain by the Jurassic Darrington Phyllite, of the
Easton Metamorphic Suite (Lapen, 2000). Schistosity, lineations (intersecting and
crenulation) and small folds have been observed in the Darrington Phyllite (Haugerud,
1980). The Darrington Phyllite is exposed in roadcuts near the lake, and in an outcrop at
the lake’s southwest edge. The lowlands of southwestern British Columbia and
northwestern Washington were occupied by the continental Cordilleran ice sheet during
the Vashon Stade of the Fraser Glaciation (Easterbrook, 1969). Kovanen and
Easterbrook (2001) argue that the Mirror Lake area was occupied by an alpine glacier
from the South Fork of the Nooksack River in the latest Pleistocene, although this
concept remains controversial. The predominant soil type in the area is part of the
Squires Series, which at this site has moderate permeability and moderate available water
capacity (Goldin, 1992).
In 1902 the Bellingham Bay and Eastern Railway completed a railroad through the
Mirror Lake area (Frank Culp, 2001, oral communication). Logging in the area had
begun by 1910, and possibly even earlier (Dan Cozine, 2001, oral communication).
Bloedel-Donovan Company was the main timber company in the area (Thompson, 1989).
The harvest of timber, along with road and railroad construction, should have caused a
greater sediment input to the lake.

BATHYMETRIC SURVEY OF MIRROR LAKE
Methods used in 2000
Field Methods
Reference mark placement
My assistant and I surveyed Mirror Lake during the summer of 2000. This was 9 years
after the previous survey of Carpenter et al. (1992) and 54 years after the original survey
of 1946, which was described in Wolcott (1973). Because the concrete reference marker
constructed for the 1991 survey was not found, and was probably removed in the
intervening 9 years, I established a new reference marker on the southern part of the
shoreline, at the western edge of an outcrop of phyllite (Figures 6 and 7). The marker,
which is a concrete disk about 1 foot in diameter, was cemented to a what appears to be a
bedrock outcrop or large boulder. Bathymetric surveying of the lake was based on this
reference and on secondary points that were established from this reference. The “V”
formed by the insulators of a transmission tower northeast of the lake (Figure 8) was used
to establish the azimuth at the start of each day of surveying. This tower is identified by
the Bonneville Power Administration as Monroe-Custer (MONE CUST) Line 1, Mile 62,
Tower 1 and is located at the center of Figure 8.
Survey of perimeter
I surveyed the perimeter of the lake on August 16, August 17, and September 12 of
2000 with George Mustoe. Bert Rubash also helped me survey on November 4 to fill in
gaps in the data set. My survey partner helped by operating a theodolite and recording
my x-y-z position while I walked at or near the perimeter of the lake with a reflective
prism, which was mounted on a 2 meter staff.
Because the diversion was off when Mirror Lake was surveyed, the level of the lake at
the time of the survey, which I designated the low water line, was the most readily
identified boundary and was surveyed first. The diversion was on during the spring of

2000, and during this time I observed that the lake level was at the lower edge of
shoreline angles on the northeast and southern edges of the lake. This level, which I
designated as the high water line, is about 0.85 +/- 0.05 meters higher than the low water
line. The position of this high water line was not clearly evident along all reaches of the
lake perimeter. I surveyed the topography between the elevations of high water and low
water, as well as points above the high water line, to generate a surface upon which I
could later set the lake level close to the estimated high water line.
Bathymetry measurements
I surveyed the bathymetry of the lake on August 29, August 31, and September 13 of
2000. While I recorded bathymetric values from a raft (Figure 9), George Mustoe
operated an electronic total station (Figure 6). For surveying on the lake, the prism was
detached from the staff and mounted on a hard hat. To record each horizontal position on
the lake, I held the boat at still as possible and faced the total station. When my survey
partner gave a hand signal to indicate that he had recorded an x-y position using the total
station, I recorded the value displayed on a Humminbird 100 SX depth gauge (200 kHz,
single beam), which was mounted on a board that rested across an inflatable boat. This
depth gauge gives readings to the nearest foot (0.3 meters). If the depth gauge was
shifting among multiple values, I recorded the value that was displayed most often.
Although this sonar device was not designed for surveying, but rather for locating fish,
it produced a bottom profile from which I could recognize the lake bottom. According to
a technical support representative of the manufacturer (Tina Conner, 2001, oral
communication), the accuracy of this depth gauge should be within 2 percent. The
manual provided with the device states that the radius of the cone of dispersal of the
sonar is 12 degrees; and, according to Bert Rubash (2000, oral communication), a depth
of water is calculated from the first strong pulse that returns to the sonar. A cone of
dispersal of 12 degrees returns its reading from an area on the lake bottom that has a

radius of about 20 percent of the depth.
I surveyed points on the lake bottom along lines that trend southwest to northeast in
the southeastern portion of the lake, and along both southwest to northeast and northwest
to southeast trends in the northern portion of the lake (Figure 10). I surveyed fewer
points in the middle of the lake, where the lake bottom is nearly flat. I also surveyed
points along a path that was about 10 meters from shore. The depths were measured
more frequently where the depth changes more rapidly with x-y position than where the
lake bottom appears to be flat. The depth reading at each point was later matched with a
map position from the theodolite to produce a three-dimensional grid.
Accuracy of Results
The accuracy of the bathymetric map produced for this thesis depends mainly on the
accuracy of the depth measurements. The sonar depth gauge used in this survey
produced readings that fluctuated by a maximum of +/- 0.3 meters. The 12 degree cone
of dispersal covers an area that has a radius of 1.2 meters at a depth of 6 meters, which is
about the average depth of the lake. In the study of 2000, the total error of the volume
given in the section “Map Calculations” should be no more than 5 percent, based on a
vertical error of 0.3 meters and an average lake depth of 6 meters.
Error comes from five known sources: rounding of depth measurements, shape of the
lake bottom, inaccurate reflection from the bottom, and two lake level estimates. For
each measurement, there was some error associated with instruments and with rounding.
The maximum depth of the lake when it was surveyed was between 9 and 10 meters, so
the instrument’s rounding error of plus or minus 0.3 meters is always greater than the 2
percent error specified by the manufacturer. Western Washington University
Mathematics Professor Edoh Ramiran (2000, oral communication) said that if this source
of error is separated from other sources of error, it can be considered random, and the
Central Limit Theorem could be used. According to the Central Limit Theorem (Johnson

and Bhattacharyya, 1992), the distribution of the sample mean is approximately normal
for large sample sizes. For the sample of depths for the 2000 Mirror Lake survey, the
sample size of 430 is large enough for this theorem to be applied. Given that the depth
gauge gives depths that are within 0.3 meters of the actual value, it is reasonable to
assume that 95 percent of the depths are within 0.3 meters of the actual value, when only
this rounding error is considered. If this is true, the standard deviation of the population
(all depth readings) is 0.15 meters (15 centimeters), because two standard deviations
include about 95 percent of values (Johnson and Bhattacharyya, 1992). These authors
also state that the standard deviation of the sample mean, which is in this case represented
by mean lake depth, is the population standard deviation (0.15 meters in this case)
divided by the square root of the sample size. Sample size is about 430, so the standard
deviation of the sample mean is about 0.0072 meters (0.72 centimeters). The total error
from rounding should not be greater than 0.015 meters (1.5 centimeters) at the 95 percent
confidence interval.
A second source of error, which is unrelated to instrumental precision, is produced by
the shape of the lake bottom. Because the sonar device produces a sounding of the lake
bottom based on the intensity of the returning pulse with time (Edgarton et al., 1964) the
recorded depth may be less than the actual spot value in areas of steep slopes, where the
shortest path from the sonar to the lake bottom may not be vertical. The error from this
effect is likely to be no more than 0.1 meters in the majority of locations, because the
slope of the lake is less than 15 percent in almost all areas, and the steeper slopes are
found in the shallower parts of the lake, where the 12 degree cone of dispersal from the
surface covers a relatively small area of the lake floor.
A third possible source of error in this survey is that the surface of the lake sediments
may not produce a reflection that is stronger than the threshold signal used by the sonar
device for calculating depth. The graphical depiction of the bottom of the lake on the

depth gauge was often indistinct, which probably indicated the presence of loose or
poorly compacted mud on the floor of the lake. This effect is assumed not to have
increased reported depths by more than 0.15 meters, based on the thickness of this
indistinct layer on the sonar display.
Because the previous two sources of error should have opposite effects on the
calculated volume of the lake, their combined effect should be less than the sum of their
absolute values. The fourth and fifth potential sources of error are probably less than the
previous two. They involve the estimation of the lake level when depths were recorded,
for which the error is on the order of 3 centimeters, and estimation of the level of the lake
during the 1991 survey, for which the error should be less than 5 centimeters. The five
sources of error produce an approximate error of about 0.3 meters or 5 % in the volume
of the lake.
Data Analysis Methods
Map production
The survey points were compiled in a spreadsheet (Appendix). The x-y values given
in the appendix are based on the assignment of the position (1000E, 1000N) to the
reference marker established in 2000 and the azimuth of N45E to the transmission tower
that is shown in Figure 8. The direction of true north is 14.6 degrees east (clockwise)
from the orientation of the northing axis that was assigned at the beginning of the 2000
survey.
Depth values were originally given in feet (0.3 meters) by the sonar device. These
were converted to meters and subtracted from the measured elevation of the lake surface
below the reference marker. Horizontal and vertical positions on the edge of the lake
were assigned a precision of 0.01 meters because of slight variations in how far the prism
rod sank into mud or duff, and slight inconsistency in holding the rod vertical. Positions
for the lake bottom were given a precision of 0.1 meters because the boat moved slightly

while its position was being measured, the reflector was not always in the same position
relative to the depth gauge, and the precision of the depth gauge was similar to that of the
horizontal position. The effect of irregularities in the topography of the lake bottom on
precision is difficult to quantify. Because the survey took place when the diversion from
the Middle Fork was not operating, the elevation of the lake when the diversion is on was
estimated from changes in vegetation on the shoreline (Figure 11) and the depths at each
measurement points were increased by 0.85 meters to convert them to depth values for
when the diversion is operating.
The program Surfer (Golden Software, 1997) was used to produce a map from the
data. This program produces a regularly spaced grid of points from an irregularly spaced
data set before it produces a contour map. The X, Y and Z coordinates in the Surfer grid
were assigned to the easting, northing and distance below high water, respectively. The
line density for this regular grid was 91 lines in the X direction, from 780 to 1125, by 100
lines in the Y direction, from 920 to 1300, for the grid of 2000. These values were used
instead of the default density of 50 lines in the longer dimension because the former
density produced a grid spacing of about 3.8 meters. This grid spacing is closer to the
average spacing between measurement points in the southeast part of the lake, and
therefore detail was less likely to be lost in these areas during the calculation of a uniform
grid.
Kriging was used as the gridding method because this method was used in the previous
survey (Carpenter et al., 1992), and this was the method suggested in the program
manual. The values for scale (C) and length (A) were left at the values calculated by
Surfer for this data set, which were 9.49 and 236, respectively. A small additive error
variance (0.02) was included in the gridding process in an attempt to compensate for the
uncertainty in taking measurements on a soft, irregular surface, and for the rounding error
that occurred when measurements were expressed in feet (0.3 meters). However, I could

see very little change on the final map as a result of the inclusion of this variance, and I
could have left this value at zero without significantly affecting the final bathymetry.
The micro variance was left at zero and drift was left as none. All data points were used
in the search. For the search ellipse radius 1 and radius 2 were left at the computed value
236, and the ellipse angle was left at zero. The resulting grid was smoothed using the
spline method, as was the grid generated by Carpenter et al. (1992). Two grid lines were
inserted between each of the original grid lines. A contour map at an interval of one
meter (Figure 12) was produced from the smoothed grid file, as was a map that shows the
density of measurement points (Figure 10).
Map calculations
The version of Surfer that was used for this thesis (Golden Software, 1997) contains
programs for estimating the volume between two grid surfaces. The volume of the lake
at the estimated level of the lake when the diversion is operating, which is 111.59 +/-
0.15 meters above Bellingham City datum, was calculated by this program as 321,900
cubic meters, and the surface area of the lake was given as 57,510 square meters. At the
estimated high water level, the maximum depth of the lake is about 10.05 +/- 0.15 meters.
Problems with map production
A crucial problem encountered in the survey of 2000 was the disappearance of the
concrete reference marker that was placed near the edge of the lake in 1991. The absence
of this marker resulted in the need to examine the shoreline for a feature that could be
used indirectly to compute changes in depth between the two surveys. This is discussed
in the section “Estimating lake level of 1991.”
A second problem encountered while producing the contour map was closing the
contours in the southeastern portion of the map. When the lake was being surveyed,
thick brush prevented sightings into two marshy areas in this location. These areas were
slightly below the estimate of high water level and were near the elevation of points

closer to the lake, so kriging produced open contours along this reach of the lake
perimeter. Additional surveying was required to provide points at a high enough
elevation to produce closed contours. When each measurement was recorded by the
theodolite, my survey partner gave the vertical component. If this component was below
the estimated high water line of the lake, a search was made for a higher location,
although sighting to these points from the theodolite was made more difficult by the
vegetation around the lake.
Orientation of Mirror Lake
Triangulation was used to position the grid used in the survey of 2000 relative to the
Universal Transverse Mercator grid, section 10U, datum of 1983 (Figure 13). The first
step in the orientation of the grid used in the 2000 survey involved determining the
position of a temporary marker along the edge of Mirror Lake; this point is identified as
“peninsula point” in Figure 7. The location of this point was established using a Garmin
45 XL global positioning system and a Garmin GBR 21 differential correction receiver.
This device gives individual readings that are accurate to within 5 meters, so the value
used in my calculations, which was an average of 27 readings, should have an accuracy
of 1 meter; the ratio of error in an individual measurement to error in an average
measurement is the square root of the number of points averaged.
The GPS position of “peninsula point” was then matched with its position on the grid
used in the 2000 survey, and I calculated the distance from this point to the primary
reference used in 2000. The position of a Bonneville Power Administration transmission
tower, which is labeled “transmission tower” in Figure 7, was obtained from B.P.A. (Bob
Sweet, 2000, oral communication), and an angle was measured at the primary reference
between the other two points. This angle and the point measurements were sufficient to
triangulate the absolute position of the reference marker of 2000 and the direction of true
north on the grid of the 2000 survey.

The elevation of the lake was determined by surveying from the primary reference
used in 2000 to a reference marker established by the City of Bellingham. This reference
marker, which is identified as “diversion outlet” in Figure 7, is a copper pin above the
center of the diversion outlet pipe. Based on an elevation of 112.64 meters above
Bellingham City datum provided by the City for this point (Bill McCourt, 2000, written
communication), the elevation of the primary reference used in 2000 is 111.94 meters
above Bellingham City datum. Bellingham City datum is 1.89 meters below the
elevation of mean sea level that was established by the U.S. Coastal and Geodetic Survey
( Joe Corbell, 2001, written communication).
Comparison with Previous Surveys
Comparison with 1991 Survey
The volume of sediment deposited in Mirror Lake between 1991 and 2000 could not
be estimated for the entire lake based on bathymetric surveys. For most of the lake area,
the apparent change in elevation of the lake bed was not significantly greater than the
uncertainty in the measurement of vertical position. As a result, I was only able to
calculate the amount of sedimentation for an area of 3980 square meters in the southeast
portion of the lake (Figure 14a and 14b). The apparent volume of post-1991 deposits in
this area is about 3000 +/- 300 cubic meters. However, the actual volume also depends
on the amount of compaction or settling that has occurred in the underlying sediments,
which could not be determined from the depth survey alone. The sediment volume added
to the lake in this area is about 1/5 of the total sedimentation in the lake, based on cores
taken from the lake after the survey of 2000 was completed. This is explained in the
section “Post-diversion Sedimentation Rates, Volume.” The form of the contours near
the edges of the lake differs enough between the two surveys to suggest that there were
significant errors in position in the 1991 survey (Figure 15). The inconsistent character
of variations between the surveys suggests that the variation does not reflect differences

in sedimentation.
Comparison of Survey Techniques in 1991 and 2000
My survey techniques were different than those used in the 1991 survey. In 2000, I
used a total station to record positions both at the edge of the lake and for bathymetry.
The total station provides more accurate readings than the plane table and alidade used in
the 1991 survey. The total station uses the reflection of a laser beam from a prism to
calculate distance and can record horizontal rotations and vertical changes with
millimeter-scale precision. Because proficient use of the total station gives more accurate
readings (millimeter instead of centimeter accuracy), the advantage of an improvement in
accuracy outweighs the disadvantage of the change in methods between 1991 and 2000.
Most professional surveyors now use either a laser device or a survey-grade GPS in place
of the transit.
The locations of depth measurements from my survey do not exactly duplicate those of
the 1991 survey. Also, the depth gauge used in the 2000 survey gives readings in feet
(0.3 meters), instead of to the nearest 0.03 meters, as in the 1991 survey. Although this
produced some error in comparing the maps produced from the two surveys, the
increased point density near the delta and other places where the lake bottom has a
steeper slope should have compensated for this error. The increase in point density left
less area between points over which to interpolate, and therefore irregularities in
bathymetry could be measured on a smaller scale. Also, because of errors discussed in
the section “Accuracy of Results,” the display of readings to the nearest 0.03 meters
probably did not reflect the true precision of measurements. The low-organic diversion
sediments in Mirror Lake have only a negligible floc bed, and I assumed that the change
in depth finders between 1991 and 2000 would not present a significant problem. The
expression of depth at a level of precision of 0.3 meters rather than 0.03 meters should
not have made a significant difference in the bathymetry map because my x-y position on
the lake could not be determined to within 0.03 meters. Although the vertical positions
do not directly correlate with the horizontal positions, on steep slopes a horizontal change
of several decimeters can result in a change of more than one decimeter. Use of a
contour interval on the map that I produced that was smaller in magnitude than the survey
precision would have provided no additional information.
Matching Horizontal Locations, 1991 to 2000
The loss of the survey reference marker used in 1991 necessitated the matching of the
1991 and 2000 maps to compute the change at each point on the lake bottom. This was
difficult because the lake margins on the two surveys differ by more than two meters in
many locations. In an attempt to match the maps, the survey stations used in 1991 were
located (or their locations estimated) and resurveyed with respect to the grid established
in 2000. Apparent distortion of distances on the 1991 map on the margins of the lake
between the delta and the center of the lake, along with larger spaces between depth
measurements on the 1991 map (Figure 15), produced errors in the location of depth
contours that were two to four times the thickness of the contour lines. This complicated
my attempt to match the maps. Consequently, I attempted to match the two maps by
establishing the location of the diversion inlet on each, then rotating the maps about the
diversion inlet until they were aligned as well as possible near the primary references of
1991 and 2000. Although this method is subjective, my attempt to align the maps by
using the survey bases of Carpenter et al. (1992) produced a result that was obviously in
error. The areas of the maps near the diversion inlet were given priority during the
alignment because this feature is recognizable on both maps and its linear nature made
alignment easier.
Estimating Lake Level of 1991
I was only able to estimate the level of the lake in 1991 relative to the reference

established in 2000, because the diversion was not operating during the 2000 survey, and
the reference used in 1991 is no longer present. Between 1991 and 2000 there may have
also been a change in the equilibrium elevation of the lake while the diversion is
operating. According to Robin Matthews (WWU Watershed Studies, oral
communication, 2000), this level did not change by more than a centimeter while surveys
were conducted in 1991. There are small shoreline angles on the shore near the 2000
reference marker, and these are assumed to have been made by wave erosion when lake
level was at or near the 1991 level. These shoreline angles are also assumed not to have
been present in 1946, because the lake level has consistently been about 0.8 to 0.9 meters
below the shoreline angles during my study while the diversion has not been operating.
These shoreline angles do not allow the determination of lake elevation within a margin
of less than five centimeters, but they are close to the lake level I observed when the
diversion was operating in the spring of 2000. If the present lake level were raised to the
level that I estimated for 1991, the apparent deposition between 2000 and 1991 would be
5 centimeters.
Calculation of Changes in Bathymetry, 1991 to 2000
The map of net change in lake bed elevation between 1991 and 2000 was computed
within the area shown in Figure 14. The change could be calculated by comparing the
1991 and 2000 surveys using Surfer 6.0 (Golden Software, 1997). To compare the
surveys in Surfer, I generated a grid of depth values by interpolation from the 1991 map
of Carpenter et al. (1992). I first printed a map of the 2000 survey that was accompanied
by the easting and northing grid lines of the coordinate system used in 2000; I set grid
line spacing at 2 meters for eastings and northings. I then overlaid the 1991 and 2000
maps so that the coordinates (220E, 130N) on the 1991 map coincided with (996E,
1056N) on the 2000 map and (280E, 50N) on the 1991 map coincided with (1060E,
980N) on the 2000 map.
For most of the gridline intersections within the area shown on Figure 14, I
interpolated a depth from the 1991 map at a precision of 0.1 meters. I did not record
depth values at every intersection in the areas where a visual inspection of the contours of
the 1991 and 2000 maps suggested that little information would have been added by
completely filling the grid with depth values in these areas. The depth values that I
interpolated from the 1991 map were converted to a complete grid in Surfer, and I used
the program’s grid math function to compute the change between 1991 and 2000.
Although the density of depth measurements in the southeast part of the lake was less
in 1991 than in 2000, comparison of the two surveys was possible. The deposits from the
diversion have produced a more pronounced lobe in front of the delta and have a more
convex view in planform in 2000 than in 1991. Deposits in this area appear to exceed 3
meters for the period 1991 to 2000 (Figure 14b), but problems in aligning the maps
prevented the production of an accurate isopach map.
Some sediment appears to have slumped to the north from the delta; this is inferred
from an increase in depth (negative isopachs) in this area on Figure 14b, and the area of
greater sediment thickness on the right side of the delta. Also, the slope on this portion of
the delta was 45 degrees in 1991 (Figure 5). The sediments of the delta do not lie at a 45
degree slope at any location on the 2000 map, nor can such steep slopes be found at any
other place on the map of the 1991 survey. The direction of water flow across the delta
may have also changed, but a change in flow direction does not appear to have been
responsible for the increase in water depth at this isolated location.
The proposed slump may have been triggered by overloading of sediment at this
location. The rapid accumulation of sediment may have resulted in an instability in the
delta and quicksand conditions in the input channel. The passage of a density current
when the diversion was restarted after several weeks is another possible trigger. In a
study of sediment deformation in some lakes in Japan (Jones and Omoto, 2000), the

authors mention earthquakes, overloading by sediments and subaqueous currents as
possible triggers for the deformation they observed. The present delta appears to be
unstable enough that an earthquake could trigger a slump, but I did not observe the
condition of the delta in 1991.
Comparisons with 1946 Survey
Comparison of the 2000 and 1991 surveys with the 1946 survey of Mirror Lake was
complicated by a lack of precision in depth measurements in the 1946 survey. This
section describes these problems.
Comparison of 1991 Survey with 1946
Carpenter et al. (1992) estimated the amount of sedimentation in Mirror Lake between
1946 and 1991 as 7500 cubic meters. This comparison was based on changes in
bathymetry between the two surveys, and involved the assumption that the lake level was
higher in 1946 than in 1991. Carpenter et al. (1992) assumed that the lake level was
higher in 1946 because the area given for the lake in 1946 was greater than the area they
calculated. This comparison is complicated by lack of knowledge of how the area of the
lake was calculated in 1946. The change in lake depth that Carpenter et al. (1992)
calculated, 0.3 meters, represents a regression of 1.5 to 2 meters of the shoreline, based
on the slope of the lake bottom near shore. This change is about equal to the width of the
lake perimeter line that was drawn on the 1946 map. Also, the area of the lake that is
given on the 1946 map in Wolcott (1973) is 13.5 acres (5.46 hectares), but the area is
listed as 13.8 acres (5.58 hectares). This inconsistency raises questions about how the
area of the lake was determined, and what the true area was in 1946.
Carpenter et al. (1992) restated the 1946 volume of Mirror Lake published in Wolcott
(1973) as 324,400 cubic meters and the surface area as 5.46 hectares (54,600 square
meters). The volume subtracted to compensate for the assumed 0.3 meters drop in lake
level from the 1946 survey to 1991 was 389 cubic meters. However, 389 cubic meters is
the product of the 0.3 meters change in depth and the change in lake area after the depth
was reduced (1,295 square meters smaller), rather than the product of the depth change
and the total area of the lake. A change in depth of 0.3 meters over the area of the lake in
1946 yields a volume correction of 16,390 cubic meters, not 389 cubic meters. Carpenter
et al. (1992) calculated an adjusted lake volume of 324,000 cubic meters for 1946, and
subtracted their 1991 lake volume of 316,500 cubic meters to yield a lake volume change
of 7500 cubic meters. A volume correction of 16,390 cubic meters produces a lake
volume of 308,000 cubic meters. If the lake level correction of -0.3 meters is accurate,
there would have been an increase in lake volume from 1946 to 1991 for the same lake
level, i.e. the lake bottom would be lower in 1991 than in 1946. This result clearly seems
unlikely. In addition, because the estimate of sedimentation by Carpenter et al. (1992) is
well below the volume of sedimentation suggested by the cores taken from the lake in
2001, this question will not be considered further.
Comparison of 2000 Survey with 1946
I attempted to compare the map produced in 2000 with the map produced in 1946.
However, the depth contours on the map in Wolcott (1973) are highly generalized, and
the depth values from which the contour map was made are not shown on the map.
Wolcott (1973) lists the Washington Department of Game as the surveyor of the 1946
map, which later merged with the Washington Department of Fish and Wildlife (Lauren
Monday, 2000, oral communication). To locate the original survey data, I needed a
report number for the 1946 survey, but no number was listed in Wolcott (1973). Reed
Lake and Cain Lake, which are about 6 kilometers from Mirror Lake, were surveyed on
February 26, 1946, the same day Mirror Lake was surveyed. Thus the surveyors would
not have had time to measure as many points as were measured in subsequent surveys.
Therefore, the use of the 1946 survey for comparison at the level of detail that is
attempted here will not yield meaningful results unless the data and methods that were

used to derive the contours can be located.
SEDIMENT COLLECTION AND ANALYSIS
Sample Collection
Grab Sample Collection
Grab samples were collected from 14 locations in Mirror Lake (Table 1 and Figure
16) in February 2001 to determine how the grain size of near-surface deposits varies with
distance from and degree of alignment with the end of the input channel on the delta.
The samples were taken from a small boat using an Ekman grab sampler. Grab samples
1 through 10 were not positioned regularly. This was the result of wind drift and error in
the position provided by the global positioning system that was used in the sampling.
The samples were more closely spaced in the part of the lake closer to the delta, because
that is where I assumed that greatest change in sediment size would occur.
The sediments extracted with the Ekman sampler were scraped by hand into plastic
bags, air dried on aluminum foil, and stored in plastic bags until analysis. This part of the
process was easiest for the sediments that were less cohesive. Each sample was split to
produce a subsample of several hundred grams.
Sediment Coring
A Livingstone corer was used to collect cores from the lake in January and March of
2001. Wright (1967) provides a diagram of this apparatus. With the assistance of
George Mustoe, I constructed a seven by eight foot platform (Figure 17) for use in coring
the lake. According to Douglas H. Clark (oral communication, 2000) the depth of Mirror
Lake (about 10 meters) is near the practical limit of this method from a raft. A total of
four cores were collected from three different locations on the lake bottom (Table 1 and
Figure 16). The cores were all collected from the relatively flat deeper portion of the lake
because most complete records are from the deepest portions of lakes. The first coring
site, from which two cores were collected, was at the center of the lake. The second site
was closer to the delta, but was far enough from the delta to avoid coring in sands. The
third coring site was farthest from the delta.
The cores were collected in several segments, which are known as pushes. Each push
or segment of a core involves the connection of a column of cylindrical rods above a
piston, which has a square central rod that is turned to a locked position prior to coring.
This column of rods is held over the sediment to be cored. The core barrel is pushed or
twisted a maximum of 1 meter into the sediment, and then is pulled out of the
surrounding sediment. The column of rods is disassembled, and the filled piston is set
aside on the raft. This is repeated for additional pushes at lower depths at the same site
until the desired depth is reached or high resistance to penetrating the sediment is
encountered. My field assistants and I completed three to five pushes for each core and
collected cores with total lengths between 2.4 and 4.6 meters. The cores were then
extruded into split PVC pipe lined with commercial plastic wrap, secured, then
transported to the WWU cold room and stored at 5 degrees C.
Sediment Analysis and Discussion
Tests of the loss on ignition, water content and particle size were performed on the
grab samples and sediments from the cores after the core logs were produced. An
analysis of magnetic susceptibility was also performed on each core before it was split.
The first three tests provide information on organic content, compaction, and flow
velocity, and the last analysis relates to the organic content and mineral composition of
sediment.
Core Logging
Production
After the cores were analyzed for magnetic susceptibility, they were split lengthwise;
one set of the core halves was returned to cold storage for archival purposes.
Stratigraphic logs were made of the cores, although these logs show only visual changes
in the sediment, such as the transition at the onset of the diversion, and are not intended

to show all strata that are present. The cores are presented together as a fence diagram in
Plate 1 and individually with other measurements in Figures 18 through 21. The cores
were photographed before additional tests were performed, but because I took
photographs about seven weeks after splitting the cores, the colors recorded in the photos
show the sediments in an oxidized condition. Photographs of the different types of
sediment in the cores are shown in Figures 22 and 23.
Construction of the logs for each core involved combining the measurements from
three to five sections after their lengths have been reconstructed from the original lengths.
For each section, I recorded a push length in the field. For the first two cores removed, I
also recorded the length of core recovered after each push. After the cores were
extruded, I measured the length of each section again. The ends of the sections were
often tapered, so I measured the length of the tapered ends and estimated the length they
would occupy if restored to their original lengths. I then attempted to correct the lengths
of the extruded core sections to their original lengths, by comparing the extruded length
to the length recovered (available for the first two cores) or to the estimated push length.
The organic-rich sediments appeared to have been compacted varying amounts during
core extrusion, whereas there was little if any compaction of the post-diversion
sediments. For this reason, when both types of sediment were present in a push, I
assumed that all compaction was restricted to the organic-rich sediments and extended
the sections accordingly. Table 2 shows the relevant values. The boundaries between
each push of a core are identified in Plate 1 by small bars on the right side of each
column.
I made two additional adjustments to the core lengths. Analysis of the photographs
and particle size tests (referred to in the section on particle size analysis) suggested that
part of core ML01-4 included an unintended duplication of part of the sequence, which
occurred after the second push entered the sediment at a different angle than the first
push. This is the reason for my removal of the bottom 2 centimeters of push 1 and the
top 34 centimeters of push 2 from the final log of this core. For the second push of core
ML01-2 (Plate 1 and Figure 19) the difference between the push length and recovered
length suggested that a part of the core had been lost during the coring process, most
likely by falling out of the bottom of the core barrel. I estimated this length to be about
16 cm. Losses of core sediments from this process appear to be negligible in other core
segments.
Stratigraphy and Comparison with Other Lakes
The majority of the post-diversion sediment in each core is medium and coarse silt
(diameter 0.016 to 0.063 mm). Thickness of strata varies from about 1 millimeter to
about 5 centimeters. As might be expected, the thickness and grain size decrease away
from the delta. In spite of the presence of distinct strata, I could identify only one
distinctive marker bed in the cores. A 2- to 3-centimeter bed of clay and finer silt
(<0.016 mm) was deposited about 10 centimeters above the prediversion sediments, and
this is shown in the third photograph from the top in Figure 22. Core sediments are
described further in the section on particle size analysis.
The pre-diversion sediment in the cores consists primarily of gyttja and peat. Gyttja
is composed primarily of fine plant detritus, along with clay, finer silt and remains of
plankton. The gyttja is dark brown in color in most of the section, with rare wood
fragments. Close to the top of the gyttja in the cores near the delta and near the middle of
the lake is a series of clastic laminae at several millimeter intervals, several laminae are
about 1 mm in thickness, but others are much thinner and are only faintly visible. I
assume these laminae were deposited after logging in the drainage basin about 100 years
ago. If sediment from this time actually overlies the uppermost gyttja, the mineralogy of
what I assume is the lowermost post-diversion sediment should suggest a Mirror Lake
basin provenance rather than a Middle Fork Nooksack provenance. The peat was only

encountered in core ML01-4, at slightly more than 2 meters below the post-diversion
sediments; I assume that peat was deposited at the other coring sites, because those sites
are at a similar water depth to ML01-4, and that peat was present below the bottom of the
cores collected at the other sites.
In the lower portion of core 4, about 10 centimeters below the transition from gyttja to
peat, there is a pale yellow inorganic layer (Figure 23) that Douglas H. Clark (oral
communication, 2001) visually identified as the Mazama tephra, which was erupted
about 6850 14C years B.P. from Crater Lake, OR (Kittleman, 1973). Chemical analysis at
Washington State University confirms the tephra as from this Mazama eruption.
Newby et al. (2000) correlate changes in deposition between peat and organic mud to
the depth of water at a swamp in Massachusetts. They state that organic mud is deposited
during conditions of deeper water, and that peat is deposited when the water is shallower.
Deposition of gyttja appears to have predominated during the late Holocene at Mirror
Lake. However, peat is present in the lowest portion of core ML01-4, which is farthest
from the delta (Plate 1, Figure 16 and Figure 21), and the change from peat to gyttja
probably resulted from an increase in water depth that drowned emergent vegetation.
This indicates that the deeper portion of Mirror Lake was once a marsh, and that the lake
became deeper shortly after the deposition of the Mazama tephra. I did not investigate
the cause of this change in water depth. An increase in precipitation may have caused the
lake level to rise to the outlet level.
As a result of the diversion, sedimentation in Mirror Lake at present is more rapid than
in many lakes that have been cored for studies of glacial history. For example, Crowfoot
Lake, a 0.23 square kilometer lake in Alberta, accumulated 1.04 meters of sediment in
6800 radiocarbon years (Leonard and Reasoner, 1999). The sedimentation rate of 0.15
mm/yr in Crowfoot Lake is much lower than the 34 mm/yr in Mirror Lake. There are
other lakes where the volumetric sedimentation rate is probably similar to or greater than

the rate of Mirror Lake, but if these lakes are small and not very deep, they will probably
fill in rapidly to become part of a fluvial system. Deposits in Garibaldi Lake in British
Columbia appear to have accumulated at a rate greater than 1 m / 100 yr. (Douglas H.
Clark, 2001, written communication), and this rate can be sustained for a period of
millennia in a lake that is significantly deeper than Mirror Lake.
Mirror Lake experienced a change from deposition of gyttja during the late Holocene
to siliciclastic sedimentation during the past 40 years because the lake has acted as a
natural detention basin for the diversion. Most detention basins are constructed; the use
of a natural lake is rare. A lake in King County is used as a natural detention basin for
water from the Tolt Reservoir, but the sediment accumulation in this lake has been minor
because turbid river flows have not normally been diverted to this lake (Sheila Strehle,
2001, oral communication).
Loss on Ignition
Loss on ignition (LOI), which is one method of analyzing the percentage of organic
matter, was measured primarily for comparing the change in the amount of organic
matter from pre-diversion to post-diversion sediments. This test involves heating a
sample in stages and computing mass changes during each stage, i.e., loss of organic
matter For tests on the grab samples of loss on ignition, the subsamples mentioned
previously were split to produce subsamples between about 7 and 17 grams. These
smaller subsamples were then dried at temperatures of about 130 degrees Centigrade for
about 6 hours, transferred to ceramic crucibles, and weighed. After being fired at 550
degrees Centigrade for 30 minutes to oxidize the carbon in the sample, they were
reweighed. Table 3 shows the results of the loss on ignition tests. Loss on ignition
values were usually between 3% and 4% for the grab samples. The organic content of
the sediment was as low as 1% in the sand deposited at the delta, and was 4.5% in a
sample that contained visible plant fibers.
For the cores, LOI samples were collected at points within five to six centimeters of
the boundary between pre-diversion and post-diversion sediments, and at additional
locations that were several decimeters above or below this boundary (Figures 18 through
21). These locations were chosen in order to measure how the organic content of
sediment changed at the onset of the diversion. A hollow metal cylinder was used to
remove samples that were within 5% of one cubic centimeter. The samples were placed
in crucibles and weighed, then reweighed after drying at 110 to 120 degrees Centigrade
for about 4 hours and firing at 550 degrees Centigrade for 30 minutes to determine loss
on ignition. Although I actually fired 12 of the core samples at 650 degrees instead of the
standard 550 degrees, dewatering of micas and clays at 650 degrees should not have
affected the comparison of pre-diversion and post-diversion sediments. I did not redo the
tests on the samples that were fired at 650 degrees.
Results of loss on ignition tests for the cores are shown with the results for the grab
samples in Table 3. Loss on ignition for the cores varied from between 1.5% and 5% for
the post-diversion sediments and between 30% and 60% for the gyttja (Table 3).
Although half of the samples were dried at a temperature that was 100 degrees higher
than the standard (550 degrees Centigrade), the results presented here should be close to
the actual values. Deposition of clay and silt within the gyttja probably account for LOI
values below 100%. The amount of plant ash is probably too small to account for the
deficit.
The post-diversion sediments have probably compacted the pre-diversion sediments.
Determining the amount of compaction requires a bulk density measurement of
undisturbed lacustrine gyttja, which is not easy to obtain. I used four samples of the
upper 4 centimeters of uncompacted sediment from Fragrance Lake, in Whatcom
County, Washington (Township 37N, Range 3E, Section 30), and compared them to
samples from Mirror Lake. Measurements of wet and dry bulk density of 1 cubic

centimeter samples from the Mirror Lake cores and from Fragrance Lake sediments are
shown in Table 4. I used the samples from Fragrance Lake to estimate the compaction of
the Mirror Lake pre-diversion sediments.
I expected to find a trend of increasing density with depth in the Mirror Lake cores, at
least for the pre-diversion sediments. However, the main apparent difference in density
with position within the cores was greater density for the youngest gyttja deposits; these
deposits also have a lower organic content than the rest of the gyttja. Together, these
findings suggest a potential increase in clastic sedimentation in the lake, late in its
history, which could have been caused by human alteration of the landscape in the
watershed. The lack of a clear trend elsewhere in the cores may result from differences
in grain packing in the post-diversion sediments or differences in organic content in the
pre-diversion sediments. Inaccuracy in estimating the bulk density sample volume was
probably another factor; a difference of 0.1 millimeter in length of the cylindrical
collected sample translates to a difference of 1% in volume.
In order to assess the compaction of the pre-diversion sediments in Mirror Lake as a
result of burial by the diversion sediments, I assumed an average pre-compaction dry
bulk density for the pre-diversion sediments that had organic contents similar to those of
the sediment in the samples from Fragrance Lake. I compared samples that had similar
organic content to simplify the calculation of compaction. The samples I used were from
core ML01-3 at 254 and 257 centimeters from the top, and from core ML01-4 at 105
centimeters from the top (Table 4) The organic contents of these three samples are 5% to
15% higher than the average organic content of Fragrance Lake sediments, but these
samples were the closest matches. Comparison of the dry bulk densities of sediments
from Fragrance and Mirror Lakes (Table 4) suggests that the gyttja in Mirror Lake has
been compacted by a factor of about 200% relative to the degree of compaction about 3
or 4 centimeters below the top of sediment in Fragrance Lake. To make this comparison,

I assumed that, at the time the samples from the Mirror Lake cores that I mentioned
above had been covered by several centimeters of gyttja, they had a bulk density similar
to the bulk density of the samples I used from Fragrance Lake. I considered using
porosity of the sediments as a basis for comparison, but the magnification of small errors
in sample volume for the highly porous organic sediments complicated this comparison.
Dating Control
I collected 5 macrofossil samples from the pre-diversion portions of cores ML01-2,
ML01-3 and ML01-4 for radiocarbon analysis. The locations of these samples are
identified as “RC” in the column labeled “Other Measurements” of Figures 19 through
21. Table 5 describes these samples. The ages for the samples constrain the pre-
diversion sedimentation rates in Mirror Lake. The samples were processed at the
Lawrence Livermore National Laboratory’s Center for Accelerator Mass Spectrometry in
October 2001. I chose Sample 79714 and Sample 79716 from the bottom of core ML01-
4 and Sample 79717 from the bottom of core ML01-3 so that I could establish the long-
term sedimentation rate at opposite ends of the lake. Sample 79715 (stratigraphically
higher in core ML01-4 than the other two samples from that core) was selected to provide
a date for the change from peat to gyttja. Sample 79718 (from core ML01-2) was from
the upper portion of the gyttja in the mid-lake core because of the lack of larger
fragments of wood or other macrofossils from the bottom of this core. The 14C dates,
including the samples in close proximity in core ML01-4, are in stratigraphic order.
These dates in ML01-4 are also in agreement with the Mazama tephra.
Particle Size Analysis
Particle sizes in the cores and in the grab samples were determined using a laser
particle size analyzer, the Malvern Mastersizer 2000. The size analysis was not intended
to show every change in sediment size that occurred along the length of the cores, but
rather the general range of sediment sizes present, and whether there was any general

trend in grain size in the post-diversion sediments that was not apparent from visual
inspection. I also wanted to determine the manner in which sediment size changes with
distance from the delta. An additional use of the particle size analysis was to help
confirm that there was an unintended duplication of a portion of the strata in core ML01-
4.
Samples were collected from cores ML01-1, ML01-3 and Ml01-4 using a cylinder
with a cross sectional area of about one square centimeter or a small spatula. A spatula
was used to sample from the thinner strata of core ML01-4 (far from delta) because the
cylinder diameter is greater then the thickness of these strata. Core ML01-2 was not
tested for particle size because the pattern of sedimentation was visibly similar to that of
core ML01-1, and the two cores were removed from locations only several meters apart
in the center of the lake. One sample for particle size analysis was removed from each
grab sample. For tests of sediment size of the grab samples, the subsamples of each grab
sample were rewetted with water until they were pliable. They were then kneaded by
hand in a bag in the hope that this would remix the samples and reduce bias toward the
removal of finer or coarser particles.
To measure particle size of the sediments with the Malvern Mastersizer 2000, I diluted
each sample with distilled water in a plastic vial, produced a slurry, and added enough of
the vial contents to agitated water in the particle size analyzer to produce an obscuration
of at least 10%. Because the gyttja in my cores was cohesive, I added sodium
hexametaphoshate to deflocculate the pre-diversion sediments. I did not sonicate the
samples because this can cause the fragmentation of plant fragments. The Fraunhofer
operating procedure was used to determine particle size, because tests by George Mustoe
(oral communication, 2001) produced results that were similar to the results of pipette
analysis.
Although the magnitude of error of the particle size analyzer was not determined, the

median sizes of the post-diversion sediments that I obtained with the particle size
analyzer are usually within 1/4 of a phi size increment (0.005 to 0.015 mm) of the actual
grain sizes. The phi size is the inverse of the log2 of the grain diameter (in mm).
Beuselinck et al. (1998) stated that laser diffractometry gives more reproducible results
for particles smaller than 63 microns than does pipette analysis, and most of the
sediments I analyzed were smaller than 63 microns. The error in the size of the gyttja
particles could be more than 1/4 of a phi size (0.01 mm). Incomplete deflocculation of
organic sediments and fine clastics may have resulted in an apparent median grain size
that was larger than the actual median grain size, and the breaking apart of grains during
agitation may have lowered the measured grain size. The particle size of the inorganic
portion of the gyttja was not analyzed for this study.
Particle sizes of the grab samples are shown in Table 6 and Figure 24. Graphs of
sediment size in the cores are shown in Figures 18 through 21. The variations in post-
diversion clastic particle size are greatest in core ML01-3, which is closest to the delta.
There is a substantial difference in median grain size between cores at the center of the
lake and near the outlet (ML01-1 and ML01-4 respectively). Although these cores
contain primarily silt in the post-diversion sediments, the concentration of fine sand in the
cores often differed enough within several millimeters to be visible and to be felt as a
change in texture. Coarser particles were probably transported to the part of the lake
opposite the delta by density currents on the lake floor. Otherwise, they would have
settled closer to the delta, as suggested by Stokes’ Law.
Particle size data for the gyttja (Figure 23) are shown in the lower part of the grain
size graph for each core in Figures 18 through 21 and in Table 7. According to the
results of the tests using the particle size analyzer (Malvern Mastersizer 2000), the
median size of the organic particles in the gyttja is in the range of very fine sand, which
extends from 4 phi (0.063 mm) to 3 phi (0.125 mm). Sand-sized organic particles are

probably most common because this lake receives detritus from a lowland temperate
forest. The samples from core ML01-4 are probably coarser than those of cores ML01-1
and ML01-3 because core ML01-4 is located close to a shoreline composed of peat.
Fragments of peat may have been eroded from the shore at this location.
In core ML01-3, which is closest to the delta, the post-diversion sediments are about
2.5 meters thick. They consist primarily of laminae and 1- to 3-centimeter beds that are
about 45% medium and coarse silt, 25% very fine and fine sand, 20% very fine and fine
silt, and 10% clay, in the Wentworth classification of grain sizes. In the Wentworth
classification, the boundary between sand and silt is at 0.063 mm, the boundary between
medium silt and fine silt is at 0.016 mm, and the boundary between silt and clay is at
0.004 mm. Strata of mostly very fine and fine sand (Figure 22), which have a thickness
of 5 millimeters to 4 centimeters, are also present but are found mainly in the uppermost
65 centimeters of this core. A lamina or thin bed of fine wood fragments occurs above
many of the sand beds (Figure 22). Laminae of clay and silt are common and more
evenly distributed than sand in this core; their lower contact is visibly gradational with
the predominant strata.
Cores ML01-1 and ML01-2 (middle of lake) also contain laminae and 1- to 3-
centimeter beds that are primarily silt. The composition of the characteristic sediments is
50% medium and coarse silt, 25% very fine and fine silt, 15% very fine and fine sand,
and 10% clay. Strata of the most common composition, which is medium to coarse silt,
alternate with strata that contain up to 25% sand, or almost no sand, and have a thickness
of up to slightly greater than 1 centimeter (finer strata are primarily laminae). The sand
beds found in core Ml01-3 (near the delta) are absent at this location (Figure 22).
Core ML01-4, which is farthest from the delta, contains less sand (about 8% very fine
sand) and more finer silts and clay (30% and 12% respectively) than cores from the
center of the lake. Laminae and 1- to 3-centimeter thick beds of medium to coarse silt are

separated by laminae that consist of up to 25% sand and are about 5 millimeters thick.
The pattern of grain-size distribution appears to repeat near the bottom of the post-
diversion sediments (Figure 25), and this was one reason for the elimination of
centimeters 98 to 132 on the original log of core ML01-4 (Figure 26).
Magnetic Susceptibility
Results of Tests
The primary purpose of testing the sediments for magnetic susceptibility is to measure
the organic content and clastic content of the gyttja and post-diversion sediments in each
core, and to provide a tool for stratigraphic correlation of cores. A secondary purpose
was to provide a quantitative measurement that could be compared with another sediment
property, such as grain size distribution at each point in the core, and more accurately
determine the source area of sediments in the post-diversion portion of the core.
However, this secondary use is complicated, because the presence of certain clays can
influence magnetic susceptibility values; ferromagnetic minerals are not the sole
determinant (Verosub and Roberts, 1995). Results of the magnetic susceptibility tests on
the cores removed in 2001 might be useful in comparing these cores with cores removed
from Mirror Lake in the future, assuming that the patterns are distinct enough to be
correlated.
The results of the magnetic susceptibility tests are shown in Figures 18 through 21.
The upper portion of each core, which contains sediment deposited after the diversion
began from the Middle Fork, is lower in organic content than the pre-diversion
sediments. The transition from pre-diversion to post-diversion sediments is readily
apparent in the magnetic susceptibility, as this is where the largest changes occur between
measurements. This transition is actually sharper than is indicated on the graphs, based
on visual and LOI analysis of the cores. The transition probably does not represent
clearing of ground cover in the drainage basin 100 years ago because the sediment

immediately above the transition does not appear to be weathering products or soil. The
change in organic content is sustained.
I needed to alter the graphs of magnetic susceptibility when I transformed the results
from the separate pushes into a single graph for each core. Some of the original readings
were negative, and this may have been caused by the diamagnetic nature of the PVC
plastic that contained the core segments (Bernard Housen, oral communication, 2001).
Because of this, I changed the negative readings, which were usually only -1 x 10⁻⁵ or -2 x
10-5, to 0. This change was not enough to be noticeable on the scale at which the graphs
are shown. Also, when I extended or compacted a section to approximate its original
length, I respectively decreased or increased the magnetic susceptibility values
proportionately, so that the area between the curves and the zero line was about the same
as before the cores were adjusted. This produces only an approximate correction.
Comparison of Magnetic Susceptibility Results
The magnetic susceptibility of the post-diversion sediments is not consistent between
cores nor homogeneous. Aside from the measurements taken near the end of each core
segment, the susceptibility values are highest just above the middle of the post-diversion
portion of each core. The measurements near the ends of each push are identified by
open circles in Figures 18 through 21, and are lower than the actual magnetic
susceptibility values because of edge effects. In the Mirror Lake cores, variations exist
on two scales: one scale is the difference in magnetic susceptibility between the pre-
diversion sediments and the post-diversion sediments, and the other scale is the
centimeter-to-centimeter variation in the post-diversion sediments.
The change in magnetic susceptibility from the pre-diversion to the post-diversion
sediments is readily apparent. The post-diversion sediments have a much higher clastic
content, and this correlates with the large difference in magnetic susceptibility. The loss
on ignition values given in Table 3 for each core are 5% or less in the post-diversion
sediments, where magnetic susceptibility values are on the order of 400 x10-5 to 600 x10-5
(Figures 18 through 21). Magnetic susceptibility is rarely greater than 10 x10-5 in the
pre-diversion sediments. This change in sediment type may not explain the difference,
however; the cause of the difference might be redox reactions or bacterial activity in pore
water, for example. Additional geochemical tests would be needed.
The changes in magnetic susceptibility within the post-diversion sediments probably
relate to the amount of sediment mobilized by storm event erosion in the Middle Fork
watershed (Figure 4), although diagenesis in pore-water may also be a factor. The
proportions of sediments derived from glaciers and weathered soils may be reflected in
sediment bulk magnetic properties (Verosub and Roberts, 1995), because weathering
removes elements at different rates. Additional tests would be necessary to determine the
minerals contributing to magnetic susceptibility in the Mirror Lake cores (Bernard
Housen, 2001, oral communication). These tests would probably involve comparison of
magnetic susceptibility with respect to particle size, i.e. bedload and suspended load.
A second possible explanation for the differences in the post-diversion sediments is
differences in grain size. This might occur if rocks of different bulk magnetic
susceptibility were differentially weathered or transported. There was no apparent
correlation between the two parameters on a scale of tens of centimeters within any one
core or between individual cores. If grain size correlated with magnetic susceptibility,
the magnetic susceptibility values in the upper 60 centimeters of core ML01-3 (close to
the delta) would be noticeably greater than in the upper 60 centimeters of core ML01-4
(opposite the delta) because there is a large difference in sediment size between these 2
core segments. However, most magnetic susceptibility values in these two intervals are
between 400 x10-5 and 500 x10-5 (SI units). A third possible cause of changes in magnetic
properties was a change in porosity in the post-diversion sediments. There is no
conclusive correlation between magnetic susceptibility and water content (Table 4), nor

hence porosity, in the post-diversion sediments of cores Ml01-3 and Ml01-4.

DISCUSSION OF SEDIMENTATION RATES
Pre-diversion Rates
The rate of sedimentation in Mirror Lake prior to the diversion is based on radiometric
dating of small macrofossils in the gyttja and peat and on the Mazama tephra deposit. As
stated in the section “Loss on Ignition,” the sediment compaction factor appears to be
about 200% in the pre-diversion sediments. The rates given here are after decompaction
by 200%. The accumulation rate for the most recent gyttja deposits near the middle of
the lake, based on the calibrated age for sample 79718 from ML01-2 (Table 5) is 0.8 mm
per year. For the sediments at the end of the lake closest to the delta, sample 79717
indicates a rate of 0.7 mm per year, which is probably not significantly different from 0.8
mm per year. The transition from gyttja to peat, based on sample 79715 in core ML01-4,
is 6690 calibrated years B.P., and this yields an accumulation rate of 0.6 mm per year for
the core farthest from the delta. Samples 79714 and 79716 from core ML01-4 suggest an
accumulation rate for the peat of 0.45 mm per year and 0.5 mm per year respectively,
assuming a compaction factor of two. Errors in these values from analytic uncertainty
are between 3% and 10%. Potential error from assuming a uniform compaction is
difficult to quantify, but is probably between 10% and 20%. The presence of the
Mazama tephra at cm 314 to cm 316 suggests that accumulation of peat after deposition
of the tephra was 40% of the rate before the tephra was deposited.
The peat and the tephra in core ML01-4 were not present in core ML01-2 (middle of
lake) or in core ML01-3 (near delta). If the sedimentation rates in cores ML01-2 and
ML01-3 are assumed to be linear, the gyttja-peat boundary should occur at a depth of 406
cm at site ML01-2 and 486 cm deep at site ML01-3. The tephra would probably be about
10 cm lower in each section. By extrapolating sedimentation rates from higher in the
cores, the calibrated ages of the gyttja at the bottom of cores ML01-2 and ML01-3 would
be about 3640 and 5910 years B.P., respectively.
Post-diversion Sedimentation Rates, Volumes
Data from the cores produce a better estimate of the rate of sedimentation in Mirror
Lake than does comparing the surveys of 1991 and 2000. In cores ML01-1 and ML01-2,
near the center of the lake (Figures 16, 18 and 19), about 1.3 meters of post-diversion
sediments were deposited between 1962 and 2000. In core ML01-3, which is closer to
the delta, the thickness of post-diversion sediments is about 2.5 meters. Core ML01-4,
which is across the lake from the delta, contains about 1 meter of post-diversion
sediment. Although strata of sand and silt are present in the cores, there is no distinct
marker bed that could be identified as having been deposited in 1991.
I assumed that sedimentation for the entire lake from 1991 to 2000 is about 25% of the
total post-diversion deposits. In core ML01-3, I assumed that the sedimentation was
slightly higher for 1991 to 2000 than for 1962 to 1991 and estimated a deposit thickness
of about 75 centimeters between 1991 and 2000 (8.4 cm per year), out of a total post-
diversion sediment thickness of about 250 centimeters (6.6 cm per year). At the site of
cores ML01-1 and ML01-2, I estimated that slightly more 30 centimeters have been
deposited from 1991 to 2000 (3.4 cm per year), out of a total post-diversion thickness of
about 130 to 135 centimeters (3.5 cm per year). In core ML01-4, thickness for 1991 to
2000 is about 25 centimeters (2.8 cm per year), out of a total thickness of about 1 meter
(2.6 cm per year). I assumed a constant sedimentation rate for cores ML01-1, ML01-2,
and ML01-4.
I chose a value of sedimentation for the period 1991 to 2000 in core ML01-3 that was
greater than 25% of the total. About 10 centimeters of sandy sediment is present in the
upper portion of the core (Figure 20) and sand beds with similar grain size and sorting are
not present in the middle and lower portion of the core. My interpretation of this higher
sand content is that a larger than average turbidity current deposited fine and very fine
sand at these locations. This turbidity current may have been generated by transport of

sand to the distal end of the input channel. This could have occurred if the diversion was
begun while the lake level was low and the delta was exposed, by the collapse of the
northern part of the delta, or by higher-density storm currents. However, any conclusion
is speculative.
Rates of deposition at the core sites allowed me to produce a map of estimated
sedimentation for the central portion of the lake, where sedimentation rates are lower than
near the delta. A map of estimated sedimentation between 1991 and 2000 for the entire
lake is shown in Figure 27. The map is of the changes from 1991 to 2000 because my
knowledge of the form of the lake bottom near the delta before the diversion was
constructed is limited.
To produce a total volume of sedimentation, I overlaid graph paper on the
sedimentation map so as to cover sectors that were 10 meters on a side, and estimated the
sediment accumulation for each sector. Because no cores were removed at the margins
of the lake, the locations of isopachs near the lake edge are speculative. Based on this
method, about 15,000 +/- 2000 cubic meters of sediment have been deposited between
1991 and 2000, or an average of 1700 +/- 220 cubic meters per year. This infilling
represents about 0.6% of the lake volume per year. Because of the sparse cores and the
lack of a marker horizon for 1991, quantifying the error in the estimate of sedimentation
was difficult. Error sources involve the estimate of the post-1991 sediment thickness and
the placement of contours near the margins of the lake. I assumed that sediment
thickness near the lake margins was approximately proportional to depth and to distance
from the source .
My estimate of sedimentation between 1962 and 2000, based on my assumption of the
location of the pre-diversion to post-diversion transition, is about 60,000 +/- 6000 cubic
meters, or about 1600 +/-160 cubic meters per year. This estimate is an average rate for
1962 to 2000, and is lower than for 1991 to 2000 because the diversion was operated for

a smaller portion of the year before 1985. The error margin is lower than for the period
1991 to 2000 because the boundary between pre-diversion and post-diversion sediment is
a good constraint on the lower stratigraphic boundary for this interval; i.e., this source of
error is negligible.

CONCLUSIONS AND RECOMMENDATIONS
This study of Mirror Lake has resulted in a follow-up sedimentation map of Mirror
Lake about 10 years after the previous study, as was recommended by Carpenter et al.
(1992). I attempted to compare the map from the survey of 2000 with the maps from
previous surveys of 1991 and 1946, but the accuracy of the combined measurements
limited the usefulness of the comparison to the area near the delta, where sediment
accumulation was greatest in the past nine years. I tried to establish an accurate survey of
the lake, but my methods could be improved in future surveys. The City of Bellingham
has established a benchmark that can be used with the reference mark I established for
this survey, or in place of it.
The survey was accompanied by coring of the lake at three sites using a Livingstone
coring system, as well as grab sampling using an Ekman grab sampler. This was
followed by analyzing the cores and the sediments for loss-on-ignition, compaction,
sediment size and magnetic susceptibility. Based on the coring, carried out in early 2001,
I was able to determine a more accurate rate of sedimentation for the period the diversion
has operated than was possible in previous studies, which did not involve coring the
sediments. The average sedimentation rate since 1991 has been about 3.5 cm per year
near the middle of the lake, or about 1700 +/- 220 cubic meters per year for the entire
lake, assuming that the sedimentation rate was constant between 1962 and 2000.
Analysis of the core sediments did not permit identification of yearly deposits.
Radiocarbon dates from three cores, as well as the presence of the Mazama tephra, permit
calculation of the rate of deposition for the pre-diversion gyttja; this averages about 0.7
mm per year for the three cores. The rate of peat deposition appears to have been similar.
The first step in any future survey should be to locate the reference used in the 2000
survey, provided that this marker has not been removed or disturbed. The center of the
“V” in the transmission tower immediately north of Park Road (Figure 8) can be used to
fix an azimuth for the survey. Finding the position of the reference marker used in 2000
on the UTM grid (1983 datum) directly by using a survey-grade GPS unit would be
helpful, although finding enough satellites from the reference marker may take longer
than in areas without overhanging vegetation. In the event that the reference marker that
I established in 2000 is removed or cannot be found, the benchmark established at the
outlet of the diversion by the City of Bellingham can be used to establish an elevation for
a new reference marker.
Although it would help to use the same survey points as in the 2000 survey, it is more
important to space survey points closely, so that minimal interpolation is needed to
produce a map. The use of slightly different locations should still produce a map
comparable to the map presented in this thesis. A GPS total station could potentially
provide more accurate measurement locations. Another improvement over the study of
2000 and 2001 would be the use of radar, sonar or some other device to produce an image
of the sediments on the lake floor, so that the thickness and volume of both the post-
diversion sediments and the organic pre-diversion sediments can be determined more
accurately than through coring alone. However, coring of the lake down to Pleistocene
sediments would be beneficial if this provides information on the thickness of the peat
encountered in core ML01-4.

REFERENCES Anderson, R. Y. and Kirkland, D. W., 1969, Paleoecology of an Early Pleistocene Lake on the High Plains of Texas: Geological Society of America, Boulder, Colorado, 215 pp. Barrett Consulting Group, 1995, Water Systems Operations Manual, Volume 1: Water Supply and Treatment: City of Bellingham Public Works Department, Bellingham, Washington, 219 p. Beuselinck, L., Govers, G., Poesen, J., DeGraer, G., and Froyen, L., 1998, Grain-size analysis by laser diffractometry: comparison with the sieve-pipette method: Catena, Vol. 32, pp. 193-208. Bondevik, S., Svendsen, J. I. and Mangerud, J., 1997, Tsunami sedimentary facies deposited by the Storegga Tsunami in shallow marine basins and coastal lakes, western Norway: Sedimentology, Vol. 44, no. 6, pp. 1115-1131. Campbell, C., 1998, Late Holocene lake sedimentology and climate change in southern Alberta, Canada: Quaternary Research, Vol. 49, pp. 96-101. Carpenter, M., Suczek, C. and Matthews, R., 1992, Mirror Lake sedimentation study, summary report: prepared for the City of Bellingham Public Works, Western Washington University, Bellingham Washington, 28 p. Coleman, A.P., 1929, Long range correlation of varves: Journal of Geology, Vol. 37, no. 8, pp. 783-789. Easterbrook, D.J., 1969, Pleistocene chronology of the Puget Lowland and San Juan Islands, Washington: GSA Bulletin, Vol. 80, no. 11, pp. 2273-2286. Edgarton, H. E., Payson, H., Jules, J. and Dillon, W., 1964, Sonar probing in Narragansett Bay: Science, Vol. 146, no. 3650, pp. 1459-1460. Golden Software, Inc., 1997, Surfer (Win 32) Version 6.04: Surface Mapping System, Copyright 1993 to 1997. Goldin, A., 1992, Soil Survey of Whatcom County Area, Washington: United States Department of Agriculture, Soil Conservation Service, in cooperation with Washington State Department of Natural Resources and Washington State University, Agricultural Resource Center, 481 pp. Haugerud, R. A., 1980, The Shuksan Metamorphic Suite and Shuksan Thrust, Mt.
Watson Area, North Cascades, Washington: Master’s thesis, Western Washington University, Bellingham, Washington, 125 pp. Johnson, R. A. and Bhattacharyya, G. K., 1992, Statistics: Principles and Methods, Second Edition: New York, John Wiley and Sons, INC., 686 pp. Jones, A. P., and Omoto, K., 2000, Towards establishing criteria for identifying trigger mechanisms of soft-sediment deformation: a case study of late Pleistocene sands and clays, Onikobe and Nakayamadaira basins, northeastern Japan: Sedimentology, Vol. 47, no. 6, pp. 1211-1226. Kittleman, L. R., 1973, Mineralogy, correlation and grain-size distribution of Mazama tephra and other post-glacial pyroclastic surges, Pacific Northwest: GSA Bulletin, Vol. 84, no. 9, pp. 2957-2980. Kling, G. W.., 2000, A lake’s life is not its own: Nature, Vol. 408, no. 6809, pp. 149-150. Kovanen, D. J. and Easterbrook, D. J., 2001, Late Pleistocene, post-Vashon, alpine glaciation of the Nooksack drainage, North Cascades, Washington: Geological Society of America Bulletin, Vol. 113, no. 2, pp. 274-288. Lapen, T. J. 2000, Geologic Map of the Bellingham 1:100,000 Quadrangle, Washington: Washington Department of Natural Resources, Division of Geology and Earth Resources, Open File Report 2000-5. Leonard, E. M. and Reasoner, M. A., 1999, A continuous Holocene glacial record inferred from proglacial lake sediments in Banff National Park, Alberta, Canada: Quaternary Research, Vol. 51, no. 1, pp. 1-13. Newby, P. E., Killoran, P., Waldorf, M. R., Shuman, B. N., Webb, R. S. and Webb, Thompson III, 2000, 14,000 Years of sediment, vegetation, and water-level changes at the Makepeace Cedar Swamp, southeastern Massachusetts: Quaternary Research, Vol. 53, no 3. pp. 352-368. Nicholson, M. E., Planning Director, 1981, Lake Whatcom Subarea Background Document: An Inventory and Analysis of Existing Conditions: Whatcom County Planning Department, Bellingham, Washington, 226 pp. Oldfield, F., 1977, Lakes and their drainage basins as units of sediment-based ecological study: Progress in Physical Geography, Vol. 1., no. 3, pp. 460-504. Reading, H. G., ed., 1996, Sedimentary Environments: Processes, Facies and Stratigraphy, Third Edition: Blackwell Science Limited, Cambridge, Massachusetts,

688 pp. Reeves, C. C. Jr., 1968, Developments in Sedimentology II: Introduction to Paleolimnology: Elsevier Publishing Company, New York, 228 pp. Rittenour, T. M., Brigham-Grette, J. and Mann, M. E., 2000, El Nino-like climate teleconnections in New England during the late Pleistocene: Science, Vol. 288, no. 5468, pp. 1039-1042. Superior Court of the State of Washington, for Whatcom County, 1953, Glen Corning et al. versus City of Bellingham, number 29814: available from Washington State Superior Court, Whatcom County, Clerk of the Superior Court. Thompson, D. B., 1989, Logging Railroads in Skagit County: Northwest Short Line, Seattle, Washington, 297 pp. U.S. Geological Survey, 1994, Acme, Washington, [map]: Reston, Virginia, 1:24,000. U.S. Geological Survey, 1975, Bellingham, Washington [map]: Reston, Virginia, 1:100,000. U.S. Geological Survey, 1979, Mt. Baker, Washington - British Columbia [map]: Reston, Virginia, 1:100,000. U.S. Geological Survey, 1982, State of Washington [map]: Reston, Virginia, 1:500,000. Verosub, K. L. and Roberts, A. P., 1995, Environmental magnetism: past, present and future: Journal of Geophysical Research, Vol. 1, no. B2, pp. 2175-2192. Vicens, A., Schwartz, D., Bertaux, D., Elenga, H., and de Namur, C., 1998, Late Holocene climatic changes in western equatorial Africa inferred from pollen from Lake Sinnda, southern Congo: Quaternary Research, Vol. 50, no. 1, pp.34-45. Wolcott, E. E., 1973, Lakes of Washington, Volume I: Western Washington: State of Washington Department of Ecology, Olympia, Washington, 619 p. Wright, H.E., 1967, A square-rod piston sampler for lake sediments: Journal of Sedimentary Petrology, Vol. 37, no. 3, pp. 975-976.

Table 1. Locations of cores and grab samples collected in Mirror Lake during 2001. Sample UTM E UTM N Core 1 557449 5390292 Core 2 557449 5390292 Core 3 557504 5390244 Core 4 557357 5390371 Grab 1 557565 5390205 Grab 2 557544 5390235 Grab 3 557542 5390221 Grab 4 557536 5390223 Grab 5 557490 5390227 Grab 6 557472 5390247 Grab 7 557467 5390249 Grab 8 557430 5390308 Grab 9 557355 5390366 Grab 10 557338 5390361 Grab 11 557535 5390248 Grab 12 557546 5390272 Grab 13 557506 5390226 Grab 14 557496 5390207 UTM E is Universal Transverse Mercator Easting UTM N is Universal Transverse Mercator Northing Section 10U of UTM, 1983 datum is used for coordinates
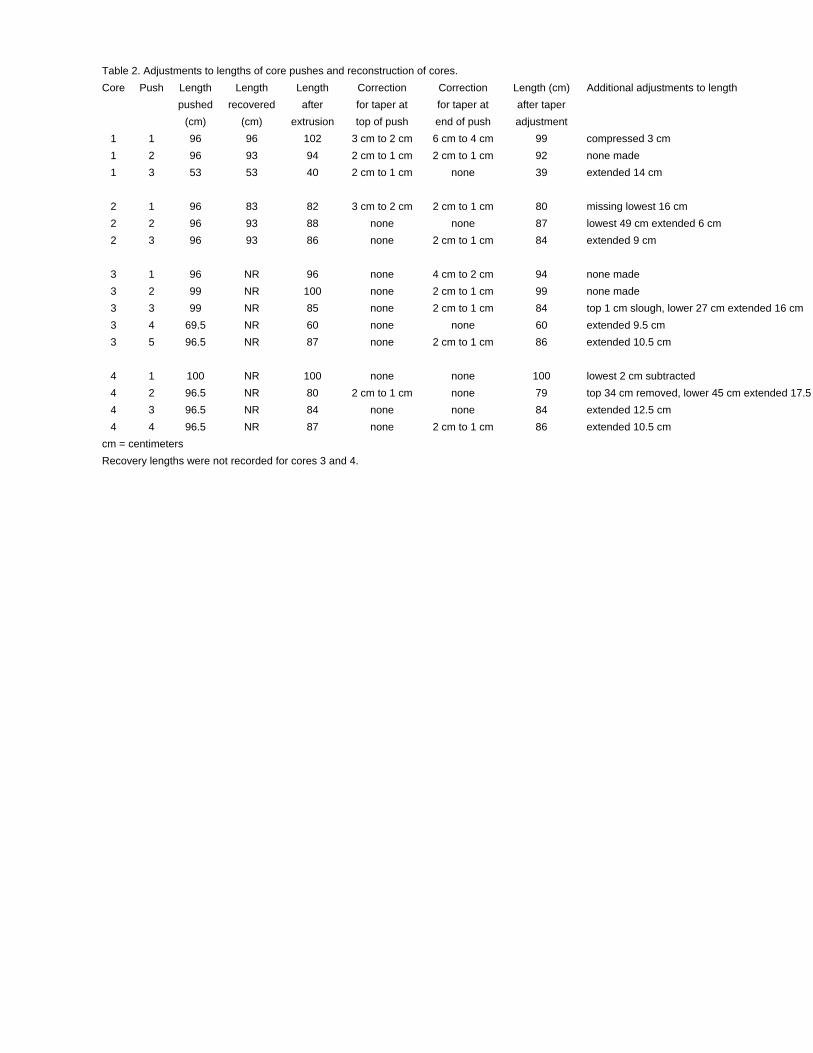
Table 2. Adjustments to lengths of core pushes and reconstruction of cores. Core Push Length Length Length Correction Correction Length (cm) Additional adjustments to length
pushed recovered after for taper at for taper at after taper (cm) (cm) extrusion top of push end of push adjustment
1 1 96 96 102 3 cm to 2 cm 6 cm to 4 cm 99 compressed 3 cm 1 2 96 93 94 2 cm to 1 cm 2 cm to 1 cm 92 none made 1 3 53 53 40 2 cm to 1 cm none 39 extended 14 cm
2 1 96 83 82 3 cm to 2 cm 2 cm to 1 cm 80 missing lowest 16 cm 2 2 96 93 88 none none 87 lowest 49 cm extended 6 cm 2 3 96 93 86 none 2 cm to 1 cm 84 extended 9 cm
3 1 96 NR 96 none 4 cm to 2 cm 94 none made 3 2 99 NR 100 none 2 cm to 1 cm 99 none made 3 3 99 NR 85 none 2 cm to 1 cm 84 top 1 cm slough, lower 27 cm extended 16 cm 3 4 69.5 NR 60 none none 60 extended 9.5 cm 3 5 96.5 NR 87 none 2 cm to 1 cm 86 extended 10.5 cm
4 1 100 NR 100 none none 100 lowest 2 cm subtracted 4 2 96.5 NR 80 2 cm to 1 cm none 79 top 34 cm removed, lower 45 cm extended 17.5 4 3 96.5 NR 84 none none 84 extended 12.5 cm 4 4 96.5 NR 87 none 2 cm to 1 cm 86 extended 10.5 cm
cm = centimeters Recovery lengths were not recorded for cores 3 and 4.

Table 3. Loss on ignition results for Mirror Lake grab samples and cores X denotes Grab sample Centimeters Grab sample Core sample loss on ignition LOI overfire
or core from top % loss on Pre-diversion Boundary Post-diversion (At 6500 C) number (for cores) ignition
GS1 1.0 GS2 2.4 GS3 4.5 GS4 3.6 GS5 3.4 GS6 2.9 GS7 3.6 GS8 3.3 GS9 3.5
GS10 3.0 GS11 3.0 GS12 3.2 GS13 3.5 GS14 3.3
ML01-1 28 3.3 X 86 5.1 X 129 3.2 X 133 32.3 X 214 60.1 X
ML01-2 29 2 X 125 3 X 132 2.4 X 134 10.4 X 136 32.9 X
ML01-3 13 2 X 34 1.7 X 80 3.3 141 2.1 143 2 234 2.8 247 1.9 249 13.1 251 34
254 32 257 39 350 53 352 59 440 44 442 43
ML01-4 94 2.3 96 2.8 98 5.9 100 32.5 102 36.5 218 53 220 54 306 26 309 67 346 80 347 83

Table 4. Results from bulk density and organic content (LOI) measurements. Notes Sediment Centimeters Wet density Dry density Water LOI
source from top (grams/cc) (grams/cc) content (percent) (grams/cc) core 3 silt 7 2.08 1.48 0.6 2 core 3 silt 10 2.14 1.61 0.53 3 core 3 silt 152 2.15 1.61 0.54 2 core 3 silt 156 2.01 1.52 0.49 1 core 3 silt 246 1.81 1.35 0.46 2 core 3 silt 248 2.25 1.73 0.52 2 core 3 gyttja 254 1.16 0.25 0.91 32 core 3 gyttja 257 1.14 0.23 0.91 39 core 3 gyttja 350 1.08 0.17 0.91 53 core 3 gyttja 352 1.03 0.17 0.86 59 core 3 gyttja 440 1.13 0.16 0.97 44 core 3 gyttja 442 0.99 0.14 0.85 43 core 4 silt 11 1.88 1.38 0.5 2 core 4 silt 12 2.08 1.49 0.59 2 core 4 silt 50 1.93 1.35 0.58 2 core 4 silt 52 1.77 1.22 0.55 2 core 4 silt 88 2.08 1.45 0.63 3 core 4 silt 93 1.89 1.29 0.6 2 core 4 gyttja 105 1.36 0.34 1.02 29 core 4 gyttja 108 1.11 0.20 0.91 45 core 4 gyttja 218 1.18 0.17 1.01 53 core 4 gyttja 220 0.99 0.13 0.86 54 core 4 peat 306 1.12 0.31 0.81 26 Sand present core 4 peat 309 1.03 0.12 0.91 67 core 4 peat 346 1.00 0.10 0.9 80 core 4 peat 347 1.13 0.12 1.01 83 Fragrance Lake 1 1.06 0.20 0.86 22 Sample size Fragrance Lake 2 1.06 0.15 0.91 29 is 5 cubic cm Fragrance Lake 3 1.08 0.11 0.97 23 for Fragrance Fragrance Lake 4 1.10 0.12 0.98 22 Lake samples

Table 5. Location of radiocarbon samples processed at Lawrence Livermore National Laboratory CAMS.
Sample Sampled Weight in CAMS Core Centimeters Relative
name material milligrams number number from top Location of core
ML01/4/350 seed 2 79716 ML01-4 350 near bottom of core far from delta ML01/4/340 twig 15 79714 ML01-4 340 near bottom of core far from delta ML01/4/304 seed 2 79715 ML01-4 304 at gyttja-peat boundary ML01/3/432 twig 8 79717 ML01-3 432 near bottom of core close to delta ML01/2/173 needle 1.9 79718 ML01-2 173 middle of gyttja in mid-lake core

Table 6. Distribution of particle sizes in Mirror Lake grab samples. Percent Percent Percent Percent Percent very fine medium & Percent clay to clay to clay Percent & fine silt coarse silt Percent clay fine silt coarse silt to sand Grab clay (0.004 to (0.016 to sand sample (<0.004 mm) 0.016 mm) 0.063 mm) (>0.063 mm) 1 0 0 0 100 0 0 0 100 2 4 8 22 66 4 12 34 100 3 4 9 27 60 4 13 40 100 4 5 9 23 63 5 14 37 100 5 6 13 35 46 6 19 54 100 6 8 17 38 37 8 25 63 100 7 8 18 42 32 8 26 68 100 8 11 23 46 20 11 34 80 100 9 11 27 49 13 11 38 87 100 10 9 25 53 13 9 34 87 100 11 3 7 27 63 3 10 37 100 12 2 10 37 51 2 12 49 100 13 5 12 32 51 5 17 49 100 14 10 26 41 23 10 36 77 100

Percent Percent Percent Percent Percent very fine medium & Percent clay to clay to clay
Percent & fine silt coarse silt Percent clay fine silt coarse silt to sand Grab clay (0.004 to (0.016 to sand
sample (<0.004 mm) 0.016 mm) 0.063 mm) (>0.063 mm)
Core 1 Centimeters from top 1 13 33 44 10 13 46 90 100 7 13 31 46 10 13 44 90 100 13 10 26 51 13 10 36 87 100 16 11 26 50 13 11 37 87 100 19 7 17 59 17 7 24 83 100 21 14 33 47 6 14 47 94 100 22 8 24 53 15 8 32 85 100 26 10 21 53 16 10 31 84 100 30 8 19 53 20 8 27 80 100 34 11 26 55 8 11 37 92 100 38 12 29 48 11 12 41 89 100 42 9 24 53 14 9 33 86 100 46 9 23 55 13 9 32 87 100 49 10 25 52 13 10 35 87 100 53 11 28 41 20 11 39 80 100 57 25 45 29 1 25 70 99 100 61 10 26 53 11 10 36 89 100 65 8 23 48 21 8 31 79 100 69 8 23 48 21 8 31 79 100 73 13 28 46 13 13 41 87 100 77 11 27 43 19 11 38 81 100 80 11 26 48 15 11 37 85 100 84 11 25 50 14 11 36 86 100 88 11 21 51 17 11 32 83 100 92 8 20 49 23 8 28 77 100 96 12 23 49 16 12 35 84 100 97 12 24 46 18 12 36 82 100 101 11 21 52 16 11 32 84 100 105 12 27 46 15 12 39 85 100 109 12 27 44 17 12 39 83 100 113 9 23 46 22 9 32 78 100 117 9 20 52 19 9 29 81 100 121 24 53 23 0 24 77 100 100 125 9 20 56 15 9 29 85 100 132 2 15 35 48 2 17 52 100 137 2 13 35 50 2 15 50 100 157 1 9 29 61 1 10 39 100

Percent Percent Percent Percent Percent very fine medium & Percent clay to clay to clay
Percent & fine silt coarse silt Percent clay fine silt coarse silt to sand Grab clay (0.004 to (0.016 to sand
sample (<0.004 mm) 0.016 mm) 0.063 mm) (>0.063 mm)
Core 3 Centimeters from top 2 6 14 33 47 6 20 53 100 6 7 17 50 26 7 24 74 100 10 10 23 44 23 10 33 77 100 12 5 9 29 57 5 14 43 100 16 5 14 38 43 5 19 57 100 20 6 13 39 42 6 19 58 100 22 9 21 51 19 9 30 81 100 27 11 24 45 20 11 35 80 100 30 3 6 25 66 3 9 34 100 34 1 2 8 89 1 3 11 100 38 4 7 37 52 4 11 48 100 42 2 2 27 69 2 4 31 100 46 8 17 45 30 8 25 70 100 50 8 22 49 21 8 30 79 100 54 2 4 18 76 2 6 24 100 58 7 20 39 34 7 27 66 100 62 3 7 33 57 3 10 43 100 66 8 22 39 31 8 30 69 100 70 13 29 44 14 13 42 86 100 74 13 29 43 15 13 42 85 100 78 12 26 46 16 12 38 84 100 82 11 25 44 20 11 36 80 100 86 7 15 49 29 7 22 71 100 90 13 25 45 17 13 38 83 100 96 9 17 42 32 9 26 68 100 100 7 17 47 29 7 24 71 100 104 9 21 50 20 9 30 80 100 108 10 25 43 22 10 35 78 100 112 8 20 44 28 8 28 72 100 116 5 12 51 32 5 17 68 100 120 9 21 44 26 9 30 74 100 124 9 23 37 31 9 32 69 100 128 6 15 47 32 6 21 68 100 132 10 25 44 21 10 35 79 100 136 8 18 46 28 8 26 72 100 140 14 24 40 22 14 38 78 100 144 4 11 51 34 4 15 66 100 148 8 20 46 26 8 28 74 100 152 6 17 45 32 6 23 68 100 156 9 19 43 29 9 28 71 100 160 9 19 46 26 9 28 74 100 164 6 15 40 39 6 21 61 100 168 10 22 50 18 10 32 82 100 172 6 13 47 34 6 19 66 100 176 6 18 41 35 6 24 65 100 180 6 16 42 36 6 22 64 100 184 8 17 46 29 8 25 71 100
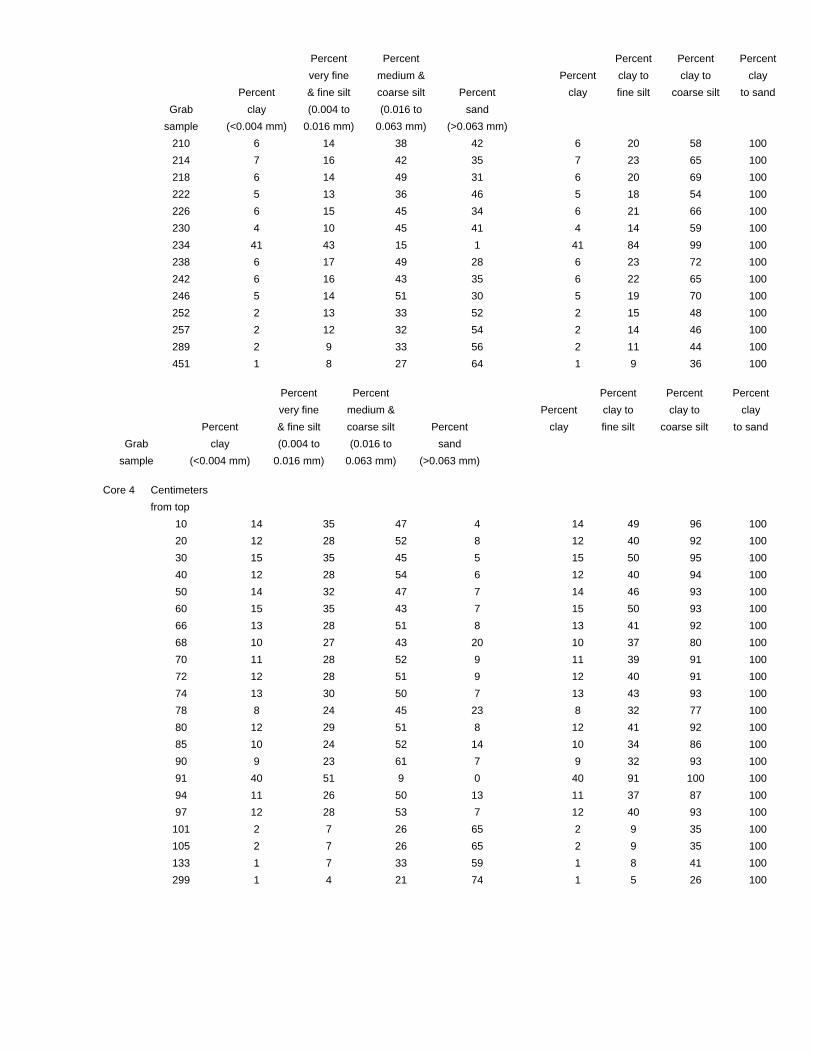
Percent Percent Percent Percent Percent very fine medium & Percent clay to clay to clay Percent & fine silt coarse silt Percent clay fine silt coarse silt to sand Grab clay (0.004 to (0.016 to sand sample (<0.004 mm) 0.016 mm) 0.063 mm) (>0.063 mm) 210 6 14 38 42 6 20 58 100 214 7 16 42 35 7 23 65 100 218 6 14 49 31 6 20 69 100 222 5 13 36 46 5 18 54 100 226 6 15 45 34 6 21 66 100 230 4 10 45 41 4 14 59 100 234 41 43 15 1 41 84 99 100 238 6 17 49 28 6 23 72 100 242 6 16 43 35 6 22 65 100 246 5 14 51 30 5 19 70 100 252 2 13 33 52 2 15 48 100 257 2 12 32 54 2 14 46 100 289 2 9 33 56 2 11 44 100 451 1 8 27 64 1 9 36 100
Percent Percent Percent Percent Percent very fine medium & Percent clay to clay to clay
Percent & fine silt coarse silt Percent clay fine silt coarse silt to sand Grab clay (0.004 to (0.016 to sand
sample (<0.004 mm) 0.016 mm) 0.063 mm) (>0.063 mm)
Core 4 Centimeters from top 10 14 35 47 4 14 49 96 100 20 12 28 52 8 12 40 92 100 30 15 35 45 5 15 50 95 100 40 12 28 54 6 12 40 94 100 50 14 32 47 7 14 46 93 100 60 15 35 43 7 15 50 93 100 66 13 28 51 8 13 41 92 100 68 10 27 43 20 10 37 80 100 70 11 28 52 9 11 39 91 100 72 12 28 51 9 12 40 91 100 74 13 30 50 7 13 43 93 100 78 8 24 45 23 8 32 77 100 80 12 29 51 8 12 41 92 100 85 10 24 52 14 10 34 86 100 90 9 23 61 7 9 32 93 100 91 40 51 9 0 40 91 100 100 94 11 26 50 13 11 37 87 100 97 12 28 53 7 12 40 93 100 101 2 7 26 65 2 9 35 100 105 2 7 26 65 2 9 35 100 133 1 7 33 59 1 8 41 100 299 1 4 21 74 1 5 26 100

Percent Percent Percent Percent very fine medium & Percent clay to clay to
Percent & fine silt coarse silt Percent clay fine silt coarse silt Grab clay (0.004 to (0.016 to sand
sample (<0.004 mm) 0.016 mm) 0.063 mm) (>0.063 mm)
Deleted portion - positions given are the positions before removal 102 14 29 47 10 14 43 90 100 104 8 25 47 20 8 33 80 100 108 13 29 49 9 13 42 91 100 110 13 29 50 8 13 42 92 100 113 10 25 44 21 10 35 79 100 119 8 22 54 16 8 30 84 100 124 10 24 58 8 10 34 92 100 125 42 44 12 2 42 86 98 100 128 11 27 55 7 11 38 93 100 131 12 28 53 7 12 40 93 100
Table 7. Sizes of gyttja in pre-diversion sediments. %very fine % medium &fine silt &coarse silt Core cm from top %clay (0.004 to (0.016 to %sand
(<0.004 mm) 0.016 mm) 0.063 mm) (0.063 mm) 1 132 2 15 35 48 2 17 52 100 1 137 2 13 35 50 2 15 50 100 1 157 1 9 29 61 1 10 39 100
3 252 2 13 33 52 2 15 48 100 3 257 2 12 32 54 2 14 46 100 3 289 2 9 33 56 2 11 44 100 3 451 1 8 27 64 1 9 36 100
4 101 2 7 26 65 2 9 35 100 4 105 2 7 26 65 2 9 35 100 4 133 1 7 33 59 1 8 41 100 4 299 1 4 21 74 1 5 26 100
Sediment has high organic content. Size fractions include all sediment types.
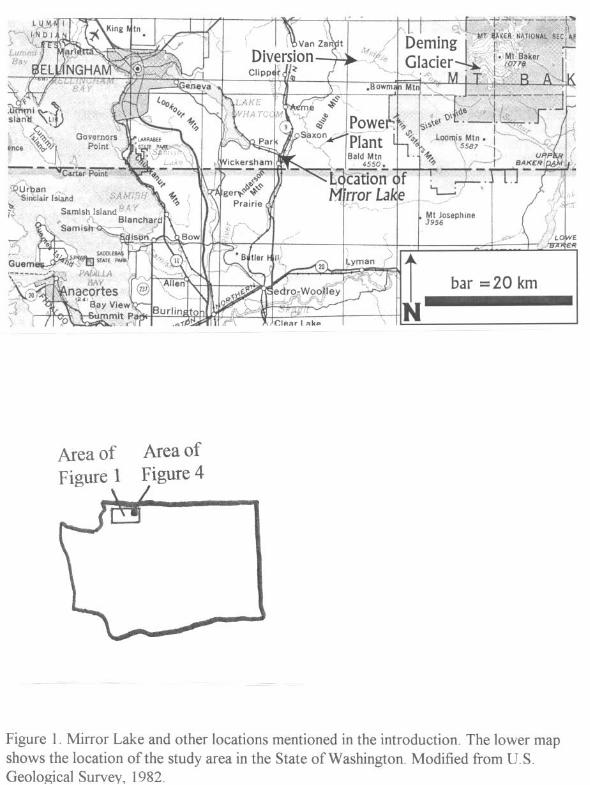

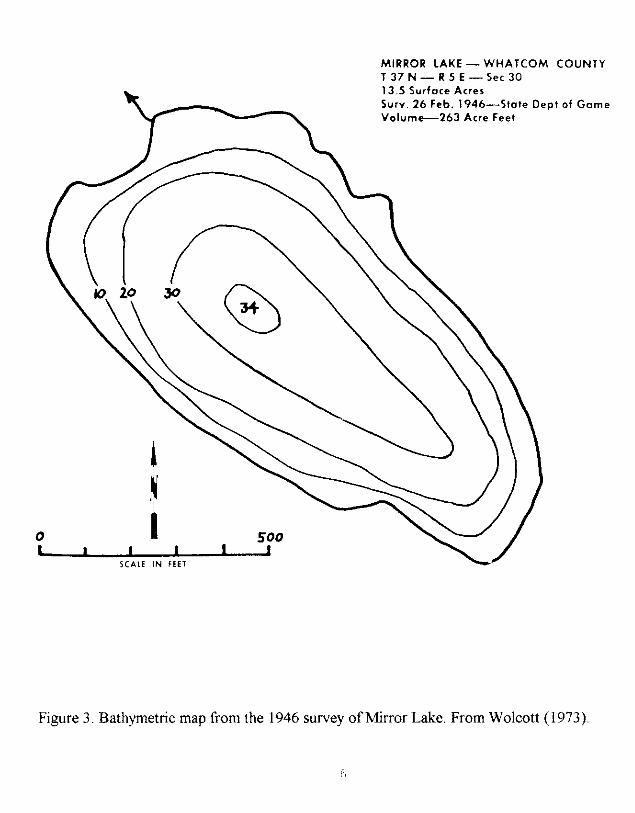


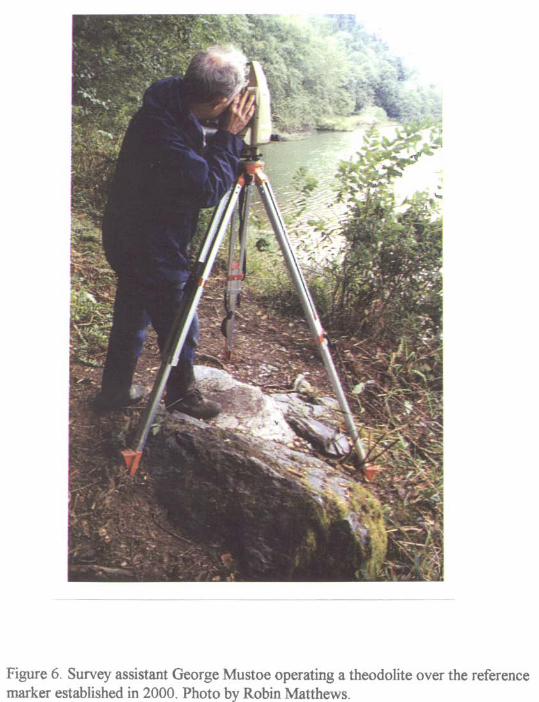
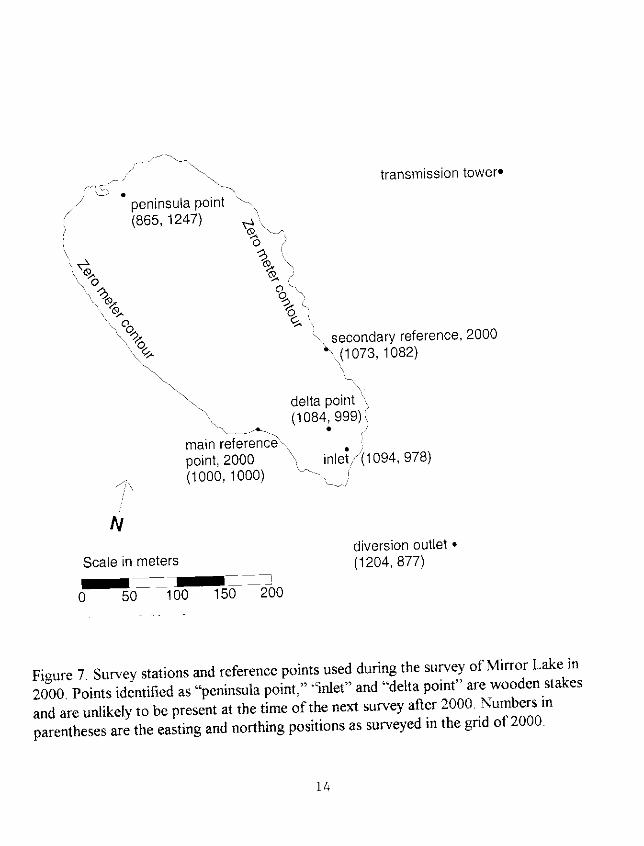


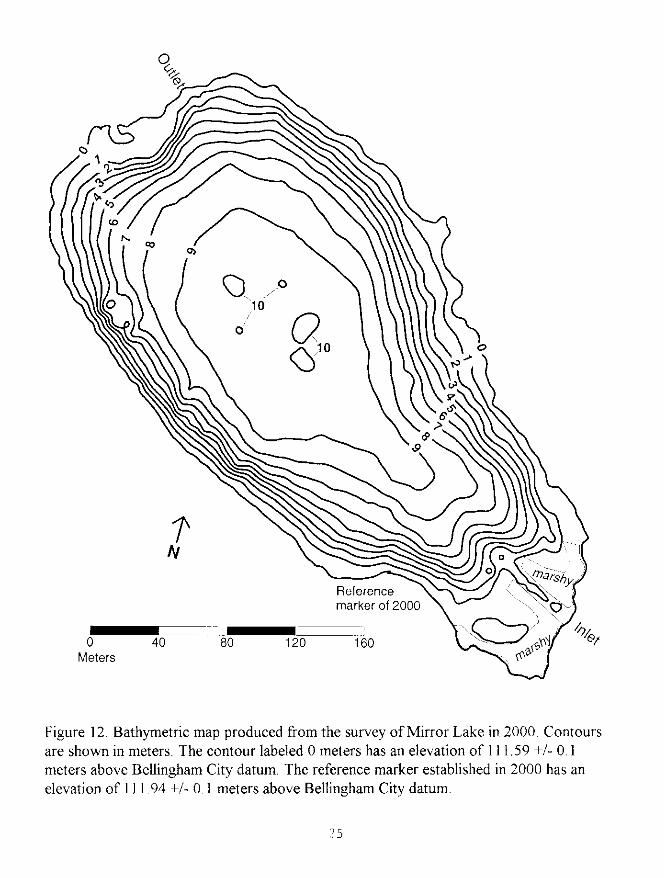
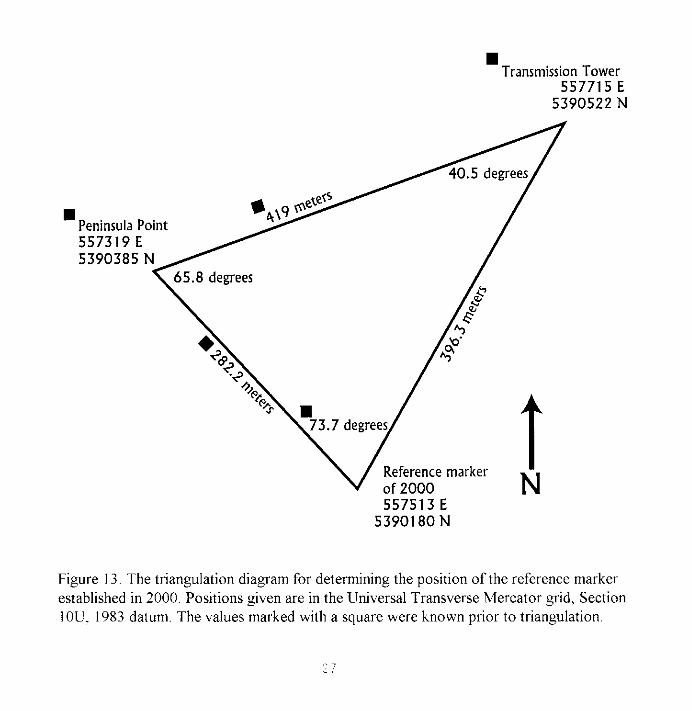

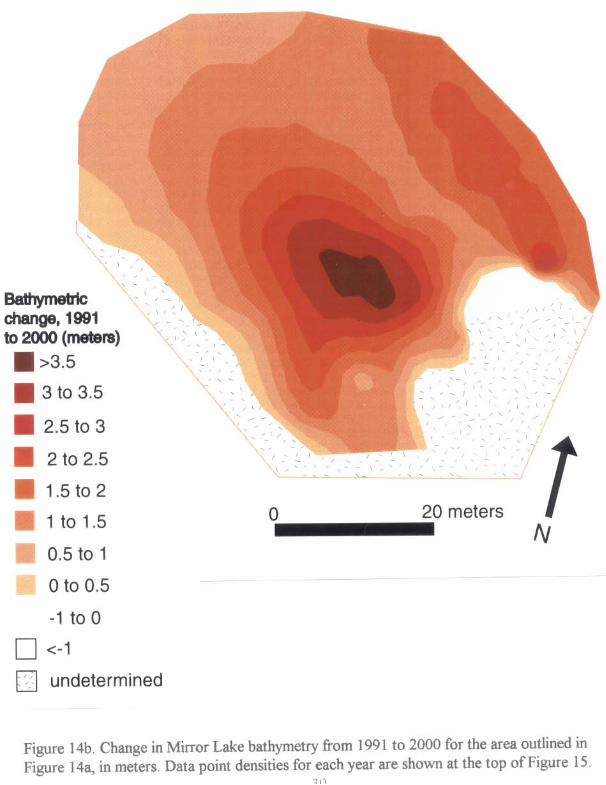

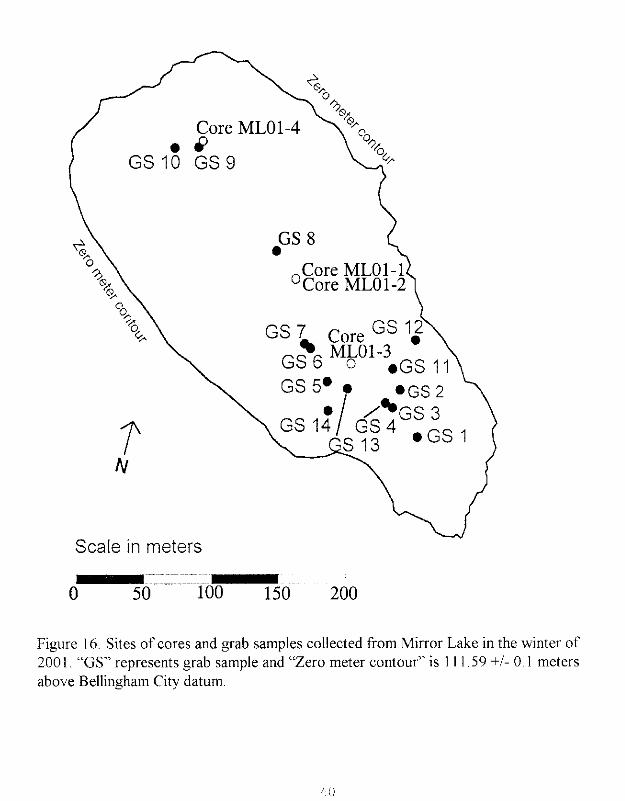

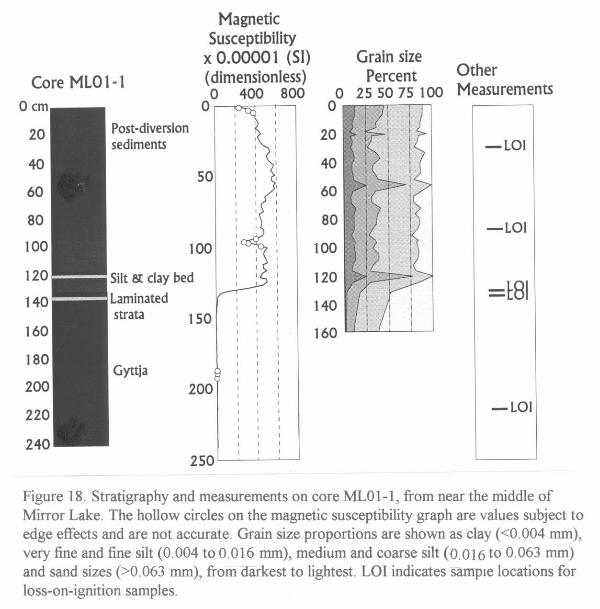

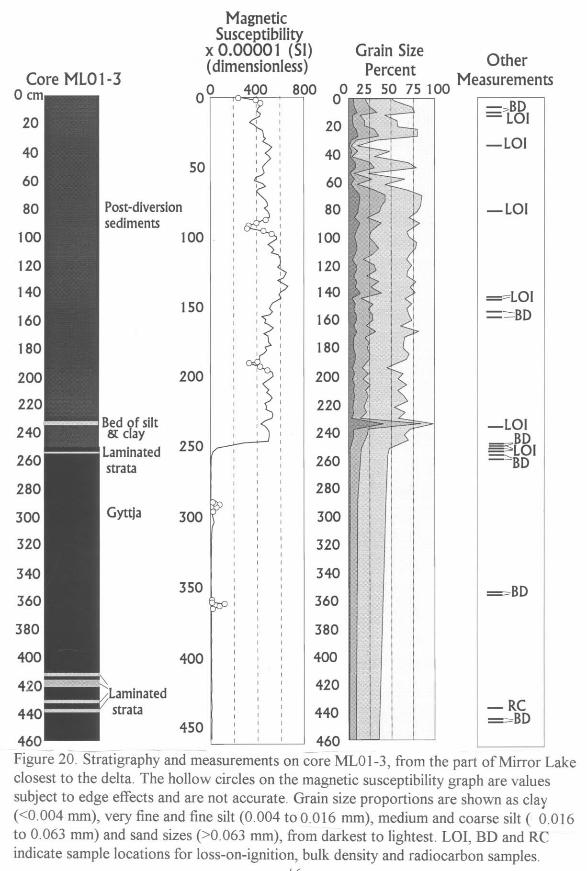

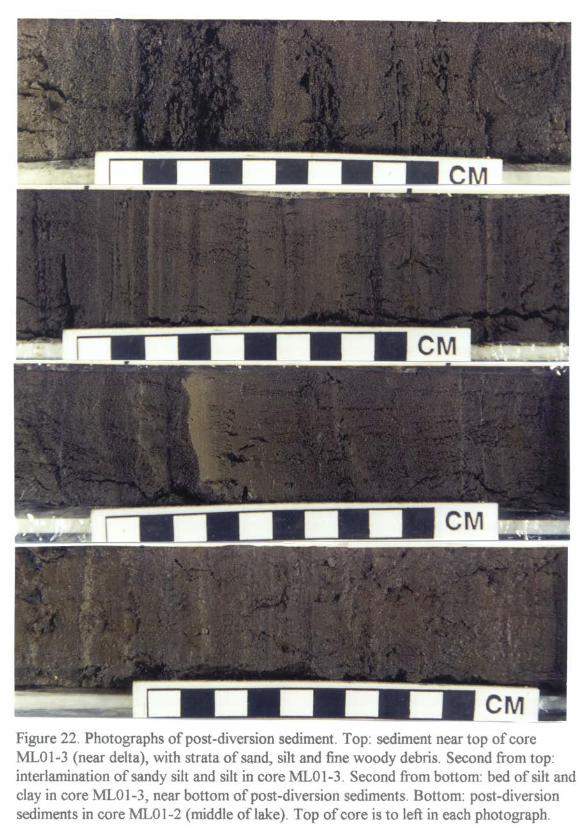


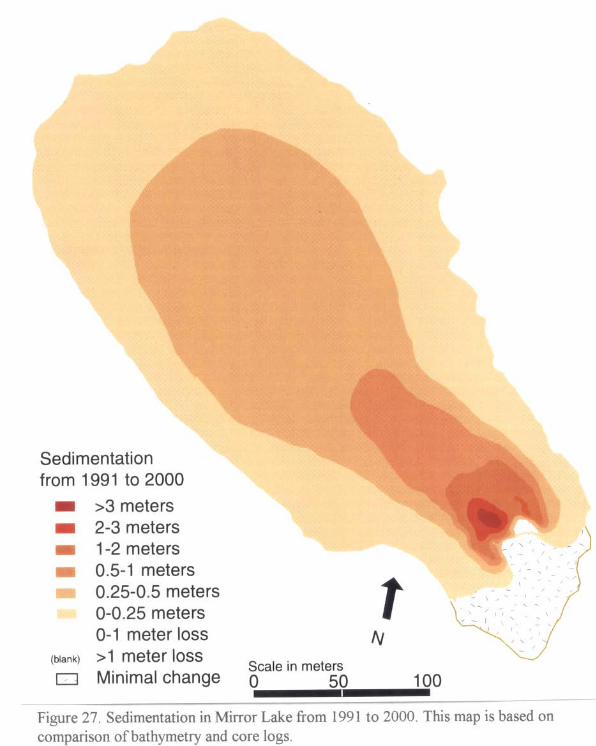

Appendix A: Mirror Lake Survey Data of 2000 All values are in meters Easting
Northing
Distance below high water
Easting
Northing
Distance below high water
883.67 1275.11 1.38 953.80 1047.10 6.08 885.02 1274.99 1.54 962.70 1036.40 5.17 888.17 1275.97 1.31 973.20 1032.10 5.47 889.35 1276.97 1.08 981.40 1026.90 5.47 888.53 1278.86 0.10 995.60 1020.40 5.47 891.17 1277.61 1.06 1002.40 1019.60 5.47 896.84 1277.61 1.06 1000.50 1016.80 3.95 902.69 1280.64 0.96 1000.80 1011.80 2.73 909.59 1280.45 0.98 1003.70 1010.60 3.03 911.26 1286.16 0.05 1008.80 1009.10 3.03 916.56 1278.59 0.97 1015.30 1007.20 3.34 931.39 1273.39 0.94 1023.80 1005.40 3.95 932.21 1278.85 0.23 1028.40 1003.30 3.64 936.12 1269.81 0.97 1033.90 1000.10 3.34 940.38 1263.98 1.16 1039.90 995.60 3.03 947.26 1260.57 0.93 1047.20 992.30 2.73 949.75 1265.75 0.15 1051.60 989.30 1.81 956.03 1256.17 1.02 1060.00 1000.80 3.34 960.86 1251.33 0.97 1047.50 1006.50 4.86 967.58 1248.98 1.04 1041.10 1011.40 6.08 978.63 1242.48 0.93 1033.90 1016.90 7.30 985.50 1236.82 0.99 1015.70 1028.00 7.61 992.43 1230.97 0.92 996.20 1036.20 7.00 999.10 1223.09 0.92 991.30 1041.40 7.00 1004.27 1224.91 0.07 984.40 1047.60 7.61 1007.35 1208.44 0.83 979.00 1050.00 7.61 1011.40 1204.08 0.97 887.29 1269.83 1.51 1016.27 1198.61 0.95 891.46 1270.61 2.42 1019.83 1201.38 0.34 898.11 1274.71 2.12 1029.04 1202.47 0.34 904.26 1274.22 1.81 1031.08 1195.91 0.50 910.55 1272.87 1.81 1023.04 1186.45 0.95 916.00 1271.81 1.51 1027.21 1177.35 0.89 921.65 1269.55 1.81 1030.74 1174.34 0.60 928.51 1267.22 2.42 1033.48 1174.58 0.04 933.11 1263.47 3.64 1029.89 1168.50 0.95 942.51 1255.76 3.34 1036.44 1165.40 0.75 948.31 1253.21 2.73 1032.62 1158.50 0.96 954.46 1248.76 2.73 1039.93 1152.12 -1.35 958.14 1244.80 3.03
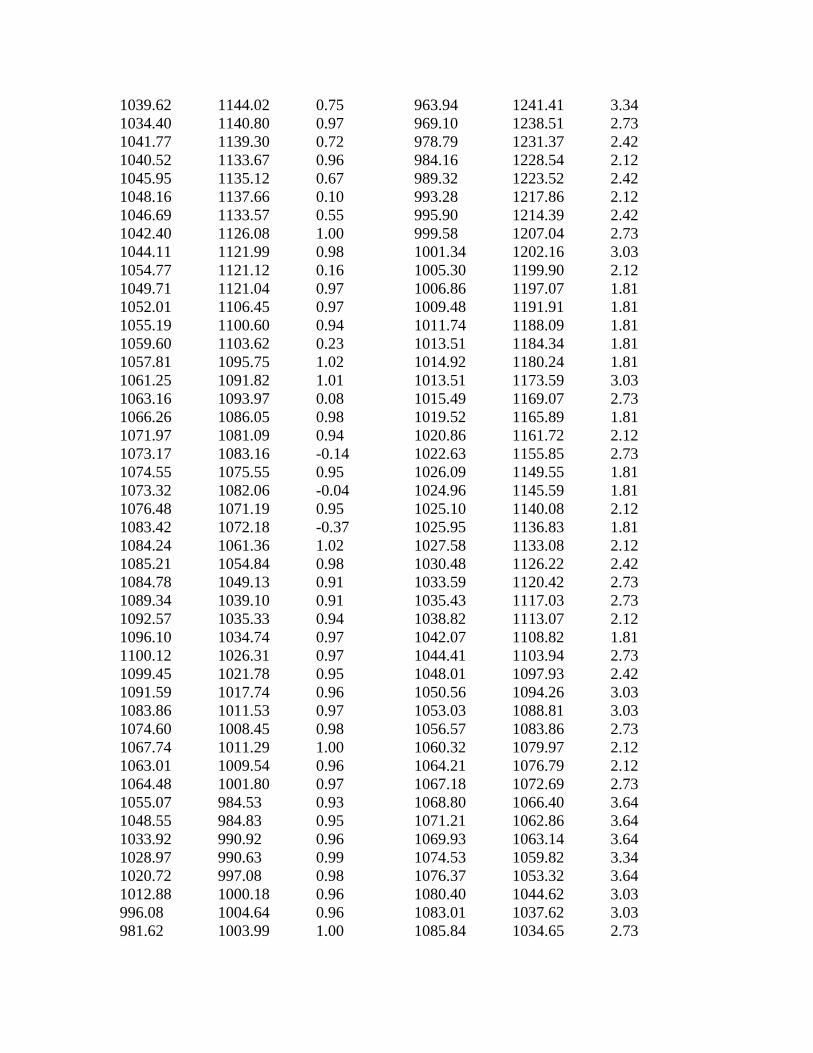
1039.62 1144.02 0.75 963.94 1241.41 3.34 1034.40 1140.80 0.97 969.10 1238.51 2.73 1041.77 1139.30 0.72 978.79 1231.37 2.42 1040.52 1133.67 0.96 984.16 1228.54 2.12 1045.95 1135.12 0.67 989.32 1223.52 2.42 1048.16 1137.66 0.10 993.28 1217.86 2.12 1046.69 1133.57 0.55 995.90 1214.39 2.42 1042.40 1126.08 1.00 999.58 1207.04 2.73 1044.11 1121.99 0.98 1001.34 1202.16 3.03 1054.77 1121.12 0.16 1005.30 1199.90 2.12 1049.71 1121.04 0.97 1006.86 1197.07 1.81 1052.01 1106.45 0.97 1009.48 1191.91 1.81 1055.19 1100.60 0.94 1011.74 1188.09 1.81 1059.60 1103.62 0.23 1013.51 1184.34 1.81 1057.81 1095.75 1.02 1014.92 1180.24 1.81 1061.25 1091.82 1.01 1013.51 1173.59 3.03 1063.16 1093.97 0.08 1015.49 1169.07 2.73 1066.26 1086.05 0.98 1019.52 1165.89 1.81 1071.97 1081.09 0.94 1020.86 1161.72 2.12 1073.17 1083.16 -0.14 1022.63 1155.85 2.73 1074.55 1075.55 0.95 1026.09 1149.55 1.81 1073.32 1082.06 -0.04 1024.96 1145.59 1.81 1076.48 1071.19 0.95 1025.10 1140.08 2.12 1083.42 1072.18 -0.37 1025.95 1136.83 1.81 1084.24 1061.36 1.02 1027.58 1133.08 2.12 1085.21 1054.84 0.98 1030.48 1126.22 2.42 1084.78 1049.13 0.91 1033.59 1120.42 2.73 1089.34 1039.10 0.91 1035.43 1117.03 2.73 1092.57 1035.33 0.94 1038.82 1113.07 2.12 1096.10 1034.74 0.97 1042.07 1108.82 1.81 1100.12 1026.31 0.97 1044.41 1103.94 2.73 1099.45 1021.78 0.95 1048.01 1097.93 2.42 1091.59 1017.74 0.96 1050.56 1094.26 3.03 1083.86 1011.53 0.97 1053.03 1088.81 3.03 1074.60 1008.45 0.98 1056.57 1083.86 2.73 1067.74 1011.29 1.00 1060.32 1079.97 2.12 1063.01 1009.54 0.96 1064.21 1076.79 2.12 1064.48 1001.80 0.97 1067.18 1072.69 2.73 1055.07 984.53 0.93 1068.80 1066.40 3.64 1048.55 984.83 0.95 1071.21 1062.86 3.64 1033.92 990.92 0.96 1069.93 1063.14 3.64 1028.97 990.63 0.99 1074.53 1059.82 3.34 1020.72 997.08 0.98 1076.37 1053.32 3.64 1012.88 1000.18 0.96 1080.40 1044.62 3.03 996.08 1004.64 0.96 1083.01 1037.62 3.03 981.62 1003.99 1.00 1085.84 1034.65 2.73
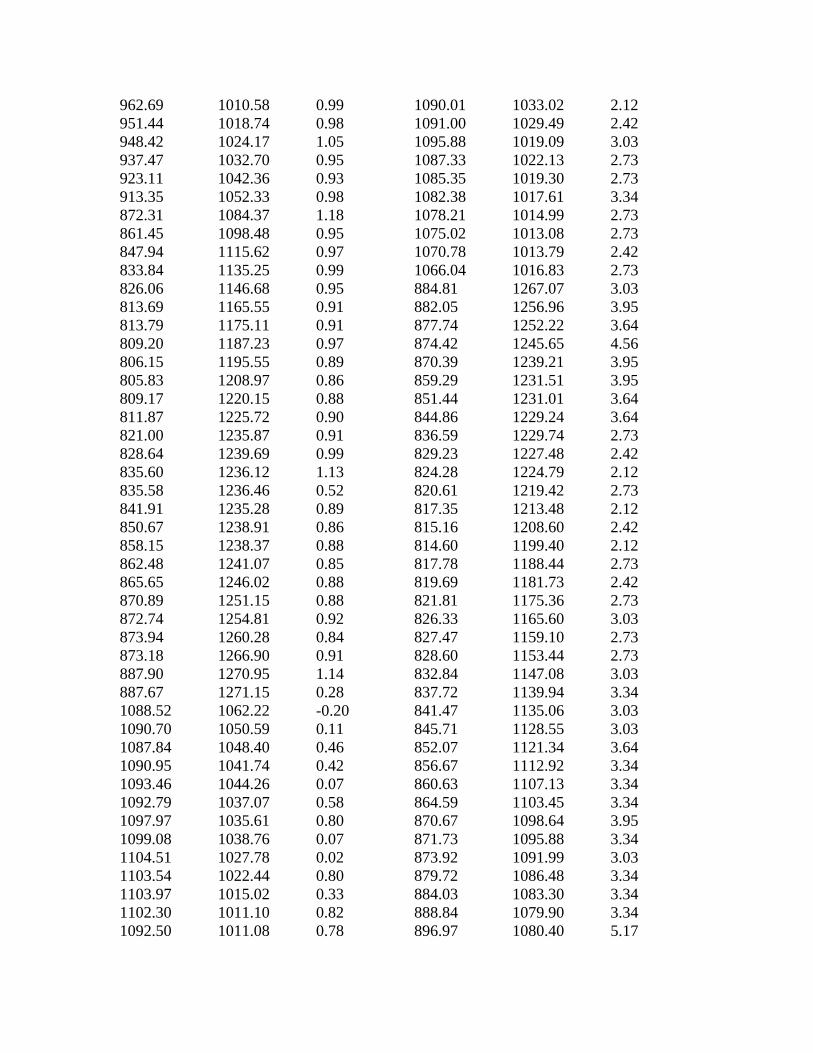
962.69 1010.58 0.99 1090.01 1033.02 2.12 951.44 1018.74 0.98 1091.00 1029.49 2.42 948.42 1024.17 1.05 1095.88 1019.09 3.03 937.47 1032.70 0.95 1087.33 1022.13 2.73 923.11 1042.36 0.93 1085.35 1019.30 2.73 913.35 1052.33 0.98 1082.38 1017.61 3.34 872.31 1084.37 1.18 1078.21 1014.99 2.73 861.45 1098.48 0.95 1075.02 1013.08 2.73 847.94 1115.62 0.97 1070.78 1013.79 2.42 833.84 1135.25 0.99 1066.04 1016.83 2.73 826.06 1146.68 0.95 884.81 1267.07 3.03 813.69 1165.55 0.91 882.05 1256.96 3.95 813.79 1175.11 0.91 877.74 1252.22 3.64 809.20 1187.23 0.97 874.42 1245.65 4.56 806.15 1195.55 0.89 870.39 1239.21 3.95 805.83 1208.97 0.86 859.29 1231.51 3.95 809.17 1220.15 0.88 851.44 1231.01 3.64 811.87 1225.72 0.90 844.86 1229.24 3.64 821.00 1235.87 0.91 836.59 1229.74 2.73 828.64 1239.69 0.99 829.23 1227.48 2.42 835.60 1236.12 1.13 824.28 1224.79 2.12 835.58 1236.46 0.52 820.61 1219.42 2.73 841.91 1235.28 0.89 817.35 1213.48 2.12 850.67 1238.91 0.86 815.16 1208.60 2.42 858.15 1238.37 0.88 814.60 1199.40 2.12 862.48 1241.07 0.85 817.78 1188.44 2.73 865.65 1246.02 0.88 819.69 1181.73 2.42 870.89 1251.15 0.88 821.81 1175.36 2.73 872.74 1254.81 0.92 826.33 1165.60 3.03 873.94 1260.28 0.84 827.47 1159.10 2.73 873.18 1266.90 0.91 828.60 1153.44 2.73 887.90 1270.95 1.14 832.84 1147.08 3.03 887.67 1271.15 0.28 837.72 1139.94 3.34 1088.52 1062.22 -0.20 841.47 1135.06 3.03 1090.70 1050.59 0.11 845.71 1128.55 3.03 1087.84 1048.40 0.46 852.07 1121.34 3.64 1090.95 1041.74 0.42 856.67 1112.92 3.34 1093.46 1044.26 0.07 860.63 1107.13 3.34 1092.79 1037.07 0.58 864.59 1103.45 3.34 1097.97 1035.61 0.80 870.67 1098.64 3.95 1099.08 1038.76 0.07 871.73 1095.88 3.34 1104.51 1027.78 0.02 873.92 1091.99 3.03 1103.54 1022.44 0.80 879.72 1086.48 3.34 1103.97 1015.02 0.33 884.03 1083.30 3.34 1102.30 1011.10 0.82 888.84 1079.90 3.34 1092.50 1011.08 0.78 896.97 1080.40 5.17

1081.42 1009.01 0.88 898.67 1077.43 4.86 1085.41 1005.15 0.70 901.08 1073.89 4.25 1090.73 1002.14 0.47 920.24 1056.99 3.95 1101.72 1003.04 0.65 923.56 1054.52 3.95 1107.21 1003.01 0.27 930.07 1048.72 3.34 1098.40 996.07 0.23 934.59 1045.18 3.03 1092.68 997.57 0.27 938.34 1042.71 3.34 1086.27 1002.20 0.36 945.98 1036.35 3.34 1081.42 1005.39 0.51 951.00 1033.16 3.34 1079.11 1007.31 0.67 958.70 1026.30 3.34 1077.00 1006.21 0.75 963.87 1019.87 2.73 1078.78 1002.67 0.35 969.03 1015.41 2.42 1082.51 999.56 0.18 972.78 1013.93 2.12 1085.75 996.66 0.25 979.85 1012.37 2.73 1089.63 991.85 0.21 985.79 1009.55 2.42 1092.91 988.95 0.16 991.94 1008.63 2.12 1095.34 986.88 0.16 996.68 1008.98 1.51 1098.10 984.85 0.06 1002.62 1007.57 2.12 1093.26 994.63 0.10 863.67 1228.11 5.78 1076.31 1003.35 0.93 864.73 1211.35 7.91 1080.75 998.71 1.08 892.66 1216.37 8.52 1087.34 991.99 1.10 841.61 1197.99 6.69 1091.02 987.96 1.09 836.09 1194.45 6.08 1092.62 986.60 1.07 961.32 1232.14 5.47 999.58 1004.16 0.97 956.09 1219.84 7.61 1048.04 984.86 1.00 935.44 1210.08 8.52 1067.35 999.45 0.95 923.07 1191.63 9.44 1072.99 993.36 0.99 903.41 1169.42 10.05 1080.11 987.51 0.93 887.85 1160.37 9.74 1084.10 984.48 0.32 875.55 1151.89 9.13 1089.21 979.36 0.32 866.07 1148.92 8.22 1091.39 976.16 -0.02 847.55 1136.75 6.69 1090.22 973.45 0.29 849.67 1141.00 5.47 1086.45 979.88 0.28 997.60 1185.54 5.78 1081.44 984.46 0.27 989.89 1175.72 7.61 1076.12 989.01 0.22 983.31 1162.63 8.83 1070.92 993.15 0.21 973.91 1150.54 9.74 1065.90 998.59 0.32 961.60 1130.60 9.74 1064.38 992.50 0.35 953.19 1120.63 10.05 1069.72 984.78 0.36 918.54 1092.07 9.44 1075.64 979.29 0.38 911.75 1086.83 8.22 1080.66 975.58 0.45 905.32 1080.26 7.30 1085.29 970.94 0.58 903.27 1075.94 6.08 1087.29 967.52 0.61 902.63 1073.19 5.17 1082.10 967.68 0.90 878.52 1236.74 6.08 1077.09 970.65 0.76 884.81 1230.87 7.30
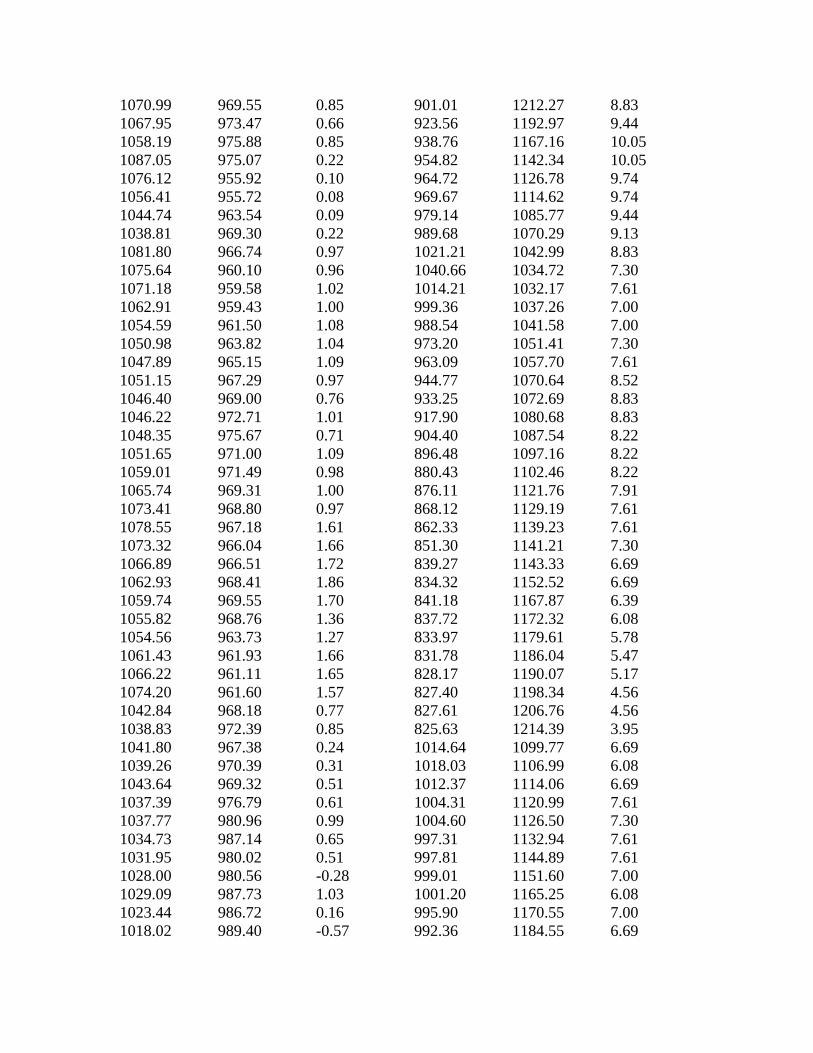
1070.99 969.55 0.85 901.01 1212.27 8.83 1067.95 973.47 0.66 923.56 1192.97 9.44 1058.19 975.88 0.85 938.76 1167.16 10.05 1087.05 975.07 0.22 954.82 1142.34 10.05 1076.12 955.92 0.10 964.72 1126.78 9.74 1056.41 955.72 0.08 969.67 1114.62 9.74 1044.74 963.54 0.09 979.14 1085.77 9.44 1038.81 969.30 0.22 989.68 1070.29 9.13 1081.80 966.74 0.97 1021.21 1042.99 8.83 1075.64 960.10 0.96 1040.66 1034.72 7.30 1071.18 959.58 1.02 1014.21 1032.17 7.61 1062.91 959.43 1.00 999.36 1037.26 7.00 1054.59 961.50 1.08 988.54 1041.58 7.00 1050.98 963.82 1.04 973.20 1051.41 7.30 1047.89 965.15 1.09 963.09 1057.70 7.61 1051.15 967.29 0.97 944.77 1070.64 8.52 1046.40 969.00 0.76 933.25 1072.69 8.83 1046.22 972.71 1.01 917.90 1080.68 8.83 1048.35 975.67 0.71 904.40 1087.54 8.22 1051.65 971.00 1.09 896.48 1097.16 8.22 1059.01 971.49 0.98 880.43 1102.46 8.22 1065.74 969.31 1.00 876.11 1121.76 7.91 1073.41 968.80 0.97 868.12 1129.19 7.61 1078.55 967.18 1.61 862.33 1139.23 7.61 1073.32 966.04 1.66 851.30 1141.21 7.30 1066.89 966.51 1.72 839.27 1143.33 6.69 1062.93 968.41 1.86 834.32 1152.52 6.69 1059.74 969.55 1.70 841.18 1167.87 6.39 1055.82 968.76 1.36 837.72 1172.32 6.08 1054.56 963.73 1.27 833.97 1179.61 5.78 1061.43 961.93 1.66 831.78 1186.04 5.47 1066.22 961.11 1.65 828.17 1190.07 5.17 1074.20 961.60 1.57 827.40 1198.34 4.56 1042.84 968.18 0.77 827.61 1206.76 4.56 1038.83 972.39 0.85 825.63 1214.39 3.95 1041.80 967.38 0.24 1014.64 1099.77 6.69 1039.26 970.39 0.31 1018.03 1106.99 6.08 1043.64 969.32 0.51 1012.37 1114.06 6.69 1037.39 976.79 0.61 1004.31 1120.99 7.61 1037.77 980.96 0.99 1004.60 1126.50 7.30 1034.73 987.14 0.65 997.31 1132.94 7.61 1031.95 980.02 0.51 997.81 1144.89 7.61 1028.00 980.56 -0.28 999.01 1151.60 7.00 1029.09 987.73 1.03 1001.20 1165.25 6.08 1023.44 986.72 0.16 995.90 1170.55 7.00 1018.02 989.40 -0.57 992.36 1184.55 6.69
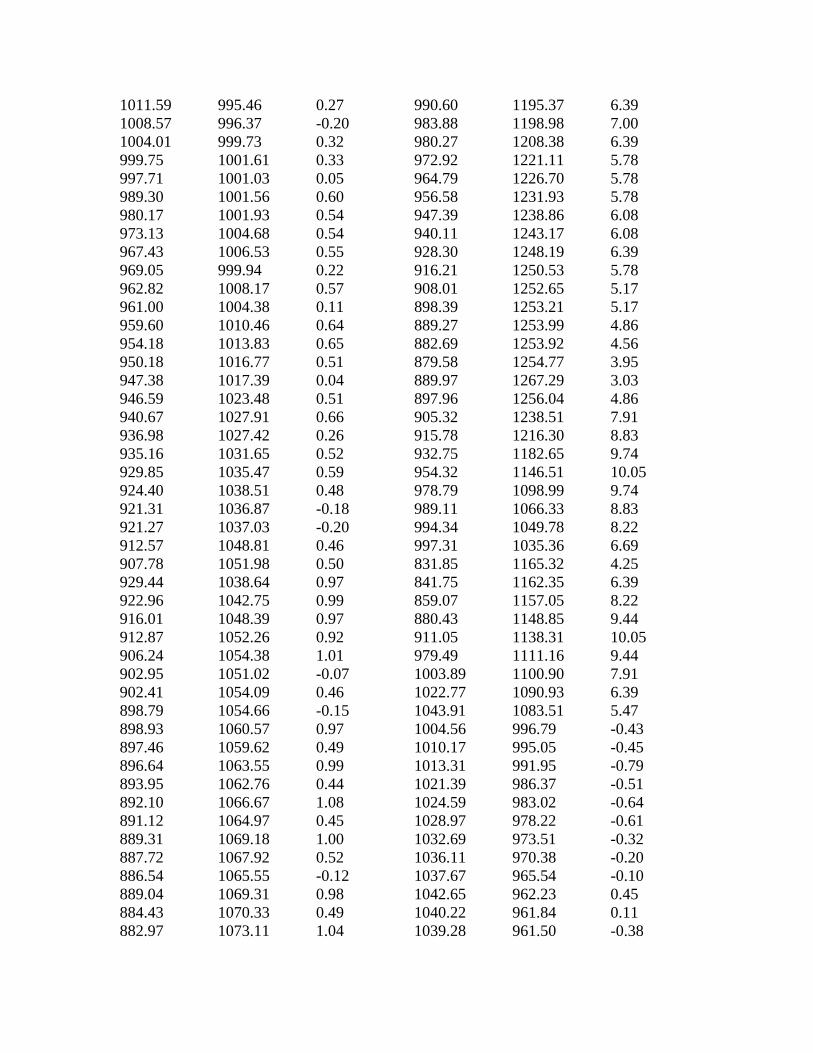
1011.59 995.46 0.27 990.60 1195.37 6.39 1008.57 996.37 -0.20 983.88 1198.98 7.00 1004.01 999.73 0.32 980.27 1208.38 6.39 999.75 1001.61 0.33 972.92 1221.11 5.78 997.71 1001.03 0.05 964.79 1226.70 5.78 989.30 1001.56 0.60 956.58 1231.93 5.78 980.17 1001.93 0.54 947.39 1238.86 6.08 973.13 1004.68 0.54 940.11 1243.17 6.08 967.43 1006.53 0.55 928.30 1248.19 6.39 969.05 999.94 0.22 916.21 1250.53 5.78 962.82 1008.17 0.57 908.01 1252.65 5.17 961.00 1004.38 0.11 898.39 1253.21 5.17 959.60 1010.46 0.64 889.27 1253.99 4.86 954.18 1013.83 0.65 882.69 1253.92 4.56 950.18 1016.77 0.51 879.58 1254.77 3.95 947.38 1017.39 0.04 889.97 1267.29 3.03 946.59 1023.48 0.51 897.96 1256.04 4.86 940.67 1027.91 0.66 905.32 1238.51 7.91 936.98 1027.42 0.26 915.78 1216.30 8.83 935.16 1031.65 0.52 932.75 1182.65 9.74 929.85 1035.47 0.59 954.32 1146.51 10.05 924.40 1038.51 0.48 978.79 1098.99 9.74 921.31 1036.87 -0.18 989.11 1066.33 8.83 921.27 1037.03 -0.20 994.34 1049.78 8.22 912.57 1048.81 0.46 997.31 1035.36 6.69 907.78 1051.98 0.50 831.85 1165.32 4.25 929.44 1038.64 0.97 841.75 1162.35 6.39 922.96 1042.75 0.99 859.07 1157.05 8.22 916.01 1048.39 0.97 880.43 1148.85 9.44 912.87 1052.26 0.92 911.05 1138.31 10.05 906.24 1054.38 1.01 979.49 1111.16 9.44 902.95 1051.02 -0.07 1003.89 1100.90 7.91 902.41 1054.09 0.46 1022.77 1090.93 6.39 898.79 1054.66 -0.15 1043.91 1083.51 5.47 898.93 1060.57 0.97 1004.56 996.79 -0.43 897.46 1059.62 0.49 1010.17 995.05 -0.45 896.64 1063.55 0.99 1013.31 991.95 -0.79 893.95 1062.76 0.44 1021.39 986.37 -0.51 892.10 1066.67 1.08 1024.59 983.02 -0.64 891.12 1064.97 0.45 1028.97 978.22 -0.61 889.31 1069.18 1.00 1032.69 973.51 -0.32 887.72 1067.92 0.52 1036.11 970.38 -0.20 886.54 1065.55 -0.12 1037.67 965.54 -0.10 889.04 1069.31 0.98 1042.65 962.23 0.45 884.43 1070.33 0.49 1040.22 961.84 0.11 882.97 1073.11 1.04 1039.28 961.50 -0.38
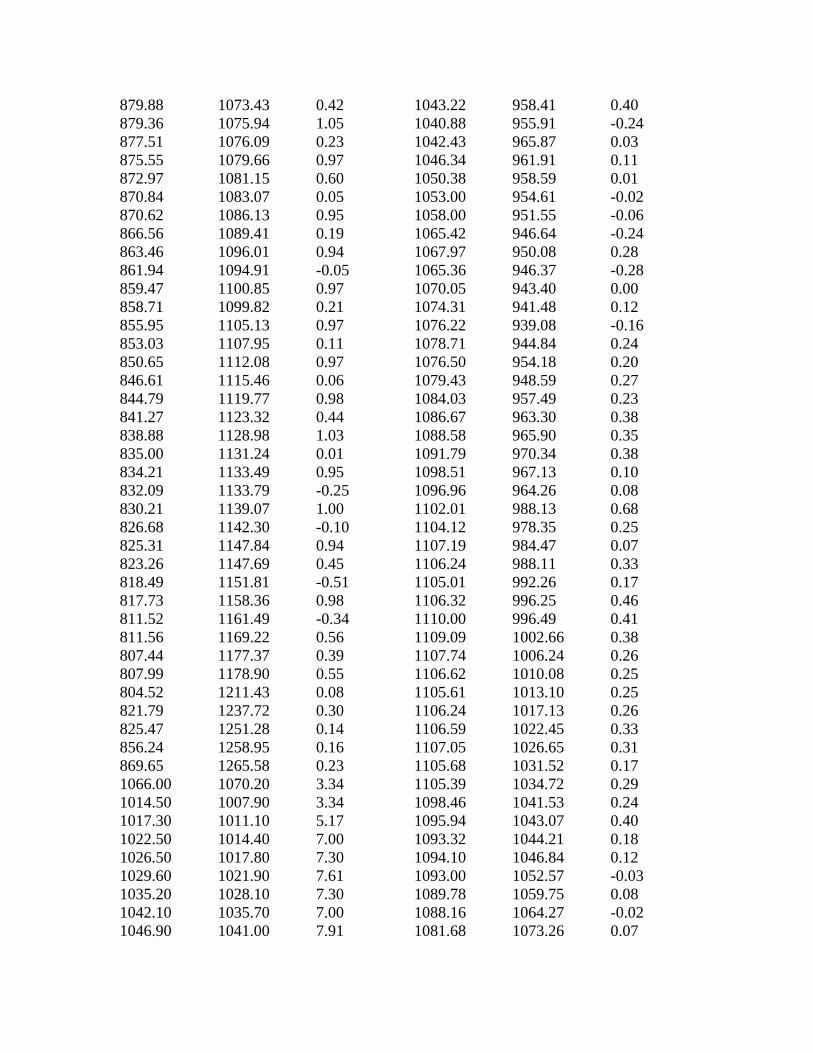
879.88 1073.43 0.42 1043.22 958.41 0.40 879.36 1075.94 1.05 1040.88 955.91 -0.24 877.51 1076.09 0.23 1042.43 965.87 0.03 875.55 1079.66 0.97 1046.34 961.91 0.11 872.97 1081.15 0.60 1050.38 958.59 0.01 870.84 1083.07 0.05 1053.00 954.61 -0.02 870.62 1086.13 0.95 1058.00 951.55 -0.06 866.56 1089.41 0.19 1065.42 946.64 -0.24 863.46 1096.01 0.94 1067.97 950.08 0.28 861.94 1094.91 -0.05 1065.36 946.37 -0.28 859.47 1100.85 0.97 1070.05 943.40 0.00 858.71 1099.82 0.21 1074.31 941.48 0.12 855.95 1105.13 0.97 1076.22 939.08 -0.16 853.03 1107.95 0.11 1078.71 944.84 0.24 850.65 1112.08 0.97 1076.50 954.18 0.20 846.61 1115.46 0.06 1079.43 948.59 0.27 844.79 1119.77 0.98 1084.03 957.49 0.23 841.27 1123.32 0.44 1086.67 963.30 0.38 838.88 1128.98 1.03 1088.58 965.90 0.35 835.00 1131.24 0.01 1091.79 970.34 0.38 834.21 1133.49 0.95 1098.51 967.13 0.10 832.09 1133.79 -0.25 1096.96 964.26 0.08 830.21 1139.07 1.00 1102.01 988.13 0.68 826.68 1142.30 -0.10 1104.12 978.35 0.25 825.31 1147.84 0.94 1107.19 984.47 0.07 823.26 1147.69 0.45 1106.24 988.11 0.33 818.49 1151.81 -0.51 1105.01 992.26 0.17 817.73 1158.36 0.98 1106.32 996.25 0.46 811.52 1161.49 -0.34 1110.00 996.49 0.41 811.56 1169.22 0.56 1109.09 1002.66 0.38 807.44 1177.37 0.39 1107.74 1006.24 0.26 807.99 1178.90 0.55 1106.62 1010.08 0.25 804.52 1211.43 0.08 1105.61 1013.10 0.25 821.79 1237.72 0.30 1106.24 1017.13 0.26 825.47 1251.28 0.14 1106.59 1022.45 0.33 856.24 1258.95 0.16 1107.05 1026.65 0.31 869.65 1265.58 0.23 1105.68 1031.52 0.17 1066.00 1070.20 3.34 1105.39 1034.72 0.29 1014.50 1007.90 3.34 1098.46 1041.53 0.24 1017.30 1011.10 5.17 1095.94 1043.07 0.40 1022.50 1014.40 7.00 1093.32 1044.21 0.18 1026.50 1017.80 7.30 1094.10 1046.84 0.12 1029.60 1021.90 7.61 1093.00 1052.57 -0.03 1035.20 1028.10 7.30 1089.78 1059.75 0.08 1042.10 1035.70 7.00 1088.16 1064.27 -0.02 1046.90 1041.00 7.91 1081.68 1073.26 0.07

1053.60 1049.50 7.91 1075.26 1080.14 0.24 1060.20 1057.40 7.00 1072.97 1081.85 0.08 1063.20 1060.70 5.78 807.44 1174.13 -0.22 1065.50 1063.30 4.25 806.45 1179.84 -0.15 1068.40 1068.80 3.03 802.12 1187.80 -0.01 1029.00 1000.90 3.34 798.94 1200.73 -0.21 1033.30 1004.20 5.17 798.64 1213.06 -0.17 1038.30 1007.80 5.78 799.48 1222.77 -0.08 1043.90 1013.00 5.78 808.60 1233.40 -0.15 1049.20 1018.60 4.56 815.40 1239.03 -0.13 1054.40 1023.70 5.17 822.58 1244.73 0.04 1058.80 1028.40 6.08 831.26 1245.16 0.18 1060.80 1031.00 6.69 846.52 1243.28 0.27 1063.80 1034.50 6.69 856.68 1246.72 0.21 1066.80 1038.50 6.69 864.21 1253.91 0.19 1069.30 1042.10 6.08 870.21 1261.57 0.35 1071.50 1045.80 5.47 871.30 1267.92 0.13 1073.20 1049.90 4.86 876.53 1274.21 0.16 1074.70 1054.00 4.25 877.58 1271.18 0.16 1076.20 1057.20 3.34 884.49 1276.11 0.07 1077.00 1060.40 2.73 885.76 1280.23 0.01 1033.50 996.80 2.12 891.17 1281.10 -0.16 1034.40 995.50 2.73 896.17 1283.95 0.11 1036.70 999.60 4.25 901.52 1285.45 -0.06 1039.90 1002.70 5.17 907.89 1286.76 0.15 1043.00 1006.70 5.47 919.70 1281.79 -0.08 1046.50 1010.40 5.17 924.92 1278.49 0.09 1050.90 1015.00 3.95 930.01 1281.72 -0.04 1053.20 1018.00 3.64 934.68 1276.87 -0.05 1056.00 1020.90 4.25 943.14 1271.14 -0.11 1059.10 1027.00 6.08 953.40 1262.79 -0.04 1062.10 1029.90 6.39 960.98 1258.31 -0.10 1064.70 1033.00 6.39 968.88 1253.41 -0.25 1067.70 1037.00 6.39 974.10 1250.97 0.17 1071.60 1041.60 5.78 978.29 1248.20 0.16 1074.40 1045.30 4.86 983.32 1239.93 0.01 1076.80 1047.70 3.95 988.54 1237.26 -0.19 1078.30 1049.60 3.64 994.56 1235.32 0.09 1044.00 990.60 2.12 999.37 1229.95 0.15 1046.20 991.80 2.73 1005.47 1223.37 -0.07 1048.10 995.30 3.03 1007.18 1215.17 -0.06 1051.20 998.50 3.03 1011.33 1209.92 -0.19 1054.70 1003.80 2.73 1017.88 1203.72 0.01 1057.50 1007.40 2.42 1018.75 1204.51 -0.15 1062.20 1017.10 2.73 1023.64 1202.65 -0.07 1065.30 1020.20 4.56 1027.71 1202.22 -0.12
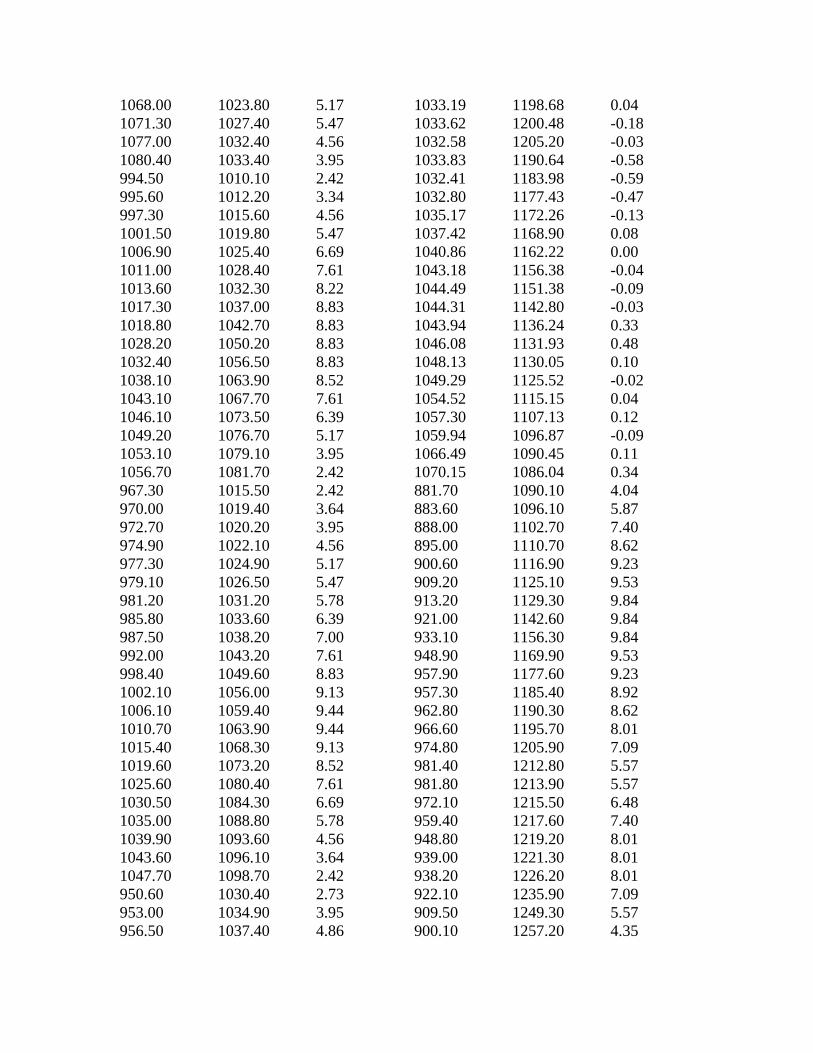
1068.00 1023.80 5.17 1033.19 1198.68 0.04 1071.30 1027.40 5.47 1033.62 1200.48 -0.18 1077.00 1032.40 4.56 1032.58 1205.20 -0.03 1080.40 1033.40 3.95 1033.83 1190.64 -0.58 994.50 1010.10 2.42 1032.41 1183.98 -0.59 995.60 1012.20 3.34 1032.80 1177.43 -0.47 997.30 1015.60 4.56 1035.17 1172.26 -0.13 1001.50 1019.80 5.47 1037.42 1168.90 0.08 1006.90 1025.40 6.69 1040.86 1162.22 0.00 1011.00 1028.40 7.61 1043.18 1156.38 -0.04 1013.60 1032.30 8.22 1044.49 1151.38 -0.09 1017.30 1037.00 8.83 1044.31 1142.80 -0.03 1018.80 1042.70 8.83 1043.94 1136.24 0.33 1028.20 1050.20 8.83 1046.08 1131.93 0.48 1032.40 1056.50 8.83 1048.13 1130.05 0.10 1038.10 1063.90 8.52 1049.29 1125.52 -0.02 1043.10 1067.70 7.61 1054.52 1115.15 0.04 1046.10 1073.50 6.39 1057.30 1107.13 0.12 1049.20 1076.70 5.17 1059.94 1096.87 -0.09 1053.10 1079.10 3.95 1066.49 1090.45 0.11 1056.70 1081.70 2.42 1070.15 1086.04 0.34 967.30 1015.50 2.42 881.70 1090.10 4.04 970.00 1019.40 3.64 883.60 1096.10 5.87 972.70 1020.20 3.95 888.00 1102.70 7.40 974.90 1022.10 4.56 895.00 1110.70 8.62 977.30 1024.90 5.17 900.60 1116.90 9.23 979.10 1026.50 5.47 909.20 1125.10 9.53 981.20 1031.20 5.78 913.20 1129.30 9.84 985.80 1033.60 6.39 921.00 1142.60 9.84 987.50 1038.20 7.00 933.10 1156.30 9.84 992.00 1043.20 7.61 948.90 1169.90 9.53 998.40 1049.60 8.83 957.90 1177.60 9.23 1002.10 1056.00 9.13 957.30 1185.40 8.92 1006.10 1059.40 9.44 962.80 1190.30 8.62 1010.70 1063.90 9.44 966.60 1195.70 8.01 1015.40 1068.30 9.13 974.80 1205.90 7.09 1019.60 1073.20 8.52 981.40 1212.80 5.57 1025.60 1080.40 7.61 981.80 1213.90 5.57 1030.50 1084.30 6.69 972.10 1215.50 6.48 1035.00 1088.80 5.78 959.40 1217.60 7.40 1039.90 1093.60 4.56 948.80 1219.20 8.01 1043.60 1096.10 3.64 939.00 1221.30 8.01 1047.70 1098.70 2.42 938.20 1226.20 8.01 950.60 1030.40 2.73 922.10 1235.90 7.09 953.00 1034.90 3.95 909.50 1249.30 5.57 956.50 1037.40 4.86 900.10 1257.20 4.35
959.40 1040.50 5.78 893.80 1261.50 3.74 963.60 1046.20 6.69 902.20 1124.10 9.23 967.50 1049.50 7.30 895.40 1136.10 9.53 976.40 1057.90 8.22 887.70 1146.70 9.23 983.50 1065.40 8.83 880.60 1157.30 9.23 988.70 1072.80 9.13 876.90 1166.10 8.92 993.30 1077.50 9.44 870.50 1177.20 8.62 999.80 1082.30 9.44 864.30 1188.30 8.31 1003.90 1089.40 8.52 856.20 1199.40 7.70 1008.60 1092.90 7.61 849.80 1207.40 6.79 1015.00 1102.40 6.39 846.90 1215.90 5.87 1019.60 1107.30 5.78 846.00 1221.20 4.96 1024.50 1111.80 4.56 847.70 1142.80 4.96 1028.70 1114.50 3.95 831.20 1151.70 5.26 1033.90 1117.60 2.73 846.20 1155.40 5.57 933.80 1047.10 3.95 844.50 1159.40 5.87 938.90 1052.90 6.08 850.20 1165.90 7.40 943.60 1059.40 7.61 858.40 1175.70 8.31 949.00 1065.70 8.22 871.30 1190.40 8.62 954.30 1070.30 8.83 881.10 1200.50 8.62 959.20 1076.80 8.83 896.30 1214.40 8.31 968.00 1082.50 9.44 904.90 1225.00 8.62 977.10 1089.20 9.74 911.10 1235.50 7.70 988.30 1099.70 9.44 916.30 1245.00 6.48 994.50 1105.90 8.52 920.90 1254.20 4.96 1011.20 1112.50 7.91 1043.00 969.29 0.45 1006.50 1116.50 7.00 1047.41 965.06 0.41 1012.50 1123.10 6.08 1053.45 961.36 0.49 1017.00 1126.40 4.56 1061.53 960.08 0.72 1021.50 1129.90 3.34 1068.59 961.19 0.77 1023.60 1131.80 2.73 1076.04 961.31 0.93 916.00 1060.40 4.56 1082.77 968.43 0.94 916.50 1062.40 5.47 1088.42 970.97 0.82 919.70 1066.00 7.00 1087.31 974.89 0.49 922.50 1069.30 8.22 1081.76 980.31 0.46 926.40 1073.40 8.83 1074.32 984.99 0.41 933.90 1080.50 9.13 1069.36 989.87 0.37 939.70 1086.00 9.44 1072.65 990.79 0.34 945.80 1088.30 9.74 1078.68 1008.78 0.61 952.40 1096.30 9.74 1084.62 1005.95 0.56 959.80 1102.20 9.74 1092.35 1003.13 0.53 967.10 1109.50 10.05 1098.90 1000.98 0.48 976.50 1119.70 9.44 1103.68 1000.27 0.57 984.30 1123.40 9.13 1106.10 1006.39 0.72 991.80 1127.90 8.83 1102.20 1018.15 0.78 999.90 1135.30 7.61 1106.70 979.66 0.25

1001.60 1142.50 7.30 1109.87 977.95 0.00 1003.70 1147.80 6.69 1106.83 986.21 0.01 1007.40 1150.80 5.78 1108.14 988.84 0.14 810.50 1198.00 1.51 1112.49 991.45 -0.19 822.70 1186.50 3.34 1111.17 993.58 -0.37 828.40 1174.60 3.95 1108.02 998.45 -0.02 836.80 1165.10 5.17 1111.19 1002.39 0.26 839.30 1147.90 5.17 1115.38 1008.46 -0.08 845.90 1141.90 4.56 1117.58 973.33 -0.65 853.40 1132.30 4.86 1100.20 968.02 -0.08 860.50 1121.10 4.86 1101.36 964.43 -0.07 863.80 1113.20 4.86 1090.09 961.00 0.14 869.60 1106.30 4.56 1083.18 962.30 0.19 875.30 1093.50 5.17 1059.93 953.36 -0.03 878.90 1090.10 4.25 1063.64 950.96 -0.06 883.70 1084.60 4.25 1067.01 949.32 -0.07 890.80 1081.20 5.17 861.24 1082.04 -0.87 900.30 1078.40 5.47 1072.37 1087.29 -0.37 904.30 1069.40 5.17 1063.35 1011.07 1.14 911.60 1061.50 5.78 1068.81 1006.06 1.21 923.60 1055.30 5.47 1074.56 1000.98 1.16 930.30 1054.80 5.78 1079.21 996.37 1.16 939.20 1054.40 5.78 1084.51 992.36 1.23 945.50 1048.30 5.78 1089.09 989.16 1.26 1093.18 985.62 1.16 1097.09 982.20 1.28 1099.69 978.14 1.24 1100.36 980.51 1.37