Changes in Markers of Salivary Immunity, Stress, and ...
81
University of Connecticut OpenCommons@UConn Doctoral Dissertations University of Connecticut Graduate School 6-21-2013 Changes in Markers of Salivary Immunity, Stress, and Muscle Damage Following an Ironman Triathlon and During Recovery Julianne K . DeMartini [email protected] Follow this and additional works at: hps://opencommons.uconn.edu/dissertations Recommended Citation DeMartini, Julianne K., "Changes in Markers of Salivary Immunity, Stress, and Muscle Damage Following an Ironman Triathlon and During Recovery" (2013). Doctoral Dissertations. 162. hps://opencommons.uconn.edu/dissertations/162
Transcript of Changes in Markers of Salivary Immunity, Stress, and ...

University of ConnecticutOpenCommons@UConn
Doctoral Dissertations University of Connecticut Graduate School
6-21-2013
Changes in Markers of Salivary Immunity, Stress,and Muscle Damage Following an IronmanTriathlon and During RecoveryJulianne K. [email protected]
Follow this and additional works at: https://opencommons.uconn.edu/dissertations
Recommended CitationDeMartini, Julianne K., "Changes in Markers of Salivary Immunity, Stress, and Muscle Damage Following an Ironman Triathlon andDuring Recovery" (2013). Doctoral Dissertations. 162.https://opencommons.uconn.edu/dissertations/162

i
Changes in Markers of Salivary Immunity, Stress, and Muscle Damage Following an Ironman Triathlon
and During Recovery
Julianne K. DeMartini, PhD
University of Connecticut, 2013
Purpose: Examine physiological and immune responses in triathletes during a competitive race and
determine if cold water immersion (CWI) will attenuate these responses. Methods: 39 triathletes
(age:44±11yrs; height:174±7cm; body mass:68.6±8.3kg; %body fat:10.7±4.2%) competing in the 2012
Ironman World Championships volunteered. Measurements of body mass (%BML), urine specific gravity
(USG), salivary immunoglobulin A (SIgA), salivary cortisol (Scort), and salivary α-amylase (Sαam) were
taken at baseline (BASE), prior to the race (PRE), following the race (POST), and one and two days after
the race (+1 DAY and +2 DAY, respectively). Measurements of blood cortisol (CORT), creatine kinase
(CK), and myoglobin (MYO) were taken at BASE, POST, +1 DAY, and, +2 DAY. Subjects were
randomly assigned into a cooling group ((COOL) 12-minutes CWI following the race) or a control group
((CONT) 12-minutes of passive sitting following the race). Measurements of gastrointestinal temperature
(∆Tgi) and heart rate (HR) were taken at 0-minutes (0MIN), 6-minutes (6MIN), and 12-minutes (12MIN)
during the intervention. Results: USG was greater POST (p<0.001) and remained elevated +1 DAY
(p<0.001) compared to PRE. %BML POST was significant compared to PRE body mass (p<0.001). ∆Tgi
was greater in COOL vs. CONT (p=0.021) at 12MIN. HR was lower in COOL vs. CONT at 6MIN
(p<0.001) and 12MIN (p=0.001). No interaction occurred for any blood or saliva variable. CORT was
elevated POST from BASE (p<0.001) and returned to BASE by +1 DAY. CK peaked +1 DAY and was
greater than BASE at all time points (p<0.001). MYO peaked POST and remained elevated +1 DAY
(p<0.001). Scort was greater PRE compared to BASE (p=0.001), and greater POST compared to all other
time points (p<0.001). SIgA was lower POST compared to PRE (p=0.015), but not different than BASE.
SIgA returned to PRE values by +1 DAY. No differences were observed at any time point for Sαam.
Conclusion: Despite resulting in lower Tgi and HR, 12-minutes of CWI did not attenuate the heightened

ii
Julianne K. DeMartini-University of Connecticut, 2013
immune, stress, and muscle damage responses, as measured in blood and saliva, following an Ironman
Triathlon. Word Count: 332

iii
Changes in Markers of Salivary Immunity, Stress, and Muscle Damage Following an Ironman Triathlon
and During Recovery
Julianne K. DeMartini
B.S., Duquesne University, 2006
M.A., University of Connecticut, 2009
A Dissertation
Submitted in Partial Fulfillment of the
Requirement for the Degree of
Doctor of Philosophy
at the
University of Connecticut
2013

iv
APPROVAL PAGE
Doctor of Philosophy Dissertation
Changes in Markers of Salivary Immunity, Stress, and Muscle Damage Following an Ironman
Triathlon and During Recovery
Presented by
Julianne K. DeMartini, MA, ATC
Major Advisor__________________________________________________________________
Douglas Casa
Associate Advisor_______________________________________________________________
Carl Maresh
Associate Advisor_______________________________________________________________
Lawrence Armstrong
University of Connecticut
2013

v
Acknowledgements
Dr. Anderson-Thank you for your support over the last 6 years especially the last year through
comps and dissertation. Despite your crazy schedule you always have a smile on your face and a
positive attitude.
Dr. Armstrong-During my time at UConn I have never enjoyed classes as much as yours. Your
passion for teaching and exercise science in general is admirable and thank you not only for your
classroom instruction but your guidance in the lab as well. I am thankful that I have been able to
work with you over the past 6 years
Dr. Maresh-I cannot even begin to thank you for help with this project. From day 1 you
immersed yourself in this study and strived to make it the best it possibly could be. I cannot
begin to thank you for your support, dedication, and sacrifice to this project. You are one of the
greatest leaders I have ever met, and clearly value the importance of the working relationships
with the faculty and students.
Dr. Casa- When I came to UConn for my Master’s 6 years ago I never would have imagined
staying for my PhD. But from the minute I got here, your passion and love for athletic training
and research rubbed off on me and I instantly fell in love with the program. Over the course of
the next 4 years you have provided me with enough knowledge and mentorship to last a lifetime,
and I can never repay you for the lessons you have taught me. From working medical tents of
major races, to speaking engagements at conferences, to KSI, I am beyond grateful for the
opportunities you have provided, and can only hope to continue to share them with you in the
future.

vi
Family-Thank you for your understanding and unconditional support and encouragement not
only during my time at UCONN but in everything I do and everything I have always done.

vii
Table of Contents
CHAPTER 1. REVIEW OF THE LITERATURE
A. Immunology…………………………………………………………………………...1
B. Exercise Physiology………………………………………………………………….18
C. Cold Water Immersion……………………………………………………………….31
CHAPTER 2. METHODOLOGY
A. Participants………………………………………………………………………….36
B. Design Overview…………………………………………………………………….37
C. Testing Protocol……………………………………………………………………...37
D. Biochemical Analyses and Instrumentation………………………………………….41
E. Statistical Analysis…………………………………………………………………...43
CHAPTER 3. RESULTS
A. Hydration……………………………………………………………………………43
B. Physiology…………………………………………………………………………...44
C. Saliva Variables...……………………………………………………………………46
D. Blood Variables……………………………………………………………………...51
CHAPTER 4. DISCUSSION
A. Purpose and overview of results……………………………………………………..54
B. Hydration and thermoregulation……………………………………………………..55
C. Salivary immunity……………………………………………………………………57
D. Stress and muscle damage…………………………………………………………...60
E. Cold water immersion………………………………………………………………..63
F. Conclusions…………………………………………………………………………..64
CHAPTER 6. REFERENCES…………………………………………………………………...65

1
REVIEW OF THE LITERATURE
Immunology
Role of Immunoglobulins
Immunoglobulins are proteins that are part of the immune system and found throughout the
body. Specific to saliva, these immunoglobulins primarily include immunoglobulin A (SIgA),
immunoglobulin M (SIgM), and immunoglobulin G (SIgG) and are one of the many components
of “whole saliva”. Of these, SIgA is the most abundant and is considered to be the main immune
mechanism in the oral cavity. More specifically, SIgA is the main protective mechanism against
upper respiratory tract infections (URTI) which are a common occurrence in both the general
population and the athletic population. This is important because URTI’s can impede activities
of daily living as well as athletic performance. The degree of these effects is largely related to
the type of exercise being done, specifically the duration and intensity. Additionally, factors
such as fitness level, total volume of training, and overtraining syndrome can influence this
response as well. Therefore, many researchers have sought to study the relationship between
SIgA concentration and the occurrence of URTI’s in the athletic population1-6
. Regardless of the
specific cause, results of these studies have found that there is a greater incidence of URTI in
individuals with lower SIgA concentrations and/or low saliva flow rate. The specific etiology of
lower SIgA concentrations and/or saliva flow rate can vary, and the regulation and control of this
response can be quite complex, as seen in Figure 1 below7:

2
Figure 1: Factors affecting Salivary IgA
Most of the protein components of saliva, including immunoglobulins, are actively secreted
by salivary glands. These glands include the parotid glands, the submandibular glands, and the
sublingual glands. Specifically, SIgA is produced by plasma cells within these glands which
distinguish them from other protein components of the saliva. The receptor for SIgA is found
within the cell membrane and is known as poly-immunoglobulin receptor (pIgR)7,8
. Before SIgA
can be secreted, it has to go through a two-step process beginning with the binding of SIgA to
the pIgR so it can form the IgA-pIgR complex. Once this complex is formed, it can then be
translocated to the surface of the secretory cells in the salivary glands. Second, cleavage of the
complex must occur which results in the secretion of SIgA. Once secreted, SIgA can then carry
out its anti-viral functions. However, several factors are capable of altering the normal secretion
of SIgA as well as the flow rate of the saliva itself. For example, acute stress such as a bout of
exercise or hypohydration, or chronic stress such as overtraining syndrome can affect the
secretion of SIgA thereby affecting the salivary immune protection against URTI’s (see Figure 2
below)7:

3
Figure 2: The effect of acute stress on Salivary IgA
SIgA as a protective mechanism against URTI
SIgA can provide anti-viral defense via three different functions. First, it can prevent the
pathogen from adhering and penetrating the mucosal cells; second, it can neutralize viruses
within the cells and therefore prevent viral replication; and third, it can transport the virus outside
the cell via transcytosis where it can then be neutralized7. The intracellular virus-neutralizing
activity is unique to SIgA with respect to the other immunoglobulins8.
The regulation of synthesis and secretion of SIgA is largely under neuroendocrine control
via the autonomic nervous system (ANS). Secretion of SIgA and the secretion rate involve both
parasympathetic and sympathetic stimulation. Under resting conditions, parasympathetic nerves
are responsible for salivary fluid secretion (via acetylcholine) and sympathetic nerves are
responsible for protein secretion (via norepinephrine)7. These responses are summarized in
Figure 3 below (rat model)7:

4
Figure 3: Effect of nervous system stimulus on the secretion of saliva
Generally speaking, both SIgA secretion by the plasma cells and the availability of the
pIgR for translocation are the rate-determining steps in the secretion of IgA, and therefore the
potential for URTI defense8. However, many factors can affect these two processes and therefore
the change in SIgA concentration can be quite complex. One way in which SIgA concentration
can increase is through any increase in autonomic nerve-mediated reflex stimuli. These reflex
stimuli can include anxiety, chewing, taste, and the site of food10
. The effect of chewing was
nicely shown by Proctor et al.9 in which subjects were found to have an increase in the
transcytosis of SIgA and increases in the secretion of SIgA into the saliva when samples were
taken after chewing compared to resting conditions. Additionally, sympathetic stimulation such
as stress and moderate exercise can also cause an increase in salivary flow rate. While less
frequently studied as stress and exercise, hydration status, dietary intake, and the environment
have also been considered to affect both the concentration and secretion rate of SIgA.
Variables altering secretion/flow rate (non-exercise variables)
Several potential mechanisms by which acute and chronic exercise affects immunity
have been proposed, and can be seen in Figure 4 below7:

5
Figure 4: Effects of acute and chronic exercise on salivary immunity
While the etiology of each factor is quite different, all affect the concentration of SIgA by
altering the activation of the SAM/HPA axis. In other words, any factor that is deemed as a stress
to the body has the potential to result in altered salivary immune function. More specifically,
these factors often include exercise, hydration status, nutritional intake, supplements, and
environmental conditions.
General Stress Response: Changes in SIgA can be influenced by the release of
catecholamines from the adrenal medulla as well as the release of cortisol from the adrenal
cortex. More specifically, epinephrine has been shown to increase the transport of SIgA into
saliva through an increase in the mobilization of the pIgR receptor7. Therefore, it is clear that an
activation of the “fight or flight” stress response and the associated stimulation of the SAM axis
and HPA axis can have a profound effect. Li and Gleeson proposed that there may be a
threshold of sympathetic nervous system activity in which saliva flow rate will be affected11
.
Similarly, with respect to the individual stress responses that are activated via “fight or flight”,

6
Bishop10
and Allgrove12
both agree that the SAM axis is more important than the HPA axis,
indicating that the effects of epinephrine and norepinephrine are greater than the effects of
cortisol.
Hydration Status: Dehydration has preliminarily been shown to be a major contributor to
observed responses of SIgA. The two most common populations in which this is seen are in
exercising athletes and the elderly. For example, Walsh et al.13
suggested that dehydration may
be more responsible for the reduction in saliva flow rate than neuroendocrine regulation
following prolonged strenuous exercise. In this study, reductions in SIgA were only observed
when subjects were dehydrated beyond 2% body mass loss, as seen in Figure 5 and 6 below13
:
(saliva flow rate, osmolality, and total protein concentration during progressive acute
dehydration (dark squares) and with sufficient fluids to offset fluid losses (open squares)).

7
Figure 5: The effects of plasma epi and norepi concentration during progressive acute
dehydration (dark square) and with sufficient fluids to offset fluid losses (open squares)

8
Figure 6: Effect of body mass loss on plasma catecholamines
In a follow up study, Oliver and Walsh et al. observed the effect of a 48 hour fluid
restriction protocol on the effect of SIgA secretion rate14
. This study showed that 48 hours of
fluid restriction caused a decrease in SIgA concentration. As a result, it was suggested that the
decrease in SIgA observed during the fluid restriction was secondary to the associated increase in
plasma osmolality14
. These results are summarized in Figure 7 below:

9
Figure 7: (effects of 48h fluid restriction (upside down triangle), energy restriction
(triangle), fluid and energy restriction (diamond) compared with control (square)).
Recently, the effect of exercise-induced dehydration and subsequent overnight fluid
restriction on salivary immunity was observed15
. In this study subjects exercised in the heat,
either with fluids or without fluids to promote a body mass loss of 1%, 2%, and 3% with
subsequent overnight fluid restriction. Measures of hydration and salivary immunity were

10
recorded and it was found that dehydration decreased saliva flow rate, but only at 3% BML15
(Figure 8):
Figure 8: progressive exercise heat induced dehydration with subsequent overnight fluid
restriction (dark circles) and rehydration to offset overnight fluid loss (open circles).
Additionally, SIgA concentration was increased with no effect on SIgA secretion rate.
However, dehydration did not affect alpha amylase concentration, but did decrease the secretion
rate of alpha amylase at 3% BML. Collectively, these results can be seen in the figures below15
:

11
Figure 9: Effect of body mass loss on saliva protein content

12
Figure 10: Effect of body mass loss on protein secretion rate
These results mirrored that of the previously described study13
in that dehydration likely
is a major contributor to changes in saliva flow rate and subsequent concentrations of salivary
proteins, however only when levels of dehydration become moderate (2-3% BML).
Environmental Factors: It has been suggested that due to the close relationship between
sympathetic activation and exercise-associated changes in SIgA that any additional stimulation
of these pathways via exercise in adverse environments would have an additive effect10
.
However, it is difficult to determine the true effects of the environment in these studies as the
confounding variable of the exercise bout itself plays a major role. For example, Walsh et al.16

13
observed a lower SIgA concentration following 2 hours of cycling at a moderate intensity in
-6°C conditions compared to 19°C conditions. However, this effect was actually related to a
higher flow rate of saliva because there was no effect of the cold on SIgA secretion rate16
.
The effect of exercise on secretion/flow rate
When examining the effects of exercise on salivary immunity, other markers such as
alpha-amylase and cortisol are often expressed in addition to SIgA. These two markers both are
indicative of the stress response induced by exercise, with alpha amylase representing the effect
of the SAM axis and cortisol representing the effect of the HPA axis. More specifically, alpha
amylase is considered to reflect changes in plasma norepinephrine (therefore is highly dependent
on exercise intensity) and cortisol has been suggested to play an important role in inhibiting
SIgA production8. The effects of exercise on these variables are extremely variable in the
literature mainly due to differences in the exercise protocol used. As previously discussed, Li and
Gleeson proposed that there may be a threshold of sympathetic nervous system activity in which
saliva flow rate will be affected11
. Based on this proposal, Kimura et al. suggested that there may
be a second threshold of sympathetic stimulation, above which the pIgR complex becomes
down-regulated17
. While this is highly speculative, it certainly provides a logical explanation for
why there is so much variation in the literature pertaining to the effects of SIgA on exercise
protocols of varying duration and intensity. Additionally, this suggestion was shown to explain
the results found in a study by Allgrove in which short duration high intensity exercise increased
the secretion of SIgA but long duration exercise resulted in a decrease in SIgA (Figure 11)12
:

14
Figure 11: Effect of exercise on salivary IgA and secretion rate
Exercise Intensity: As mentioned, the effects of an acute bout of exercise are extremely
variable. It is generally well accepted that moderate physical activity (via the enhanced
sympathetic stimulus) enhances SIgA output therefore benefiting the mucosal immune defenses.
However, any deviation from “moderate physical activity” can result in negative immune effects.
When only considering an acute bout of exercise (irrespective of training status and other
potential confounding variables), exhaustive exercise (high intensity) has been shown to increase
the secretion rate of SIgA12,18
. Blannin et al.18
was the first to examine this relationship and
found that SIgA secretion rate, as well as SIgA concentration, increased during exercise to
exhaustion. However, these changes in SIgA were accompanied by a decrease in saliva rate
which could explain the increase in the total concentration of SIgA. On the other hand, when
Allgrove observed the influence of exercise intensity on salivary immunity, it was found that

15
while SIgA secretion rate increased, there was no change in saliva flow rate and the increase in
SIgA concentration post-exercise was independent of exercise intensity (Figure 12)12
:
Figure 12: Effect of exercise intensity on salivary IgA concentration and secretion rate
It is important to note that there were increases in salivary osmolality in all trials, in which it
would be assumed that saliva flow rate would decrease throughout exercise. However, it was
reported that dehydration was minimal (< 0.5% BML at all time points) which likely explains the

16
unchanged flow rate and supports the conclusions that results were due to exercise intensity with
no confounding influence from hydration status. While dehydration level was not reported in the
Blannin study18
this could explain the inconsistent findings with SIgA concentration and saliva
flow rate.
As previously mentioned, Allgrove12
associated these finding with changes in
sympathetic activity (SAM axis) instead of changes in cortisol (HPA axis). Unfortunately, these
are the only two published studies that successfully controlled for exercise intensity. Since both
protocols involved exercise to exhaustion, the exercise duration was relatively short. Therefore,
it seems as though the general conclusion that intense exercise has a whole will result in an
increase in SIgA cannot be made, but rather only those that involve a limited increased activation
of the sympathetic nervous system. When intense exercise is sustained for too long, eventually
there will be a dramatic increase in the cortisol response as well as other stress markers such s
inflammatory and muscle damage markers. When these variables are chronically elevated, there
will be a resulting suppression of the immune system.
Exercise Duration: While a single bout of high intensity exercise will generally increase
salivary immunity via increases in SIgA, an acute bout of long duration exercise will decrease
SIgA. This was consistently shown in several studies involving endurance or ultra-endurance
events2,3,4,19
. All of these studies showed a decrease in SIgA secretion rate following the exercise
bout. Furthermore, Pacque19
found that this value further decreased 2 hours after an 82km
mountain run. Additionally, Peters4 and Nieman
2 showed the inter-relationship between SIgA
with those of other immune markers and inflammatory cytokines. These results were not
surprising when assuming the associated prolonged elevation of cortisol resulting from the ultra-
endurance exercise. So, while cortisol does not seem to play a major role in the regulation of

SIgA secretion in response to acute exercise, it likely plays a crucial role in long duration
endurance exercise mostly due to the
exercise.
Chronic Exercise: Decreased secretion of SIgA can also occur during periods of
intensified exercise training, overtraining, and when insufficient recovery is not allotted between
exercise bouts. All of these scenarios are related to a chronic stress response (primarily sustained
elevated cortisol) that can have an inhibitory effect on SIgA. Furthermore, these times of
chronic stress are associated with increased risk of URTI.
repetitive training sessions on salivary immunity
Figure 13: Effect of repetitive training sessions on salivary immunity
Obviously, this can be detrimental
of competition. In these cases, it is thought that there is an “open window” in which an
individual is at greater risk of acquiring an URTI due to the suppression of the immune system
following endurance exercise. However, this suppression is known to resolve with proper rest
17
SIgA secretion in response to acute exercise, it likely plays a crucial role in long duration
endurance exercise mostly due to the increased activity of the HPA axis during long duration
Decreased secretion of SIgA can also occur during periods of
intensified exercise training, overtraining, and when insufficient recovery is not allotted between
outs. All of these scenarios are related to a chronic stress response (primarily sustained
elevated cortisol) that can have an inhibitory effect on SIgA. Furthermore, these times of
chronic stress are associated with increased risk of URTI. Figure 13 below shows the effect of
repetitive training sessions on salivary immunity20
:
Figure 13: Effect of repetitive training sessions on salivary immunity
Obviously, this can be detrimental to athletic performance if an URTI occurs at the time
of competition. In these cases, it is thought that there is an “open window” in which an
individual is at greater risk of acquiring an URTI due to the suppression of the immune system
ce exercise. However, this suppression is known to resolve with proper rest
SIgA secretion in response to acute exercise, it likely plays a crucial role in long duration
increased activity of the HPA axis during long duration
Decreased secretion of SIgA can also occur during periods of
intensified exercise training, overtraining, and when insufficient recovery is not allotted between
outs. All of these scenarios are related to a chronic stress response (primarily sustained
elevated cortisol) that can have an inhibitory effect on SIgA. Furthermore, these times of
ow shows the effect of
to athletic performance if an URTI occurs at the time
of competition. In these cases, it is thought that there is an “open window” in which an
individual is at greater risk of acquiring an URTI due to the suppression of the immune system
ce exercise. However, this suppression is known to resolve with proper rest

18
and recovery, and therefore should not pose an extreme threat as long as athletes are not
overtraining. For example, Akimoto showed the beneficial effects of an increase in SIgA
concentration and secretion after an endurance training program (in unfit elderly subjects)
(Figure 14)21
:
Figure 14: Effect of training status on salivary IgA concentration and secretion rate
Physiology
Water Turnover and Bioenergetic requirements

19
Euhydration is important to maintain normal physiological processes and maintaining a
state of euhydration during exercise has been shown to optimize performance22-24
. Short
duration, high intensity exercise is often associated with dehydration while long duration low
intensity exercise can be associated with hyponatremia. The Ironman triathlon is unique in that
both dehydration and hyperhydration are probable to occur. With respect to exercise
performance, dehydration during exercise can result in a reduction in plasma volume and stroke
volume. As a result, heart rate must increase and cardiac output will decrease because of the
inability of heart rate to compensate for the reduced stroke volume. This could result in a
decrease in performance due to premature fatigue and/or an increase in core body temperature.
On the other hand, fluid overload can result in a decrease in serum sodium concentration that can
lead to hyponatremia, again resulting in a decrease in performance. Fluid needs are often not met
during exercise and a resulting increase in plasma sodium can occur.
Fluid balance during exercise is often measured by a change in body mass during the
activity. While this measurement is often times used in the field, laboratory, and clinical settings
for its convenience, it may not reflect total body water loss/gain in all situations. However, it can
be used as a predictor to indicate the fluid lost or gained during the event. In the case of an
Ironman, fluid input involves that from fluids consumed as well as food consumed during the
race. Fluid output includes fluid lost via sweating, urinating, and bowel movements. However,
since the Ironman involves exercise of 8-17 hours, there is an assumed degree of water lost from
the oxidation of substrates which may not be accounted for when simply measuring pre and post-
event body mass.
The oxidation of glycogen is the prominent substrate contributing to metabolic water loss
since water is stored as a component of glycogen. This may provide an endogenous water source

20
which could mean that total body water may not change despite a decrease in body mass (or at
least not to the extent of the decrease in body mass). This endogenous water source could be
especially helpful due to the limited intake that can be withstood in these long distance events,
due to limitations of fluid consumption, gastric emptying, and gastrointestinal irritation (Figure
15)25
:
Figure 15: Effect of carbohydrate consumption on fluid absorption during exercise
However, it has also been suggested that the water gain through substrate metabolism
likely does not contribute substantial amounts of fluid25
. While metabolic fluid losses/gains are
difficult to directly study in the field, it may be of importance to consider these variables when
calculating water turnover, especially during prolonged endurance events.
When exercise is prolonged such as during an Ironman triathlon, energy requirements can
exceed 10,000 kcal26-28
and successful completion of the event is partly reliant on the ability to
sustain a high rate of energy expenditure. Therefore, it is obvious that the high energy
requirements of this event place great dependence on the metabolic processes of the body to keep
up with the high energy demand.

21
In one of the first studies to diligently track nutritional intake during an Ironman, Kimber
et al.26
assessed energy balance (energy expenditure vs. energy intake) and reported that their
subject’s exogenous fuel intake equated to approximately 40% of their total energy requirement,
leaving an approximate 5,600 kcal deficit during the race. Similarly, Hew Butler27
also found a
significant energy deficit following and Ironman triathlon. These large deficits are likely due
gastrointestinal tract dysfunction during competition.
Data is scarce in the realm of gastrointestinal dysfunction during ultra-endurance events,
however laboratory studies indicate that the importance of GI function may increase as duration
of exercise increases. Generally speaking, gastric emptying can limit the rate at which fuel and
fluids become available for use. Moreover, there is an upper limit at which the stomach can
handle fluids, beyond which discomfort and intolerance can occur. Jeukendrup showed that this
intolerance becomes more extreme as exercise duration continues, and also becomes heightened
when adding carbohydrates to the drink (Figure 16)28
: (open bars=water; shaded bars=glucose;
solid bars=glucose+fructose).
Figure 16: Effect of exercise duration on perception of stomach fullness

22
As the current literature shows, it does not appear that current drinking habits among
triathletes approach this upper limit of failure of gastric emptying. Two studies29,30
reported an
average or just over 700ml of fluid intake per hour during an Ironman. As this data is scarce, it
is important to consider all factors associated with fluid balance during an Ironman event,
including environmental conditions, amount of aid stations, individual considerations, etc.
As previously described26,27
, exogenous fuel intake is not able to keep up with the amount
of fuel needed to complete an Ironman triathlon. Therefore, it is obvious that endogenous fuel
sources are also critical in their ability to successfully complete the triathlon despite this deficit.
Muscle glycogen and blood glucose are the primary sources of energy during the initial phases of
this event, and depletion of these sources is associated with premature fatigue. While blood
glucose and glycogen are primarily responsible especially in the onset of an Ironman, it has been
shown that the initial high carbohydrate oxidation will plateau after the first few hours of
exercise, even if exogenous carbohydrate intake is high (Figure 17)31
:
Figure 17: Exogenous glucose oxidation during exercise

23
This transition of substrate utilization from carbohydrates to fats is not surprising, and can even
be enhanced with proper training. During training, especially for ultra-endurance athletes, it is
important to train long distances because this will deplete carbohydrate stores and emphasize the
use of fat as a fuel substrate. Ultimately, this will preserve glycogen stores and theoretically
allow the athlete to perform exercise longer.
Training also allows for fast oxidation of macronutrients to maximize oxidative
phosphorylation. This will induce a signal cascade that will cause an upregulation of the
enzymes needed to quickly breakdown these macronutrients. Coffee and Hawley32
showed that
this upregulation results in an increased rate of energy production from aerobic pathways, tighter
metabolic control, and an increased exercise economy which ultimately leads to less fatigue
during exercise.
Some research among the Ironman population has focused on hyponatremia by trying to
identify a link between body mass loss and serum sodium concentration after an Ironman. In this
cohort of studies, results were mixed as to the relationship between percent body mass loss,
serum sodium concentration, and plasma volume27,29,33-37
. Average percent body mass loss
ranged between 2-5%, while serum sodium concentrations were found to increase, decrease, or
remain the same when compared to pre-race values, and plasma volume shifts were also variable.
In those studies attributing sodium levels to extra cellular volume, it was concluded that plasma
volume was maintained despite decreases in body mass, which agrees with the idea that the body
will protect plasma volume with a contribution from the intracellular fluid27,33,36
.
It is important to understand that body mass changes, plasma volume shifts, and serum
electrolyte concentrations after an ultra-endurance event depend more on simply that amount of

24
fluid consumed during the event. For example, factors such as sweat rate, hydration programs
during training, heat acclimatization, and environmental conditions play key roles in the total
amount of fluid lost and gained during competition. These variations highlight the importance
of individualized training and competition regimens. Therefore, specific to hydration plans
during competition, universal recommendations can almost never be made, but rather individuals
should develop a plan specific to their needs during training in order to be successful.
Additionally, these plans may have to be altered based on varying environmental conditions of
their respective races.
Thermoregulation
Thermoregulation is the body’s ability to maintain a safe range of core body temperature.
When metabolic heat production exceeds the body’s ability to dissipate heat the result is
hyperthermia. Conversely, hypothermia results when heat dissipation exceeds that of heat
production. Just as triathletes can become dehydrated or hyperhydrated during an Ironman, they
are also at risk for both hyperthermia or hypothermia. While thermoregulation during exercise
has been extensively studied, the majority of the data has been obtained from laboratory studies
in which factors such as exercise intensity, duration, environmental conditions, and hydration are
controlled. Moreover, field studies have largely been conducted on shorter duration events, with
the exception of recent reports of thermoregulation and pacing strategy during a marathon.
Thermoregulation is especially important to consider in the Ironman population due to the
integration of other confounding variables such as cardiovascular, respiratory, metabolic, and
nervous system responses, environmental conditions, and hydration status.

25
Two of the primary factors that affect thermoregulation with any form of exercise are the
intensity of the exercise and the environmental conditions present during the exercise bout.
Mitigating the rate of rise of core temperature is primarily dependent on the body’s ability to
dissipate endogenous heat production, which is a direct result of exercise intensity. Heat
dissipation can be maximized when a high 1) core temperature to skin temperature ratio, and 2)
skin temperature to air temperature ratio exists. Therefore, it is obvious that skin temperature is
extremely important. The primary heat dissipation mechanism during exercise is sweating and
the resulting evaporation of the sweat off the skin. When a high humidity is present, the
evaporation mechanism will be severely blunted causing skin temperature to remain high and no
cooling to occur, resulting in an increase in core temperature. If dehydration is also present,
cardiovascular strain will be heightened putting the body in a physiological deficit. During
exercise, it is assumed that some degree of cardiovascular strain will be present, as it is necessary
for heart rate to increase to compensate for decreased stroke volume resulting from blood being
shunted away from the body core to the periphery. When this is present, the following responses
are likely to occur: 1) a decrease in intensity to maintain a given workload, or 2) a voluntary
decrease in work output to minimize cardiovascular strain. In both circumstances, a decrease in
performance will occur either voluntarily or due to premature fatigue. One of the main factors
deciding these responses is the environmental conditions that are present during the exercise
bout.
Studies have reported on “optimal conditions” for athletic performance, however most of
these reports pertain to the marathon. Generally, this optimal range has been reported as
between 5-20 degrees C (first reported by Frederick et al. in 198338
). In this study, an inverse
“V” was plotted to show the relationship between winning marathon time and ambient

26
temperature. Additionally, when examining over 100 years of the Olympic marathon,
Maughan39
showed that the percentage of finishers was highly correlated with ambient
temperature. Furthermore, this study found a 25% drop in successful finishers when ambient
temperature rose above 25 degrees C. Similarly, when studying the relationship between
exertional heat stroke and environmental conditions at the Falmouth Road Race, it was found
that the incidence rate was highly correlated with both ambient temperature and heat index
(r2>0.7)40
.
A confounding variable that plays a primary role in the relationship between
environmental conditions and change in core body temperature is exercise intensity. First
established by Nielsen in 1938, it was proposed that an increase in core temperature is
proportional to metabolic rate and almost independent of environmental conditions over a wide
range. Sawka and Pandolf later showed that altering intensity level in different environmental
conditions will also alter sweat rate, and therefore thermoregulation (Figure 18)41
:
Figure 18: Effect of environment on sweat rate at different running speeds
27
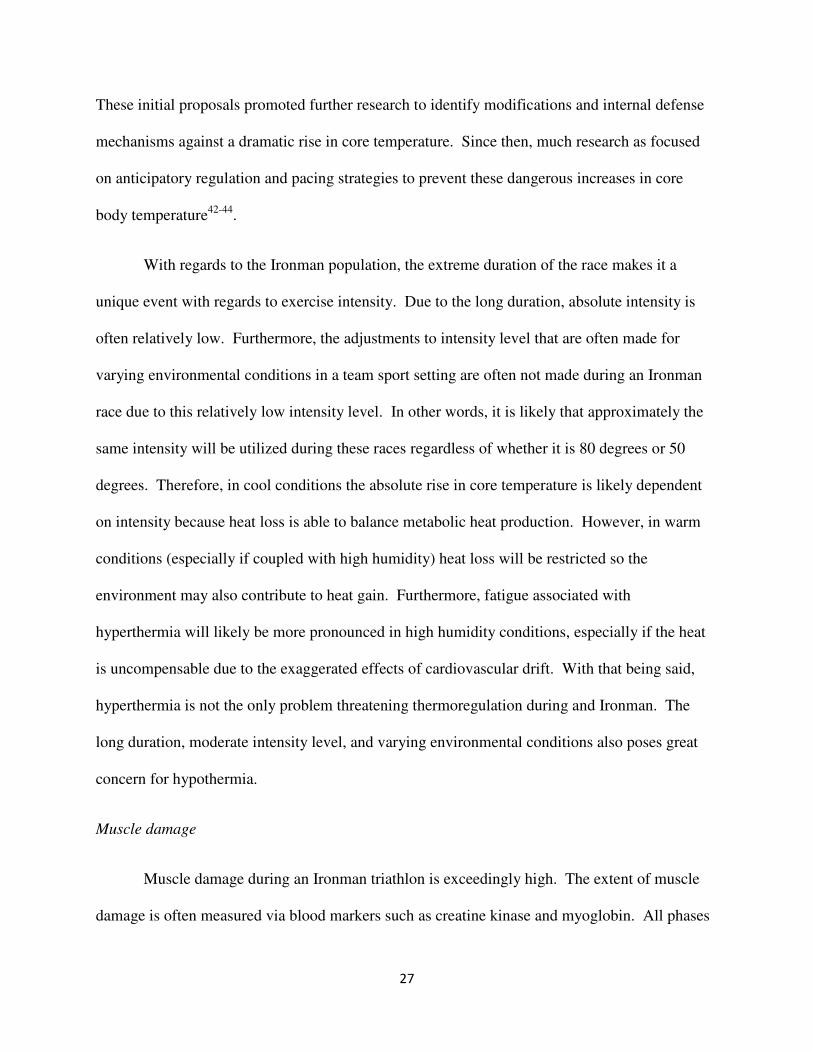
These initial proposals promoted further research to identify modifications and internal defense
mechanisms against a dramatic rise in core temperature. Since then, much research as focused
on anticipatory regulation and pacing strategies to prevent these dangerous increases in core
body temperature42-44
.
With regards to the Ironman population, the extreme duration of the race makes it a
unique event with regards to exercise intensity. Due to the long duration, absolute intensity is
often relatively low. Furthermore, the adjustments to intensity level that are often made for
varying environmental conditions in a team sport setting are often not made during an Ironman
race due to this relatively low intensity level. In other words, it is likely that approximately the
same intensity will be utilized during these races regardless of whether it is 80 degrees or 50
degrees. Therefore, in cool conditions the absolute rise in core temperature is likely dependent
on intensity because heat loss is able to balance metabolic heat production. However, in warm
conditions (especially if coupled with high humidity) heat loss will be restricted so the
environment may also contribute to heat gain. Furthermore, fatigue associated with
hyperthermia will likely be more pronounced in high humidity conditions, especially if the heat
is uncompensable due to the exaggerated effects of cardiovascular drift. With that being said,
hyperthermia is not the only problem threatening thermoregulation during and Ironman. The
long duration, moderate intensity level, and varying environmental conditions also poses great
concern for hypothermia.
Muscle damage
Muscle damage during an Ironman triathlon is exceedingly high. The extent of muscle
damage is often measured via blood markers such as creatine kinase and myoglobin. All phases

28
of the Ironman triathlon likely contribute to muscle damage, however the most significant
contributor is the run phase which requires a significant eccentric muscle contraction component.
Depending on the layout of the course (with regards to elevation changes) the extent of eccentric
muscle contraction may vary. Furthermore, overall performance in an Ironman is highly
correlated with performance in the run phase. While higher trained athletes may actually endure
more muscle damage during the race due to a faster pace, higher trained athletes will adopt
specific adaptations that can reduce overall damage due to improved recovery/repair
mechanisms.
There are currently two published studies that examined markers of muscle damage
following an Ironman triathlon45,46
. Not surprising, both studies found dramatic increases in both
creatine kinase and myoglobin following the race, while Suzuki et al. found CK to peak 1 day
post-race45
. Additionally, Neubauer et al. showed that this response remained elevated for 19
days following the race (Figure 19)46
:
29
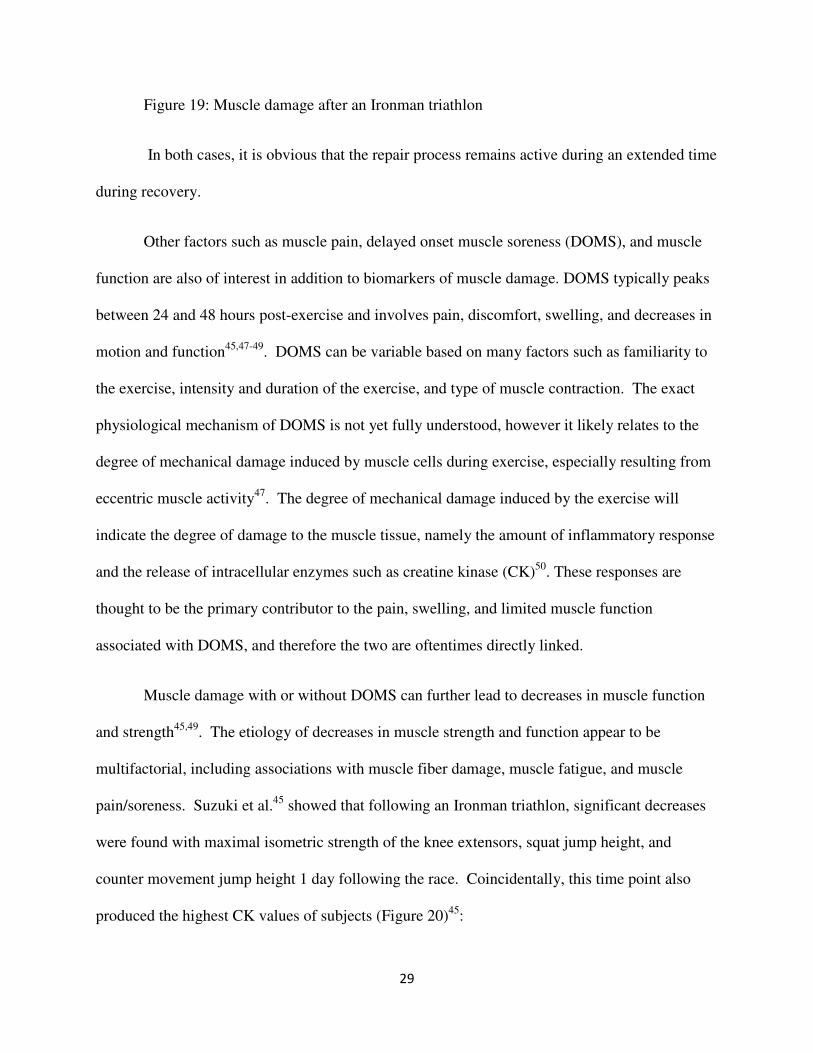
Figure 19: Muscle damage after an Ironman triathlon
In both cases, it is obvious that the repair process remains active during an extended time
during recovery.
Other factors such as muscle pain, delayed onset muscle soreness (DOMS), and muscle
function are also of interest in addition to biomarkers of muscle damage. DOMS typically peaks
between 24 and 48 hours post-exercise and involves pain, discomfort, swelling, and decreases in
motion and function45,47-49
. DOMS can be variable based on many factors such as familiarity to
the exercise, intensity and duration of the exercise, and type of muscle contraction. The exact
physiological mechanism of DOMS is not yet fully understood, however it likely relates to the
degree of mechanical damage induced by muscle cells during exercise, especially resulting from
eccentric muscle activity47
. The degree of mechanical damage induced by the exercise will
indicate the degree of damage to the muscle tissue, namely the amount of inflammatory response
and the release of intracellular enzymes such as creatine kinase (CK)50
. These responses are
thought to be the primary contributor to the pain, swelling, and limited muscle function
associated with DOMS, and therefore the two are oftentimes directly linked.
Muscle damage with or without DOMS can further lead to decreases in muscle function
and strength45,49
. The etiology of decreases in muscle strength and function appear to be
multifactorial, including associations with muscle fiber damage, muscle fatigue, and muscle
pain/soreness. Suzuki et al.45
showed that following an Ironman triathlon, significant decreases
were found with maximal isometric strength of the knee extensors, squat jump height, and
counter movement jump height 1 day following the race. Coincidentally, this time point also
produced the highest CK values of subjects (Figure 20)45
:

30
Figure 20: Effect of an Ironman triathlon on muscle force
Muscle damage is also associated with inflammation and immune responses. More
specifically, there is an ensuing systemic inflammatory and immune response that continues
during the repair process after exercise. In addition, hyperthermia, oxidative stress, and
metabolic stress are inherent of ultra-endurance exercise and are capable of releasing
inflammatory cytokines. Part of this stress response includes stimulation of the hypothalamic
pituitary adrenocortical axis which causes an increase in cortisol release. Moreover, the cortisol
response is partly mediated by cytokines, the degree of which will partly determine the extent of
the systemic inflammatory response. When exercise-induced tissue damage occurs, it induces
rapid repair and adaptation responses. More specifically, muscle damage will cause
inflammatory cells such as phagocytes to rush to the injured muscle tissue. These cells
accumulate with the task of cleaning up the injured area and allowing the inflammatory process
to continue. In addition, this inflammatory response also contains an immune component which
allows cells such as macrophages and neutrophils to migrate to the injured tissue. This
inflammatory response is beneficial and necessary to repair and adaptation, however repeated

31
damage from heavy training could result in a chronic cytokine response, in which case the
healing process will get not be able to proceed from the inflammatory phase. This adverse
outcome is a direct result of overstimulation of cortisol that will result in suppression of the
immune system and the halting of the inflammatory response. This response can often times
occur in overtraining syndrome.
Cold Water Immersion and Recovery
Thermoregulation
Cold water immersion is the most effective way to reduce core body temperature51-61
. In
addition to its effects on thermoregulation, it has also been shown to positively affect
cardiovascular, metabolic, and perceptual responses. Many athletes use post-exercise strategies
in hopes of enhancing recovery. While cold water immersion has long been used for both
prevention and treatment of exertional heat illness, it recently has become a popular post-
exercise recovery strategy as well. While this is becoming a popular post-exercise recovery
strategy, there is little research to back the proposed physiological and perceptual benefits of
cold water immersion on recovery. Moreover, even fewer studies have examined these effects in
the ultra-endurance population.
Several mechanisms have been proposed to explain the potential recovery benefits from
cold water immersion including decreased metabolic rate (resulting in decreased tissue
temperature and decreased pro-inflammatory cytokines), increased venous return, decreased
inflammation and damage of muscle tissue, and decreased muscle soreness47
. From a
biochemical standpoint, cold water immersion may provide an attenuation of the general stress
response, oxidative stress, and cytokine (i.e. pro-inflammatory’s) that are prevalent and

32
extremely high after an ultra-endurance exercise bout such as an Ironman triathlon. While
methodology and ensuing results from these studies are highly variable, anecdotally cold water
immersion could provide a great benefit to Ironman athletes.
Instead, research has focused on the effect of cold water immersion on core body
temperature, cardiovascular response, and perception of muscle soreness/pain. Unfortunately,
much of this research has focused on anaerobically based exercise (i.e. power output, force,
speed). Despite this, the theoretical basis for the benefits of cold water immersion on recovery
remain the same, namely attenuating muscle soreness (including delayed onset muscle soreness
(DOMS)), decreasing core body temperature (and local tissue temperature), and promoting
venous return to normalize cardiovascular function.
The use of cold water immersion to decrease the amount of muscle damage and DOMS is
theoretically attributed to two mechanisms: 1) decreasing the metabolic rate and inflammation
associated with strenuous exercise (and therefore decreasing tissue temperature and core body
temperature), and 2) restoring cardiovascular function via an increase in venous return62
.
Several factors may affect the effectiveness of cold water immersion on recovery such as
when the cooling is initiated post-exercise, duration of cooling, and the water temperature of the
bath. One of the first studies to compare different water immersion temperatures showed that
cooling rates were nearly identical between cold water immersion (14°C) and ice water
immersion (5°C), while both provided significantly faster cooling rates vs. no cooling63
.
However, when rectal temperature was continued to be monitored post-immersion, the ice water
immersion bath provided lower body temperatures during the post-immersion recovery period
(Figure 21)63
:

33
Figure 21: Effect of cold water immersion and ice water immersion on rectal temperature
after exercise
In a similar study, immersion water temperatures of 2, 8, 14, and 20°C were compared
after subjects exercised at a moderate intensity until rectal temperature reached 40°C64
. The
cooling rates of the 8, 14, and 20°C baths showed similar cooling rates, all of which were
significantly slower than the 2°C bath (Figure 22)64
:
Figure 22: Effect of different water temperatures on rectal temperature after exercise

34
Salivary immunity
A growing area of interest among researchers is the apparent close association between
heat stress and immune function. Currently, there is little research to show clinically significant
outcomes related to immune responses and infection incidence among athletes who train and/or
compete in hot and humid conditions, or the potential benefit of a cooling intervention post-
exercise to mitigate the inherent immune suppression following an ultra-endurance bout of
exercise. Currently, there is an ongoing controversy on whether the immune system is involved
in the etiology of exertional heat illnesses, especially exertional heat stroke. First proposed by
Shephard65
and most recently studied by Lim and Mackinnon66
, this relationship is primarily
based on the resulting gastrointestinal ischemia occurring from exercise in the heat. This occurs
because during exercise, blood is shunted away from the body core (including the GE tract) in
order to sufficiently supply the working muscles with blood as well as the skin (to promote
sweating). Furthermore, when exercise is performed in the heat, this response is exaggerated.
This can result in damage to the intestinal mucosa and leakage of lipopolysaccharide (LPS) into
the circulating blood67
. One way in which LPS is removed from the circulating blood is from
help by monocytes and macrophages. However, during intense exercise, these immune defenses
are often overwhelmed and cannot adequately perform these tasks. As a result, a sequence of
events can ensue resulting in a further increase in the systemic inflammatory response that in
extreme cases may lead to intravascular coagulation and multi-organ failure67
. This response
lends possible explanation to cases of exertional heat stroke that often times lack a
distinguishable physiological etiology (Figure 23): (Classical and immune pathways of EHS
(solid arrows indicate likely links in the pathway; broken arrows indicate unsubstantiated in EHS
etiology)

35
Figure 23: Proposed link between exertional heat stroke and immune function
A question that remains unanswered is whether or not the leakage of LPS from the gut, the
resulting effect on cytokine release and immune suppression, and altered thermoregulation and
cardiovascular instability during exercise-heat stress can be attenuated after the cessation of
exercise.
Some research exists on the effects of passive cooling on immune function. These results
show that mild decreases in core temperature may have a stimulatory effect on immune
function68,69
while modest to severe decreases in core temperature have depressive effects on
immune function70,71
. This is likely due in large part to the associated activation of the
neuroendocrine and immune responses. The effect of post-exercise body cooling on immune
function remains to be unstudied. Based on the aforementioned mechanisms of the association
between immune function and thermoregulation, it is possible that a bout of cooling during
recovery from exercise may limit immune suppression following endurance exercise.

36
The purpose of this study is to (1) assess the physiological and immunological changes
following an Ironman triathlon; (2) track the physiological and immunological changes through
two days of recovery; and (3) determine if cold water immersion immediately following an
ironman triathlon attenuates these responses. Our hypotheses were that (1) the Ironman triathlon
would lead to a high degree of physiological stress including suppressed salivary immunity; (2)
physiological stress and muscle damage would remain present during recovery, while immune
function would return to baseline the day following the race; and (3) cold water immersion
would attenuate the effects of the race compared to a control condition.
METHODS
Participants
39 healthy triathletes (29 males, 10 females) who participated in the 2012 Ironman World
Championships volunteered as subjects for this study. (Table 1)
N AGE (Y) HEIGHT
(CM)
BODY
MASS (KG)
BODY FAT
(%)
Males 29 45 ± 10 176 ± 6 71.8 ± 6.5 9.3 ± 3.6
Females 10 43 ± 12 168 ± 6 59.1 ± 5.1 14.5 ± 3.1
TOTAL 39 44 ± 11 174 ± 7 68.6 ± 8.3 10.7 ± 4.2
Table 1: Subject demographic information
Participants were excluded from participation if they had 1) a known chronic health problem, 2)
a previous history of exertional heat stroke within the 3 years prior to the race, 3) a history of

37
cardiovascular, metabolic or respiratory disease, 4) a history of suspected obstructive disease of
the gastrointestinal tract, and/or 5) a current musculoskeletal injury limiting them from normal
physical activity. All qualifying individuals were required to complete a medical history
questionnaire prior to participation. All participants read and signed an informed consent and the
study protocol was approved by the University of Connecticut Institutional Review Board.
Design Overview (Experimental Approach to the Problem)
To assess the physiological and immunological changes following an Ironman triathlon,
investigators recorded measurements related to salivary immune function, stress, muscle
damage, and hydration status. To assess the effect of cold water immersion on recovery, subjects
were randomized by gender and finish time into either a cold water immersion group or a control
group. All measurements with the exception of blood samples were taken at baseline (1 day
during the week leading up to the race), immediately prior to the race, immediately following the
race, 1-day following the race, and 2-days following the race. Blood samples were taken at all
time points except for immediately prior to the race. All samples were collected at similar times
of the day, with the exception of race day, to control for diurnal variation.
Testing Protocol
Baseline (BASE) Measurements
Initial testing of participants began during the week prior to the Ironman race. All
participants were required to report to the testing site for 2 hours during this time. Upon arrival,
subjects were seated for a 10-minute period prior to collection of a saliva sample for
measurements of salivary immunoglobulin A (SIgA), cortisol (Scort), and alpha amylase (Sαam).
Subjects rinsed with bottled water and were instructed to sit quietly for the 10-minute waiting

38
period while a researcher demonstrated the proper technique for saliva collection. Additionally,
it was ensured that subjects had not consumed any food or fluid other than water nor did they
brush their teeth in the previous 30-minutes, as this could affect the saliva collection. After the
10-minute waiting period, participants were asked to produce a 1mL sample of saliva via passive
drool technique into a 1.5 mL clear plastic epindorf tube. Time to complete the 1mL volume
sample was noted by a researcher to enable calculation of saliva flow rate.
Following the saliva sample, subjects were asked to provide a urine sample for a baseline
hydration measure via urine specific gravity (USG) while voiding their bladder prior to body
mass (BM) assessment. Body mass to the nearest 0.1kg and body composition was performed
via InBody720 analyzer. This required subjects to stand on the unit and hold sensors for
approximately 2 minutes. Height was also recorded during this time for demographic identity.
Subject demographic information can been seen in Table 1.
N AGE (Y) HEIGHT
(CM)
BODY
MASS (KG)
BODY FAT
(%)
Males 29 45 176.2 71.8 9.3
Females 10 43 167.8 59.1 14.5
TOTAL 39 44 174.0 68.6 10.7
Blood samples were obtained on all subjects via single stick butterfly needle. Subjects
were positioned in a supine position with their trunk slightly elevated and arm resting
Table 1: Demographic information for all subjects.

39
comfortably. 33mL of blood was taken from a superficial vein in the antecubital fossa for
biochemical analyses of cortisol (CORT), creatine kinase (CK), and myoglobin (MYO).
Following these measurements, participants then continued baseline testing to have their
sweat rate calculated and be fitted with a heart rate monitor and GPS watch. This
instrumentation served to record metrics of their race performance such as heart rate (HR),
distance, and speed. All participants were fitted with the heart rate monitor and GPS watch prior
to exercise of their choice (either biking or running) for 30-60 minutes. Sweat rate was
calculated via body mass loss during this exercise bout, and expressed as liters per hour.
Lastly, participants filled out several questionnaires which included: 1) Training History
Questionnaire (Appendix A), 2) Dietary Record (Appendix B), 3) Sleep Record (Appendix C), 4)
Environmental Symptoms Questionnaire (Appendix D), and 5) Delayed Onset Muscle Soreness
Scale (Appendix E). Prior to leaving the testing area, participants were given instructions to
prepare for race day, as well as given an ingestible temperature thermistor for race day tracking
of gastrointestinal temperature (Tgi). Subjects were instructed to take the temperature sensor
immediately before going to sleep the night before the race, to give ample time to pass into the
small intestine.
Pre-Race (PRE) Measurements
Participants arrived to the testing site 1-2 hours prior to the start of the race for their pre-
race measurements. Upon arrival, all subjects were fitted with their heart rate monitor and GPS
watch, provided a urine sample, and were weighed to the nearest 0.1kg. Participants then were
seated to fill out questionnaires and provide a pre-race saliva sample. During this time,
researchers checked Tgi to ensure the sensor was properly reading. If a reading failed to be

40
produced, subjects were asked to swallow another thermistor. Following pre-race measurements,
serial measurements of web bulb globe temperature (WBGT) were taken throughout the course
of the day.
Post-Race (POST) Measurements
Immediately upon completion of the race, subjects reported to the testing area near the
finish line. Tgi, HR and BM were recorded and subjects were randomized to either the
intervention group (cold water immersion (CWI) or the control group. For the intervention
group, subjects were seated in a CWI tub with water up to their shoulders for 12 minutes. Water
temperature was kept constant at approximately 10°C, and water was stirred every 2 minutes. For
the control group, subjects were seated on a bench next to the immersion tub for 12 minutes.
During this time, Tgi and heart rate readings were taken at 0 minutes, 6 minutes, and 12 minutes.
After the 12 minute period, participants were then escorted by a researcher to the indoor
laboratory space for the remainder of the post-race procedures. Upon arrival to the laboratory,
subjects provided a urine sample, provided a saliva sample, had their blood drawn, had their
body weight recorded, and completed several questionnaires. Prior to leaving, participants signed
up for recovery testing for the following two days.
Recovery Measurements
On the day following the race (REC1) and two days following the race (REC2), subjects
reported back to the testing laboratory for recovery measurements. Time of day was kept
consistent to limit variability in blood and saliva samples due to diurnal rhythms. During these
visits, subjects provided a saliva sample, urine sample, blood sample, had their body weight
recorded, and completed several questionnaires.

41
Biochemical Analyses and Instrumentation
Blood Analyses: All blood samples were taken via single stick butterfly needle into clear
vacutainers. Whole blood was drawn into tubes pretreated with EDTA vacutainer for the
analyses of CORT and MYO, and into Serum tubes for the analysis of CK. Blood was then
centrifuged at 3,000 rpm for 15 minutes at 4°C. Samples were then aliquoted to pre-labeled clear
plastic epindorf tubes and frozen via dry-ice to be shipped back to the human performance
laboratory. Frozen samples were then stored at -80°C until analysis.
Individual samples were thawed prior to biochemical analysis. Cortisol and myoglobin
were assessed in duplicate via enzyme-linked immunosorbent assay (ELISA) (Calbiotech, Spring
Valley, CA). Inter-assay variation for the assays were 8.9% and 5.9%, respectively. Intra-assay
variability for the assays were 7.4% and 8.5%, respectively. Creatine kinease was measured in
duplicate using assay procedures from Genzyme Diagnostics (Charlottetown, PE, Canada).
Biomate spectrophotometer from Thermo Scientific (Waltham, MA) was used to determine the
appropriate absorbance values used in calculations. All analyses were completed based on
manufacturers’ instruction. The CK analyses yielded an inter-assay coefficient of variation of
8.9% and an intra-assay coefficient of variation of 6.5% for all samples.
Saliva Analyses: Saliva samples were collected into 2mL clear salivettes (Salimetrics,
State College, PA). After collection, samples were frozen via dry ice and shipped to the
Pediatric Exercise and Genomics Research Center at the University of California Irvine, where
they were stored at -80°C until analysis. After thawing, saliva samples were centrifuged at 1500
g for 15 minutes to obtain the clear supernate from the sample. Samples were aliquoted into 96

42
well non-binding plates for each assay. For each sample, 3 aliquots were separated for the
determination of concentrations of SIgA, Scort, and Sαam.
SIgA concentrations were determined using an indirect competitive immunoassay
method using a commercially available kit (Salimetrics, State College, PA). Six plates were
utilized for this assay in order to run all samples in duplicate. Based on the standard values,
Inter-assay variation averaged 5%. The Intra-assay variation averaged 2.1%. Scort
concentrations were determined using a high sensitivity salivary cortisol enzyme immunoassay
kit (Salimetrics, State College, PA). Six plates were utilized for this assay in order to run all
samples in duplicate. Based on the standard values, Inter-assay variability averaged 3.8%. The
Intra-assay variability averaged 2%. Sαam activity was determined using a kinetic salivary α-
amylase assay kit (Salimetrics, State College, PA). All analyses were completed based on
manufacturers’ instruction.
Urine Analyses: Urine samples were collected into individually assigned clear plastic urine cups.
Urine samples were analyzed for urine specific gravity using a refractometer (A300CL, Atago
Co., Tokyo, Japan).
Demographic measurements: Body mass and percent body fat was measured via
InBody720 body composition analyzer (Biospace, Seoul, South Korea). Height was recorded via
standard tape measure.
Individual race characteristics: Subjects were given an ingestible temperature sensor in
order to obtain core body temperature readings (HQ inc., Palmetto, FL). Subjects wore a Timex
Global Trainer GPS watch (Timex Group USA, Middlebury, CT) during the sweat rate analysis
during baseline testing and for the entirety of the race. In addition, they were fitted with a Timex

43
Flex-Tech Digital heart rate monitor (Timex Group USA, Middlebury, CT). These devices
continually recorded heart rate and GPS variables, including distance covered and speed. At the
completion of data collection, all individual information was downloaded to TrainingPeaks
computer software (Peaksware, Lafayette, CO) for analysis.
Statistical Analysis
All data is presented as mean ± standard deviation of the mean. A one-way analysis of
variance (ANOVA) was used to determine changes in urine specific gravity and percent body
mass loss over time (Pre-race, Post-race, +1 Day post-race, and +2 Days post-race). A one-way
ANOVA was also used to determine changes in heart rate and delta gastrointestinal temperature
during the 12-minute intervention. Post-hoc testing via bonferroni corrections were implemented
when significance was noted. All blood variables were analyzed via linear mixed model
ANOVA (Group (2) X Time (4)) and independent samples t-tests were utilized when a
significant interaction was observed. All saliva variables were analyzed via linear mixed model
ANOVA (Group (2) X Time (5)). SPSS 19.0 (SPSS Inc., Chicago, IL) was used for all analyses
and significance was set apriori at p<0.05.
RESULTS
Hydration: Urine specific gravity was significantly greater post-race (1.021 ± 0.006;
p<0.001) and remained significantly elevated at the +1Day time point (1.022 ± 0.008; p<0.001).
USG returned to pre-race values (1.012 ± 0.007) at the +2Day time point (1.017 ± 0.006;
p=0.083). Percent body mass loss post-race (-3.49 ± 2.29%; p<0.001) was significant compared
to pre-race body mass, however returned to pre-race levels by 1 day post-race (Figure 24).

44
Physiological: A significant interaction (Time X Group) occurred for delta core body
temperature (p=0.02). While Tgi change was not significantly different between groups during
the first 6 minutes of cooling (0.348 ± 0.292°C vs. 0.194 ± 0.292°C; p=0.169), significant
differences were observed at the 12-minute time point (0.693 ± 0.495°C vs. 0.282 ± 0.385°C;
p=0.021) (Figure 25).
-7.00
-6.00
-5.00
-4.00
-3.00
-2.00
-1.00
0.00
1.00
2.00
3.00
4.00
Post +1 Day +2 Day
% BML from Pre-race Body Mass
All Subjects
Male Subjects
Female Subjects
¶
Figure 24. Percent body mass loss over time compared to pre-race body mass. ¶
indicates significant body mass loss compared to pre-race values.

45
A significant interaction (Time X Group) also occurred for heart rate during the 12-minute
intervention (p=0.016). HR at the 0-minute time point was not significantly different between
groups (p=0.147). The cooling group exhibited a significantly lower HR than the control group at
both the 6-minute mark (77 ± 10 bpm vs. 92 ± 11 bpm; p<0.001) and the 12-minute mark (75 ±
12 bpm vs. 88 ± 10 bpm; p=0.001) of cooling (Figure 26).
0 6 12
CWI 0 -0.348 -0.693
CONTROL 0 -0.194 -0.282
-1.4
-1.2
-1
-0.8
-0.6
-0.4
-0.2
0
0.2
ΔTg
i (°
C)
Tgi Response to CWI
*
†
† ‡
Figure 25: Gastrointestinal temperature response to 12 minutes of cold water immersion
vs. 12 minutes of passive sitting. * indicates significantly different ∆Tgi between
groups, † indicates significantly different from the 0-minute time point, ‡ indicates
significantly different from the 6-minute time point.

46
Saliva: No significant interaction (Group X Time) occurred for SIgA (p=0.982);
however, a significant main effect for time was observed (p=0.015). At PRE, SIgA was higher
than all other time points (332.6 ± 261.0 µg/mL), with significantly higher differences occurring
at the BASE (234.1 ± 175.4 µg/mL; p=0.020), +1 Day (226.1 ± 204.2 µg/mL; p=0.003) and +2
Day (202.3 ± 119.3 µg/mL; p=0.003) time points. No significant difference was observed with
SIgA at POST (261.5 ± 172.1 µg/mL) compared to any other time point (Figure 27).
0 6 12
CWI 98 77 75
CONTROL 99 92 88
60
70
80
90
100
110
120
He
art
Ra
te (
bp
m)
Heart Rate Response to CWI
*
†
†*
Figure 26: Heart rate response to 12 minutes of cold water immersion vs. 12 minutes of
passive sitting. * indicates significantly different HR between groups, † indicates
significantly different from the 0-minute time point.

47
No significant interaction (Group X Time) was observed for Sαam (p=0.34); however, a
significant main effect for time was observed (p=0.006). Sαam was significantly elevated at
POST (328.8 ± 304.0 IU/mL) compared to all other time points, with no other significant
interactions occurring between time points (Figure 28).
0
100
200
300
400
500
600
700
800
1 2 3 4 5
SIg
A (
µg
/mL)
Concentration of SIgA
CWI
CONTROL
BASE PRE POST +1 DAY +2 DAY
†
Figure 27: Concentration of salivary IgA over time between cooled subjects and control
subjects. † indicates significantly greater values compared to baseline, +1 day, and +2
day values.

48
To account for the variability in saliva flow rate, concentrations of SIgA and Sαam were
also expressed as a secretion rate. No significant interaction (Group X Time) occurred for saliva
flow rate (p=0.728); however, a significant main effect for time was observed (p=0.019) with the
+1 Day time point exhibiting significantly greater flow rates than all other time points (Figure
29).
0
100
200
300
400
500
600
700
800
900
1 2 3 4 5
α-a
my
lase
(IU
/L)
Concentration of α-amylase
CWI
CONTROL
BASE PRE POST +1 DAY +2 DAY
¶
Figure 28: Concentration of salivary α-amylase over time between cooled subjects and
control subjects. ¶ indicates significantly greater values than all other time points.

49
This analysis revealed no significant interaction (Group X Time) for secretion rate of SIgA
(p=0.889) or secretion rate of Sαam (p=0.315); however, a significant main effect of time was
observed for secretion rate of SIgA (p=0.026). Secretion rate of SIgA was significantly higher at
PRE compared to BASE (92.0 ± 92.8 µg/min vs. 51.4 ± 34.8 µg/min; p=0.017). The POST time
point (49.8 ± 45.8 µg/min) was significantly lower than PRE (92.0 ± 92.8 µg/min; p=0.015) and
+1 Day (86.4 ± 105.4 µg/min; p=0.035) (Figure 30).
0
200
400
600
800
1000
1200
1400
1600
1 2 3 4 5
Flo
w R
ate
(µ
L/m
in)
Salivary Flow Rate
CWI
CONTROL
BASE PRE POST +1 DAY +2 DAY
¶
Figure 29: Salivary flow rate over time between cooled subjects and control subjects. ¶
indicates significantly different from all other time points.

50
No significant interaction (Group X Time) was observed for Scort (p=0.808); however, a
significant main effect for time was observed (p<0.001). Scort was significantly elevated at PRE
(0.736 ± 0.298 µg/dL; p=0.001) compared to BASE (0.181 ± 0.088 µg/dL). Scort was
significantly greater at POST (1.62 ± 1.27 µg/dL) compared to all other time points, and Scort
PRE was significantly greater than BASE, +1 Day (0.324 ± 0.795 µg/dL), and +2 Day (0.137 ±
0.056 µg/dL) (Figure 31).
0
50
100
150
200
250
1 2 3 4 5
SIg
A S
ecr
eti
on
Ra
te (
µg
/min
)
SIgA Secretion Rate
CWI
CONTROL
BASE PRE POST +1 DAY +2 DAY
†
‡
Figure 30: Salivary IgA secretion rate over time between cooled subjects and control
subjects. † indicates significantly greater values compared to baseline, post, and +2 day
time points. ‡ indicates significantly greater values compared to baseline and post time
points.

51
Blood: No significant interaction (Time X Group) occurred for CORT (p=0.35).
However, a significant (p<0.001) main effect of time occurred where CORT was significantly
elevated post-race compared to baseline values (586 ± 242 nmol/L vs. 99 ± 58 nmol/L; p<0.001).
CORT returned to baseline values by the +1Day time point (90 ± 35 nmol/L), with continued
normal levels at the +2 day time point (87 ± 40 nmol/L) (Figure 32).
0
0.5
1
1.5
2
2.5
3
3.5
Co
rtis
ol (
µg
/mL)
Concentration of Cortisol (Saliva)
CWI
CONTROL
BASE PRE POST +1 DAY +2 DAY
¶
#
Figure 31: Concentration of salivary cortisol over time between cooled subjects and
control subjects. ¶ indicates significantly greater values from all other time points. #
indicates significantly greater values compared to baseline, +1 day and +2 day time
points.

52
No significant interaction (Time X Group) occurred for CK (p=0.63). However, a
significant main effect of time (p<0.001) and significant main effect of group (1802 ± 1848 IU/L
vs. 1312 ± 1384 IU/L; p=0.03) were observed. CK was significantly elevated post-race
compared to the baseline value (1980 ± 1793 IU/L vs. 235 ± 186 IU/L; p<0.001), and remained
significantly elevated through the +2Day time point (1358 ± 896 IU/L; p<0.001), with values
peaking 1 Day post-race (2619 ± 1827 IU/L; p<0.001) (Figure 33).
0
100
200
300
400
500
600
700
800
900
1 2 3 4
Co
rtis
ol (
nm
ol/
L)
Concentration of Cortisol (blood)
CWI
CONTROL
BASE POST +1 DAY + 2 DAY
†
Figure 32: Concentration of cortisol over time between cooled subjects and control
subjects. † indicates a significant difference from baseline values.

53
There was a significant interaction (Time X Group) for MYO (p=0.32); however, post-
hoc testing revealed no significant differences between groups at any time point. A significant
(p<0.001) main effect of time was observed for MYO, with values peaking post-race (755 ± 373
nmol/L). MYO remained significantly elevated 1 Day post-race (192 ± 177 nmol/L) and
returned to pre-race levels (26 ± 19 nmol/L) 2 Days post-race (54 ± 59 nmol/L) (Figure 34).
0
500
1000
1500
2000
2500
3000
3500
4000
4500
5000
1 2 3 4
Cre
ati
ne
Kin
ase
(IU
/L)
Concentration of Creatine Kinase
CWI
CONTROL
BASE POST +1 DAY + 2 DAY
† †
†
‡
Figure 33: Concentration of creatine kinase over time between cooled subjects and
control subjects. † indicates significantly different from baseline values. ‡ indicates
significantly different from the +2 Day time point.

54
No significant interaction (Time X Group) occurred for DOMS (p=0.89); however, a
significant main effect for time was observed (p<0.001). DOMS peaked post-race (61 ± 23) and
was significantly higher compared to pre-race values (13 ± 16). DOMS remained significantly
elevated at the +1 Day (46 ± 24) and +2 Day (38 ± 26) time points compared to baseline,
however were significantly lower than post-race values.
DISCUSSION
The purpose of this study was to (1) assess the physiological and immunological changes
following an Ironman triathlon; (2) track the physiological and immunological changes through
two days of recovery; and (3) determine if cold water immersion immediately following an
ironman triathlon attenuates these responses. Ultra-endurance exercise such as an Ironman
triathlon is inherent of acute responses involving hydration status, core body temperature, stress,
0
200
400
600
800
1000
1200
1400
1 2 3 4
My
og
lob
in (
nm
ol/
L)
Concentration of Myoglobin
CWI
CONTROL
BASE POST +1 DAY + 2 DAY
¶
#
Figure 34: Concentration of myoglobin over time between cooled subjects and control
subjects. ¶ indicates significantly greater values than all other time points. # indicates
significantly greater values than the baseline and the +2 Day time points.

55
immune, and physiological variability. Previous research has shown that such events can cause
extreme rises in the systemic stress and inflammatory responses45,46,72
, a large degree of muscle
damage45,46
, and fluctuations in core body temperature and cell volume27,29,30,33-37
. Recently, the
effect of ultra-endurance exercise on the innate immune system has been of interest2-4
, however
these responses have yet to be studied in the Ironman population.
Hydration status during physical activity is of primary importance not only for health and
safety but also for optimal performance. Dehydration often plagues athletes who participate in
high intensity exercise in the heat, and in extreme cases can predispose those individuals to
exertional heat illness. In an Ironman triathlon athletes are also at risk for dehydration, but due
to the long duration and relatively low intensity of the activity, they are also at risk for
hyponatremia.
Several studies have been published (both laboratory and field) showing a clear
relationship between hydration status and core body temperature22,23,73-75
and hydration status and
exercise performance22-24
. Recently, other studies have tried to discount that aggressive
hydration strategies are not important during practical activities (as opposed to laboratory-based
exercise protocols) and do not significantly contribute to hyperthermia or general exercise
performance. Many of these studies have been completed on Ironman athletes27,29,33-37
, with
highly variable degrees of %BML, core body temperature, and ambient temperature. In the
present study, average %BML was -3.49 ± 2.29% with a range of +1.98 to -7.77% (Figure 1).
While the large range of body mass change was not surprising, overall the %BML was higher
than anticipated and higher than previous reports.
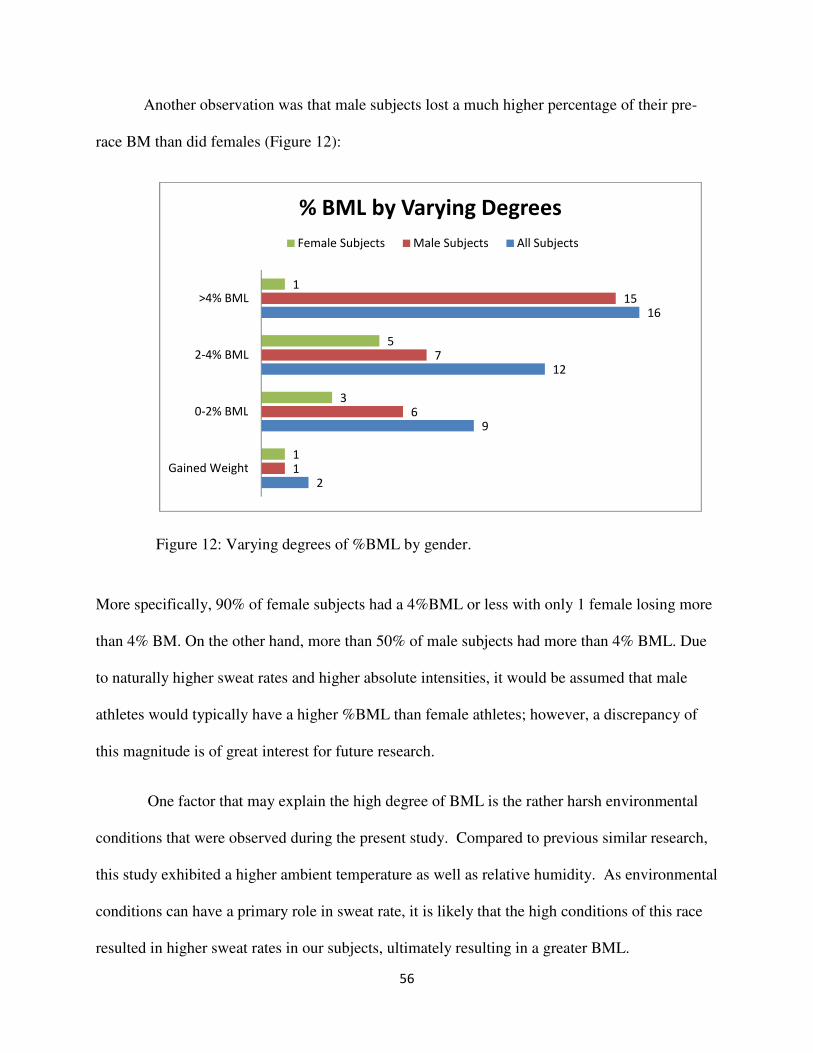
56
Another observation was that male subjects lost a much higher percentage of their pre-
race BM than did females (Figure 12):
More specifically, 90% of female subjects had a 4%BML or less with only 1 female losing more
than 4% BM. On the other hand, more than 50% of male subjects had more than 4% BML. Due
to naturally higher sweat rates and higher absolute intensities, it would be assumed that male
athletes would typically have a higher %BML than female athletes; however, a discrepancy of
this magnitude is of great interest for future research.
One factor that may explain the high degree of BML is the rather harsh environmental
conditions that were observed during the present study. Compared to previous similar research,
this study exhibited a higher ambient temperature as well as relative humidity. As environmental
conditions can have a primary role in sweat rate, it is likely that the high conditions of this race
resulted in higher sweat rates in our subjects, ultimately resulting in a greater BML.
2
9
12
16
1
6
7
15
1
3
5
1
Gained Weight
0-2% BML
2-4% BML
>4% BML
% BML by Varying Degrees
Female Subjects Male Subjects All Subjects
Figure 12: Varying degrees of %BML by gender.

57
Additionally, this race was the Ironman World Championships in which the most elite
competitors were present. Therefore, it is possible that the large BML of our subjects were due
to comparatively higher exercise intensities than those of previous studies.
Given the multiple variables that contribute to rate and overall amount of BML, it is
important for athletes to have individualized hydration plans. One effective way to do this is to
calculate individual sweat rate to estimate the total water loss during a given exercise bout. Key
factors to consider in this calculation are the type of exercise (i.e. bike vs. run), exercise time,
exercise duration, exercise intensity, environmental conditions, and fluid consumed during the
exercise bout. This method may assist athletes in maintaining a state of euhydration, limiting
adverse physiological effects of both dehydration and hyperhydration, and ultimately improving
exercise performance.
Studying the effect that exercise has on the immune system has gained much attention
over the past 20 years, both with research interest and practical implications. A non-invasive and
relatively simple method to assess immune function is through salivary analysis, specifically
through SIgA, Sαam, and Scort. While SIgA is the primary protective mechanism against URTI
in the oral cavity, analysis of Sαam and Scort are also of interest as they provide representation
of the systemic stress response throughout the body. Just as stress has been shown to affect the
concentration of SIgA7,10-12
, other variables such as hydration status13-15
, intensity and duration of
exercise2-4,12,18-21
, and recent food and fluid intake9,10
can greatly affect the concentration of
SIgA. With regards to exercise, it can generally be stated that an acute bout of high intensity
exercise will increase SIgA concentration (and therefore acutely improve salivary immunity),
while an acute bout of long duration activity will decrease the concentration of SIgA. Given this,
it was anticipated that SIgA would decrease significantly after completion of the race.
58
As previously mentioned, any stimulus inducing a stress response can affect not only the
concentration of proteins in the saliva, but also the flow rate of the saliva into the oral cavity.
Therefore, as exercise is a form of stress, salivary flow rate must be considered when studying
the concentration of SIgA in the saliva. Accompanying measurements of Scort and Sαam are
helpful in providing information on the stress response. Will responses of Scort and Sαam are
considerably variable in the present literature, it appears as though the primary influence of both
variables is the degree of sympathetic nerve activity11
. Moreover, Scort has been shown to
similarly mirror cortisol levels found in the blood, while Sαam appears to be more variable. In
the present study, SIgA concentration was highest immediately prior to the race, with a non-
significant decrease immediately following the race (Figure 4). However, when considering
salivary flow rate and presenting SIgA as a secretion rate, there was a significant decrease in
SIgA secretion rate from pre to post-race. This value returned to pre-race levels by +1DAY.
However, it is important to note that while the POST time point exhibited lower values than
PRE, there were no differences between BASE and POST (Figure 7).
Largely these data are consistent with previous reports2-4,19
. Nieman2,3
, Pacque19
, and
Peters4 all showed SIgA secretion rate to be significantly lower after an ultraendurance exercise
bout compared to pre-race values. Moreover, Nieman2,3
also found absolute concentration of
SIgA to be unaffected (absolute concentration of SIgA was not reported in the other studies4,19
).
While the Nieman studies2,3
only considered pre and post-race values, additional monitoring by
Pacque19
and Peters4 further supported our results. More specifically, Pacque also found SIgA
secretion rate to be higher immediately prior to the race compared to a baseline measurement.
Additionally, it was reported that the decreased SIgA secretion rate post-race did not return to
pre-race values when measured the morning after the race (however was similar to baseline
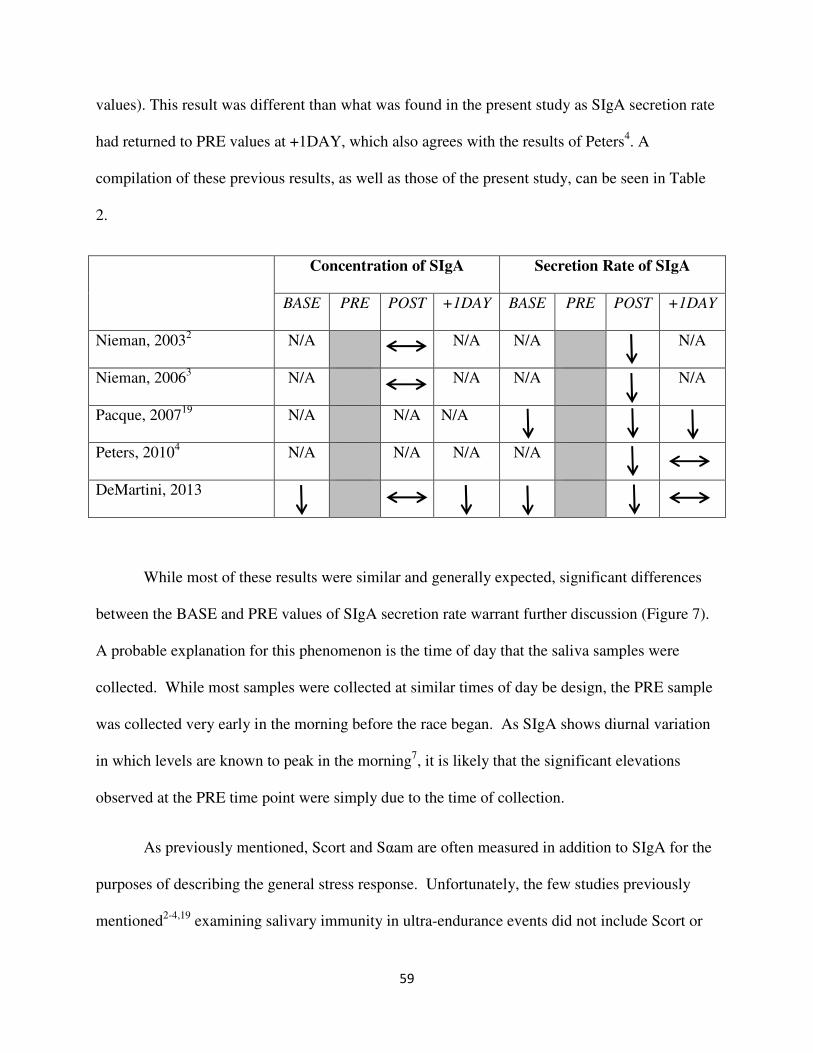
59
values). This result was different than what was found in the present study as SIgA secretion rate
had returned to PRE values at +1DAY, which also agrees with the results of Peters4. A
compilation of these previous results, as well as those of the present study, can be seen in Table
2.
Concentration of SIgA Secretion Rate of SIgA
BASE PRE POST +1DAY BASE PRE POST +1DAY
Nieman, 20032 N/A N/A N/A N/A
Nieman, 20063 N/A N/A N/A N/A
Pacque, 200719
N/A N/A N/A
Peters, 20104 N/A N/A N/A N/A
DeMartini, 2013
While most of these results were similar and generally expected, significant differences
between the BASE and PRE values of SIgA secretion rate warrant further discussion (Figure 7).
A probable explanation for this phenomenon is the time of day that the saliva samples were
collected. While most samples were collected at similar times of day be design, the PRE sample
was collected very early in the morning before the race began. As SIgA shows diurnal variation
in which levels are known to peak in the morning7, it is likely that the significant elevations
observed at the PRE time point were simply due to the time of collection.
As previously mentioned, Scort and Sαam are often measured in addition to SIgA for the
purposes of describing the general stress response. Unfortunately, the few studies previously
mentioned2-4,19
examining salivary immunity in ultra-endurance events did not include Scort or

60
Sαam in their analyses. In our study, we found Scort to mirror those levels of cortisol measured
in the blood (Figures 8 and 9). More specifically, Scort was significantly elevated immediately
following the race but returned to baseline levels by +1DAY (Figure 8). In addition, we were
able to have an additional data point for Scort (PRE). This was important because Scort was
found to be significantly elevated immediately prior to the race when compared to all other time
points, except for POST which showed further significant elevations (Figure 8). These results
were not surprising, and the significant increase observed at PRE was likely due to the time of
collection, as well as possible influence from the anticipatory response to beginning the race.
While Scort and Sαam have not been studied in the ultra-endurance population, general
stress has been shown to increase saliva protein concentration including Sαam activity8. Two
studies12,76
involving high intensity exercise have shown that the exercise-induced stress resulted
in significantly higher secretion rates of Sαam post-exercise, with Walsh76
reporting that those
effects remained up to 5-hours post-exercise. Interestingly, Sαam activity was not significantly
different, further highlighting the importance of considering salivary flow rate when examining
salivary proteins. With regards to the present study, we found no significant difference at any
time point for secretion rate of Sαam.
The exhaustive nature of the Ironman triathlon led to an expected increased systemic
stress response. Exercise induced changes in cortisol are known to affect the immune system72
,
with exercise serving as a model of temporary immunosuppression that occurs after severe
physical stress. Many factors are associated with this exercise-stress model that can cause
interactions between the nervous, endocrine, and immune systems. As plasma concentrations of
cortisol increase only in relation to exercise of long duration, the Ironman triathlon serves as a
main avenue for extreme elevations. In our study, CORT was significantly elevated post-race

61
compared to baseline values (586 ± 242 nmol/L vs. 99 ± 58 nmol/L; p<0.001) and returned to
baseline values by the +1Day time point (Figure 9). This data suggests that the race provided a
stress response capable of producing a system stress response. Similar to a previous report46
,
despite the dramatic increase in CORT post-race, the body was able to recover within one day
after the event.
In addition to the heightened metabolic and hormonal responses, structural damage to
muscle tissue was also evident. In addition to increases in cortisol, levels of muscle damage as
measured by CK and MYO were substantially elevated (Figures 10 and 11, respectively). As the
Ironman triathlon involves a large inherent degree of mechanical stress and damage, especially in
the run portion of the race, it was expected to observe large increases in muscle damage markers
immediately following the race. This hypothesis is consistent with three prior studies that
examined muscle damage following an Ironman triathlon45,46
. In these studies, it was consistently
shown that both CK and MYO were significantly elevated following the triathlon. It was also
consistently shown that while MYO peaked immediately post-race, CK values continued to rise
and ultimately peaked 1 day following the race. While monitoring time during recovery was
variable in each study, both CK and MYO was reported to remain significantly elevated
compared to pre-race values during the days following the race.
Muscle damage results from the present study closely mirrored those found previously.
More specifically, both CK and MYO concentrations were significantly elevated POST
compared to BASE, with further rises occurring in CK at +1 DAY (Figures 10 and 11).
However, while trends of varying levels were similar, our results revealed that concentrations of
both CK and MYO were lower than those that were previously reported. Additionally, while
previous studies have shown both CK and MYO to remain significantly elevated up to 19 days

62
post-race, our results showed that MYO returned to baseline values just 2 days post-race (Figure
11).
Comparatively, these results highlight two important inferences. First, while published
data in this population is scarce, it appears that competing in an Ironman triathlon results in a
generalized muscle damage response with respect to time course of damage and associated
recovery. Second, while timing trends appear to be consistent, there is likely great variability in
the degree of muscle damage endured, as well as rapidity of recovery in the days following the
event. This variability is assumingly dependent on individual characteristics such as fitness level,
training level, age, gender, etc., as well as potential variability in course layout which may
involve differences in biomechanics such as increased requirement of eccentric muscle
contraction. While these suggestions are primarily hypothetical, one factor that may be supported
is that the current study involved the Ironman World Championship race, therefore participants
were elite and potentially superior in fitness and training level than those of previous studies.
This could be key in explaining the lower concentrations of both CK and MYO in the present
study, as well as potentially explaining the seemingly faster recovery with respect to MYO.
In addition to biochemical analysis of circulating markers of muscle damage,
measurements of perceived soreness and pain are often used to describe symptomatic responses
to muscle damage. A popular means of doing this is through the Delayed Onset Muscle
Soreness (DOMS) visual analogue scale. In the present study, DOMS was found to peak POST
and remain significantly elevated from pre-race values through 2 days following the race. This
again was similar to previous research involving ultra-endurance exercise, where both DOMS
and muscle pain were collectively found to be highest both immediately post and 1 day
following the event.

63
As previously mentioned, muscle damage, stress, and immune responses are inherent of
many athletic events, especially those that are high in intensity and/or duration. In addition to
the perceived side effects, activities of daily living and subsequent training may also be affected.
Therefore, methods to attenuate these adverse effects are often implemented. One method to do
this is through cold water immersion, and its benefits theoretically occur through several
mechanisms. First, the cold water has the ability to mitigate the heightened metabolic rate at the
muscle and tissue. Second, the water itself has a hydrostatic effect that allows for a faster return
of central blood volume and subsequent restoration of cardiovascular functioning. Enhancing
recovery via cold water immersion has long been used as a recovery tool in many athletic
settings, however few reports are given with its use in the Ironman population.
With the exception of core body temperature and heart rate during the intervention (CWI
vs. control), we found no effect of cold water immersion on any variable. While the effect of
CWI on general exercise recovery is controversial, it is quite likely that the nature of the Ironman
triathlon is simply so extreme that a single bout of CWI is unable to promote any measureable
effects on recovery. Additionally, as subjects only exhibited moderate degrees of hyperthermia,
multiple bouts (or one of longer duration) of CWI were not possible. However, multiple bouts of
warm water immersion may be considered. While this would not allow for the attenuation of
metabolic effects seen with CWI, it would allow for potential heightened effects of the
hydrostatic pressure. Theoretically, this could have a positive effect on the markers of muscle
damage as it could promote a faster healing response at the tissue level.

64
CONCLUSIONS
The unique cohort of athletes provided ample opportunity to study the physiological,
biomechanical, and immune effects resulting from an acute bout of ultra-endurance exercise.
Our results paralleled the few similar previous reports in that an Ironman triathlon results in
moderate levels of hyperthermia and dehydration, as well as elevated systemic stress, muscle
damage, and salivary immunity responses. However, we showed that most of these elevations
returned to normal by 2 days following the race. Furthermore, we found no effect of cold water
immersion on the attenuation of these responses.
From a practical standpoint, these results can be extremely beneficial to the ultra-
endurance athlete as they greatly affect the recovery process following an acute bout of exercise
as well as potentially limit future training and activities of daily living. Additionally, emphasis
should be paid to recovery strategies that may attenuate the physical, biomechanical and
immunological damage following a race, as well as during training sessions. Future research
should focus on examining the effect of multiple bouts of cold water immersion following a
triathlon, as well as alternative recovery strategies. Additionally, tracking these athletes
throughout their competitive season on a regular basis is of great interest.
Limitations
Given the nature of this event, certain limitations were inherent throughout data
collection. First, given that this was a field study, not all confounding variables (i.e.
environmental conditions, nutritional intake, etc.) could have been controlled. Additionally,
while blood draws and saliva samples were intended to be collected at similar times of day
across testing days, the collection times immediately before and after the race could not be

65
controlled for both across days and between subjects. Therefore, diurnal variation may have
affected some samples. Finally, we were only able to track the athletes for 2 days following the
race. If we were able to monitor them for a longer period of time during their recovery, we may
have seen significant results through that extended period.
References
1. Gleeson M, Bishop N, Oliveira M, et al. Respiratory infection risk in athletes: association
with antigen-stimulated IL-10 production and salivary IgA secretion. Scand J Med Sci
Sports. 2011; [Epub ahead of print].
2. Nieman DC, Dumke CI, Henson DA, et al. Immune and oxidative changes during and
following the western states endurance run. Int J Sports Med. 2003;24(7):541-7.
3. Niemen DC, Henson DA, Dumke CL, et al. Relationship between salivary IgA secretion
and upper respiratory tract infection following a 160-km race. J Sports Med Phys Fitness.
2006;46:158-62.
4. Peters EM, Shaik J, Kleinveldt N. Upper respiratory tract infection symptoms in
ultramarathon runners not related to immunoglobulin status. Clin J Sport Med.
2010;20(1):39-46.
5. Gleeson M. Mucosal immune responses and risk of respiratory illness in elite athletes.
Exerc Immunol Rev. 2000;6:5-42.
6. Neville V, Gleeson M, and Folland JP. Salivary IgA as a risk factor for upper respiratory
infections in elite professional athletes. Med Sci Sports Exerc. 2008; 1228-1236.
7. Walsh NP, Gleeson M, Shephard RJ, et al. Position Statement Part One: Immune
Function and Exercise. 2011:6-63.

66
8. Bosch JA. Stress and Secretory Immunity. International Review of Neurobiology.
2002;52:213-53.
9. Proctor GB and Carpenter GH. Chewing stimulates secretion of human salivary secretory
immunoglobulin A. J Dent Res. 2001;80(3):909-13.
10. Bishop NC and Gleeson M. Acute and chronic effects of exercise on markers of mucosal
immunity. Frontiers in Bioscience. 2009;14:4444-4456.
11. Li TL and Gleeson M. The effects of carbohydrate supplementation during repeated
bouts of prolonged exercise on saliva flow rate and immunoglobin A. Journal of Sports
Sciences. 2005;23(7):713-722.
12. Allgrove JE. Effects of exercise intensity on salivary antimicrobial proteins and markers
of stress in active men. Journal of Sports Sciences. 2008;26(6):653-61.
13. Walsh NP, Laing SJ, Oliver SJ, et al. Saliva parameters as potential indices of hydration
status during acute dehydration. Med Sci Sports Exerc. 2004;36(9):1535-42.
14. Oliver SJ, Laing SJ, Wilson S, et al. Salivary immunoglobulin A response at rest and
after exercise following a 48 h period of fluid and/or energy restriction. British Journal of
Nutrition. 2007;97:1109-1116.
15. Fortes MB, Diment BC, DiFelice U, Walsh NP. Dehydration decreases saliva
antimicrobial proteins important for mucosal immunity. Appl Physiol Nutr Metab.
2012;37: 850-859.
16. Walsh NP, Bishop NC, Blackwell J, et al. Salivary IgA response to prolonged exercise in
a cold environment in trained cyclists. Med Sci Sports Exerc. 2002; 1632-1637.
17. Kimura K, Ozeki M, Juneja LR, et al. L-Theanine reduces psychological and
physiological stress response. Biol Psychol. 2007;74(1):39-45.

67
18. Blannin AK. The effect of exercising to exhaustion at different intensities on saliva
immunoglobulin A, protein and electrolyte secretion. International Journal of Sports
Medicine. 1998;19(8):547-52.
19. Pacque PFJ. The effect of an ultra-endurance running race on mucosal and humoral
immune function. Journal of Sports Medicine and Physical Fitness. 2007;47(4):496-501.
20. Gleeson M and Pyne DB. Exercise effects on mucosal immunity. Immunology and Cell
Biology. 2000;78:536-544.
21. Akimoto T, Kumai Y, Akama T, et al. Effects of 12 months of exercise training on
salivary secretory IgA levels in elderly subjects. Br J Sports Med. 2003;37:76-79.
22. Lopez RM, Casa DJ, Jensen KA, et al. Examining the influence of hydration status on
physiological responses and running speed during trail running in the heat with controlled
exercise intensity. J Strength Cond Resear. 2011;25(11):2944-2954.
23. Casa DJ, Stearns RL, Lopez RM et al. Influence of hydration on physiological function
and performance during trail running in the heat. J Athl Train. 2010;45(2):147-156.
24. Stearns RL, Casa DJ, Lopez RM, et al. Influence of hydration status on pacing during
trail running in the heat. J Strength Cond Res. 2009;23(9):2533-2541.
25. Rehrer NJ. Fluid and electrolyte balance in ultra-endurance sport. Sports Med.
2001;31(10):701-715.
26. Kimber NE, Ross JJ, Mason SL, Speedy DB. Energy balance during an Ironman triathlon
in male and female triathletes. Int J Sport Nutr Exer Met. 2002;12:47-62.
27. Hew-Butler T, Collins M, Bosch A, et al. Maintenance of plasma volume and serum
sodium concentration despite body weight loss in Ironman triathletes. Clin J Sport Med.
2007;17:116-122.

68
28. Jeukendrup AE, Roy J, Moseley L. Nutritional considerations in triathlon. Sports Med.
2005;35(2):163-181.
29. Speedy DB, Noakes TD, Kimber NE, et al. Fluid balance during and after an Ironman
triathlon. Clin J Sports Med. 2001;11:44-50.
30. Rogers G, Goodman C, Rosen C. Water budget during ultra-endurance exercise. Med Sci
Sports Exerc. 1997;29:1477-1481.
31. Jeukendrup AE, Moseley L, Gareth I, et al. Exogenous carbohydrate oxidation during
ultraendurance exercise. J Appl Physiol. 2006;100:1134-1141.
32. Coffee VG and Hawley JA. The molecular bases of training adaptation. Sports Med.
2007;37(9):737-763.
33. Pahnke MD, Trinity JD, Zachwieja JJ, et al. Serum sodium concentration changes are
related to fluid balance and sweat sodium loss. Med Sci Sport Exerc. 2010;42(9):1669-74.
34. Sharwood K, Collins M, Goedecke, et al. Weight changes, sodium levels, and
performance in the South African Ironman triathlon. Clin J Sports Med. 2002;12:391-
399.
35. Laursen PB, Suriano R, Quod JM, et al. Core temperature and hydration status during an
Ironman triathlon. Br J Sports Med. 2006;40:320-325.
36. Knechtle B, Wirth A, Baumann B, et al. An Ironman triathlon does not lead to a change
in body mass in female triathletes. Res Sports Med. 2010;18:115-126.
37. Knechtle B, Knechtle P, Rosemann T, Oliver S. A triple iron triathlon leads to a decrease
in total body mass but not to dehydration. Res Quart Exerc Sport. 2010;81(3):319-327.
38. Frederick EC. Hot times. Running. 1983;9:51-3.

69
39. Maughan RJ. Distance running in hot environments: a thermal challenge to the elite
runner. Scand J Med Sports. 2010:20(Suppl.3):95-102.
40. DeMartini JK, Casa DJ, Belval L, et al. Relationship of the occurrence of exertional
heatstroke and environmental conditions at the Falmouth road race. Journ Athl Train.
2013; (In Review).
41. Sawka MN, Latzka WA, Pandolf KB. Temperature regulation during upper body
exercise: able-bodied and spinal cord injured. Med Sci Sports Exerc.
1989;21(Suppl):S132-40.
42. Marino FE. Anticipatory regulation and avoidance of catastrophe during exercise-induced
hyperthermia. Comp Biochem Physiol. 2004;139:561-569.
43. Marino FE. The critical limiting temperature and selective brain cooling: neuroprotection
during exercise? Int J Hyperthermia. 2001;27(6):582-590.
44. Tucker R and Noakes TD. The anticipatory regulation of performance: The physiological
basis for pacing strategies and the development of a perception-based model for exercise
performance. Br J Sports Med. 2009;43(6):e1.
45. Suzuki H, Peake J, Nosaka K, et al. Changes in markers of muscle damage, inflammation
and HSP70 after an Ironman triathlon race. Eur J Appl Physiol. 2006;98:525-534.
46. Neubauer O, Konig D, Wagner KH. Recovery after an Ironman triathlon: sustained
inflammatory responses and muscular stress. Eur J Appl Physiol. 2008;104:417-426.
47. Bleakly C, McDonough S, Gardner E, et al. Cold-water immersion (cryotherapy) for
preventing and treating muscle soreness after exercise. The Cochrane Collaboration.
2012.

70
48. Nieman DC, Dumke CL, Henson DA, et al. Muscle damage is linked to cytokine changes
following a 160-km race. Brain, Behavior, and Immunity. 2005;19:398-403.
49. Bailey DM, Erith SJ, Griffin PJ, et al. Influence of cold water immersion on indices of
muscle damage following prolonged intermittent shuttle running. Journ Sport Sci.
2007;25(11):1163-70.
50. Chatzinikolaou A, Fatouros IG, Gourgoulis V, et al. Time course of changes in
performance and inflammatory responses after acute plyometric exercise. Journ Strength
Cond Resear. 2010;24(5):1389-98.
51. Binkley HM, Beckett J, Casa DJ, Kleiner DM, Plummer PE. National Athletic Trainers’
position statement: exertional heat illnesses. J Athl Train. 2002;37(3):329-343.
52. Armstrong LE, Casa DJ, et al. American College of Sports Medicine Position Stand:
Exertional heat illnesses during training and competition. Med Sci Sports Exerc.
2007;39(3):556-572.
53. Casa DJ, Armstrong LE, Ganio MS, Yeargin S. Exertional heat stroke in competitive
athletes. Curr Sports Med Rep. 2005;4(6):309-317.
54. Casa DJ, Anderson JM, Armstrong LE, Maresh CM. Survival strategy: acute treatment of
exertional heat stroke. J Strength Cond Res. 2006;20(3):462.
55. Casa DJ, Guskiewicz KM, Anderson SA, et al. National Athletic Trainers’ Association
Position Statement: Preventing Sudden Death in Sports. J Athl Train. 2011;47(1):96-118.
56. Casa DJ, McDermott BP, Lee EC, et al. Cold water immersion: the gold standard for
exertional heatstroke treatment. Exerc Sport Sci Rev. 2007;35(3):141-149.
57. Casa DJ, Kenny GP, Taylor NA. Immersion treatment for exertional hyperthermia: cold
or temperate water? Med Sci Sports Exerc. 2010;42(7):1246-52.

71
58. Casa DJ, Armstrong LE, Kenny GP, et al. Exertional heat stroke: new concepts regarding
cause and care. Curr Sports Med Rep. 2012;11(3):115-23.
59. Lopez RM, Casa DJ, McDermott BP, Stearns RL, Armstrong LE, Maresh CM.
Exertional heat stroke in the athletic setting. Athletic Training and Sports Health Care.
2011;3(4):189-200.
60. Gagnon D, Lemire BB, Casa DJ, Kenny GP. Cold-water immersion and the treatment of
hyperthermia: using 38.6°C as a safe rectal temperature cooling limit.
61. Costrini A. Emergency treatment of exertional heatstroke and comparison of whole body
cooling techniques. Med Sci Sports Exerc. 1990;22(1):15-18.
62. Bleakley CM and Davison GW. What is the biochemical and physiological rationale for
using cold-water immersion in sports recovery? A systematic review. Br J Sports Med.
2010;44:179-187.
63. Clements JM, Casa DJ, Knight JC, et al. Ice-water immersion and cold-water immersion
provide similar cooling rates in runners with exercise-induced hyperthermia. J Athl Train.
2002;37(2):146-150.
64. Proulx CI, Ducharme MB, Kenny GP. Effect of water temperature on cooling efficiency
during hyperthermia in humans. J Appl Physiol. 2003;94:1317-1323.
65. Shepard RJ and Shek PN. Immune dysfunction as a factor in heat illness. Crit Rev
Immunol. 1999;19:285-302.
66. Lim CL and Mackinnon LT. The roles of exercise-induced immune system disturbances
in the pathology of heat stroke: the dual pathway model of heat stroke. Sports Med.2006;
36:39-64.

72
67. Walsh NP, Gleeson M, Pyne DB, et al. Position Statement. Part Two: Maintaining
immune health. Exerc Immunol Rev. 2011;17:64-103.
68. Brenner IK, Castellani JW, Gabaree C, et al. Immune changes in humans during cold
exposure: effects of prior heating and exercise. J Appl Physiol. 1999;87:699-710.
69. Lackovic V, Borecky L, Vigas M, Rovensky J. Activation of NK cells in subjects
exposed to mild hyper- or hypothermic load. J Interferon Res. 1988;8:393-402.
70. Costa RJ, Smith AH, Oliver SJ, et al. The effects of two nights of sleep deprivation with
or without energy restriction on immune indices at rest and in response to cold exposure.
Eur J Appl Physiol. 2010;109:417-428.
71. Wenisch C, Narzt E, Sessler DI, et al. Mild intraoperative hypothermia reduces
production of reactive oxygen intermediates by polymorphonuclear leukocytes. Anesth
Analg. 1996;82:810-816.
72. Pedersen BK and Hoffman-Goetz L. Exercise and the immune system: regulation,
integration, and adaptation. Physiological Reviews. 2000;80(3):1056-1073.
73. Sawka MN, Toner MM, Francesconi RP, Pandolf KB. Hypohydration and exercise:
effects of heat acclimation, gender, and environment. J Appl Physiol. 1983;55(4):1147-
53.
74. Sawka MN, Latzka WA, Matott RP, Montain SJ. Hydration effects on temperature
regulation. Int J Sports Med. 1998;19:S108-S110.
75. Montain SJ, Sawka MN, Latzka WA, Valeri CR. Thermal and cardiovascular strain from
hypohydration: influence of exercise intensity. Int J Sports Med. 1998;19:87-91.
76. Walsh NP, Blannin AK, Clark AM, et al. The effects of high-intensity intermittent
exercise on saliva IgA, total protein and α-amylase. J Sport Sci. 1999;17:129-134.

73