
Changes in Family Wealth, 1989 to 2013
29
Congressional Budget Office Changes in Family Wealth, 1989 to 2013 Savings and Retirement Foundation Washington, D.C. January 18, 2017 Nadia Karamcheva Microeconomic Studies Division The information in this presentation is drawn from Trends in Family Wealth, 1989 to 2013 (Congressional Budget Office, August 2016), www.cbo.gov/publication/51846 .
-
Upload
congressional-budget-office -
Category
Government & Nonprofit
-
view
1.470 -
download
0
Transcript of Changes in Family Wealth, 1989 to 2013

Congressional Budget Office
Changes in Family Wealth, 1989 to 2013
Savings and Retirement FoundationWashington, D.C.
January 18, 2017
Nadia KaramchevaMicroeconomic Studies Division
The information in this presentation is drawn from Trends in Family Wealth, 1989 to 2013 (Congressional Budget Office, August 2016), www.cbo.gov/publication/51846.
1CO N GR ES S IO N A L B UDGE T O F F IC E
Research Questions
■ How is family wealth distributed?
■ How did the distribution of family wealth change from 1989 to 2013?
■ How did changes in families’ assets and debt contribute to changes in the wealth distribution from 1989 to 2013?

2CO N GR ES S IO N A L B UDGE T O F F IC E
Preview of Results
■ Family wealth in the United States is unevenly distributed. In 2013:– Families in the top 10 percent of the wealth distribution held 76 percent
of all family wealth,– Families in the 51st to the 90th percentiles held 23 percent, and– Families in the bottom half of the distribution held 1 percent.
■ Over the period from 1989 through 2013, family wealth grew at significantly different rates for different segments of the U.S. population. The distribution of wealth among the nation’s families was more unequal in 2013 than it had been in 1989.
■ In 2013, average wealth for families in the top half of the distribution was greater than it had been in 1989. The opposite was true for families in the bottom half.

3CO N GR ES S IO N A L B UDGE T O F F IC E
Data: Survey of Consumer Finances
■ This study uses data from the Survey of Consumer Finances (SCF), which:– Is conducted every three years;– Includes detailed information on family wealth, income, and pensions;
and– Covers nearly the full distribution of family wealth (but excludes the
nation’s 400 wealthiest people, as listed by Forbes magazine).
■ CBO supplemented the SCF with aggregate wealth data from Forbes.
■ The study uses the cross-sectional waves in the SCF from 1989 through 2013.
■ The unit of analysis is the family.

4CO N GR ES S IO N A L B UDGE T O F F IC E
Definition of Wealth
■ The measure of wealth in this study is marketable wealth—the difference between a family’s assets and its debt.– Assets consist of financial assets (including 401(k)-type plans and
IRAs), home equity, and other assets (such as real estate, vehicles, and business equity).
– Debt is nonmortgage debt, which consists of a family’s consumer debt (including credit card debt and auto loans) and other debt (including student loans).
– Mortgage debt is subtracted from the value of a family’s primary residence and is therefore accounted for in the family’s assets.
5CO N GR ES S IO N A L B UDGE T O F F IC E
Alternative Analytical Approaches and Measures of Wealth
■ Sources of data– SCF and the Forbes 400– Tax data
■ Ways to define wealth– Marketable wealth– Nonmarketable wealth

6CO N GR ES S IO N A L B UDGE T O F F IC E
Holdings of Family Wealth, by Wealth Group
Trillions of 2013 Dollars
1989 1992 1995 1998 2001 2004 2007 2010 20130
15
30
45
60
75
Top 10 Percent
51st to 90th Percentiles
Bottom 50 Percent

7CO N GR ES S IO N A L B UDGE T O F F IC E
Shares of Family Wealth, by Wealth Group
3 3 4 3 3 3 2 1 1
30 29 28 28 27 27 25 24 23
67 67 69 69 70 70 72 75 76
0
20
40
60
80
100
1989 1992 1995 1998 2001 2004 2007 2010 2013
Percent
Top 10 Percent
51st to 90thPercentilesBottom 50 Percent

8CO N GR ES S IO N A L B UDGE T O F F IC E
Wealth of Families at Selected Percentiles of the Wealth Distribution
Thousands of 2013 Dollars
1989 1992 1995 1998 2001 2004 2007 2010 20130
200
400
600
800
1,000
1,200
90th Percentile
75th Percentile
25th Percentile50th Percentile

9CO N GR ES S IO N A L B UDGE T O F F IC E
Average Wealth of Families in the Top 10 Percent of the Wealth Distribution
Thousands of 2013 Dollars
0
0.1
0.2
0.3
0.4
0.5
0.6
0.7
0.8
0.9
1
0
500
1,000
1,500
2,000
2,500
3,000
3,500
4,000
4,500
5,000
1989 1992 1995 1998 2001 2004 2007 2010 2013

10CO N GR ES S IO N A L B UDGE T O F F IC E
-5
0
5
10
15
20
25
30
35
40
45
50
55
-5
0
5
10
15
20
25
30
35
40
45
50
55
1989 1992 1995 1998 2001 2004 2007 2010 2013
Aggregate Wealth of Families in the Top 10 Percent of the Wealth Distribution (Excluding the Forbes 400)
Trillions of 2013 Dollars
Other Assets
Financial Assets
Home Equity
Nonmortgage Debt

11CO N GR ES S IO N A L B UDGE T O F F IC E
-500
0
500
1,000
1,500
2,000
2,500Home Equity Financial Assets Other assets Debt
Changes in the Assets and Debt of Families in the Top 10 Percent of the Wealth Distribution (Excluding the Forbes 400)
Thousands of 2013 Dollars
Home Equity Financial Assets Other Assets Nonmortgage DebtPercentage of Families That Hold Each Category of Asset or Debt
1989 2007 2013 1989 2007 2013 1989 2007 2013 1989 2007 2013
93 97 97 100 100 100 97 98 98 57 59 43
+101%-24%
+135%
+7%
+87%
-21%
-1% -9%

12CO N GR ES S IO N A L B UDGE T O F F IC E
Average Wealth of Families in the 51st to 90th Percentiles of the Wealth Distribution
Thousands of 2013 Dollars
1989 1992 1995 1998 2001 2004 2007 2010 20130
50
100
150
200
250
300
350
400
450

13CO N GR ES S IO N A L B UDGE T O F F IC E
-2
0
2
4
6
8
10
12
14
16
18
20
-2
0
2
4
6
8
10
12
14
16
18
20
1989 1992 1995 1998 2001 2004 2007 2010 2013
Aggregate Wealth of Families in the 51st to 90th Percentiles of the Wealth Distribution
Trillions of 2013 Dollars
Other Assets
Financial Assets
Home Equity
Nonmortgage Debt

14CO N GR ES S IO N A L B UDGE T O F F IC E
Changes in the Assets and Debt of Families in the 51st to 90th Percentiles of the Wealth Distribution
–31%+58%
Home Equity Other AssetsFinancial Assets Nonmortgage Debt
99 9910093 9194 97 9596 72 6272
-50
0
50
100
150
200
1989 2007 2013 1989 2007 2013 1989 2007 2013 1989 2007 2013
–8%
+98%
–19%+50%
0%–49%
Percentage of Families That Hold Each Category of Asset or Debt
Thousands of 2013 Dollars
15CO N GR ES S IO N A L B UDGE T O F F IC E
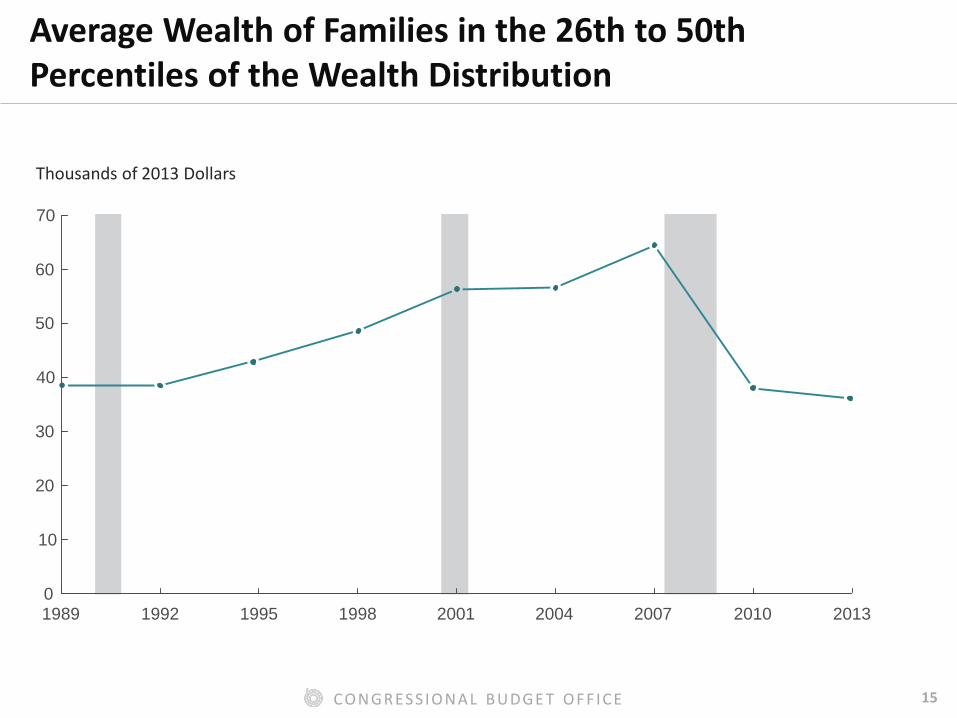
Average Wealth of Families in the 26th to 50th Percentiles of the Wealth Distribution
Thousands of 2013 Dollars
1989 1992 1995 1998 2001 2004 2007 2010 20130
10
20
30
40
50
60
70
16CO N GR ES S IO N A L B UDGE T O F F IC E
-1
0
1
1
2
2
3
-0.5
0.0
0.5
1.0
1.5
2.0
2.5
1989 1992 1995 1998 2001 2004 2007 2010 2013
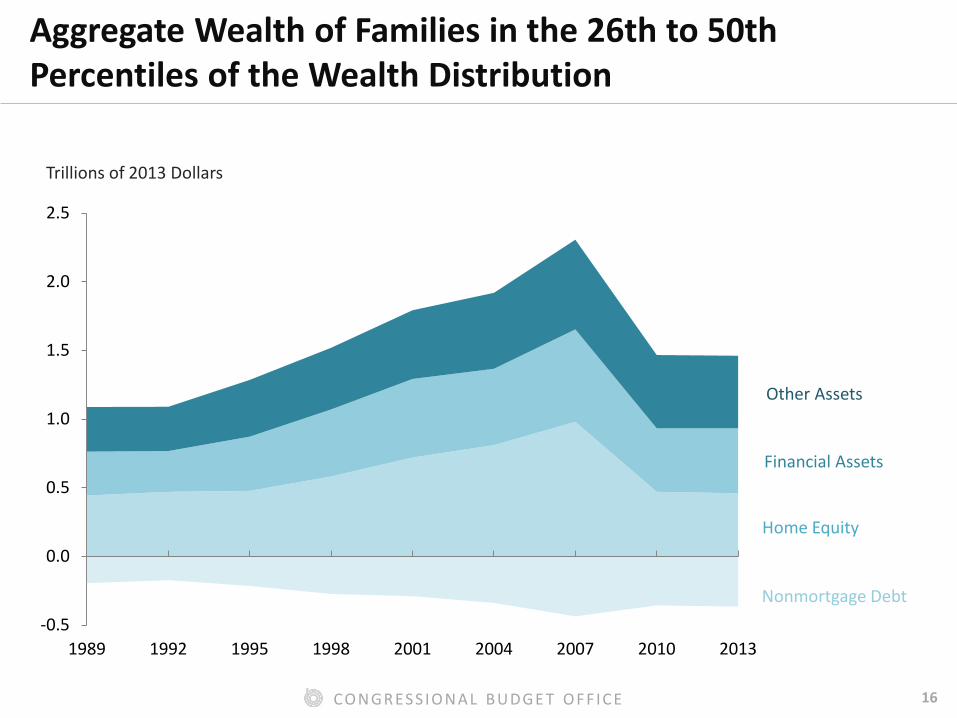
Aggregate Wealth of Families in the 26th to 50th Percentiles of the Wealth Distribution
Trillions of 2013 Dollars
Other Assets
Financial Assets
Home Equity
Nonmortgage Debt
17CO N GR ES S IO N A L B UDGE T O F F IC E
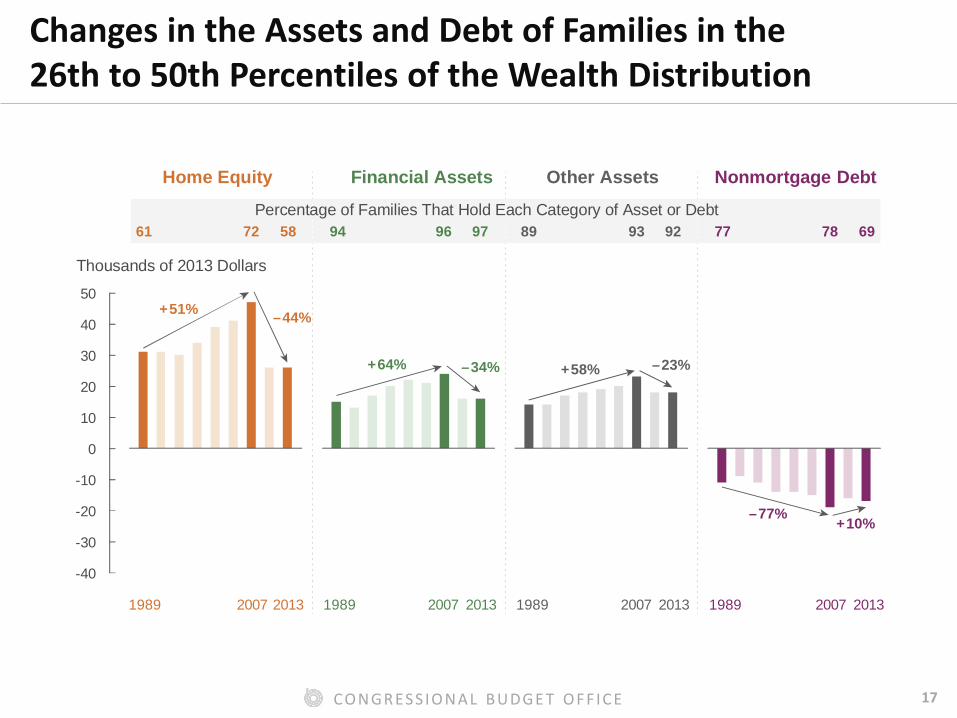
Changes in the Assets and Debt of Families in the 26th to 50th Percentiles of the Wealth Distribution
–44%+51%
Home Equity Other AssetsFinancial Assets Nonmortgage Debt
94 979661 5872 89 9293 77 6978
1989 2007 2013 1989 2007 2013 1989 2007 2013 1989 2007 2013
Percentage of Families That Hold Each Category of Asset or Debt
Thousands of 2013 Dollars
–34%+64% –23%+58%
+10%–77%
-40
-30
-20
-10
0
10
20
30
40
50

18CO N GR ES S IO N A L B UDGE T O F F IC E
Average Wealth of Families in the Bottom 25 Percent of the Wealth Distribution
Thousands of 2013 Dollars
1989 1992 1995 1998 2001 2004 2007 2010 2013-15
-10
-5
0
5
10
15

19CO N GR ES S IO N A L B UDGE T O F F IC E
-1.0
-0.8
-0.6
-0.4
-0.2
0.0
0.2
0.4
-1.0
-0.8
-0.6
-0.4
-0.2
0.0
0.2
0.4
1989 1992 1995 1998 2001 2004 2007 2010 2013
Aggregate Wealth of Families in the Bottom 25 Percent of the Wealth Distribution
Trillions of 2013 Dollars
Other Assets
Financial Assets
Home Equity
Nonmortgage Debt

20CO N GR ES S IO N A L B UDGE T O F F IC E
Changes in the Assets and Debt of Families in the Bottom 25 Percent of the Wealth Distribution
–247%+352%
Home Equity Other AssetsFinancial Assets Nonmortgage Debt
64 83809 1814 60 6770 61 6868
1989 2007 2013 1989 2007 2013 1989 2007 2013 1989 2007 2013
Percentage of Families That Hold Each Category of Asset or Debt
Thousands of 2013 Dollars
–7%+99%–5%+76%
–40%
–114%
-40
-30
-20
-10
0
10
20
30
40
50

21CO N GR ES S IO N A L B UDGE T O F F IC E
Share of Families in Debt and Average Indebtedness for Those Families
1989 1992 1995 1998 2001 2004 2007 2010 2013-50
-25
0–9
–20
–32
25
50
-20
-10
0
10
20
Average Indebtedness(Left axis)
Share of Families in Debt(Right axis)
7 8
12
Thousands of 2013 Dollars Percent

22CO N GR ES S IO N A L B UDGE T O F F IC E
Changes in Categories of Debt for Families in Debt
■ The increase in average indebtedness between 2007 and 2013 for families in debt was mainly the result of falling home equity and rising student loan debt.
2007 2013
Share of families in debt who had negative home equity (Percent) 3 19
Average home equity for families in debt who had negative home equity (2013 dollars) -$16,000 -$45,000
Share of families in debt who had outstanding student loans (Percent) 56 64
Average student loans for families in debt who had student loans (2013 dollars) $29,000 $41,000

23CO N GR ES S IO N A L B UDGE T O F F IC E
Age Distribution of Families in Debt and Families Not in Debt in 2013
44
29
20
7
18
2630
26
0
10
20
30
40
50
Younger Than 35 35 to 49 50 to 64 65 or Older
Percent Families In Debt
Families Not In Debt

24CO N GR ES S IO N A L B UDGE T O F F IC E
Education Distribution of Families in Debt and Families Not in Debt in 2013
8
26
34
21
1111
32
24
1914
0
10
20
30
40
50
Less Than High School High School Some College Bachelor's Degree Graduate Degree
PercentFamilies In Debt
Families Not In Debt

25CO N GR ES S IO N A L B UDGE T O F F IC E
Median Family Wealth, by Age Group
Thousands of 2013 Dollars
1989 1992 1995 1998 2001 2004 2007 2010 20130
50
100
150
200
250
300
65 or Older
50 to 64
Younger Than 35
35 to 49

26CO N GR ES S IO N A L B UDGE T O F F IC E
Median Family Wealth, by Education Group
Thousands of 2013 Dollars
Graduate Degree
Bachelor’s Degree
Less Than High School
High SchoolSome College
0
100
200
300
400
500
1989 1992 1995 1998 2001 2004 2007 2010 2013

27CO N GR ES S IO N A L B UDGE T O F F IC E
Effects of Aging and Increases in Educational Attainment on Family Wealth
■ The aging of the population and increases in educational attainment contributed to an increase in overall family wealth between 1989 and 2013.
■ CBO performed a counterfactual analysis, using a reweighting technique developed by John DiNardo and colleagues.– See John DiNardo, Nicole M. Fortin, and Thomas Lemieux, “Labor
Market Institutions and the Distribution of Wages, 1973–1992: A Semiparametric Approach,” Econometrica, vol. 64, no. 5 (September 1996), pp. 1001–1044, http://tinyurl.com/zyhcdbf.

28CO N GR ES S IO N A L B UDGE T O F F IC E
Effects of Aging and Increases in Educational Attainment on Family Wealth (Continued)
■ Had the population not aged as it did, median family wealth would have been 19 percent lower in 2013 than in 1989.– In 1989, 21 percent of families were headed by someone over the age
of 65; in 2013, 24 percent were.
■ Had the average educational attainment of families not increased as it did, median family wealth would have been 16 percent lower in 2013 than in 1989.– In 1989, 23 percent of families were headed by someone with at least a
bachelor’s degree; in 2013, 32 percent were.


![Astro-Vision Wealth Horoscope - Asianet News · Page - 1 Astro-Vision Wealth Horoscope [LS-AT 1.0.0.4] t]cv: Rahul Kumar enwKw: ]pcpj³ P\\ XobXn: 1 P\phcn, 1989 RmbÀ P\\ kabw (Hr.Min.Sec)](https://static.fdocuments.net/doc/165x107/5f9e396f6af5134b4801496c/astro-vision-wealth-horoscope-asianet-news-page-1-astro-vision-wealth-horoscope.jpg)


