‘Change to Win’ - Lifetime...
56
© Lifetime Reliability Solutions Change To Win Workbook LRS.CTW.0001 Rev 0 Page 1 ‘Change to Win’ 100 Day Change Management Program ‘Change To Win’ Team Workbook Lifetime Reliability Solutions www.lifetime-reliability.com
Transcript of ‘Change to Win’ - Lifetime...

© Lifetime Reliability Solutions Change To Win Workbook LRS.CTW.0001 Rev 0
Page 1
‘Change to Win’ 100 Day Change Management Program
‘Change To Win’ Team Workbook
Lifetime Reliability Solutions www.lifetime-reliability.com

© Lifetime Reliability Solutions Change To Win Workbook LRS.CTW.0001 Rev 0
Page 2
CONTENTS Change To Win Process
Workbook Purpose ....................................................................................................................... 4 Duration ........................................................................................................................................ 4 Outcomes ....................................................................................................................................... 4 The 5-Step Process ........................................................................................................................ 5 Components of the 5 Step ‘Change To Win’ Process .................................................................. 5 1. Step 1: Management Preparation and Project Scope Definition........................................ 6
1.1. Background.................................................................................................................... 6 1.2. Vision, Goals, Objectives ............................................................................................... 6 1.3. Justification.................................................................................................................... 6 1.4. Executive Support.......................................................................................................... 6 1.5. Preparation .................................................................................................................... 6 1.6. Choosing the ‘Change To Win’ Project ........................................................................ 8
1.6.1. Project Value Matrix ............................................................................................. 8 1.7. Scope of Project ........................................................................................................... 10 1.8. Implementation Team ................................................................................................. 10 1.9. Defining the Means to Measure Project Results......................................................... 10 1.10. Communication Plan ............................................................................................... 11 1.11. Communication Board ............................................................................................ 11 1.12. Managing the Process .............................................................................................. 12
1.12.1. Project Meetings .................................................................................................. 12 1.12.2. The Action Sheet .................................................................................................. 13 1.12.3. Implementation Team Roles................................................................................ 14 1.12.4. Team Rules........................................................................................................... 15 1.12.5. Project Plan and Schedule ................................................................................... 16
1.13. Step 1 Completion Checklist ................................................................................... 18 2. Step 2: Measure the size of Current State problems.......................................................... 19
2.1. Gathering Data ............................................................................................................ 19 2.2. Map Current Processes ............................................................................................... 20 2.3. Identify Associated Procedures and Work Instructions ............................................ 21
2.3.1. Managing the Data and Information .................................................................. 21 2.4. Identifying Current Problems ..................................................................................... 22
2.4.1. Changing Workplace ........................................................................................... 22 2.4.2. Business Databases............................................................................................... 22 2.4.3. Workplace Surveys .............................................................................................. 22 2.4.4. Pareto Charts ....................................................................................................... 23 2.4.5. Calculating Costs ................................................................................................. 25 2.4.6. Pin Mapping Problems ........................................................................................ 25 2.4.7. Changing Marketplace ........................................................................................ 25
2.5. Step 2 Completion Checklist ....................................................................................... 26 3. Step 3: Identify the best practices that prevent the problems ........................................... 27
3.1. Fix the Problems; or Change the Business Systems? ................................................. 27 3.2. Identifying New Standards.......................................................................................... 28
3.2.1. Using Affinity Diagrams ...................................................................................... 28 3.2.2. Using Interrelationship Digraphs ........................................................................ 29
3.3. Identify the Best Practices ........................................................................................... 30 3.4. Select the New Standard and its Authority................................................................. 30 3.5. Gap Analysis - Check New Standards Solve the Problems ........................................ 31 3.6. Purchase the Standards and Sources of Best Practice ............................................... 32

© Lifetime Reliability Solutions Change To Win Workbook LRS.CTW.0001 Rev 0
Page 3
3.7. Step 3 Completion Checklist ....................................................................................... 33 4. Step 4: Develop the Future State with new Best Practices................................................. 34
4.1. Develop the Route Map ............................................................................................... 34 4.2. Key Performance Indicators ....................................................................................... 35 4.3. Cost Benefit Analysis ................................................................................................... 36 4.4. Identify the Procedures to Update .............................................................................. 37 4.5. Draft ACE 3T Procedures ........................................................................................... 37 4.6. Imbedding the New Standards into Procedures ......................................................... 38 4.7. Management Presentation........................................................................................... 40
4.7.1. Reasons for A Presentation.................................................................................. 40 4.7.2. Good Presentation Content ................................................................................. 40 4.7.3. Typical Elements Of A Team Presentation......................................................... 41
4.8. Step 4 Completion Checklist ....................................................................................... 42 5. Step 5: Make Best Practices the Standard Operating Procedures in the Workplace ... 43 5.1. Implementation Plan ................................................................................................... 43 5.2. Training ....................................................................................................................... 44 5.3. Workplace Implementation......................................................................................... 44 5.4. Communicate the Changes.......................................................................................... 45 5.5. Tracking Results .......................................................................................................... 45 5.6. Replicate Changes Throughout the Business.............................................................. 46 5.7. Step 5 Completion Checklist ....................................................................................... 47
Appendix 1 – Sample ACE 3T Standard Operating Procedure................................................ 48 Flange Connection 3T Failure Prevention SOP with Tolerance Banding ............................ 48
Start With a Summary, End with the Facts ....................................................................... 51 List all Tools, Equipment and References .......................................................................... 51 Be Totally Complete (Don’t only write it, show it.)............................................................ 52 Be Simple, Be Exact (Clearly indicate every action, measure and timing) ....................... 52 Full Details Clearly Provided Step by Step ........................................................................ 52 Provide Regular Self-Testing For Certainty ...................................................................... 54 Set Tolerances of Acceptability........................................................................................... 54 Request Proof That Each Step is Done Correctly .............................................................. 55 Keep It a True Record of Current Best Practices .............................................................. 55 Keep Control of the Documents and Records .................................................................... 55 Keep the Master Copy Safe................................................................................................. 55

© Lifetime Reliability Solutions Change To Win Workbook LRS.CTW.0001 Rev 0
Page 4
Change To Win Process ‘Change To Win’ is a structured change management program used to introduce needed changes, best practices and innovative improvements into an organisation. A ‘Change To Win’ team consisting of managers, supervisors and people from the workplace is assembled to implement the changes and is responsible to plan how the organisation will adopt the changes, to trial them and then implement them into standard practice. The ‘Change To Win’ process is not used for problem solving, though it can be adapted to do so. It is a behaviour change process that improves business performance by introducing and integrating higher standards of performance into business processes. It is used to change the way things are done in an organisation by introducing better practices into the workplace. You would use the ‘Change To Win’ program to bring your industry’s, or other industry’s, best practices into your organisation. Examples are introducing TPM (Total Productive Maintenance) into Operations; introducing Lean Manufacturing into a manufacturer; introducing a new software system into a business; introducing an ISO9001 quality system into a company and introducing a 5S good workplace habits program into a factory or office. Workbook Purpose This workbook provides a structured method to introduce positive change and improvement into an organization in 100 days. It is a vehicle to set higher standards of performance and accomplishment, which encourages the people in the organization to: • plan how to reach them, • in the most sure and quickest ways possible, and • gains their ownership and commitment to implement them successfully, while • ensuring the improvements become standard operation practice. It draws together managers, supervisors, technical specialists and employees in teams dedicated to bringing better business practices and systems into the operation; it is a tool that lifts and stabilizes business performance at a higher level. Duration The ‘Change To Win’ takes 100 days, including management preparation, 3 preparation meetings, 10 implementation team meetings, workplace trail-and-learn and final implementation. The program is used repeatedly across an organisation, within and between departments, and along business processes, to create desired change and improvement. Outcomes • Imbed best practices into the organisation • Remove errors, mistakes and failures • Instill continuous improvement as normal
practice • Standardize work, performance and results • Agreement and commitment throughout the
operation
• Fast, on-the-job training • System-based methods that are person-
independent • Changes people’s beliefs by changing
people’s actions • Higher and more reliable business
performance

© Lifetime Reliability Solutions Change To Win Workbook LRS.CTW.0001 Rev 0
Page 5
The 5-Step Process
Components of the 5 Step ‘Change To Win’ Process Step 1: Agree on scope of problem or opportunity to be addressed • Get senior management support; select the processes to be changed; identify the goals and
measures; justify the need for change; develop a communication plan to advise relevant persons; identify necessary resources
Step 2: Measure the size of Current State problems • Identify the extent of the problem(s); clarify the impact they have on the business; gather data to
confirm the consequence of their effects Step 3: Identify the best practices that prevent the problems • Fix the causes of the problems or change the system to prevent the problems arising; investigate
what best practices solve the problems Step 4: Develop the Future State with new Best Practices • Clarify how to use best practices to solve the problems; develop a Future State Vision; make a
plan to introduce the changes; explain the plans to Management; write the best practices into ACE 3T procedures
Step 5: Make Best Practices the Standard Operating Procedures in the Workplace • Test the new standard operating procedures and practices; fine tune the SOPs and issue them
into the operation; conduct on-the-job training in SOPs to imbed the improvements
Change To Win
Step 1: Agree on scope of problem or
opportunity to be addressed
Step 2: Measure the
size of Current State problems
Step 3: Identify the best
practices that prevent the problems
Step 4: Develop the Future State
with Best Practice
Standards
Step 5: Make Best Practices
Standard Operating Procedure

© Lifetime Reliability Solutions Change To Win Workbook LRS.CTW.0001 Rev 0
Page 6
1. Step 1: Management Preparation and Project Scope Definition 1.1. Background In order to start a project it is necessary to define the extent of the work to be done and to provide sound justification for it. It is the role of the management to identify the problem(s) to be addressed by the project and to provide evidence that they are real and have caused serious issues to the business. 1.2. Vision, Goals, Objectives Management is aware that change is needed and they know what outcomes they want from making a change. These outcomes become the goals for the project. To begin the ‘Change To Win’ process, the organisation’s management must provide a written mission statement along with the goals that when achieved will deliver the mission. The implementation team uses the goals to select appropriate strategy and tactics to achieve the objectives. 1.3. Justification Evidence to justify the project can be provided in terms of costs, loss of performance, or lost opportunities. The necessary data is collected by an appointed manager and is provided to the ‘Change To Win’ Team as a baseline against which the future improvements will be measured. The preferred means of displaying the data is in a table with accompanying histogram, Pareto or other suitable visual management charts. 1.4. Executive Support To change the way an organisation works requires the visible, consistent commitment and support of Executive Management from the beginning to the end of the change. The organisation requires leadership, and that is the function of Executive Management. The ‘Change To Win’ program needs a champion from the Top Management ranks who will become the visible presence of Executive Management leadership. Their role is to provide support for the change and to keep the Executive up-to-date with progress and major issues. At times they may need to intercede to ensure the project gets the necessary resources to be completed successfully. 1.5. Preparation To ensure the ‘Change To Win’ program will be successful it is necessary for the Executive Managers and affected Department Managers to plan the change process carefully. An activity table of the entire program is developed showing the various people involved in the program, when they will be required and the activities they will be doing. This overview of the whole process facilitates discussion and assists in identifying project risks and resource constraints. An example of a Project Activities Summary Table for a project to introduce a change into the operating and maintenance practices of a business is shown on the following page.

© Lifetime Reliability Solutions Change To Win Workbook LRS.CTW.0001 Rev 0
Page 7
Example of a ‘Change To Win’ Project Activities Summary Table
Introducing Precision Maintenance Activities Summary Table
Wk CEO, Executive Team,
Operation & Maintenance Managers
Executive Champion, Operations and Maintenance Managers and Supervisors,
Implementation Team Leader
Maintenance Manager, Supervisor and Implementation Team Outputs Comments
Pre Scope and Targets of Project; Communication Plan Organisational
Communication, KPIs
1 Explain Scope to Supervisors and Team Leader
Introduce Precision Maintenance; ACE 3T Procedures; Select Plant and Equipment to be
Precision Maintained & Monitoring KPIs
Select Plant and Equipment for Precision
Maintenance Introduction
2 Set Standards; Select Authorities, Agree on Best Practices to meet; Select Project Team, Identify
needed resources; Set meeting times Set Standards to Achieve;
Acquire Authorities Plan
3 Explain Scope to Shopfloor Teams
Introduce Precision Maintenance; ACE 3T Procedures, Team duties; Project Plan, Match Equipment and Standards; Identify
Procedures for ACE 3T
Business Systems Changes Plan
4 Identify and bridge gaps between current practices and new Standards; Draft first procedure into standard ACE 3T format
Business Systems Changes Plan
5 Commit to Agreed Standards Draft procedures into standard ACE 3T format Business Systems Changes Do
6 Review and continue to draft procedures into standard ACE 3T format
Business Systems Changes Do
7 Review and continue to draft procedures into standard ACE 3T format; Identify test equipment, tools and in-the-field support
and training for implementation
Business Systems Changes; Get additional
help and resources Do
8 Review progress and provide support Review and sign-off on new 3T Procedures Business Systems
Changes Do
9 Implement Procedures on selected equipment and additional support Use, Learn, Adjust Do
10 Implement Procedures on selected equipment and additional support Use, Learn, Adjust Do
11
Review implementation and identify necessary adjustments to procedures, practices and support; Review KPIs; Include
adjustments and improvements into procedures; Continue with implementation
Use, Learn, Adjust Check
12 Implement Procedures on selected equipment and provide additional support Use, Learn, Adjust Act
13 Review progress, review KPIs, Celebrate and extend program Review progress, review KPIs, Celebrate and extend program Use, Learn, Adjust Act
© Lifetime Reliability Solutions Change To Win Workbook LRS.CTW.0001 Rev 0
Page 8
1.6. Choosing the ‘Change To Win’ Project A ‘Change To Win’ project maybe initiated because: • Management, or other interested parties, has identified an opportunity and they want to conduct
a pilot trail for an area. In this case the Team takes on the role of initiating a defined improvement assignment.
• A problem has become so large, or its consequences so severe, that current practices are
inadequate to resolve it and a means to stop the problem needs to be found, tested and put into place. The Team has the duty to look for improved methods and practices that will resolve the troublesome problem(s).
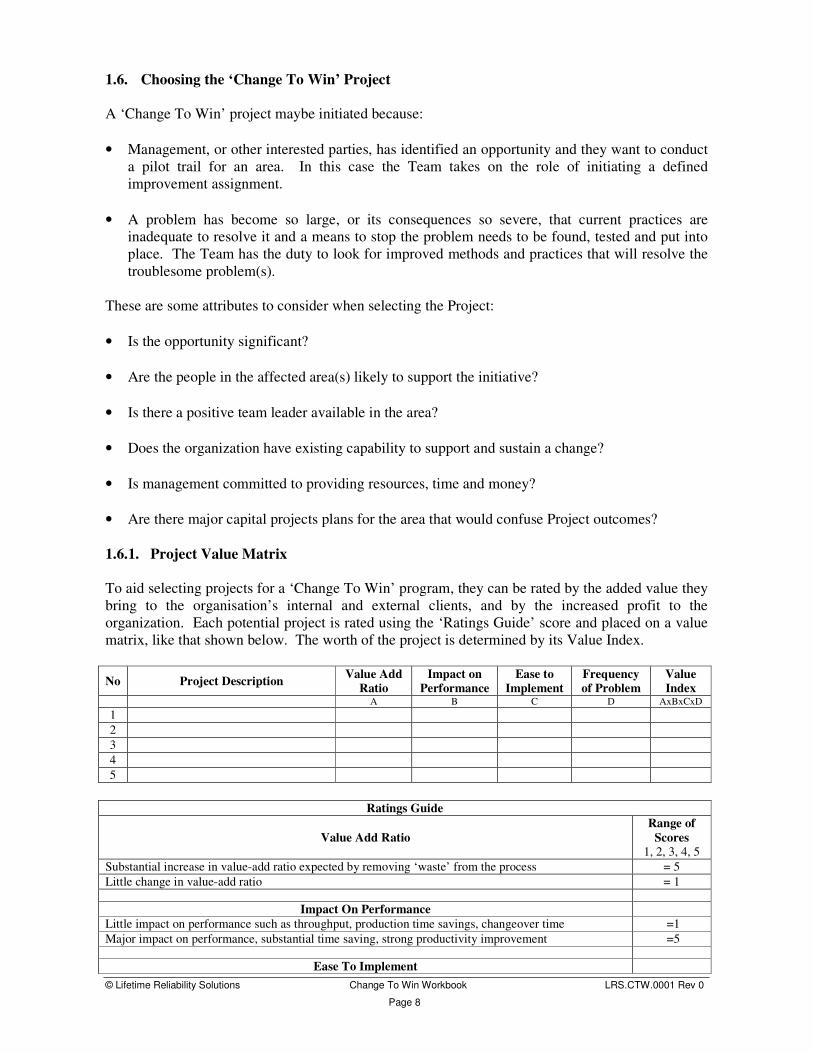
These are some attributes to consider when selecting the Project: • Is the opportunity significant? • Are the people in the affected area(s) likely to support the initiative? • Is there a positive team leader available in the area? • Does the organization have existing capability to support and sustain a change? • Is management committed to providing resources, time and money? • Are there major capital projects plans for the area that would confuse Project outcomes? 1.6.1. Project Value Matrix To aid selecting projects for a ‘Change To Win’ program, they can be rated by the added value they bring to the organisation’s internal and external clients, and by the increased profit to the organization. Each potential project is rated using the ‘Ratings Guide’ score and placed on a value matrix, like that shown below. The worth of the project is determined by its Value Index.
No Project Description Value Add Ratio
Impact on Performance
Ease to Implement
Frequency of Problem
Value Index
A B C D AxBxCxD 1 2 3 4 5
Ratings Guide
Value Add Ratio Range of
Scores 1, 2, 3, 4, 5
Substantial increase in value-add ratio expected by removing ‘waste’ from the process = 5 Little change in value-add ratio = 1
Impact On Performance Little impact on performance such as throughput, production time savings, changeover time =1 Major impact on performance, substantial time saving, strong productivity improvement =5
Ease To Implement
© Lifetime Reliability Solutions Change To Win Workbook LRS.CTW.0001 Rev 0
Page 9
Very involved solution requiring much time and resources = 1 Not time consuming, can be completed within the project time frame = 5
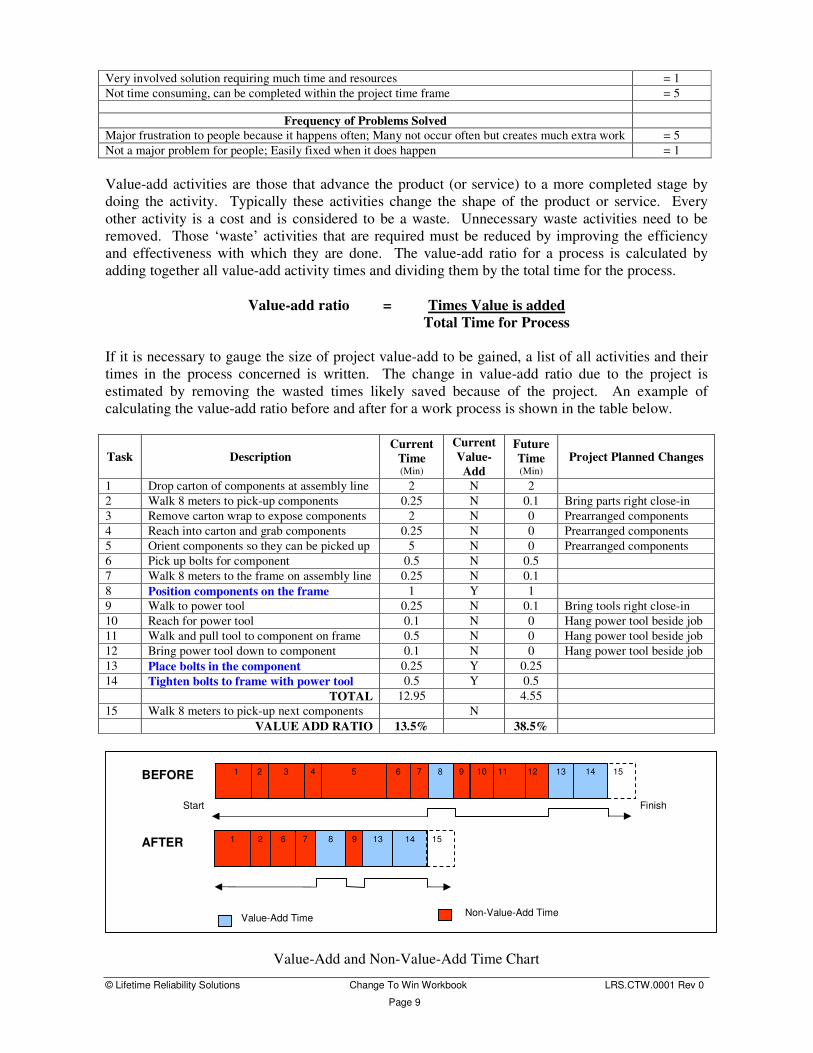
Frequency of Problems Solved Major frustration to people because it happens often; Many not occur often but creates much extra work = 5 Not a major problem for people; Easily fixed when it does happen = 1 Value-add activities are those that advance the product (or service) to a more completed stage by doing the activity. Typically these activities change the shape of the product or service. Every other activity is a cost and is considered to be a waste. Unnecessary waste activities need to be removed. Those ‘waste’ activities that are required must be reduced by improving the efficiency and effectiveness with which they are done. The value-add ratio for a process is calculated by adding together all value-add activity times and dividing them by the total time for the process.
Value-add ratio = Times Value is added Total Time for Process
If it is necessary to gauge the size of project value-add to be gained, a list of all activities and their times in the process concerned is written. The change in value-add ratio due to the project is estimated by removing the wasted times likely saved because of the project. An example of calculating the value-add ratio before and after for a work process is shown in the table below.
Task Description Current
Time (Min)
Current Value-
Add
Future Time (Min)
Project Planned Changes
1 Drop carton of components at assembly line 2 N 2 2 Walk 8 meters to pick-up components 0.25 N 0.1 Bring parts right close-in 3 Remove carton wrap to expose components 2 N 0 Prearranged components 4 Reach into carton and grab components 0.25 N 0 Prearranged components 5 Orient components so they can be picked up 5 N 0 Prearranged components 6 Pick up bolts for component 0.5 N 0.5 7 Walk 8 meters to the frame on assembly line 0.25 N 0.1 8 Position components on the frame 1 Y 1 9 Walk to power tool 0.25 N 0.1 Bring tools right close-in 10 Reach for power tool 0.1 N 0 Hang power tool beside job 11 Walk and pull tool to component on frame 0.5 N 0 Hang power tool beside job 12 Bring power tool down to component 0.1 N 0 Hang power tool beside job 13 Place bolts in the component 0.25 Y 0.25 14 Tighten bolts to frame with power tool 0.5 Y 0.5 TOTAL 12.95 4.55 15 Walk 8 meters to pick-up next components N VALUE ADD RATIO 13.5% 38.5%
Value-Add and Non-Value-Add Time Chart
1 2 3 4 6 8 5 7 9 12 11 13 15 14
Value-Add Time Non-Value-Add Time
Finish
1 2 6 8 7 9 13 14 15
10 BEFORE
AFTER
Start

© Lifetime Reliability Solutions Change To Win Workbook LRS.CTW.0001 Rev 0
Page 10
1.7. Scope of Project The scope of the project is the extent of the operation affected by the change(s) that the management want implemented. A brief one or two paragraph summary of the ‘Change to Win’ Project scope is provided by senior management to the ‘Change To Win’ Team as a means to focus their efforts and guide the extent of their investigations and changes. A useful aid is to physically define the boundaries for the Team. These maybe geographic boundaries, process equipment lines or the business processes.
Resource limits available to the Team will need to be specified. These include available manpower, management mentors, extent of internal and external help allowed, whether there are financial limits, the extent of secretarial help provided, along with any site specific factors. 1.8. Implementation Team As Management will pass the implementation of the change to a workplace team, it is necessary that the team members: • be from the affected business processes • include the manager and supervisor of the process • be willing to work on the introduction of change • have useful skills or knowledge to contribute • be able to positively influence people in the workplace • be willing to consider new ideas and options
1.9. Defining the Means to Measure Project Results In order to know that positive change occurs as a result of the Project, both the current baseline, and the means of measuring a change from the baseline, need to be determined and provided to the team. The baseline was the data on current performance collected as part of the Management Preparation requirements. It is now necessary to provide, or develop, high-level measures, or indices, to gauge the corporate benefit brought by project. The measures need to be relevant to the project and accurate data must be available to use when compiling the measures. A maximum of six measures can be used, though one alone may be adequate. The chosen measures need to be robust and sound, acceptable to all interested parties, and reflecting the true impact of the project on the business and its performance. Measures can be financial, operational, process performance, group performance, etc.
Task - Management: Select the implementation team leader. With the chosen team leader then select the other members of the team. As a matter of courtesy it is necessary to personally ask each individual if they will participate in the project.
Task - Management: Using a plan of the site, or a process diagram of a production facility, or a business process flow map, agree and draw lines to define the physical and/or process limits the ‘Change To Win’ Team are to work within.

© Lifetime Reliability Solutions Change To Win Workbook LRS.CTW.0001 Rev 0
Page 11
1.10. Communication Plan Part of preparing for the three month long project is to identify all the people that need to know about it and will be affected by it. This includes shift workers, office staff, other managers, other departments, corporate personnel, health and safety, insurers, etc. To help identify the full list of people needing to be told of the project at its various phases, and the means by which to tell them, a tabular communication plan, along the lines of the example in the Table below, is developed.
Example Communication Plan Format
1.11. Communication Board To help keep in contact with other shifts, other departments and interested people, a communication board is established at a suitable location. The things that are put on the board include: • Team Name • Team scope and goals • Photo of the Team • Action Sheets • Measurement and monitoring charts • Graphs and trends • Investigation results and findings • Project Plan and Schedule • Meeting dates and attendance records • Before and After Improvement Sheets • Drawings and diagrams
Project Phase Task Name
Who Needs to Know?
(Name/Position) Description Who By
How will They be Told?
By When Comment
Develop TLAP & Communication Plan. Select Exec Champion. Establish team
John Brown/CEO Pam Neal/VP Ops Mike Teal/Ops Mgr Fred Love/Maint Mgr
Development of processes for implementation of project. Discuss setting exact requirements and desired results. Team composition
Facilitator Boardroom meeting
14-Sept
Preparation
Explain scope to project team members
All team members and afternoon shift foremen
Introduce project, scope and purpose. Advise of selected operation for project. High-level monitoring KPIs
CEO Boardroom meeting
21 Sept
Bring in afternoon shift foremen early for meeting
Plan
Do
Check
Act
© Lifetime Reliability Solutions Change To Win Workbook LRS.CTW.0001 Rev 0
Page 12
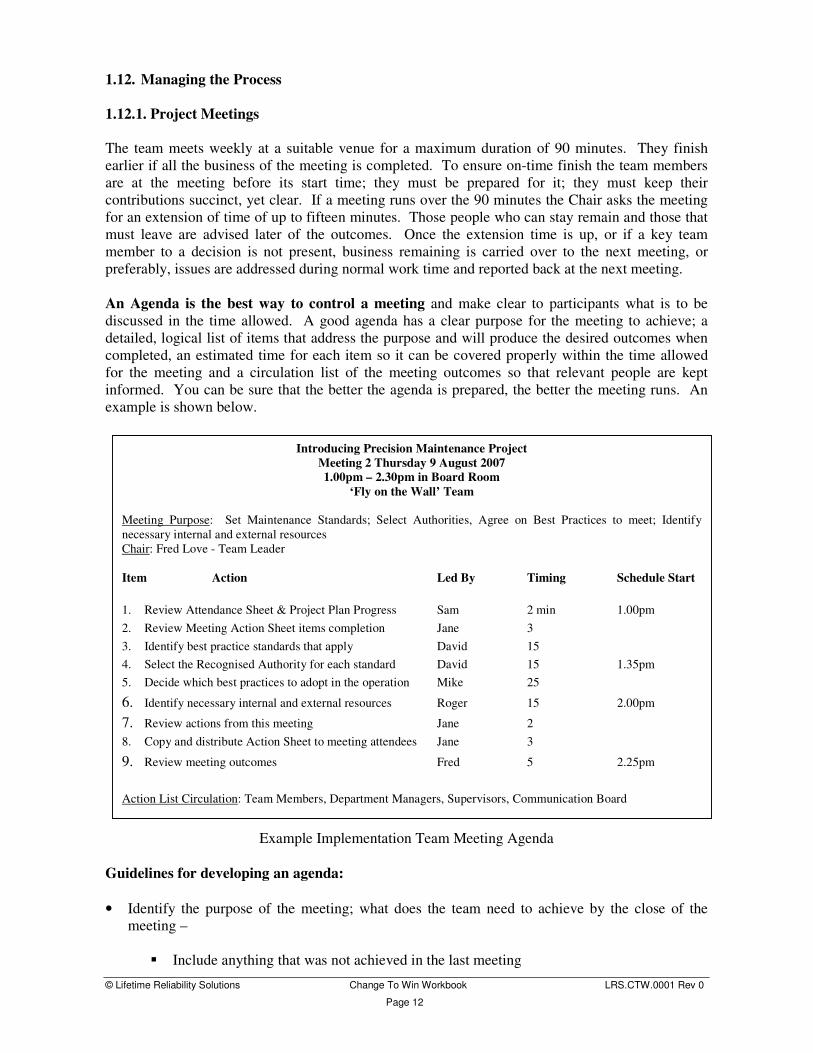
1.12. Managing the Process 1.12.1. Project Meetings The team meets weekly at a suitable venue for a maximum duration of 90 minutes. They finish earlier if all the business of the meeting is completed. To ensure on-time finish the team members are at the meeting before its start time; they must be prepared for it; they must keep their contributions succinct, yet clear. If a meeting runs over the 90 minutes the Chair asks the meeting for an extension of time of up to fifteen minutes. Those people who can stay remain and those that must leave are advised later of the outcomes. Once the extension time is up, or if a key team member to a decision is not present, business remaining is carried over to the next meeting, or preferably, issues are addressed during normal work time and reported back at the next meeting. An Agenda is the best way to control a meeting and make clear to participants what is to be discussed in the time allowed. A good agenda has a clear purpose for the meeting to achieve; a detailed, logical list of items that address the purpose and will produce the desired outcomes when completed, an estimated time for each item so it can be covered properly within the time allowed for the meeting and a circulation list of the meeting outcomes so that relevant people are kept informed. You can be sure that the better the agenda is prepared, the better the meeting runs. An example is shown below.
Example Implementation Team Meeting Agenda Guidelines for developing an agenda: • Identify the purpose of the meeting; what does the team need to achieve by the close of the
meeting –
� Include anything that was not achieved in the last meeting
Introducing Precision Maintenance Project Meeting 2 Thursday 9 August 2007 1.00pm – 2.30pm in Board Room
‘Fly on the Wall’ Team
Meeting Purpose: Set Maintenance Standards; Select Authorities, Agree on Best Practices to meet; Identify necessary internal and external resources Chair: Fred Love - Team Leader Item Action Led By Timing Schedule Start 1. Review Attendance Sheet & Project Plan Progress Sam 2 min 1.00pm 2. Review Meeting Action Sheet items completion Jane 3 3. Identify best practice standards that apply David 15 4. Select the Recognised Authority for each standard David 15 1.35pm 5. Decide which best practices to adopt in the operation Mike 25
6. Identify necessary internal and external resources Roger 15 2.00pm 7. Review actions from this meeting Jane 2 8. Copy and distribute Action Sheet to meeting attendees Jane 3
9. Review meeting outcomes Fred 5 2.25pm Action List Circulation: Team Members, Department Managers, Supervisors, Communication Board

© Lifetime Reliability Solutions Change To Win Workbook LRS.CTW.0001 Rev 0
Page 13
� Include any relevant issue that has been brought to the team’s attention since the last
meeting � Look at the workbook, and the project schedule to determine what comes next
• Team meetings typically start with a welcome, then confirmation of attendance, checking
progress against the project plan, reviewing the status of the ‘action sheet’ items for which members are responsible (the ‘action sheet’ is explained next in the workbook)
• Include into the agenda any action items that need more discussion • Consider the purpose of the meeting and work-out the issues that need to be discussed and
agreed by the team in order to achieve it. Layout the agenda item in a logical order that will produce a well-considered outcome. Where there is more than one purpose, separate it from the others and develop its own portion of the agenda, so that when completed the necessary outcomes to meet the purpose are achieved.
• When estimating times for the agenda items be realistic and allow sufficient time for open
discussion. If necessary contact the person who will lead the item and ask them how much time they need. If the total time exceeds the meeting time remove some items, or plan that it be finished outside of the meeting.
• The end of the meeting should include:
� Confirming new actions and responsible persons � Items to be added to the next meeting agenda � Reviewing how the meeting went to find ways to improve it � Confirming date and time of the next meeting
1.12.2. The Action Sheet When tasks to be done are identified during the meetings they are recorded on the ‘Action Sheet’. A brief, yet clear, description is provided of the action task, show who is responsible for it, and give an estimated completion date. The Action Sheet is a running document in continuous use. Each new action takes the next sequential number and is added under the last recorded action. At the start of each meeting unfinished actions are reviewed, those completed are given a status of 100% finished, the completion status of those still underway is updated, and those that are past their original estimated completion date are rescheduled to the new expected completion date.
Task - Action Sheet Recorder: Action Sheets are copied and handed to each team member at the end of each meeting. Copies are circulated to people on the circulation list.

© Lifetime Reliability Solutions Change To Win Workbook LRS.CTW.0001 Rev 0
Page 14
An example of an Action Sheet format is shown below:
ACTION SHEET Page 1 of 2. Meeting Subject: Introducing Precision Maintenance Venue: Board Room
Attendees: Roger, Mike, David, Sam, Jane, Bill
Date:
23 Aug 07
No Meeting Date Action By Who Target
Date Revised
Date Percent
Complete 1 2 Aug 07 Require report on planned changes Bill 9 Aug 100%
2 Draft KPIs for project measurement Bill/Roger 9 Aug 100%
3 Book Conference Room for rest of project Sam 9 Aug 100%
4 Produce production downtime report to-date Roger 9 Aug 16 Aug 100%
5 9 Aug 07 Complete survey David 30 Aug 75%
6 Distribute production downtime report for comment Roger 16 Aug 100%
7 Compile list of useful maintenance standards David 16 Aug 100%
8 Identify recognised Authorities David/Bill 16 Aug 23 Aug 50%
9 16 Aug 07 Produce list of maintenance procedures Roger 23 Aug 100%
10 Type-up team rules Sam 23 Aug 100%
11 Phone list of team members Mike 23 Aug 100%
Next Meeting: Date: 23 August 2007 Time: 1.00pm Place: Board Room
Circulation: Team, Dept Managers, Dept Supervisors Complied By: Jane
Example Implementation team Action Sheet
1.12.3. Implementation Team Roles Effective change requires the involvement of management and staff working together. Management set the direction or vision, they set the goals and measures, they provide the support and resources, and they sustain necessary effort until the goals are achieved. The Staff are the workplace experts and are the best people to plan and implement the changes needed in their workplace to reach the vision. People in the team must feel some sense of change and achievement is happening. Sharing tasks is a valuable way to allow everyone on the team to contribute to the success of the project. The greatest value is gained from each team member when they contribute their specific skills and knowledge to the project. This means that being part of a team is also a good opportunity for people to learn new things by helping others to complete tasks. The Team Leader should encourage team members to share those activities that lend themselves to be a learning experience. Completing assigned tasks is usually done outside of the meeting – so team members’ managers need to allocate time for tasks to be performed. It is sponsoring Executive Manager’s role to ensure that time is allocated by departments to people on the team for the project. To promote the opportunity to share in, and grow from, the experience, each team member takes on a role and its duties to manage over the period of the program. An example of team tasks to be allocated in a project is shown in the following table:

© Lifetime Reliability Solutions Change To Win Workbook LRS.CTW.0001 Rev 0
Page 15
Precision Maintenance Project Team Structure and Duties
Position Primary Duty Secondary Duties Name
Team Leader Organizes and leads meetings, develops agenda, encourages participation by all;
Coordinates resources throughout the Company Assist in reviewing procedures
Assistant Team Leader
Writes, maintains and distributes action sheets, relieves for Team Leader if not available Manages documents and records
Researcher 1 Gathers best practice methods from Authorities Assist in writing procedures
Researcher 2 Gathers best practice methods from Authorities Assist in writing procedures
Writer 1 Drafts best practices into procedures Reviewing procedures
Writer 2 Drafts best practices into procedures Reviewing procedures
Writer 3 Drafts best practices into procedures Reviewing procedures
Reviewer 1 Reviews draft procedures and works with Writer to refine
Takes photographs, Updates communication board with progress
fortnightly
Reviewer 2 Reviews draft procedures and works with Writer to refine
Collects KPI Measures and graphs them
Reviewer 3 Reviews draft procedures and works with Writer to refine
Collates project documents from all others into project folder/files
Facilitator Helps and coaches team through the process, provides support to the Team Leader
Acts as catalyst for change and assists team to challenge status quo
Example Implementation Team Roles and Duties
The Facilitator is usually a person experienced in team/project facilitation from outside of the workgroup whose role is to guide the team through the ‘Change To Win’ program workbook to a successful project completion. They assist the team in such duties as helping the Team Leader prepare the agenda, conducting analysis of data, helping team members in developing forms and surveys to collect information; providing advice in running the program effectively, etc.
1.12.4. Team Rules Teams work together best when there is an accepted structure of behaviour for its members based on common, shared values. Cooperation is greatly enhanced if the team agrees the rules of behaviour for the team members. Examples are: • Punctuality • Notifying inability to attend a meeting • Courtesy when speaking • Sharing the workload • How to encourage contributions from members • Completing agreed actions and how to advise problems that affect them • How to have effective meetings that get through the agenda on time • Methods to communicate to each other outside of the meeting
Task – Team Leader: Team agrees on the team rules for its members.
Task – Team Leader: Team agrees on roles for members.
© Lifetime Reliability Solutions Change To Win Workbook LRS.CTW.0001 Rev 0
Page 16
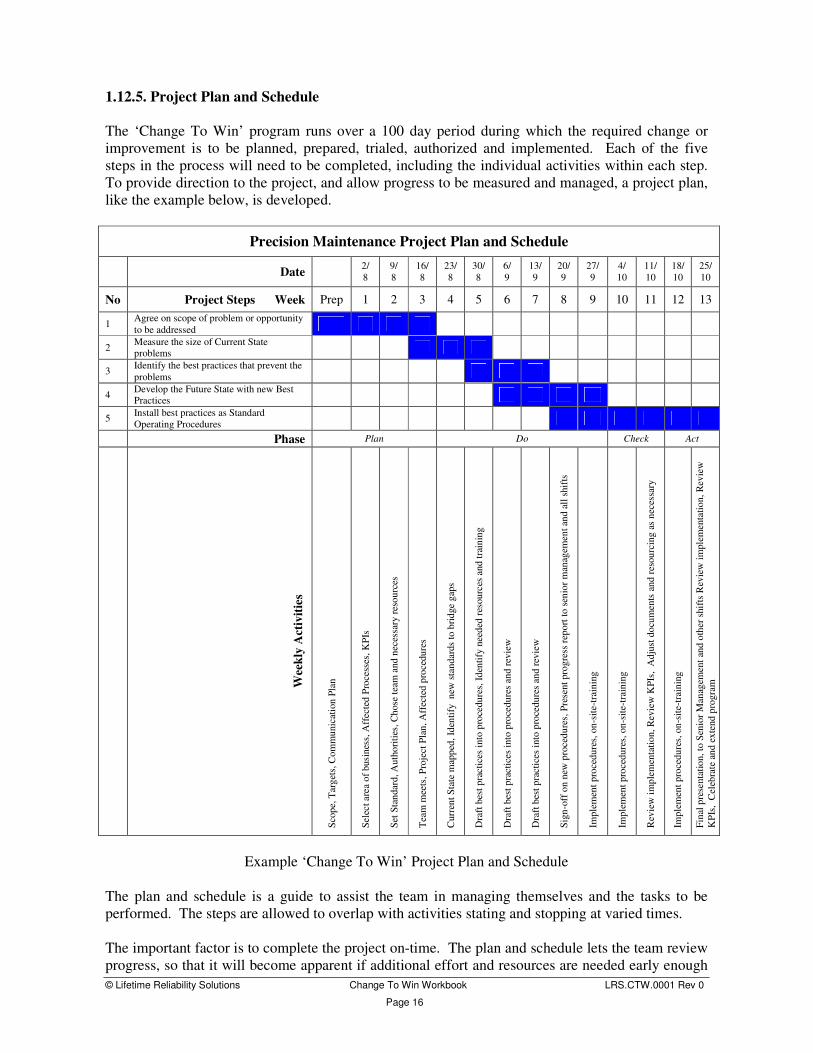
1.12.5. Project Plan and Schedule The ‘Change To Win’ program runs over a 100 day period during which the required change or improvement is to be planned, prepared, trialed, authorized and implemented. Each of the five steps in the process will need to be completed, including the individual activities within each step. To provide direction to the project, and allow progress to be measured and managed, a project plan, like the example below, is developed.
Precision Maintenance Project Plan and Schedule
Date 2/ 8
9/ 8
16/8
23/8
30/8
6/ 9
13/9
20/9
27/9
4/ 10
11/10
18/10
25/10
No Project Steps Week Prep 1 2 3 4 5 6 7 8 9 10 11 12 13
1 Agree on scope of problem or opportunity to be addressed
2 Measure the size of Current State problems
3 Identify the best practices that prevent the problems
4 Develop the Future State with new Best Practices
5 Install best practices as Standard Operating Procedures
Phase Plan Do Check Act
Wee
kly
Act
iviti
es
Scop
e, T
arge
ts, C
omm
unic
atio
n Pl
an
Sele
ct a
rea
of b
usin
ess,
Aff
ecte
d Pr
oces
ses,
KPI
s
Set S
tand
ard,
Aut
horit
ies,
Cho
se te
am a
nd n
eces
sary
reso
urce
s
Tea
m m
eets
, Pro
ject
Pla
n, A
ffec
ted
proc
edur
es
Cur
rent
Sta
te m
appe
d, Id
entif
y n
ew s
tand
ards
to b
ridge
gap
s
Dra
ft b
est p
ract
ices
into
pro
cedu
res,
Iden
tify
need
ed re
sour
ces
and
trai
ning
Dra
ft b
est p
ract
ices
into
pro
cedu
res
and
revi
ew
Dra
ft b
est p
ract
ices
into
pro
cedu
res
and
revi
ew
Sign
-off
on
new
pro
cedu
res,
Pre
sent
pro
gres
s re
port
to s
enio
r man
agem
ent a
nd a
ll sh
ifts
Impl
emen
t pro
cedu
res,
on-
site
-tra
inin
g
Impl
emen
t pro
cedu
res,
on-
site
-tra
inin
g
Rev
iew
impl
emen
tatio
n, R
evie
w K
PIs,
Adj
ust d
ocum
ents
and
reso
urci
ng a
s ne
cess
ary
Impl
emen
t pro
cedu
res,
on-
site
-tra
inin
g
Fina
l pre
sent
atio
n, to
Sen
ior M
anag
emen
t and
oth
er s
hift
s R
evie
w im
plem
enta
tion,
Rev
iew
K
PIs,
Cel
ebra
te a
nd e
xten
d pr
ogra
m
Example ‘Change To Win’ Project Plan and Schedule
The plan and schedule is a guide to assist the team in managing themselves and the tasks to be performed. The steps are allowed to overlap with activities stating and stopping at varied times. The important factor is to complete the project on-time. The plan and schedule lets the team review progress, so that it will become apparent if additional effort and resources are needed early enough

© Lifetime Reliability Solutions Change To Win Workbook LRS.CTW.0001 Rev 0
Page 17
to mobilize them, or to scale back the project expectations and retarget efforts over the time remaining. Each week the team tracks project progress and meeting attendance. The progress records are updated on the Communication Board. The aim being to: • make sure all the resources necessary are at the meetings • to highlight if team members are having trouble getting to the meetings • to identify if team members are having trouble completing tasks and needs additional resources • to ensure the project is not falling behind schedule. For each ‘Change To Win’ project it is necessary to develop its own project plan and schedule identifying the key tasks and dates for completion. Below is an example of a project tracking sheet used to monitor progress and allow people to schedule their time and ensure resource availability.
Precision Maintenance Project Plan
Date
No Project Steps Week Prep 1 2 3 4 5 6 7 8 9 10 11 12 13
1 Agree on scope of problem or opportunity to be addressed
2 Measure the size of Current State problems
3 Identify the best practices that prevent the problems
4 Develop the Future State with new practices
5 Install best practices as Standard Operating Procedures
Project Team Meeting Attendance
Name Role Prep 1 2 3 4 5 6 7 8 9 10 11 12 13
Executive Sponsor
Department Manager
Department Supervisor
Team Leader
Assistant Team Leader
Researcher 1
Researcher 2
Writer 1
Writer 2
Writer 3
Reviewer 1
Reviewer 2
Reviewer 3
Facilitator
© Lifetime Reliability Solutions Change To Win Workbook LRS.CTW.0001 Rev 0
Page 18
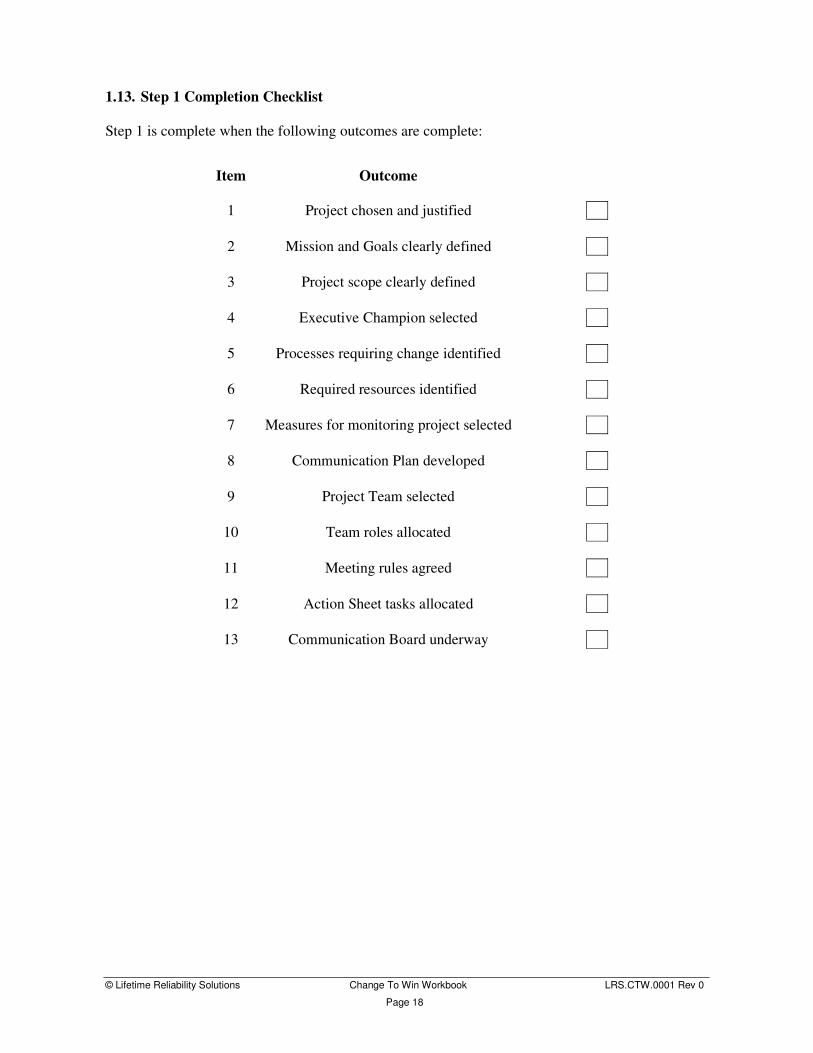
1.13. Step 1 Completion Checklist Step 1 is complete when the following outcomes are complete:
Item Outcome
1 Project chosen and justified 2 Mission and Goals clearly defined 3 Project scope clearly defined 4 Executive Champion selected 5 Processes requiring change identified 6 Required resources identified 7 Measures for monitoring project selected 8 Communication Plan developed 9 Project Team selected
10 Team roles allocated
11 Meeting rules agreed
12 Action Sheet tasks allocated
13 Communication Board underway

© Lifetime Reliability Solutions Change To Win Workbook LRS.CTW.0001 Rev 0
Page 19
2. Step 2: Measure the size of Current State problems In Step 1, Management identified a necessary change to the business in order to improve its future prospects. In this step, the implementation team identifies what business processes and procedures have to change, so that the new initiative will be successfully put into place, and put into use. The intention of this step is to justify the change and to confirm that the change will bring worthwhile improvement to the organisation. The team has been given the duty by management of planning and implementing a change in the organisation. For change to be successful and effective in the long term it is necessary that there is: • NEED FOR CHANGE There must be a strong enough reason, or pressure, for change, such as changing competition, poor customer satisfaction, changing legislation, entering into new markets, etc • A CLEAR, SHARED VISION Management and staff need a clearly defined and shared concept of why change is necessary and how much it will improve performance. • THE CAPACITY FOR CHANGE For an organisation to change it must have access to the resources and skills to both implement and sustain the change. • ACTIONABLE FIRST STEPS The change will only occur if the staff has involvement in its development and implementation. The people affected by the change need to feel a sense of the worth of its achievement. • MODEL BEHAVIOUR Executive values heavily influence organisational characteristics. Management will need to practice the values and vision underpinning the change program. • BENEFICIAL REINFORCEMENT Staff needs to be rewarded for instituting the change and given regular feedback on the organizational and personal benefits flowing from it. During the ‘Change To Win’ Program each of the above six elements will be addressed to provide a sound and solid base for the change being implemented. In this step the first three elements - Need for Change - A Clear, Shared Vision - Capacity for Change - will be investigated and quantified. 2.1. Gathering Data During this step a number of tools and techniques will be used to assist in analysing and understanding the situation. These include: • Data gathering • Surveys
• Value Stream Mapping • Business process diagrams
• Pareto charts
© Lifetime Reliability Solutions Change To Win Workbook LRS.CTW.0001 Rev 0
Page 20
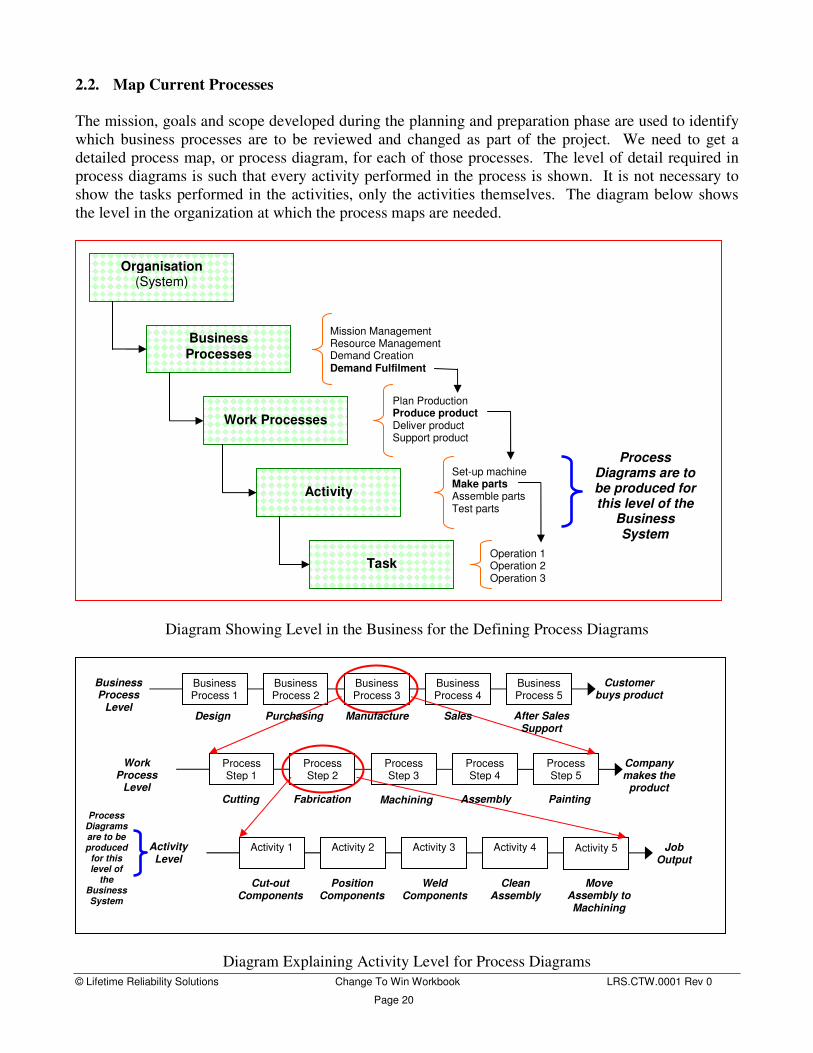
2.2. Map Current Processes The mission, goals and scope developed during the planning and preparation phase are used to identify which business processes are to be reviewed and changed as part of the project. We need to get a detailed process map, or process diagram, for each of those processes. The level of detail required in process diagrams is such that every activity performed in the process is shown. It is not necessary to show the tasks performed in the activities, only the activities themselves. The diagram below shows the level in the organization at which the process maps are needed.
Diagram Showing Level in the Business for the Defining Process Diagrams
Diagram Explaining Activity Level for Process Diagrams
Business Process
Level
Business Process 1
Business Process 2
Business Process 3
Business Process 4
Business Process 5
Work Process
Level
Process Step 1
Process Step 2
Process Step 3
Process Step 4
Process Step 5
Activity Level
Activity 1 Activity 2 Activity 3 Activity 4 Activity 5
Company makes the
product
Job Output
Customer buys product
Manufacture After Sales Support
Sales Purchasing Design
Machining Painting Assembly Fabrication Cutting
Weld Components
Move Assembly to Machining
Clean Assembly
Position Components
Cut-out Components
Process Diagrams are to be produced
for this level of
the Business System
Organisation (System)
Business Processes
Work Processes
Activity
Task
Mission Management Resource Management Demand Creation Demand Fulfilment
Plan Production Produce product Deliver product Support product
Set-up machine Make parts Assemble parts Test parts
Operation 1 Operation 2 Operation 3
Process Diagrams are to be produced for this level of the
Business System

© Lifetime Reliability Solutions Change To Win Workbook LRS.CTW.0001 Rev 0
Page 21
It is necessary for all team members to get a sufficiently detailed understanding of the activities occurring within the organization’s work processes so they are comfortable with the range of issues and discussions the team will cover. By having good details of all the process activities affected by the change the impact of the proposed change can be more fully identified and appreciated. If the activity level process diagrams already exist then collect them together into a master document. If they do not exist they need to be drawn correctly and in-full. Neat hand sketches are adequate for the purpose, or they could be drawn using a computer and suitable software, such as with MS Word drawing tools, MS Visio, AutoCAD, CorelDraw or other similar drafting packages. An example of the level of detail needed on the activity level process diagrams is shown in the sample drawing below.
Example of an Activity Level Process Diagram 2.3. Identify Associated Procedures and Work Instructions Once it is clear which processes will be affected by the change, it is necessary to collect together both a hardcopy and softcopy (if available) of all applicable procedures, work instructions, records and forms generated in those processes. They may all need to be updated because of the change, and a copy of the current ‘approved for issue’ documents is needed so any changes can be included into them. 2.3.1. Managing the Data and Information A lot of documentation and information will be collected and created as the team conducts the ‘Change To Win’ project. These documents need to be filed into a central location for easy recovery when necessary. Hard copy documents require labeling using stick-on labels, showing such details as: • Title • Site, Location, Process where the data refers • Date filed • Name of who collected or created the document, so people know who to talk to in future
Identify Vehicle
Identify Bar
Loading Instructions
Process for Delivering Steel Bar
Scan Job Tag
Advise Dispatch
Load Vehicle
All Bars Loaded
Y
N
Mark Docket
Prepare Release

© Lifetime Reliability Solutions Change To Win Workbook LRS.CTW.0001 Rev 0
Page 22
2.4. Identifying Current Problems Though senior management have authorized the change, it is important to collect facts from the workplace and/or the marketplace that support the reason for the change. This lets people in the organisation know the new initiative is important to the future well-being of the organisation. 2.4.1. Changing Workplace If the change is needed because the workplace practices used by the organisation no longer provide the required marketplace, operational or financial performance, then the team collects evidence from the relevant workplaces of the various problems, and the impact they have on the operation. There are several methods available to collect the evidence of existing problems. 2.4.2. Business Databases Your company will have information on its problems recorded in its various databases. Examples are in maintenance management systems, production reporting systems, production logbooks, customer complaints, health and safety systems, etc. If appropriate to the situation, these databases can be accessed and the information they contain on the problems impacting the business Pareto charted to highlight the frequency and consequences of the problems the change is intending to solve. 2.4.3. Workplace Surveys Another way to understand the problems from an employee’s or customer’s point of view is to carry out a simple survey. This is most easily done with a survey form distributed to all the people working in the affected processes, asking them to list all the problems that interfere with them doing their work. This provides the team with further clues on what the problems are, and, most importantly, the frustration experienced at the workplace. This type of data can be very subjective and anecdotal. However, it can be critical in understanding all of the problems, and, later on, developing “buy in” from the organisation when changes are proposed. The survey needs to be distributed to all people working within the processes affected by the change. Sample Workplace Survey
Project Survey Form
Please answer the questions on the form and return it to your Supervisor by the end of the shift.
Your Job Title: _____________________________ The Plant/Line/Group you work in? _________________________
List the problems that stop you doing your work.
How often does it happen in the Best/Average/Worst
situation? e.g. 1/wk, 4/wk, 10/wk
How much time is lost on average when
it happens?
What other wastes are caused by the problem?
Task – Assistant Team Leader: Develop an electronic and hardcopy central filing system. Set-up the document naming convention for the project and advise the team members how to label and identify project documents, and where to store them.

© Lifetime Reliability Solutions Change To Win Workbook LRS.CTW.0001 Rev 0
Page 23
Once the surveys have been returned, all the information is consolidated into one matrix (a large spreadsheet table) for each process affected by the change. The easiest method is to use the process name and list all the answers recorded for it, in one long table. When listing the comments, don’t ‘sanitise’ them by putting your own interpretation down; write them as they are written unless there is offensive language to be removed. Once the list is compiled collect the comments into categories that contain the same problem. An example might be that survey results show time is lost waiting for lifting by cranes and also by forklifts. In such a situation you would make two categories – ‘Waiting for Forklift’ and ‘Waiting for Crane’ - because the times lost waiting to do a lift is due to two different reasons. Tally the total of the answers in each category and create a low-level Pareto Chart of the category name and the frequency the problems occur. The Pareto chart is a visual representation of the types and sizes of the problems in the workplace that the change will remove, or at least greatly reduce. If there are many categories of problems, these can also be collected together under higher categories or groupings. This creates a second level of Pareto Charts. For example, the ‘Waiting for Forklift’ and ‘Waiting for Crane’ problems from above, can be collected together under the category of ‘Materials Lifting Problems’. Another example would be when many items of equipment in a process breakdown, they can be grouped by ‘Equipment Failures’ and not as breakdowns of individual equipment. 2.4.4. Pareto Charts A Pareto Chart is a special form of a bar graph used to display the relative importance of problems or conditions. A Pareto chart allows one to;
Tip: A nice way to get a survey completed is to hold a BBQ breakfast or pizza lunch, where the price of admission is a completed survey form from the target group.
Tip: Ensure the survey collects information from the right people. An example of a survey gone wrong was when forklift drivers were asked to record lost time loading trucks. The surveys came back showing there was no lost time in truck loading, the time lost was in waiting for pallets to be made-up that would go on trucks. The problem that was missed was that the truck drivers stood about waiting for forklifts that were busy doing jobs not related to the truck waiting to be loaded. The survey for lost time loading trucks should have gone to the truck drivers; not the forklift drivers.

© Lifetime Reliability Solutions Change To Win Workbook LRS.CTW.0001 Rev 0
Page 24
• Focus on critical issues by ranking them in terms of both loss and frequency (e.g. Which machine causes the most downtime? Which machine breaks down most frequently?)
• Prioritize issues or causes in order to initiate efficient problem solving by focusing efforts on the
‘important few’ (e.g. What delay should we tackle first? or, The solution of what process problems will improve waste time most?)
• Analyse problems or causes by different groupings of data (e.g., by time waste type, such as,
mechanical, electrical, process, changeover, other) • Analyse the before and after impact of changes made in a process (e.g. What is the most common
waste before and after the process was changed? Has the improvement program reduced the extent of losses?)
An example of a Pareto Chart is shown below. A Pareto Chart is constructed by grouping the range of the data by categories. The left-side vertical axis of the chart is labelled Frequency, or Count, for the number of counts in each category (the right-side vertical axis can also show a cumulative percentage of the total) and the horizontal axis is labelled with names of the groups or categories. The Pareto chart will clearly identify the issues that bring the greatest improvement potential from introducing the change into the organization.
Pareto Chart of Time Loss Causes in Machine Shop
0
1
2
3
4
5
6
No Too
ling
Wait
High
Bay
Cra
ne
Vendo
r Dela
y
Look
ing fo
r Part
s
Multipl
e Rep
eat S
et-up
s
SAP Raw
Mate
rial E
rror
Wron
g Mac
hine f
or Jo
b
Poor M
achin
e Con
dition
Wait
Rep
air S
hop C
rane
Cleanin
g
Poor T
oolin
g
Machin
e Brea
kdow
n
Trainin
g Othe
rs
Work
ing on
Floor
Fabric
ation
Dist
ortion
Cause
Cou
nt
Example of a Pareto Chart

© Lifetime Reliability Solutions Change To Win Workbook LRS.CTW.0001 Rev 0
Page 25
2.4.5. Calculating Costs From the estimate of the time losses provided in the survey the team can calculate the cost of the time lost monthly and/or yearly in each problem category using the recovery rate of the persons doing the job. The recovery rates can be found from the company’s accountant. They typically include the hourly rate plus a mark-up to allow for the business overheads and operating costs. The recovery rate can be from 25% to 200% more than a worker’s pay rate, depending on industry and process involved. The survey results let people realise the scale and cost of current problems the company is living with. It will greatly help to justify the change required by senior management and help people to understand its purpose, and appreciate benefits it will bring when in-place. Though the survey is not performed scientifically, and the comments from individuals are subjective, it is accumulated from a large group experiencing the same circumstances, and so is sufficiently robust evidence against which the future impact and benefits of the change can be later benchmarked. Once people have contributed to the survey, then the Team must ensure that they are given feedback on what was found. One way is to put the survey results and Pareto Graph on the Communication Board. Another is to advise people in a Toolbox Talk and show the Pareto Chart during the feedback presentation. 2.4.6. Pin Mapping Problems A second visual management method, different to Pareto charts, used to highlight the size and extent of workplace problems is to construct a pin map of problem locations. This requires using copies of the current process flow diagrams as maps. For each problem identified in the survey, place a colored pin, or colored mark, representing a category of problem, at the point in the process the problem arose. Once complete the pin colors on the map clearly show the concentration and location of problems in the workplace. 2.4.7. Changing Marketplace If the change is marketplace driven, i.e. the competition has changed or the customers’ expectations have changed, it is necessary to provide the team with the marketing data supporting the reason for the change. The Executive Champion provides the team with the necessary information and explains its significance and implications to the team.
© Lifetime Reliability Solutions Change To Win Workbook LRS.CTW.0001 Rev 0
Page 26
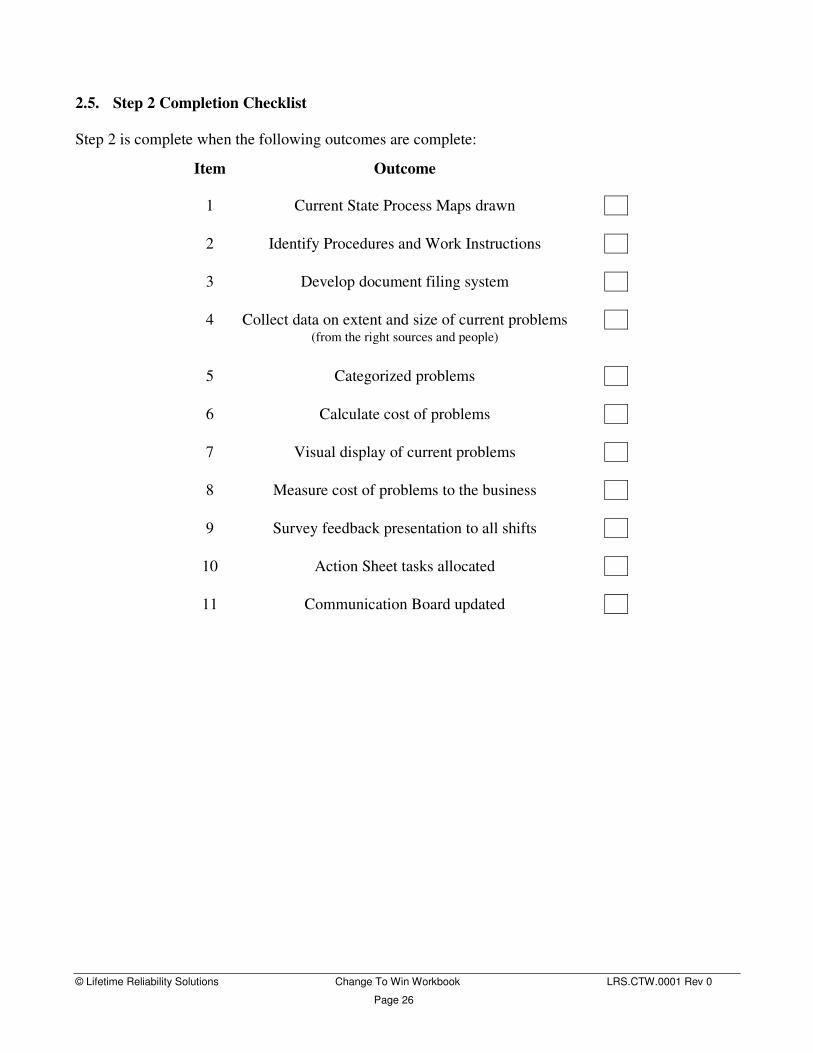
2.5. Step 2 Completion Checklist Step 2 is complete when the following outcomes are complete:
Item Outcome
1 Current State Process Maps drawn
2 Identify Procedures and Work Instructions
3 Develop document filing system
4 Collect data on extent and size of current problems (from the right sources and people)
5 Categorized problems
6 Calculate cost of problems
7 Visual display of current problems
8 Measure cost of problems to the business
9 Survey feedback presentation to all shifts
10 Action Sheet tasks allocated
11 Communication Board updated

© Lifetime Reliability Solutions Change To Win Workbook LRS.CTW.0001 Rev 0
Page 27
3. Step 3: Identify the best practices that prevent the problems We now know what problems need to be addressed by the change project. We know their approximate cost and the effect they have on the well-being of the business. Unless they are addressed the company, and its people, will suffer unnecessary difficulties. One choice for addressing the situation is to tackle each problem individually and solve it. It is possible to improve the organization that way if there are only a few problems. But if you have many problems it will take a lot of time; time during which the industry, the competition and the marketplace will continue to change. So even after fixing all the problems, new ones will have risen to take their place because time, technology and the competition marched-on. 3.1. Fix the Problems; or Change the Business Systems? This is the opportune point to confirm how to best address the problems the organization is looking to overcome. We want to use available time and resources to deliver the best return for the effort. This is achieved by taking the most direct and simplest route to the goal. Do the Pareto Charts indicate that there are only a few big problems, which if solved will fix the business? Or are there too many problems to be tackled at once? If there are only a few problems, then each can be solved individually. Once the problems are solved, the business will be on a better and sounder footing. If instead there are many problems, then the choice is to look for a new way to run the business that gets rid of them all at once – that means changing the way you do business; changing the systems of business. It’s true that organizations regress to safety and conservatism if not constantly challenged. The drawing below shows the remedy that world-class companies use to protect themselves from turning into low performers. They intentionally force themselves out of their comfort zone by setting higher targets and standards to reach. They set higher standards to meet, and then look for ways to reach them.
The Path Taken by Higher Performing Companies
��������������
Pacesetter
Low Performer

© Lifetime Reliability Solutions Change To Win Workbook LRS.CTW.0001 Rev 0
Page 28
This is the path your company has chosen to take - the same path that world-class organisations follow. The ‘Change To Win’ project team now needs to identify the higher standards that the organization will work to so that all its current worrisome problems are overcome. 3.2. Identifying New Standards The Pareto Charts indicated the range of problems in the business’ processes needing to be solved. The organisation’s databases also identified problems affecting those business processes. The team is now required to collate the range of problems that exist and collect them together into clusters of like-problems that can be solved using the same solutions. 3.2.1. Using Affinity Diagrams The method used to develop the clusters is known as Affinity Diagrams. Using the low level Pareto Charts, the team writes the name of each category from each Pareto Chart onto self-adhesive notepapers and puts each notepaper on a clear table or wall. The team works together to move the notepapers into clusters that share common attributes. Orphan problems maybe left over. That is normal. Where there is still disagreement in locating a note in a cluster after open discussion among the team, the majority rules. Finally the team gives each cluster a distinctive, yet representative name. For example all equipment breakdowns could be grouped under ‘Equipment Breakdowns’; all scrapped production and wasted materials could be grouped together under ‘Waste Production’; accidents where people are injured could be grouped under ‘Workplace Injuries’, and so on. The diagram below explains the Affinity Diagram process.
Affinity Diagram Process Steps The Affinity Diagram process compiles many problems across the organisation into a narrow number of business-wide problems. The team can now classify the higher standards it needs to look for to solve the problems by the names given to the clusters.
Step 1 Place notes randomly
Step 2 Cluster notes together
Step 3 Name the Clusters
Name 1 Name 2
Name 3 Name 4

© Lifetime Reliability Solutions Change To Win Workbook LRS.CTW.0001 Rev 0
Page 29
3.2.2. Using Interrelationship Digraphs If the situation arises where there are still too many issues to be addressed, and it is not clear which ones are the most important to tackle first, an Interrelationship Digraph is developed. The Interrelationship Digraph identifies ‘cause and effect’ between the clusters and classifies if one cluster causes another. Thus by addressing the ‘cause’ cluster, both it and the ‘effect’ cluster are resolved in the one effort. The Interrelationship Digraph is developed using the cluster names given in the Affinity Diagram analysis. The names are put in a circle and compared in pairs in a clockwise direction, with the following questions asked of each pair: 1. Does the first Cluster cause/contribute the second Cluster? 2. Does the second Cluster cause/contribute the first Cluster? 3. Is there no relationship? The team seeks consensus on the answer. If after discussion there is no resolution, then majority rule applies. When it is found that a Cluster causes another, an arrow is drawn from the cause cluster to the effect cluster. An arrow can only go one way. An example would be ‘Equipment Breakdowns’ cause ‘Workplace Injuries’ and ‘Waste Production’. The pair-testing is done for each note in the circle until all cause – effect relationships have been established.
Interrelationship Digraph Process Steps The next step is to count how many arrows come into each card, and how many arrows go out from each card, and put the count in a table, like the example below. To check it has been done correctly count that the number of arrows in is equal to the number out.
Step 1 Place notes in a circle and work around the
circle clockwise
Step 2 Ask questions of first pair
and draw arrow from cause to effect, then second pair
Step 3 Complete the pair testing of each note in sequence and draw resulting arrows
Name 1
Name 2 Name 3
Name 4
Name 1
Name 3
Name 4
Name 1
Name 2 Name 3
Name 4
Name 2
1st
2nd

© Lifetime Reliability Solutions Change To Win Workbook LRS.CTW.0001 Rev 0
Page 30
No Cluster Description Arrows In Arrows Out 1 Cluster 1 name 0 2 2 Cluster 2 name 2 1 3 Cluster 3 name 1 2 4 Cluster 4 name 2 0 Total 5 5
The cards with the most arrows out are the drivers. In the table above, Cluster 1 and Cluster 3 are the drivers, and should be addressed first by the ‘Change To Win’ team. 3.3. Identify the Best Practices With the key drivers of problems in the organisation known we can start to look for solutions. The Low Performer to Pacesetter advancement model adopted in the ‘Change To Win’ program requires organisations to adopt new and higher standards that when reached will deliver the goals they want. The team now needs to identify the new standards, the Pacesetter standards, which the operation will put into place. These standards can be found by researching industry knowledge sources. Such sources include your own company information databases and libraries, benchmarking databases, industry forums and societies, published books on the required best practices, gurus in the field of interest, consultants in the required expertise, etc. Using the name given to the key clusters, start the research by putting the names into an Internet browser and investigating the search engine results. It might be necessary to also search by using alternate words that are similar in meaning to the name of a cluster. Other places to search at for reference material include the national and state public libraries, specialist libraries, industry roundtables, specialist web sites, by contacting providers of suitable products and examining their offers, etc. The purpose of the search is to develop a list of sources from which to learn of the higher standards needed by your organization that will solve its problems. As the search progresses more and more sources of information on potential new standards is collected. The Team shortlists possible sources to the three that will be investigated in greater detail, unless it is clear that one Source is the best, in which case that Source becomes the standard to work too.
3.4. Select the New Standard and its Authority With a short list developed, research and investigate each potential source for suitability to use in the operation. It may require combinations of solutions to address problems the organisation wants solved. Once the research is conducted, it is collected together and presented to the team to review, discuss and make a decision on the Source to use. If the team has questions then further investigation can be undertaken. The important criterion for selection of the standard is that it will address the problem the organisation wants to solve.
Task –Team: Appoint two people who are in the best position to research and list suitable standards of best practice that the team can review and short list.

© Lifetime Reliability Solutions Change To Win Workbook LRS.CTW.0001 Rev 0
Page 31
To help select the Source, and ensure it will address the organization’s needs, a criteria table like the one below is developed and then completed by the Team.
Selection Criteria for Best Practice Standards
No Selection Criteria
(What the standard must provide. What problems it must solve.)
Importance to Fix Problem
1 – Low, 3 – Med, 5 - High
Ease to Implement
1 – Low, 2 – Med, 3 - High
Benefit to Company
1 – Low, 3 – Med, 5 - High
Total Importance
x Ease x Benefit
Best Practice Standards Source Selection Criteria Table 3.5. Gap Analysis - Check New Standards Solve the Problems The Team must be confident that the new standards can deliver the necessary changes. The best practices to be introduced to meet the new standard can be compared to the current practices and rated for their ability to solve current problems. A rating table, like the one below, is developed from information collected during the prior analysis and completed by the Team.
Rating Table for Best Practice Standard
No Current Problem (from Affinity Diagram)
Problem Symptoms (from database or survey analysis)
Best Practice to Use (from Source/Authority)
Solution Match L/M/H
Comment
Bearing failures H Oil contamination M Late customer deliveries M
1 Equipment Breakdowns
High maintenance overtime
Lube management program
H
New best practice is clearly an
improvement
2 Cluster 2 name
3 Cluster 3 name
Best Practice Gap Analysis Table Alternately the Team develops and completes the check table below to grade the suitability of the standard to address the core problems identified by the Affinity Diagram process in Step 3.
If the fit is poor between the proposed standard and the problems it must fix, the team repeats Step 3 to find a more suitable standard, or group of standards, having better understood the requirements.
Check on Best Practice Standards Addressing the Problem
No Test Criteria (The problems the standard must solve.)
Ability to Fix Problem 1 – Low, 3 – Med, 5 – High
Cost to Implement
1 –High, 2 – Med, 3 – Low
Benefit to Company
1 – Low, 3 – Med, 5 – High
Total Ability x Cost
x Benefit

© Lifetime Reliability Solutions Change To Win Workbook LRS.CTW.0001 Rev 0
Page 32
3.6. Purchase the Standards and Sources of Best Practice The Team Leader arranges for the agreed standards to be purchased and made available to the team. With the Source for the standard selected and purchased, it now becomes the Authority that the organisation will use to set its own standards. The Authority contains details on the level of excellence that the organisation wants to achieve, which when achieved will: • prevent the current problems it now suffers, • allow it to become a Pacesetter in its industry, or • introduce new innovations to distinguish it from competitors. How the Authority will be applied and used in the company is the next task the Team will decide and then develop.

© Lifetime Reliability Solutions Change To Win Workbook LRS.CTW.0001 Rev 0
Page 33
3.7. Step 3 Completion Checklist Step 3 is complete when the following outcomes are complete:
Item Outcome
1 Decided to change the business systems (else fix problems with a problem solving method)
2 Problems clustered together by attributes
3 Key problem Clusters are identified
4 List of suitable standards are finalized
5 Source/Authority for the standards is selected
6 Best Practice Gap Analysis confirms suitability
7 Standards purchased
8 Action Sheet tasks allocated
9 Communication Board updated

© Lifetime Reliability Solutions Change To Win Workbook LRS.CTW.0001 Rev 0
Page 34
4. Step 4: Develop the Future State with new Best Practices Now that you know what the new ‘Pacesetter’ standards are, it is necessary to confirm that they will solve the problems affecting the company. The simplest way is to use the team to gauge the effectiveness of the standards in solving the problems. Because the Team is people from throughout the business, it can take a multifaceted view of the new standards usefulness to the organisation. If the team has confidence in the new standards, then the standards are highly likely to be successful. 4.1. Develop the Route Map
Next the team develops a plan to incorporate the new standards into how work will be done in future. Using the new standards is the vision for the future of the organisation. The gap between today and tomorrow needs to be bridged, and the team’s role becomes to chart the course to the vision; to provide a ‘route map’ of how to get there. Once they have developed the ‘route map’ they present it at the management presentation to inform them and get their input and support. The above diagram is a visual representation of a ‘route map’ to the Future State for an organisation. The ‘route map’ is the step by step plan to be followed to make the new standards the company’s standard operating practices. Also known as ‘line of sight’ goals it is simply a bar chart of the tasks to be done and the sequence to be followed, so that at their completion, the new best practices are in use by the people in the organisation. Below is an example of a bar chart with headings. A cost estimate is required for each task and at this stage the estimates are based on teams combined experience. If it is necessary to be more certain in a cost estimate, then the most appropriate team member is tasked with developing the detailed estimate. The costs will be also be needed by the team for a cost benefit analysis of the ‘Change To Win’ project.
PACESETTER Clear business
goals
Teamwork
Problem solving skills
Trial standards
Set Standards
Manage risk
Competence & training
Simplify business practices
Empowerment
Benchmarking
The Route Map
START
Manage data
Procedures

© Lifetime Reliability Solutions Change To Win Workbook LRS.CTW.0001 Rev 0
Page 35
Line of Sight Route Map
No Task Description By Who
Cost Estimate Time Period
Month 1
Month 2
Month 3
Month 4
Month 5
Month 6
Month 7
1 Clear business goals X
2 Set Standards X X
3 Develop Procedures, Work Instructions X X X X X
4 Conduct trial X
5 Build Competence with in-house Training X X X
6
7
4.2. Key Performance Indicators If there is confidence that the new standards will solve the problems they are expected too, then there will be clear evidence that improvements have resulted by their use. The amount of improvement needs to be measured and trended to confirm that the effort to change standards was worthwhile. This requires the use of one or more key performance indicators (KPI) that the team can calculate, and then monitor, what impact the improvement in standards have on the relevant KPI measures. The improvement can also be expressed in financial gains, which is the universal language of business. Management will be greatly interested in the financial estimates. The financial impacts are best expressed as dollar savings. For example some typical areas where savings can be had are: �Material savings �Energy savings �Time savings �Quality savings There can be large, unexpected financial gains from the ‘Change To Win’ project. Major extra financial benefit will result if more of the market can be supplied, or there is increased output. Select KPIs that are appropriate to the business. A type of KPI that is often suitable and easy to trend is of the form:
Unit Cost = Cost to Produce No of Units
The financial gains can be calculated by using a cost/benefit analysis, as explained below, and are shown at the Management presentation.
Task –Team: Develop the ‘route map’ and its bar chart that will be used by the operation to guide it to the future state where its standards and practices will deliver pacesetter performance.
Tip: These KPIs need to represent what happens in the workplace because of the changes. They likely are different to the corporate KPI’s set by management to monitor project results on business. They will be predictive in nature e.g. No. ACE 3T procedures in use; No. people trained; etc

© Lifetime Reliability Solutions Change To Win Workbook LRS.CTW.0001 Rev 0
Page 36
4.3. Cost Benefit Analysis Cost/Benefit Analysis is a simple technique widely used for deciding the value of a particular action to improve business or process performance. As the name suggests, the technique is to tally the value of the benefits of a course of action, and subtract the costs associated with it. Costs are either one-off, or may be ongoing. Benefits are most often received over time. The effect of time in the analysis is handled by calculating a pay-back period. This is the time it takes for the benefits of a change to repay its costs. Many companies look for pay-back over a specified period of time - three years is common. In its simple form, cost/benefit analysis is carried out using only financial costs and financial benefits. For example, a simple cost/benefit analysis of a production improvement would measure the total cost of the improvement, and subtract this from the expected benefit of the improvement. Things to consider when doing a cost benefit analysis for a ‘Change to Win’ project: Costs: �Purchase of equipment � Labour to develop the standards, including
indirect costs, such as senior management time �Cost of training
Benefits: �Reduced production time losses �Reduced maintenance �Reduced scrap
�Reduced Quality cost �More sales
In addition to the tangible financial benefits of the team’s proposals, they also need to identify “intangible” benefits – i.e. benefits that cannot be measured, but are, none- the-less, important for the business. Examples on intangible benefits: �Safety �Quality �Morale
�On time Delivery �Predictable Production performance �Customer Satisfaction
The estimated costs to use in the cost/benefit analysis are those identified in the ‘Line of Sight Route Map’ completed previously. The benefits will be the savings expected to be gained by implementing the ‘Change To Win’ project. These can be estimated from the reduced costs of the problems calculated in Step 2. Exactly how much of the costs caused by the problems will eventually be recovered by the ‘Change To Win’ project will only be known after a year or two of use. For the sake of the cost/benefit calculations, use 25%, 50% and 75% of the identified problem costs and workout the cost/benefit in each case. This approach of using a range of possible outcomes is known as a ‘sensitivity analysis’ and provides a better appreciation of the variability in outcomes and a better understanding of the payback for the amount of effort spent installing the new standards and practices. Example: A manufacturing company has $500,000 a year in breakdown repair costs (not the same as preventative maintenance costs). They want to introduce a ‘Change To Win’ project to reduce the breakdowns and the team expects to save 50% of annual breakdown costs. To install the necessary

© Lifetime Reliability Solutions Change To Win Workbook LRS.CTW.0001 Rev 0
Page 37
programs, do the training and buy equipment will be $150,000 in the first year. The cost/benefit analysis is shown below: Costs: Improvement program = $150,000 Benefits: 50% reduction in breakdowns annually = $250,000 Cost/Benefit (Payback) = $150,000 / $250,000 = approx 8 months. If savings were only 25 %, the payback would be about 14 months. If they were 75%, the payback would be as good as around 5 months. If the company’s payback period was 3 years, then this project should go ahead immediately.
4.4. Identify the Procedures to Update Ultimately the new standards have to become what people do. This is done by writing the new standards into departmental procedures, work processes and employee work instructions. One of the important outputs from the team will be updated procedures with the new standards imbedded within them. First it is necessary to identify what procedures and work instructions need to be changed. Appoint team members to use the current state process maps from Step 2 to identify the process steps that will be affected by the new standards and make a list of them all. The easiest way is to write the processes affected, and then under each one write its respective process steps, and below each process step list the procedures and work instructions that currently exist for that step. If there are no documented procedures and/or work instructions for the steps then the team will need to write them as part of the ‘Change To Win’ program.
In this step the new and revised procedures will be drafted to a special formula that gives users the maximum chance of doing them well every time, always with outstanding quality. 4.5. Draft ACE 3T Procedures ACE stands for ‘Accuracy Controlled Enterprise’ in the case of a business or ‘Accuracy Controlled Expert’ for an employee. It is the recognition given to companies that use accuracy controlled procedures throughout their business and to people that do their work by using the 3Ts of failure prevention. ACE procedures are specially formatted using a particular layout and method to help people do excellent work. They use the 3Ts– Target, Tolerance, Test – to eliminate defects and prevent problems starting.
TIP: If you have a quality management group or manager they can provide you with copies of the current procedures and work instructions.
Task –Team Leader: Now that there is a clear picture of what to focus on and measures for improvement are set, it is important to communicate it to the areas affected. At a minimum a clear project description and target of improvement should be posted on the communications board.

© Lifetime Reliability Solutions Change To Win Workbook LRS.CTW.0001 Rev 0
Page 38
Once the total number of procedures and work instructions is known, their rewriting into ACE 3T format is shared out between the team members whose duties include drafting of procedures. Where possible cut and paste existing procedures and work instructions into a new document laid-out in the ACE 3T format shown below. If members are not able to write them directly into a computer they can write them by hand and pass them to a secretarial resource to type. A standard operating procedure will typically contain all the instructions to do a complete job from start to finish. The instructions are broken down into separate tasks. Each task is an action to be performed. When each task is completed properly, in the right order, on time, the job is done successfully. It is the duty of the SOP writer to deliver success to all users every time the job is done. Your aim with a SOP is to get the job done right first time. You need to get ideas and concepts clearly into people’s brains fast. An ACE 3T SOP layout style and content is shown in the figure below and a more complete example is in Appendix 1. Task Step No.
Task Step
Owner
Task Step
Name
Tools &
Equip Full Description of Task Test for
Correctness Tolerance Range Record Actual Result
Action if Out of
Tolerance
Sign-off After
Complete (Max 3
– 4 words)
(Include all tables, diagrams and pictures here)
Good Better Best
4.6. Imbedding the New Standards into Procedures The ACE 3T procedure format uses the ‘best’ column to identify the ideal result from using the new standards and practices. In this column write the perfect result that the task can deliver. This is the best results that the Authority says is possible to achieve. It will be necessary to research the Authority in detail, and even to look at other information sources, to make clear what ‘best’ is. In the ‘good’ column write the minimum requirements permitted from the task. For the ‘better’ column write the outcome that best represents a clear improvement from the ‘good’ level on the way to becoming ‘best’. In the ‘Test for Correctness’ column write the method used to check the task is done right. Record the test results in the ‘Record Actual Results’ column. Once the results are available the Procedure User checks their work quality by comparing it against the ‘good’ and ‘best’ requirements. The task is only completed when the ‘good’ requirement is met. It is completed expertly only when the ‘best’ result is met. Anything below ‘good’ is not ‘good enough’. Advise Procedure Users in the ‘Action if Out of Tolerance’ column what to do if the task is producing less than ‘good’ results. The beauty of the ACE 3T failure prevention method is its powerful influence for increasing the likelihood of good outcomes. It is a proactive control measure that drastically reduces defect creation and the future failures they cause. The 3T’s – Target, Tolerance, Test – provide statistical control over a task by setting clear performance requirements, installing control limits and specifying measures to track performance. Developing procedures that ensure accuracy by imbedding targets, tolerance bands and tests in tasks is a highly secure way to meet specifications. They remove uncertainty of outcome. With sound targets and proof-testing used in your business processes, your organization moves from being uncontrolled, or at best quality-conscious if a quality management system is used, to being truly an accuracy-controlled enterprise, an ACE. Without any additional costs and demands on the
Tolerance
Target
Test
© Lifetime Reliability Solutions Change To Win Workbook LRS.CTW.0001 Rev 0
Page 39
organization, except to include the 3Ts into its standard operating procedures, and where needed, providing appropriate test devices, a business can be well-protected against all defects and failures. With 3T defect elimination and failure prevention methods overlaid on standard operating practices the possibility of problems developing and getting deep into a business are greatly reduced. The business systems shrink in complexity because each person is now clearly responsible for product quality and conformity. Now the quality checks are not needed at the completion of a process step because the quality is in-built into the actions and behaviours of every process step. Accuracy and quality are inherent in the Ace 3T system of work and become the only acceptable way to do a job. The first author ought to be the current ‘expert’ on the job. If the job is currently being done, then the person who does the job should be the SOP author. The team members tasked with writing ACE 3T procedures will need to go to the people doing the procedure to check that it is thorough and complete. Where the present job incumbent does not deliver the best results ask them to help draft the procedure and then complete it with the person who is best at it to refine and finalize. This will save face for all concerned while getting the best ideas from all people. If a procedure writer can write well, then give them the time to draft the SOP using the ACE 3T layout. If the person cannot write well then select a suitable writer and have them interview the persons who do the job best. It may even be necessary to get an expert from outside of the organization to write the procedures. As the procedural task steps are written include the best practice requirements from the Authority on the subject. You want to get the best practice currently available, and, if necessary, the best practices may have to be brought into the business from outside. Another person with the relevant experience then checks the draft SOP to confirm and endorse the documented steps. If the SOP is critical to health and safety, or to the success of a business initiative, it should be thoroughly reviewed and analysed by resident and invited experts. This may include having meetings where the SOP is analysed in great detail to establish the risk and consequences of it being done wrongly. If the consequence of an error is catastrophic, it is necessary to include control points and third-party checks into the procedure to keep full command of the job. If the job has not been documented before then a SOP will need to be written for it. If the job is similar to existing jobs with SOPs then the new one can be based on them and incorporate changes to suit the requirements of the job tasks. If there are people experienced in the work being documented they should either write the draft SOP, or be interviewed for their suggestions. If necessary bring-in help from outside of the organization. Where possible existing experience should be used to refine the draft ACE 3T SOP and improve the chance that it will work well from the start.
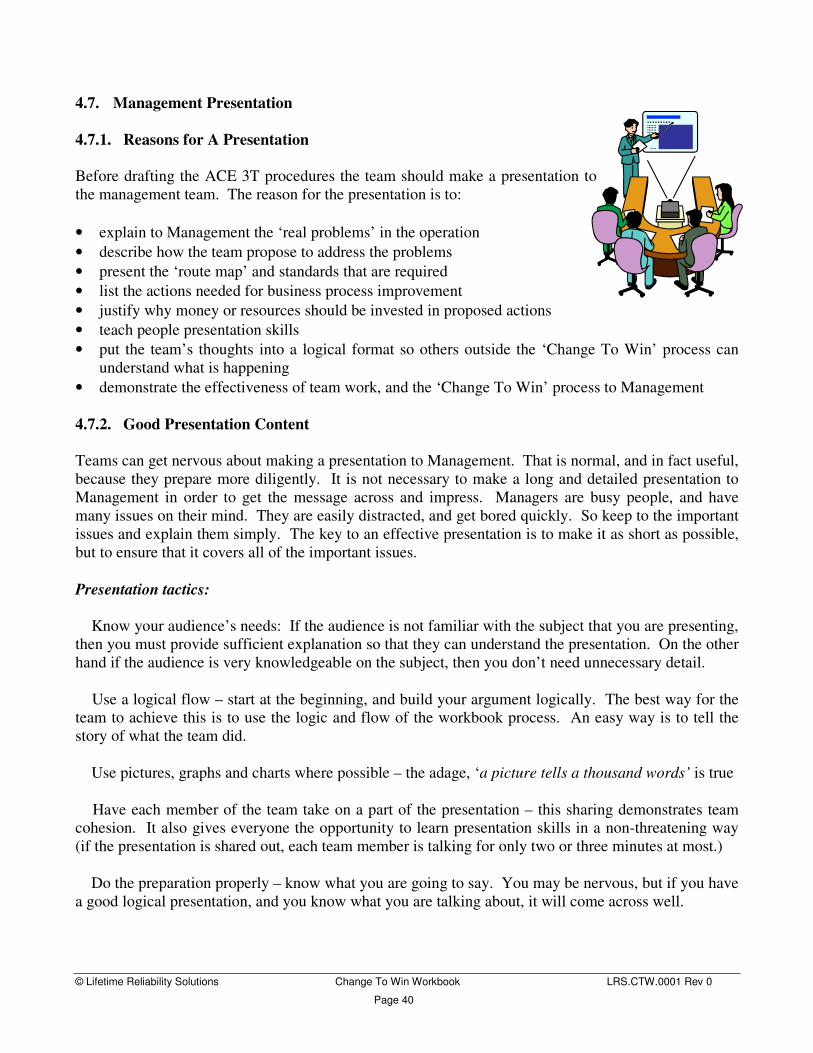
© Lifetime Reliability Solutions Change To Win Workbook LRS.CTW.0001 Rev 0
Page 40
4.7. Management Presentation 4.7.1. Reasons for A Presentation Before drafting the ACE 3T procedures the team should make a presentation to the management team. The reason for the presentation is to: • explain to Management the ‘real problems’ in the operation • describe how the team propose to address the problems • present the ‘route map’ and standards that are required • list the actions needed for business process improvement • justify why money or resources should be invested in proposed actions • teach people presentation skills • put the team’s thoughts into a logical format so others outside the ‘Change To Win’ process can
understand what is happening • demonstrate the effectiveness of team work, and the ‘Change To Win’ process to Management 4.7.2. Good Presentation Content Teams can get nervous about making a presentation to Management. That is normal, and in fact useful, because they prepare more diligently. It is not necessary to make a long and detailed presentation to Management in order to get the message across and impress. Managers are busy people, and have many issues on their mind. They are easily distracted, and get bored quickly. So keep to the important issues and explain them simply. The key to an effective presentation is to make it as short as possible, but to ensure that it covers all of the important issues. Presentation tactics: � Know your audience’s needs: If the audience is not familiar with the subject that you are presenting, then you must provide sufficient explanation so that they can understand the presentation. On the other hand if the audience is very knowledgeable on the subject, then you don’t need unnecessary detail. � Use a logical flow – start at the beginning, and build your argument logically. The best way for the team to achieve this is to use the logic and flow of the workbook process. An easy way is to tell the story of what the team did. � Use pictures, graphs and charts where possible – the adage, ‘a picture tells a thousand words’ is true � Have each member of the team take on a part of the presentation – this sharing demonstrates team cohesion. It also gives everyone the opportunity to learn presentation skills in a non-threatening way (if the presentation is shared out, each team member is talking for only two or three minutes at most.) � Do the preparation properly – know what you are going to say. You may be nervous, but if you have a good logical presentation, and you know what you are talking about, it will come across well.

© Lifetime Reliability Solutions Change To Win Workbook LRS.CTW.0001 Rev 0
Page 41
4.7.3. Typical Elements Of A Team Presentation
• Welcome, meeting purpose and introduction to project
• Show team photo, team name and members
• ‘Change To Win’ Team Boundaries � Team Objectives � Current State Summary
a. Lost Time b. Wastes c. Production Rate d. Quality e. Others
• Survey Summary
a. Pareto Charts b. Analysis of costs c. Problem prioritisation
• Standards Review Summary
� Proposed Solutions List a. Cost Benefit Analysis b. Resource Requirements Summary c. Implementation plan
• Route Map
a. Future State b. Procedures to be updated
• Lessons Learnt to Date
• Where to Next?
Remember to also need to make a brief presentation to the other shifts.

© Lifetime Reliability Solutions Change To Win Workbook LRS.CTW.0001 Rev 0
Page 42
4.8. Step 4 Completion Checklist Step 4 is complete when the following outcomes are complete:
Item Outcome
1 Confirm Standards will address the problems
2 Select Key Performance Indicators
3 Route Map developed
4 Identify the procedures to be updated
5 Management presentation
6 Procedures drafted to ACE 3T format
7 Action Sheet tasks allocated
8 Communication Board updated

© Lifetime Reliability Solutions Change To Win Workbook LRS.CTW.0001 Rev 0
Page 43
5. Step 5: Make Best Practices the Standard Operating Procedures in the Workplace During the remainder of the project the team tests the new ACE 3T procedures, makes necessary changes, and proves that they consistently deliver better results. This is a stage of experimentation, discovery and learning. Careful planning, tight control and vigilant monitoring are required when testing in order to be certain that the results are truly caused by the ACE 3T procedures. At the end of this Step a final presentation is given to Management during which the results of the test, and the learning from it and the project, are presented. 5.1. Implementation Plan About five to six weeks remain in the project timetable. During the time remaining the team must put the procedures into use, measure their effect on performance, if necessary refine them and retest. To be effective in the time remaining, an plan implementation needs to be developed, including time to review progress and learning. As with previous project plans, a bar chart is the preferred planning tool. Time is the most limited resource. The assumption is often made that following the decision to implement the procedures, there is time to do it. However, many of the necessary actions can fall to a few team members who are already busy unless a workable plan is agreed. The team needs to identify all of the necessary manpower resources, the required parts, materials, and equipment not already close-at-hand, and then make sure that they are available for the project. Any special training required to implement the new procedures must be identified and this may mean bringing in additional resources to complete the project, and to do training. The bar chart example below shows how to layout the tasks and duties in the implantation phase of the project so they can be monitored and managed. By representing the implementation in this format, the team can check that the work-flow is logical, ensure that labour resources are not over-extended, and follow progress against plan during the remainder of the project.
Project Implementation Plan
No Task Description By Who
Needed Resources Time Period
Week 8
Week 9
Week 10
Week 11
Week 12
Week 13
1 Explain procedures and trails to all shifts
2
3
4
5 Review implementation & make adjustments
6
7
Management Presentation

© Lifetime Reliability Solutions Change To Win Workbook LRS.CTW.0001 Rev 0
Page 44
As part of preparing the plan ask: • When can we organise the right people to do the work? • Do we have the test equipment required? • Do we need additional training on specific equipment and methods? • Do we have permission from management to access the plant? • What is the sequence to apply to the plan? • Have we informed all the right people? Keep people informed: Review key indicators on an agreed frequency, update notice boards, include comments in briefings, even consider having frontline people do their own performance tracking – it is a very powerful way of maintaining the gains, and developing ownership. 5.2. Training The team needs to consider whether there is a need to train employees on changes to processes or procedures, especially if new test equipment is being used. Training should be simple and straightforward, done on–the-job, face-to-face if at all possible. Short training period of 15 to 20 minutes should be used to cover most issues involved with implementing the new procedures, especially since ACE 3T procedures have a clear and simple layout to follow. Also consider: • Plans to retrain existing employees • Competency check lists for employees being trained in the future • Training records to ensure that everyone has been through the necessary training. If training is required for special equipment, then organize for the training to be done by the equipment/service provider and to ensure people pass a minimum level of competency so they are comfortable using the equipment when doing the new procedures. People will get better at doing tasks as they get more on-the-job practice. 5.3. Workplace Implementation Once the plan is in place, double check that it is ready to go and fix a time, place and people to start implementing it in the workplace. Put the plan on the Communication Board for all to see. The team must track progress against the plan and be prepared to help out if something unexpected occurs. Extra resources, more on-the-job training or rescheduling may be required. This will show up when reviewing the implementation plan during the remaining meetings. Colour the bars on the bar chart for a graphic way to track progress, and communicate progress to others. It is also necessary to track the project costs to compare them against the estimate. If costs are going to considerably exceed the original cost, then advise management and seek their approval. Tracking cost is important if the project expenditure is to be capitalised and identified in the accounts as assets. In this case the Accounting Department will require a detailed account of all of the expenses.

© Lifetime Reliability Solutions Change To Win Workbook LRS.CTW.0001 Rev 0
Page 45
5.4. Communicate the Changes A most important factor in any change management process is to make sure all relevant people are aware of what the team is up to. The reason for doing this is that by discussing the proposed changes there maybe valuable feedback that will prevent problems during the trails. However, the most important reason is to make sure that everyone knows why the changes are necessary and what the benefits will be. The honest truth is that if everyone agrees with the changes, then there is a far better chance that they will be successful. What to do: • Make a list of all the people who need to be aware of the work to be carried out. • Determine what people need know. • Work out how to communicate to them. • Schedule team members to inform those people • Seek feedback from people
� Face to face meeting � Toolbox meetings � Department meetings
� Group presentations � Memos and notices � Emails
5.5. Tracking Results During Step 4 KPIs were established to monitor the performance of the ‘Change To Win’ project. It is important to make sure those measurements are collected and tracked. Make sure the right information is collected and displayed in a graph to show how the project performs. The team may need to consider: • Do we need to change any of our measurement parameters? • Who is responsible for updating the information? • Is it possible to automate the data collection process? • Who should see the information? • Where should the information be displayed, who should see it? The other important issue to monitor is whether the predicted financial benefits are being achieved. As the actual costs and operational results become known, an actual cost/benefit can be calculated and compared to the cost/benefit analysis from Step 4. If the results are not up to what was originally predicted, either operational and/or financially, then there will need to be a review of the original investigations, and identify where they were misjudged. If the results are not what were expected, then there are a number of possible reasons: � the new procedures put in place did not eliminate/reduce the root cause of the problem � the real/most important root causes were not identified � the new procedures were not the appropriate ones to fix the root cause of the problem If there is still time, the team can revisit their previous work on selecting procedures to solve the problems. If not, the team can develop recommendations for future work as part of continuing improvement.

© Lifetime Reliability Solutions Change To Win Workbook LRS.CTW.0001 Rev 0
Page 46
5.6. Replicate Changes Throughout the Business The project has likely achieved some big improvements. These need to be extended to other parts of the business that will benefit from them, as a well as continuing the program of introducing ACE 3T procedures to other duties. The team should be able to: � Identify other parts of the business that may benefit by learning from the project. � Identify other processes in the operation that would get value from using ACE 3T procedures � List the names of people who should be contacted. � Discuss how to communicate the project outcomes, and stimulate their interest. � Consider if it is useful to promote the project on the company intranet. 5.6 The Project Summary Report A record of the project achievements is made in a Project Summary Report. This is included in the final presentation, and a copy on the communication board. The project summary report is useful to management for justifying starting new project teams. The complete report fits on a flat A3 sheet of paper so that all the important information is seen on one page. The report contents include:
• Project Objective • Team Member names • Project Benefits • Major Achievements
• Before and After tables/charts • Graph of KPI measures • Project status of the at end of 100 days • Recommendations
Develop a communication plan to inform all stakeholders about the results of the project. Include presentations to other shifts. 5.5 Final Presentation The last-week includes the final presentation to Management at which project benefits are outlined and what has been achieved explained, or if not, why not. The final presentation typically includes:
• Summary of the first presentation
• The Implementation Plan
• Project Results o Actual improvements against expected o Implementation cost compared to actual o Project Summary Report
• Methods employed to make the changes permanent
• Learning from the project
• Recommendations to progress forward o What of the next cycle? o How far to extend the project?

© Lifetime Reliability Solutions Change To Win Workbook LRS.CTW.0001 Rev 0
Page 47
5.7. Step 5 Completion Checklist Step 5 is complete when the following outcomes are complete:
Item Outcome
1 Implementation plan developed
2 Changes communicated to people
3 Training conducted
4 Results of new procedures captured and tracked
5 Project Summary report written
6 Final Management Presentation
7 Action Sheet tasks allocated
8 Communication Board updated

© Lifetime Reliability Solutions Change To Win Workbook LRS.CTW.0001 Rev 0
Page 48
Appendix 1 – Sample ACE 3T Standard Operating Procedure Flange Connection 3T Failure Prevention SOP with Tolerance Banding This is an example of an Accuracy Controlled Enterprise (ACE) 3T procedure with tolerance bands to bolt together 80 NB ANSI B36.5 forged steel Class 150 flanges. Each task has a target with the allowed limits banded into ‘good, better best’. Instruction is provided if the tolerance is not achieved. Please note that the example covers the method to use and is not the complete procedure. Flange Connection Procedure Importance of correctly mating flanges: This procedure explains how to correctly bolt-up a pipe flange on 80mm (3”) diameter pipe. Leaks of dangerous chemicals from pipe flanges create a safety and environmental hazard that can lead to death of workmates and the destruction of production plant and equipment. Even a water leak from a flange causes slip hazards and makes an unsightly mess. Pipe flanges must be bolted-up so they never leak. This procedure is our current best practice and you should follow it exactly. It is the result of many people’s efforts over many years. It is the quickest, best way yet found to do the job right first time. Please do the job exactly as it is explained in this document. If after you have mastered this procedure exactly as it is written, you believe that you know of improvements that can be made, please bring them forward for discussion. You will be allowed to test your ideas and compare them to the procedure. If your suggestion proves to be better, it will become the new way to do this job. Necessary Equipment and Tools: Gasket, ring spanners (adjustable shifters and pipe wrenches are not to be used as they damage corners of bolt heads and nuts making their removal dangerous and unsafe), suitably load-rated studs and nuts, pencil. Task Summary The process of installing gaskets and making flanges is summarized below. A fully detailed procedure is presented beneath the list. If an error occurs that you cannot solve please see your supervisor.
1. Get work pack, tools, NEW fasteners and NEW gasket
2. Get safe handover isolated and pipe drained
3. Place personal danger tags test if drained
4. Break and spread flange safely
5. Clean-up flange faces
6. Check unrestrained pipe alignment
7. Mount gasket and insert fasteners
8. Pull-up fasteners snug tight in sequence
9. Mark nut position and turn angle past snug
10. Turn nuts to position in sequence
11. Test flange for leakage at operating pressure
12. Safely clean-up, hand-back, complete job record and sign-off Work Order

© Lifetime Reliability Solutions Change To Win Workbook LRS.CTW.0001 Rev 0
Page 49
Step Task Description Material / Tools Tolerance Bands Good Better Best
Reading / Result
Action if Out of Tolerance
Sign off
1
Gather together NEW studs and nuts, gasket, thread paste, tools, job work order, danger tags, handover permit,
special instructions,
5/8” ring spanner, podgy spike bar, screw driver, scraper
Request & collect issued
items from store
Planner arranged all
items ready for issue from Store
Planner has all items at job and
job is ready to do
Only start work once all
requirements are gathered together
2 Contact Operations personnel responsible for plant isolations and handover
Contact Operator when ready to start
job
Operator has plant off-line
awaiting work
Operator has plant isolated, tagged
and drained
Job can only start when Operations safely handover plant and piping
3 Place personal danger tags at isolation points and accept plant handover after
proving isolations and drainage Danger Tags
Operator and repair man walk
circuit and identify and tag isolations and open drains
Operator has isolated plant &
tagged isolations out-of-service &
drained piping
Operator provides isolation point drawing and
walks circuit to show previous
tagged isolations and open drains
Only start work when piping is
fully drained and proven to be empty and
possible gas build-up vented
4
Release tension on exiting fasteners gradually in tightening sequence and then remove one fastener at a time but leaving the last fastener loosely in place if pipe
springs unexpectedly, spring flanges with podgy bar
5/8” ring spanner, anti-seize liquid
Back-off all nuts half a turn in sequence and then a full turn,
removing all fasteners but
last one. Spring flanges with
podgy
Back-off all nuts half a turn in sequence and then a full turn, catch any drops from flange in
suitable container, remove all
Cover fasteners with anti-seize,
back-off nuts half a turn in sequence
and then a full turn, catch any
drops from flange in suitable
container, remove
If flange does not spread easily
review the situation and
consider use of hydraulic spreader or wedges without damaging flange
faces
Engineering Standards Flange Squareness: Good: Within 1mm for every 200mm diameter Better: Within 0.75mm for every 200mm diameter Best: Within 0.5mm for every 200mm diameter Stress-free Flange Bolt Hole Alignment: Good: Centers within 2mm Better: Centers Within 1.5mm Best: Centers within 1mm Bolt Lubricant: Molybdenum disulphide
Bolt Size Bolt Grade Bolt
Torque Tolerance on Torque
5/8” A193 B7 stud and nut
201 Nm (60% Yield)
+- 25% with Torque Wrench
½ turn from snug tight
Between ½ to 5/8th turn
Gasket: Non-asbestos fiber, 1.5 mm thick, ring, grade as noted on work order
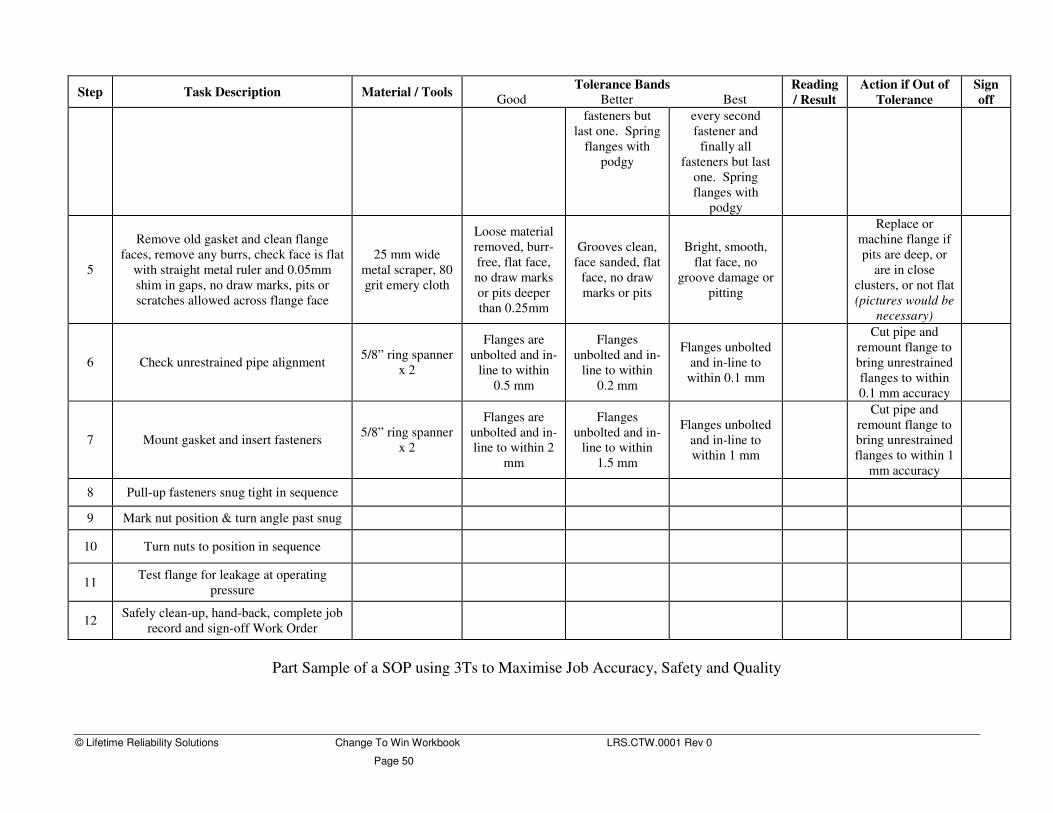
© Lifetime Reliability Solutions Change To Win Workbook LRS.CTW.0001 Rev 0
Page 50
Step Task Description Material / Tools Tolerance Bands Good Better Best
Reading / Result
Action if Out of Tolerance
Sign off
fasteners but last one. Spring
flanges with podgy
every second fastener and
finally all fasteners but last
one. Spring flanges with
podgy
5
Remove old gasket and clean flange faces, remove any burrs, check face is flat
with straight metal ruler and 0.05mm shim in gaps, no draw marks, pits or scratches allowed across flange face
25 mm wide metal scraper, 80 grit emery cloth
Loose material removed, burr-free, flat face, no draw marks or pits deeper than 0.25mm
Grooves clean, face sanded, flat
face, no draw marks or pits
Bright, smooth, flat face, no
groove damage or pitting
Replace or machine flange if pits are deep, or
are in close clusters, or not flat (pictures would be
necessary)
6 Check unrestrained pipe alignment 5/8” ring spanner x 2
Flanges are unbolted and in-
line to within 0.5 mm
Flanges unbolted and in-
line to within 0.2 mm
Flanges unbolted and in-line to
within 0.1 mm
Cut pipe and remount flange to bring unrestrained flanges to within 0.1 mm accuracy
7 Mount gasket and insert fasteners 5/8” ring spanner x 2
Flanges are unbolted and in-line to within 2
mm
Flanges unbolted and in-
line to within 1.5 mm
Flanges unbolted and in-line to within 1 mm
Cut pipe and remount flange to bring unrestrained flanges to within 1
mm accuracy
8 Pull-up fasteners snug tight in sequence
9 Mark nut position & turn angle past snug
10 Turn nuts to position in sequence
11 Test flange for leakage at operating pressure
12 Safely clean-up, hand-back, complete job record and sign-off Work Order
Part Sample of a SOP using 3Ts to Maximise Job Accuracy, Safety and Quality

© Lifetime Reliability Solutions Change To Win Workbook LRS.CTW.0001 Rev 0
Page 51
Standard operating procedures have two lives. The first life starts with its writing by the original author. The second life starts when the people working with it put it to use and begin to improve it. Often a team based approach when drafting a SOP will draw out many details that one person working alone would never know. A team approach for SOP writing builds ownership from future users. It also allows the benefits of brainstorming to be used in simplifying tasks and reducing the time needed to perform a job. If you need a larger page size to achieve that then take the space you need. There is no need to only work to a standard sized page layout. Use A3 size pages if needed. Use landscape position freely. The second life for a SOP starts when it is put to use. From that point onward the person(s) doing the job becomes the author. They are the new ‘experts’, as they will grow to know the job closely. Once they have mastered it they will use their initiative to continuously improve practices and discover better ways. Every improvement that they make must be written into the SOP so the knowledge is forever caught and can be used in future by new users. This way a new employee starts with all the learning made by the others before them. Too many people miss out on the greatest value of a SOP. They write the SOP and train people on it, then think that the job of the SOP is done once the training finishes. They completely miss out on its greatest worth. A SOP is the one place where all the knowledge of a job resides. It contains a storehouse of experience; it is a fountain of knowledge. It should house the organizations best, most successful practices! Your SOP’s are the residence of much corporate knowledge. An SOP is continually improved and updated as better ways are learnt to do it. It is updated when faster ways are found, or when new technology is introduced. They have the power to turn a business into a world-class operation where learning is encouraged and passed quickly into use. SOP’s can control quality regardless of who does the work, or in which country it is done. A SOP is a most powerful tool in a proactive manager’s tool kit. The second life of a SOP ends only when the job no longer exists. Start With a Summary, End with the Facts A SOP starts with an introduction to the job, its purpose and objectives, and its critical value to the company. The introduction includes how the job benefits others inside and outside the company if it is done well. Also included in the introduction is advice about what happens to others in the supply chain if the job is not done properly. List all the people who will use the information derived from the job covered by the SOP, or who are affected by the actions performed in doing the tasks. Make it clear to users of the SOP that what they are doing is vitally important to get right and to do it well. If you can include personal and financial costs of an error in the job it will provide substance and belief for the user. Let them know how the SOP impacts people when the job is done well and it is finished correctly. Let them know what problems will occur if the job is done poorly. The user of the SOP needs to appreciate the consequences of their performance. A sample introduction can be found in Appendix 1. List all Tools, Equipment and References The entire range of tools, equipment, templates, reference materials, etc need to be listed in check sheet format so that the SOP user can confirm they are available and knows where to find them. Against each item record the condition required of it before it is used to do the job. If it is necessary to have equipment meet a certain minimum service level for safety or legal requirements, then include steps in the SOP to prove the necessary level of compliance. When the validity of

© Lifetime Reliability Solutions Change To Win Workbook LRS.CTW.0001 Rev 0
Page 52
information is to be checked before use, make the confirmation part of the procedure. Get the user to sign-off that they have done the compliance checks. If tasks require high accuracy the tools used in the SOP must be capable of the necessary precision. Include a step in the SOP to confirm the accuracy of equipment and get the signature of the SOP user to ‘prove’ they did the step. If certification of equipment to a standard is required then ensure the SOP user checks the certification as one of the steps in the SOP. If the item does not meet the minimum condition, then it is necessary to fix it or replace it before the job can start. Be Totally Complete (Don’t only write it, show it.) An important issue in writing SOP’s is whether the users can read well and they understand what is written. What levels of education have they, and are they really at the level of assumed ability? What is their first language? Many people get through life with a poor education and poor reading ability. If you want a job performed well it is best to assume that the SOP user may not know the written language as well as the SOP writer. In that case use simple words. Aim for an eight-year-old to ten-year-old level of language. Continually use short sentences of no more than ten to fifteen words long. Explain only one thought per sentence. Detail only one action per task step. Keep the text large so it is easy to see, minimum 12-point font, even 14-point font for elderly persons. Don’t just use words. Use plenty images to explain words, such as photographs, computer screen dumps, sample calculations, sample spreadsheets, flow charts, etc. You cannot have too many examples of the correct thing to do and the correct way to do it. If variations are expected then provide instructions and examples of all variations encountered and exactly what to do in each case. Be Simple, Be Exact (Clearly indicate every action, measure and timing) Each task step must be clear in the user’s mind. Cover one item per task step and leave the next action for the next task step. Name the task using no more than three or four words. Next explain the task in sentences of less than fifteen (15) words. Use words with a maximum of three syllables that an eight to ten year old would know. If the task requires a measurement then provide images of where the measurement applies. Indicate the equipment that is required and any critical factors in its use. Provide the range of measurements that are suitable to complete the task correctly. Develop a cross-check to confirm accuracy between the SOP and what is being worked on. Time critical task steps need to advise the time allowed for each step. With a time limit an SOP user can improve until they better the limit. If there is some degree of tolerance in the task step, then specify the allowable limits. Once a tolerance range is set people will strive to meet it. If you want to make the job fun then band the tolerance range in terms of ‘good, better, best’. If industry specific terms or unusual words are required in the SOP, provide a definition of the words either as a footnote (this is preferred) or in a glossary. The users will become familiar with the terms as they gain experience. Do not leave anything to chance with regards definitions and explanations. The SOP user must be provided with all the information to do it right-first-time. Full Details Clearly Provided Step by Step Present each task step from the SOP user’s point of view. Write it in the second person, present tense with politeness. For example if the task were to write a page of handwriting the SOP task steps in the figure below would be suitable. As appropriate use photos, drawings sketches, graphs, etc. to clearly explain what to do and accomplish in each task. You want the work done expertly.

© Lifetime Reliability Solutions Change To Win Workbook LRS.CTW.0001 Rev 0
Page 53
Task Step No.
Task Step
Owner
Task Step
Name (Max 3 – 4 words)
Full Description of Task (Include all tables, diagrams
and pictures here)
Test for Correctness
(Tolerance bands would be used
whenever sensible to do so)
Record Actual Result
Action if Not
Correct
Sign After
Complete
1 Writer Lift pen Pick up the pen with your right hand.
Feel the pen in hand.
2 Writer Position pen
Place the writing tip approximately 25-mm inside the left-hand side of the first ruled line on the top of the page. (An image here would be useful.)
The pen tip touches the paper about 25-mm inside left edge of the top line.
Move pen to the right spot.
3 Writer Move pen
Write left to right along the line tidily so that people can easily read it.
Words form neatly behind the moving pen.
4 Writer Writing size
Capital letters reach from bottom to top of the line and lower case letters stretch from bottom to half line height. (An image would be inserted here.)
Capital letters start just above the lower edge of line and reach to just under the upper edge. While lower case letters start just above the lower edge and reach to half line height.
Practice writing to the correct height.
5 Writer Next line When you come to the end of a line move down one line to the next one. (An image would be inserted here.)
The writing extends the length of the completed line.
6 Writer Page end Turn over the page when the last line is filled with your tidy writing.
The writing neatly covers the page.
An ACE 3T Standard Operating Procedure
A layout as above makes it clear to users where they are at each point and what is to be done. They can see that the current task they are doing is the first one not yet signed off. Tasks are easily recognised and simply named. Each task is fully explained with all the necessary information right in front of users all the time. There is a check for correctness to know when a task is done right. If a record is required there is space for it and a comparison against requirements. The user is advised what to do if the required standard is not achieved. Finally the user commits themselves to accuracy and truth by putting their name to it. When another party is responsible for the step the tense changes to third person (they), present tense. When using images show the view that a user would see when doing the job. Use color in the images, tables and test to clarify the requirements. Introduce simple visual controls. These are an extremely useful device as they provide not only an indication of how things should be operating, but provide a paperless system for carrying out on-the-job inspections. Examples of visual controls are: • Matchmarks on nuts and bolts • Colour marking of permissible operating
ranges on dials and gauges
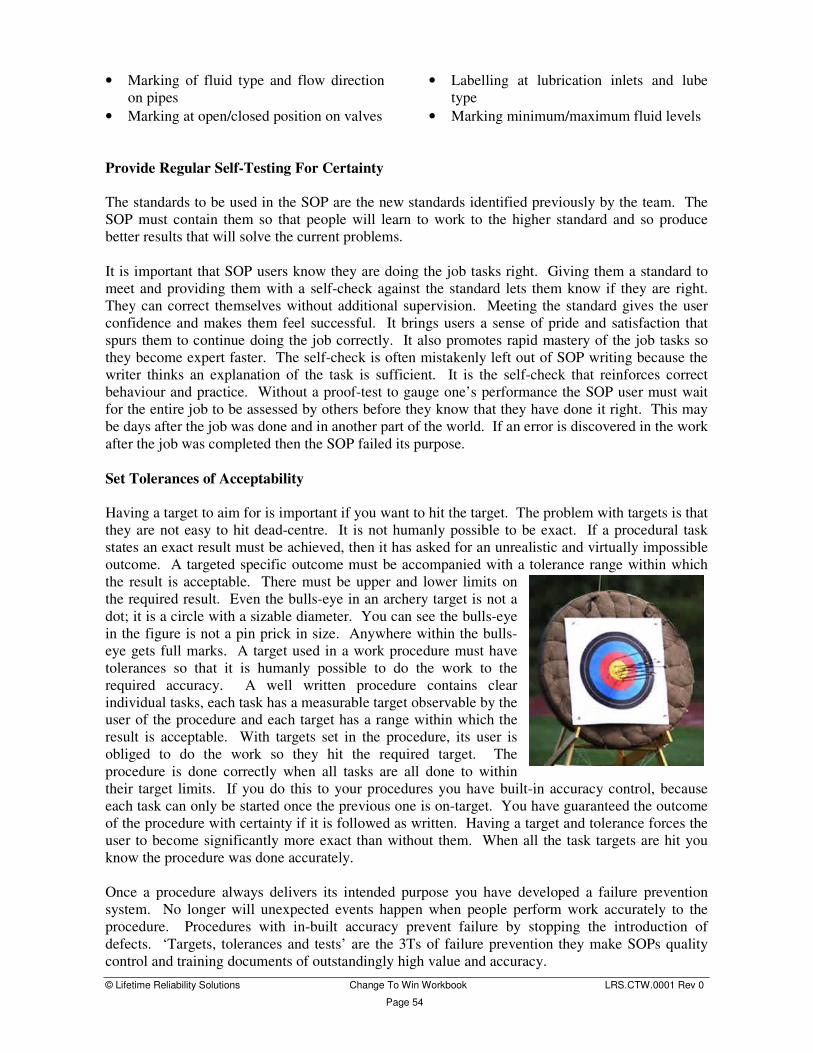
© Lifetime Reliability Solutions Change To Win Workbook LRS.CTW.0001 Rev 0
Page 54
• Marking of fluid type and flow direction on pipes
• Marking at open/closed position on valves
• Labelling at lubrication inlets and lube type
• Marking minimum/maximum fluid levels Provide Regular Self-Testing For Certainty The standards to be used in the SOP are the new standards identified previously by the team. The SOP must contain them so that people will learn to work to the higher standard and so produce better results that will solve the current problems. It is important that SOP users know they are doing the job tasks right. Giving them a standard to meet and providing them with a self-check against the standard lets them know if they are right. They can correct themselves without additional supervision. Meeting the standard gives the user confidence and makes them feel successful. It brings users a sense of pride and satisfaction that spurs them to continue doing the job correctly. It also promotes rapid mastery of the job tasks so they become expert faster. The self-check is often mistakenly left out of SOP writing because the writer thinks an explanation of the task is sufficient. It is the self-check that reinforces correct behaviour and practice. Without a proof-test to gauge one’s performance the SOP user must wait for the entire job to be assessed by others before they know that they have done it right. This may be days after the job was done and in another part of the world. If an error is discovered in the work after the job was completed then the SOP failed its purpose. Set Tolerances of Acceptability Having a target to aim for is important if you want to hit the target. The problem with targets is that they are not easy to hit dead-centre. It is not humanly possible to be exact. If a procedural task states an exact result must be achieved, then it has asked for an unrealistic and virtually impossible outcome. A targeted specific outcome must be accompanied with a tolerance range within which the result is acceptable. There must be upper and lower limits on the required result. Even the bulls-eye in an archery target is not a dot; it is a circle with a sizable diameter. You can see the bulls-eye in the figure is not a pin prick in size. Anywhere within the bulls-eye gets full marks. A target used in a work procedure must have tolerances so that it is humanly possible to do the work to the required accuracy. A well written procedure contains clear individual tasks, each task has a measurable target observable by the user of the procedure and each target has a range within which the result is acceptable. With targets set in the procedure, its user is obliged to do the work so they hit the required target. The procedure is done correctly when all tasks are all done to within their target limits. If you do this to your procedures you have built-in accuracy control, because each task can only be started once the previous one is on-target. You have guaranteed the outcome of the procedure with certainty if it is followed as written. Having a target and tolerance forces the user to become significantly more exact than without them. When all the task targets are hit you know the procedure was done accurately. Once a procedure always delivers its intended purpose you have developed a failure prevention system. No longer will unexpected events happen when people perform work accurately to the procedure. Procedures with in-built accuracy prevent failure by stopping the introduction of defects. ‘Targets, tolerances and tests’ are the 3Ts of failure prevention they make SOPs quality control and training documents of outstandingly high value and accuracy.

© Lifetime Reliability Solutions Change To Win Workbook LRS.CTW.0001 Rev 0
Page 55
Request Proof That Each Step is Done Correctly As evidence that the SOP task was done correctly, users are required to sign-off as they do it. The usual practice is for them to initial a step when it is totally and properly completed. A large amount of trust is present when a SOP user is working alone with the procedure. Though their initial is against the task, no one can truly know if the initial was entered as the task was done or after. But by putting their initial to the task they accept responsibility for the consequences of its performance. The importance of being accurate and systematic when following a SOP needs to be made clear to the user. The SOP is how the organization wants them to do the job and until they subconsciously master the job they need to follow the procedure exactly. Recording their initials as part of the job acts to reinforce the correct practices that need to be adopted. Where the SOP is part of a legal requirement, make it very clear to users that they are legally bound by their signed initials. Explain the legal reasons why you want employees to follow the specified methods. People will do what is required if it is fully explained in a way that they understand and believe. Keep It a True Record of Current Best Practices It is important to appreciate that a SOP is a live document. It is to be continuously updated with the best practices. It is there to ‘capture’ new and better ways for all future users to adopt. Let the SOP user make suggestions on how to improve a task. From time to time a wonderful discovery will be made that greatly improves the efficiency or effectiveness of the work. When a new idea to improve the SOP arises test it. Make no comment about the worth of the idea. Simply try it under controlled and monitored tests and see what happens. If there is evidence that the change is better, then use it and up-date the procedure. If the change is not an improvement then continue with the proven way. Try every idea in some way, since even an unsuccessful change can lead to another idea that will make tremendous improvement to the way the job is done. Keep Control of the Documents and Records An SOP is a quality system document and must be controlled through a central administrator. Changes are only permitted to a SOP once properly and completely tested, verified and approved by the department manager responsible. SOPs are the repository of the company’s best practices and they should be up-to-date. Be proactive in reminding people to keep their ideas coming forward for testing. Keep the SOP updated with the successful ones so work quality continually improves. SOPs that contain information written into them by the user while doing a job are records of work quality (As with the Japanese Air Lines example noted above). They are important historical documents since they act as proof of work done to a standard and they provide evidence of past practices and conditions. Such records need to be safely kept for future reference and learning. Keep the Master Copy Safe A SOP is a highly valuable document. It contains the exclusive information that makes a company unique. It contains many people’s efforts and hard won successes over many years. It deserves respect and protection. Typically the document is in both hardcopy form for use by trainees, and in electronic form. It should be treated like any quality system document with the document number, issue date, revision number history, persons responsible for it and its circulation recorded on it. This allows people to quickly check if the document they have in front of them is actually the most

© Lifetime Reliability Solutions Change To Win Workbook LRS.CTW.0001 Rev 0
Page 56
recent edition. Keep the electronic copy of the most recent version of the master document safely away from everyday use. Develop a 3T SOP for the secure protection of your procedures and follow it.