Change is Gonna Come
25
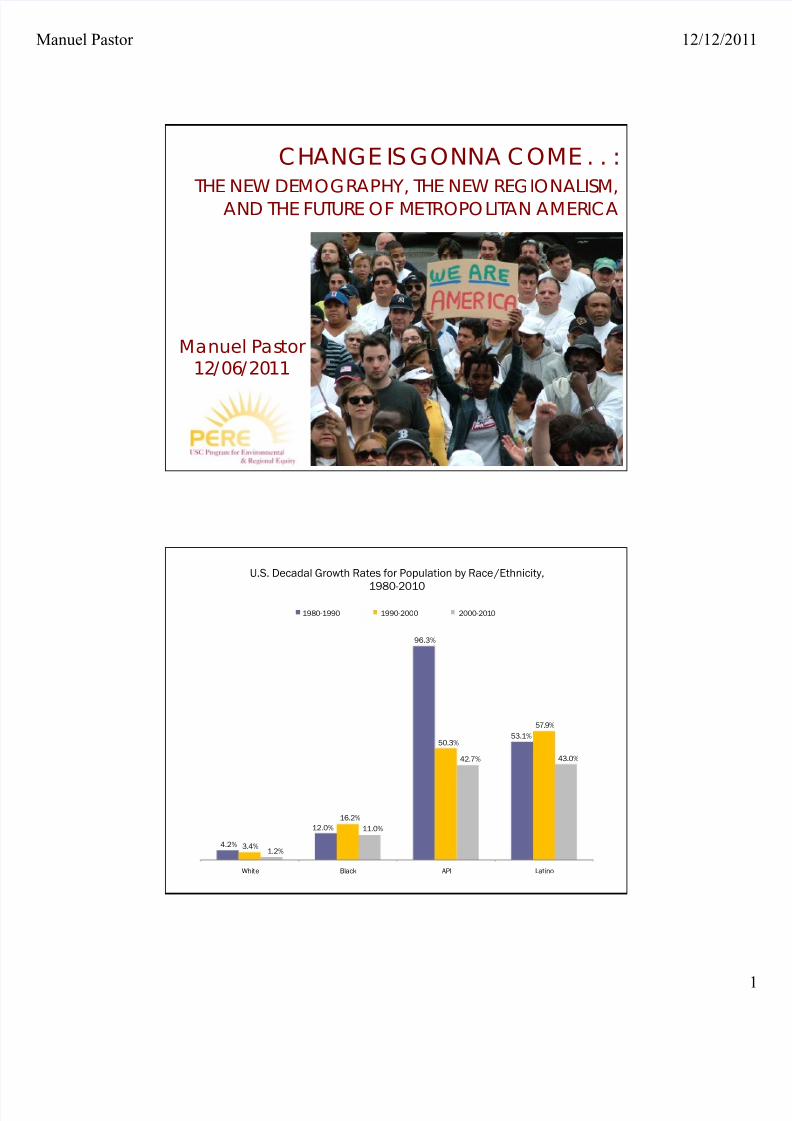
Manuel Pastor 12/12/2011 1 C H A NG E I S G O NNA C O ME . . : T H E NE W DE MO G R A PH Y, T H E NE W R E G I O NAL I S M, AND T HE FUT UR E O F MET ROPO L IT A N A MER IC A Manuel Pastor 12 / 06 / 20 11 4.2% 12.0% 96.3% 53.1% 3.4% 16.2% 50.3% 57.9% 1.2% 11.0% 42.7% 43.0% White Black API Latino U.S. Decadal Growth Rates for Population by Race /Ethnicity, 1980-2010 1980-1990 1990-2000 2000-2010
-
Upload
tre-networks -
Category
Documents
-
view
111 -
download
0
description
The new demography, the new regionalism, and the future of the metropolitan AmericaBy Manuel Pastor
Transcript of Change is Gonna Come
5/12/2018 Change is Gonna Come - slidepdf.com
http://slidepdf.com/reader/full/change-is-gonna-come 1/25
Manuel Pastor 12/12/
CHANGE IS GONNA COME . . :THE NEW DEMOGRAPHY, THE NEW REGIONALISM,
AND THE FUTURE OF METROPOLITAN AMERICA
Ma nuel Pastor12/ 06/ 2011
4.2%
12.0%
96.3%
53.1%
3.4%
16.2%
50.3%
57.9%
1.2%
11.0%
42.7% 43.0%
White Black API Latino
U.S. Decadal Growth Rates for Population by Race/Ethnicity,
1980-2010
1980-1990 1990-2000 2000-2010

5/12/2018 Change is Gonna Come - slidepdf.com
http://slidepdf.com/reader/full/change-is-gonna-come 2/25
Manuel Pastor 12/12/
34%
8%
14%
14%
35%
56%
15%
16%
2%
6%
0%
20%
40%
60%
80%
100%
1980-1990 2000-2010
U.S. Share of Decadal Population Growth by Race/Ethnicity
1980-1990 & 2000-2010
Other
API
Latino
Black
White
-4,310,525
-248,081
4,788,632
781,946 875,683
White Black Latino API Other
U.S. Change in Youth (<18) Population by Race/Ethnicity, 2000-2010
5/12/2018 Change is Gonna Come - slidepdf.com
http://slidepdf.com/reader/full/change-is-gonna-come 3/25
Manuel Pastor 12/12/
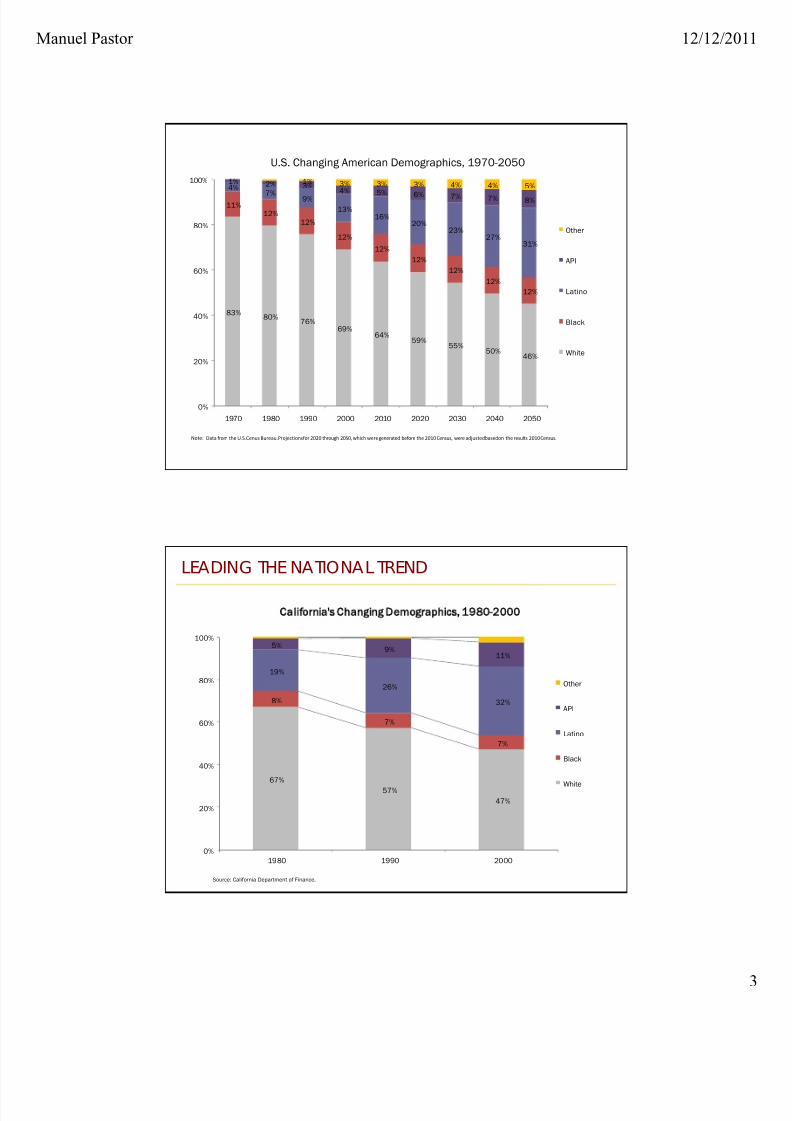
83%80%
76%69%
64%59%
55%50%
46%
11%12%
12%
12%
12%
12%
12%
12%
12%
4%
7% 9%
13%16%
20%23%
27%31%
1% 2% 3%4%
5% 6% 7% 7% 8%
1% 3% 3% 3% 4% 4% 5%
0%
20%
40%
60%
80%
100%
1970 1980 1990 2000 2010 2020 2030 2040 2050
U.S. Changing American Demographics, 1970-2050
Other
API
Latino
Black
White
Note: Data from the U.S.Cenus Bureau.Projections for 2020 through 2050, which were generated before the 2010 Census, were adjusted basedon the results 2010 Census.
LEADING THE NATIONAL TREND
67%57%
47%
8%
7%
7%
19%
26%
32%
5%9%
11%
0%
20%
40%
60%
80%
100%
1980 1990 2000
Ca lifornia's Changing De mographics, 19 80-2000
Other
API
Latino
Black
White
Source: California Department of Finance.
5/12/2018 Change is Gonna Come - slidepdf.com
http://slidepdf.com/reader/full/change-is-gonna-come 4/25
Manuel Pastor 12/12/
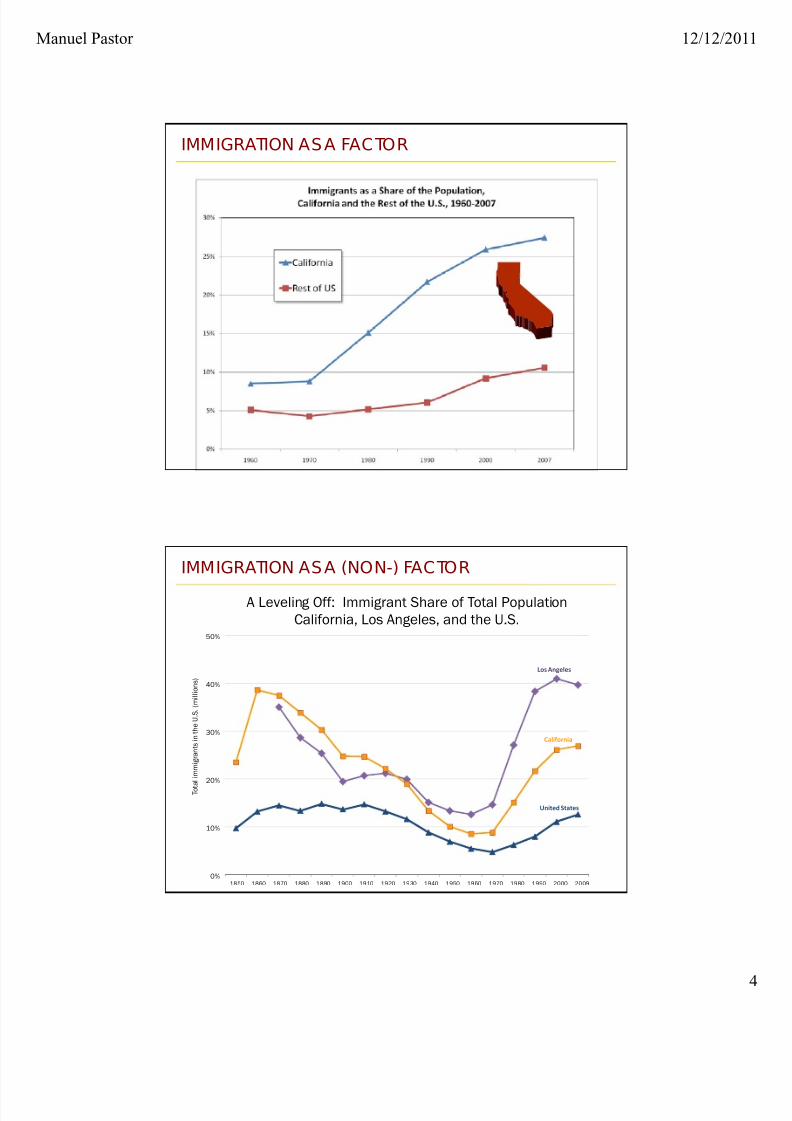
IMMIGRATION AS A FACTOR
IMMIGRATION AS A (NON-) FACTOR
0%
10%
20%
30%
40%
50%
1850 1860 1870 1880 1890 1900 1910 1920 1930 1940 1950 1960 1970 1980 1990 2000 2009
T o t a l i m m i g r a n t s i n t h e U . S .
( m i l l i o n s )
A Leveling Off: Immigrant Share of Total Population
California, Los Angeles, and the U.S.
California
Los Angeles
UnitedStates

5/12/2018 Change is Gonna Come - slidepdf.com
http://slidepdf.com/reader/full/change-is-gonna-come 5/25
Manuel Pastor 12/12/
0%
10%
20%
30%
40%
50%
60%
70%
80%
90%
N o r t h D a k o t a
K e n t u c k y
A l a b a m a
S o u t h C a r o l i n a
D e l a w a r e
M i s s i s s i p p i
N e b r a s k a
I n d i a n a
N o r t h C a r o l i n a
T e n n e s s e e
S o u t h D a k o t a
K a n s a s
W y o m i n g
O k l a h o m a
M i s s o u r i
G e o r g i a
I o w a
M i n n e s o t a
D i s t r i c t o f C o l u m b i a
L o u i s i a n a
A r k a n s a s
V i r g i n i a
U t a h
O h i o
W i s c o n s i n
M a r y l a n d
M i c h i g a n
O r e g o n
C o l o r a d o
P e n n s y l v a n i a
I d a h o
M a s s a c h u s e t t s
N e w H a m p s h i r e
W a s h i n g t o n
C o n n e c t i c u t
T e x a s
A l a s k a
A r i z o n a
N e v a d a
W e s t V i r g i n i a
N e w J e r s e y
F l o r i d a
M a i n e
N e w M e x i c o
I l l i n o i s
N e w Y o r k
R h o d e I s l a n d
M o n t a n a
H a w a i i
C a l i f o r n i a
V e r m o n t
California: Among the Most Long-Term of Immigrant Populations
% of immigrants who arrived > 10 years ago, 2009
CALIFORNIA DEMOGRAPHIC REALITIES
Alabama
AlaskaArizona
Arkansas
California
Colorado
Connecticut
Delaware
District of Columbia
Florida
Georgia
Hawaii
Idaho
Illinois
Indiana
Iowa
Kansas
Kentucky
Louisiana
Maine
MarylandMassachusetts
Michigan
Minnesota
Mississippi
Missouri
Montana
Nebraska
NevadaNew Hampshire New Jersey
New Mexico
New York
North Carolina
North Dakota
Ohio
Oklahoma
OregonPennsylvania
Rhode Island
South Carolina
South DakotaTennessee
Texas
Utah
Vermont
Virginia
WashingtonWest Virginia
Wisconsin
Wyoming
30%
40%
50%
60%
70%
80%
90%
0% 5% 10% 15% 20% 25% 30%
% o f i m m
i g r a n t s w h o a r r i v e d > 1 0 y e a r s a g o
% immigrant
Percent Immigrant by Share Long-TermU.S. States, 2009
CALIFORNIA DEMOGRAPHIC REALITIES
5/12/2018 Change is Gonna Come - slidepdf.com
http://slidepdf.com/reader/full/change-is-gonna-come 6/25
Manuel Pastor 12/12/
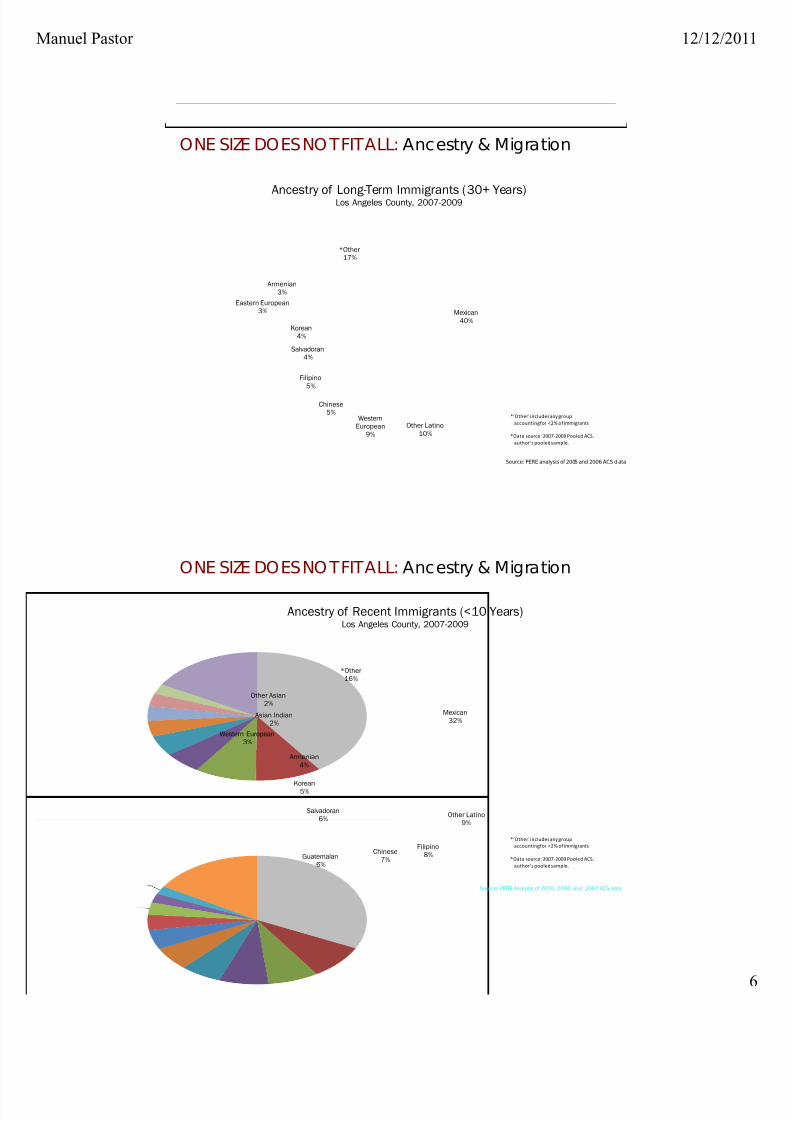
Source: PEREana lysisof 2005 and 2006 ACSda ta
Mexican
40%
Other Latino
10%
Western
European
9%
Chinese
5%
Filipino
5%
Salvadoran
4%
Korean
4%
Eastern European
3%
Armenian
3%
*Other
17%
Ancestry of Long-Term Immigrants (30+ Years)Los Angeles County, 2007-2009
*'Other' includes any group
accountingfor <2% of immigrants
*Data source: 2007‐2009 Pooled ACS,
author's pooled sample.
ONE SIZE DOES NOT FIT ALL: Anc estry & Migration
Source: PERE Analysis of 2005, 2006, and 2007 ACS data.
Mexican
32%
Other Latino
9%
Filipino
8%Chinese
7%Guatemalan
6%
Salvadoran
6%
Korean5%
Armenian
4%
Western European
3%
Asian Indian
2%
Other Asian
2%
*Other
16%
Ancestry of Recent Immigrants (<10 Years)Los Angeles County, 2007-2009
*'Other' includes any group
accountingfor <2% of immigrants
*Data source: 2007‐2009 Pooled ACS,
author's pooled sample.
ONE SIZE DOES NOT FIT ALL: Anc estry & Migration
5/12/2018 Change is Gonna Come - slidepdf.com
http://slidepdf.com/reader/full/change-is-gonna-come 7/25
Manuel Pastor 12/12/
46%
38%
38%
30%
27%
22%
21%
18%
18%
16%
13%
13%
12%
12%
11%
11%
11%
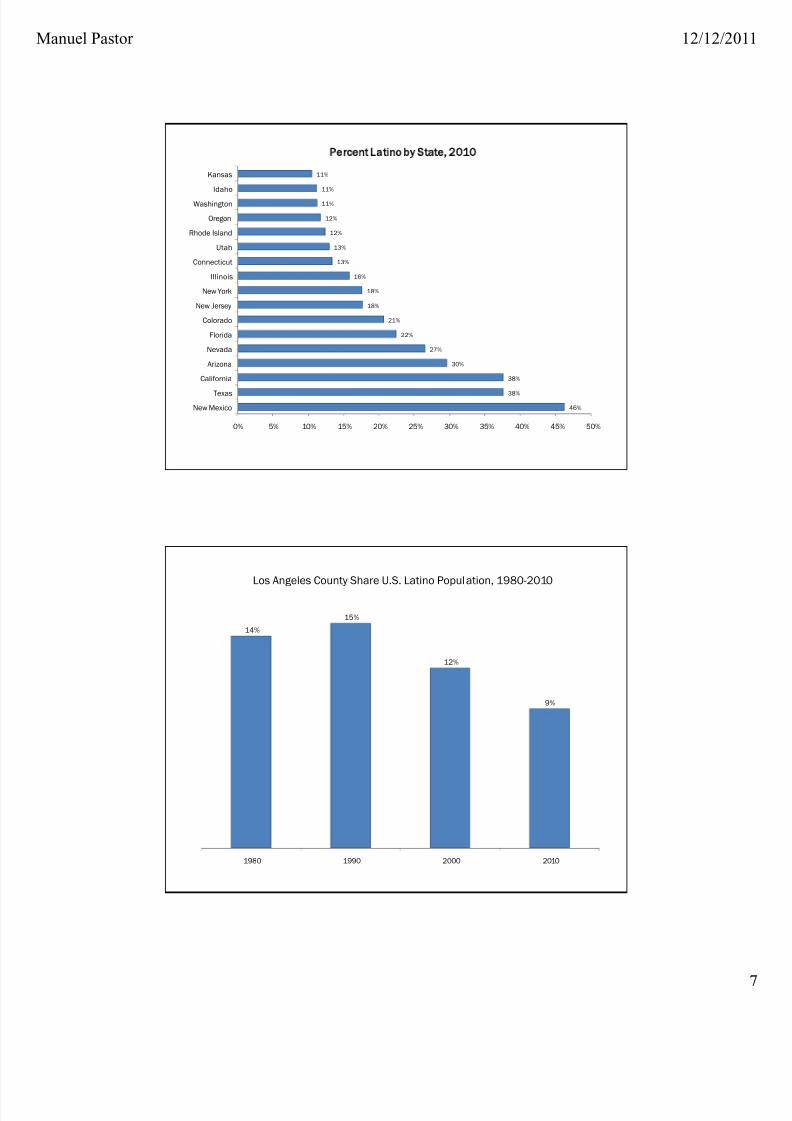
0% 5% 10% 15% 20% 25% 30% 35% 40% 45% 50%
New Mexico
Texas
California
Arizona
Nevada
Florida
Colorado
New Jersey
New York
Illinois
Connecticut
Utah
Rhode Island
Oregon
Washington
Idaho
Kansas
Percent Latino by State, 2010
14%
15%
12%
9%
1980 1990 2000 2010
Los Angeles County Share U.S. Latino Population, 1980-2010
5/12/2018 Change is Gonna Come - slidepdf.com
http://slidepdf.com/reader/full/change-is-gonna-come 8/25
Manuel Pastor 12/12/
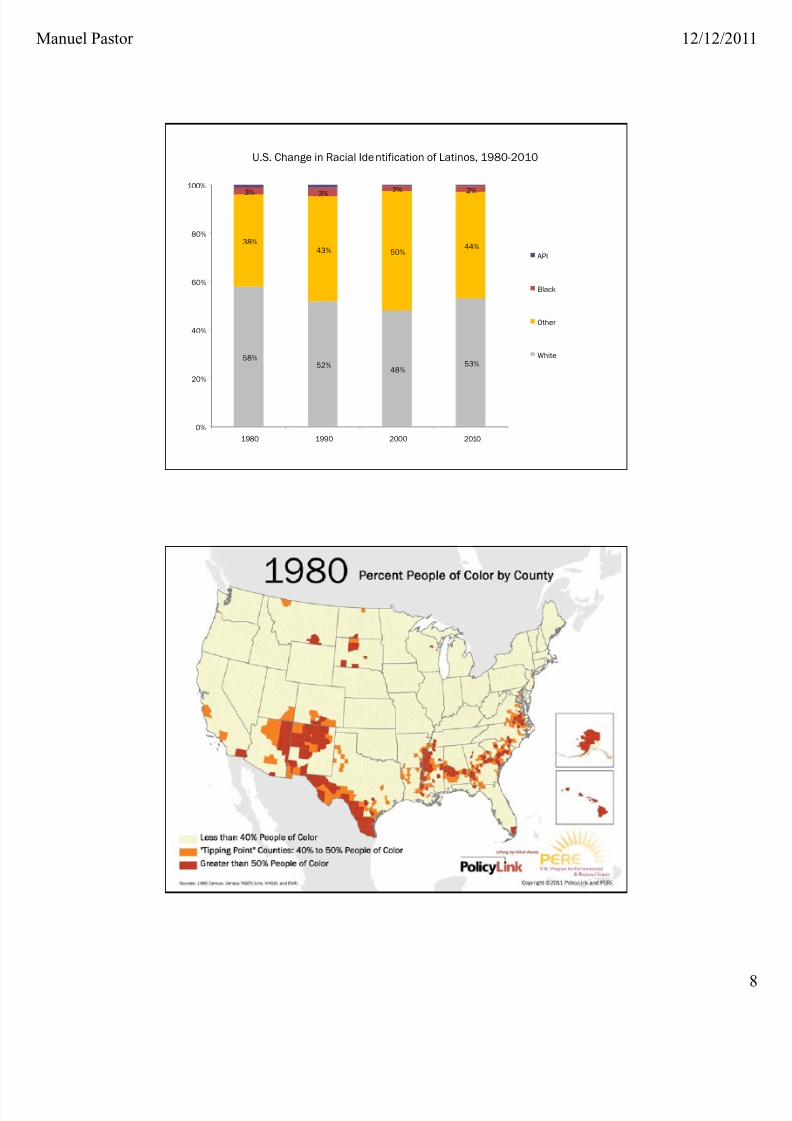
58%52%
48%53%
38%
43% 50%44%
3% 3%2% 2%
0%
20%
40%
60%
80%
100%
1980 1990 2000 2010
U.S. Change in Racial Identification of Latinos, 1980-2010
API
Black
Other
White
5/12/2018 Change is Gonna Come - slidepdf.com
http://slidepdf.com/reader/full/change-is-gonna-come 9/25
Manuel Pastor 12/12/

5/12/2018 Change is Gonna Come - slidepdf.com
http://slidepdf.com/reader/full/change-is-gonna-come 10/25
Manuel Pastor 12/12/
5/12/2018 Change is Gonna Come - slidepdf.com
http://slidepdf.com/reader/full/change-is-gonna-come 11/25
Manuel Pastor 12/12/

5/12/2018 Change is Gonna Come - slidepdf.com
http://slidepdf.com/reader/full/change-is-gonna-come 12/25
Manuel Pastor 12/12/
76%69%
64%
81%
72%
65%
12%
12%
12%
7%
9%
10%
9%
13%16%
8%
12%
17%
3%4% 5%
3%5% 6%
1% 3% 3% 1% 2% 2%
0%
20%
40%
60%
80%
100%
1990 2000 2010 1990 2000 2010
national profile metro suburbs profile
Portrait of America: The Changing Suburbs
Other
API
Latino
Black
White
South Los Angeles with 2000 U.S. Census Trac t Boundaries
Tota l Popula tion:1990: 802,3712000: 825,4082005-09: 858,773
7% increase
from 1990 to 2005-09

5/12/2018 Change is Gonna Come - slidepdf.com
http://slidepdf.com/reader/full/change-is-gonna-come 13/25
Manuel Pastor 12/12/
South Central High School Demographics1981-1982 School Year
99%
91% 93%
57%
90%
98%
68%
91%
1%
5% 7%
42%
10%
2%
31%
7%
0%4%
0% 1% 0% 0% 1% 2%
Crenshaw Dorsey Fremont Jefferson Jordan Locke Manual Arts WashingtonPrep
South Central Los Angeles High School Demography, 1981-82 School Year
Other
Latino
African American
South Central High School Demographics2004-2005 School Year
68%
57%
9% 9%
22%
31%
18%
52%
30%
42%
90% 90%
77%
67%
81%
47%
2% 1% 1% 1% 1% 1% 1% 1%
Crenshaw Dorsey Fremont Jefferson Jordan Locke Manual Arts WashingtonPrep
South Central Los Angeles High School Demography, 2008-09 School Year
Other
Latino
African American
5/12/2018 Change is Gonna Come - slidepdf.com
http://slidepdf.com/reader/full/change-is-gonna-come 14/25
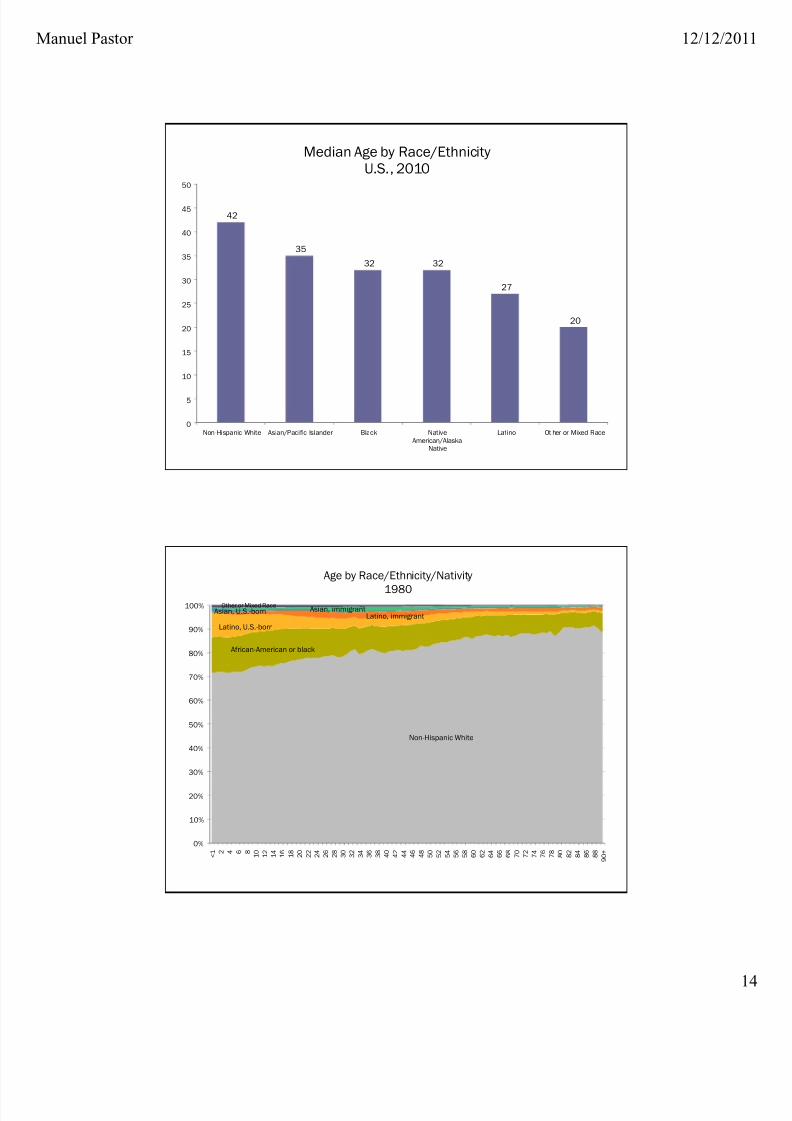
Manuel Pastor 12/12/
42
35
32 32
27
20
0
5
10
15
20
25
30
35
40
45
50
Non-Hispanic White Asian/Pacific Islander Black Native
American/Alaska
Native
Lati no Ot her or Mixed Race
Median Age by Race/Ethnicity
U.S., 2010
Non-Hispanic White
African-American or black
Latino, U.S.-born
Latino, immigrantAsian, U.S.-born Asian, immigrant
Other or Mixed Race
0%
10%
20%
30%
40%
50%
60%
70%
80%
90%
100%
< 1 2 4 6 8
1 0
1 2
1 4
1 6
1 8
2 0
2 2
2 4
2 6
2 8
3 0
3 2
3 4
3 6
3 8
4 0
4 2
4 4
4 6
4 8
5 0
5 2
5 4
5 6
5 8
6 0
6 2
6 4
6 6
6 8
7 0
7 2
7 4
7 6
7 8
8 0
8 2
8 4
8 6
8 8
9 0 +
Age by Race/Ethnicity/Nativity
1980
5/12/2018 Change is Gonna Come - slidepdf.com
http://slidepdf.com/reader/full/change-is-gonna-come 15/25
Manuel Pastor 12/12/
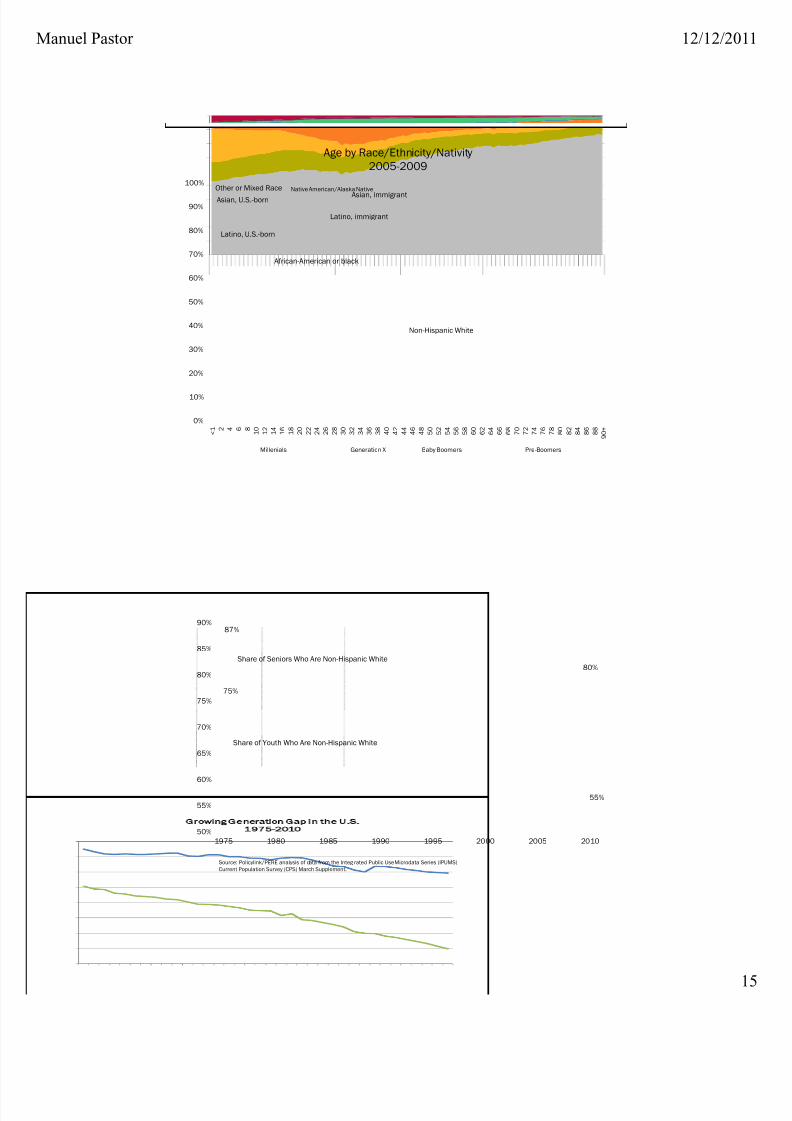
Non-Hispanic White
African-American or black
Latino, U.S.-born
Latino, immigrant
Asian, U.S.-born Asian, immigrant
Native American/Alaska NativeOther or Mixed Race
0%
10%
20%
30%
40%
50%
60%
70%
80%
90%
100%
< 1 2 4 6 8
1 0
1 2
1 4
1 6
1 8
2 0
2 2
2 4
2 6
2 8
3 0
3 2
3 4
3 6
3 8
4 0
4 2
4 4
4 6
4 8
5 0
5 2
5 4
5 6
5 8
6 0
6 2
6 4
6 6
6 8
7 0
7 2
7 4
7 6
7 8
8 0
8 2
8 4
8 6
8 8
9 0 +
Millenials Generation X Baby Boomers Pre-Boomers
Age by Race/Ethnicity/Nativity
2005-2009
75%
55%
87%
80%
50%
55%
60%
65%
70%
75%
80%
85%
90%
1975 1980 1985 1990 1995 2000 2005 2010
Growing Generation Gap in the U .S.1975-2010
Share of Youth Who Are Non-Hispanic White
Share of Seniors Who Are Non-Hispanic White
Source: Policylink/PERE analysis of data from the Integrated Public Use Microdata Series (IPUMS)
Current Population Survey (CPS) March Supplement.

5/12/2018 Change is Gonna Come - slidepdf.com
http://slidepdf.com/reader/full/change-is-gonna-come 16/25
Manuel Pastor 12/12/
THE GAP MATTERS
Demographics and State Capital Spending Adjusted for Income
0
50
100
150
200
250
0% 5% 10% 15% 20% 25% 30% 35% 40%
percent age/ethnic difference
P e r c a p i t
a s t a t e s p e n d i n g c a p i t a l o u t l a y s a d j u s t e d f o r p e r c a p i t a
i n c o m e ( 1 0 0 = a v e r a g e o f U . S . s t a t e s )
AL
AK
AZ
AR
CA
CO
CT
DE
DCFL
GAHI
ID
IL
INIAKS
KYLA
ME
MDMAMI
MN
MSMO
MT
NE
NV
NH
NJ
NM
NY
NC
ND
OH
OK
OR
PA
RI
SC
SDTN TX
UT
VT
VA
WA
WV
WIWY
15%
20%
25%
30%
35%
40%
45%
0% 5% 10% 15% 20% 25% 30% 35% 40%
P e r
P u p i l S p e n d i n g / P e r C a p i t a
I n c o m e
Difference in % non-Hispa nic white b etwe en the old (>65) and the yo ung (<18)
Inc om e A djusted Per Pup il Spe nd ing on Public Sch ools
&the Generation Gap by State
2007-2008
Source: Policylink/PERE analysis of data from the U.S. Census Bureau and the Integrated Public Use Microdata Series (IPUMS) Current Population Survey (CPS) March Supplement.
THE GAP MATTERS

5/12/2018 Change is Gonna Come - slidepdf.com
http://slidepdf.com/reader/full/change-is-gonna-come 17/25
Manuel Pastor 12/12/
THE CHALLENGE OF INEQUALITY
THE CHALLENGE OF INEQUALITY
$0
$10,000
$20,000
$30,000
$40,000
$50,000
$60,000
$70,000
$80,000
$90,000
1947 1952 1957 1962 1967 1972 1977 1982 1987 1992 1997 2002 2007
Figure 3‐1. U.S. Resident Median Family Income 1947‐2007
(in 2007 Dollars)
Latino
Black
Asian and Pacific Islander
White
Non-Hispanic White

5/12/2018 Change is Gonna Come - slidepdf.com
http://slidepdf.com/reader/full/change-is-gonna-come 18/25
Manuel Pastor 12/12/
Unequal
Deregulated
Disconnected
Have things c hanged ? Iseq uity key to g row th?
PUTTING IT TOGETHER
USCProgram for Enviro nmental& Regional Equity
WHAT’S THE EVIDENCE?
Utilizing weighted regression approach to341 metro areas in the U.S. 1990-2000
Per capita income as a function of:
(+)regional education
(-) manufacturing concentration
(+)central city presence
(-) previous income
(?)region of U.S.(-) measure of inequity, including ratio of
city to suburb poverty, concentration ofpoverty, income distribution, black-whitesegregation

5/12/2018 Change is Gonna Come - slidepdf.com
http://slidepdf.com/reader/full/change-is-gonna-come 19/25
Manuel Pastor 12/12/
Federal Reserve of Clevelandstudies almost 120 mid-size regions,looking for factors that predictregional prosperity
Usual suspects: skilled workforce,quality of life, industrial decline
Unusual suspects: income
inequality, racial exclusion,concentration of poverty – andthey’re highly significant
FROM THE FEDERAL RESERVE
Underinvestmentin each othermakes us lesscompetitive as anation
Social tensions over whowill gain and who will losemake us less likely tocohere on what we needto do to thrive
IT’S A BROADER STORY

5/12/2018 Change is Gonna Come - slidepdf.com
http://slidepdf.com/reader/full/change-is-gonna-come 20/25
Manuel Pastor 12/12/
Metros offer new scalefor doing well and doinggood, fusing competitive-ness and inclusion
Configuration of metropolitanspace and opportunity hasbecome center – from racial
justice to spatial justice
Metros offer newopportunities to bridgedifference face-to-face, race-to-race, space-to-space
WHERE TO BEGIN
JUST GROWTH?
With support from the
Ford Foundation, did
a project combining
quantitative and
qualitative analysis to
uncover when equityand growth come
together
5/12/2018 Change is Gonna Come - slidepdf.com
http://slidepdf.com/reader/full/change-is-gonna-come 21/25
Manuel Pastor 12/12/
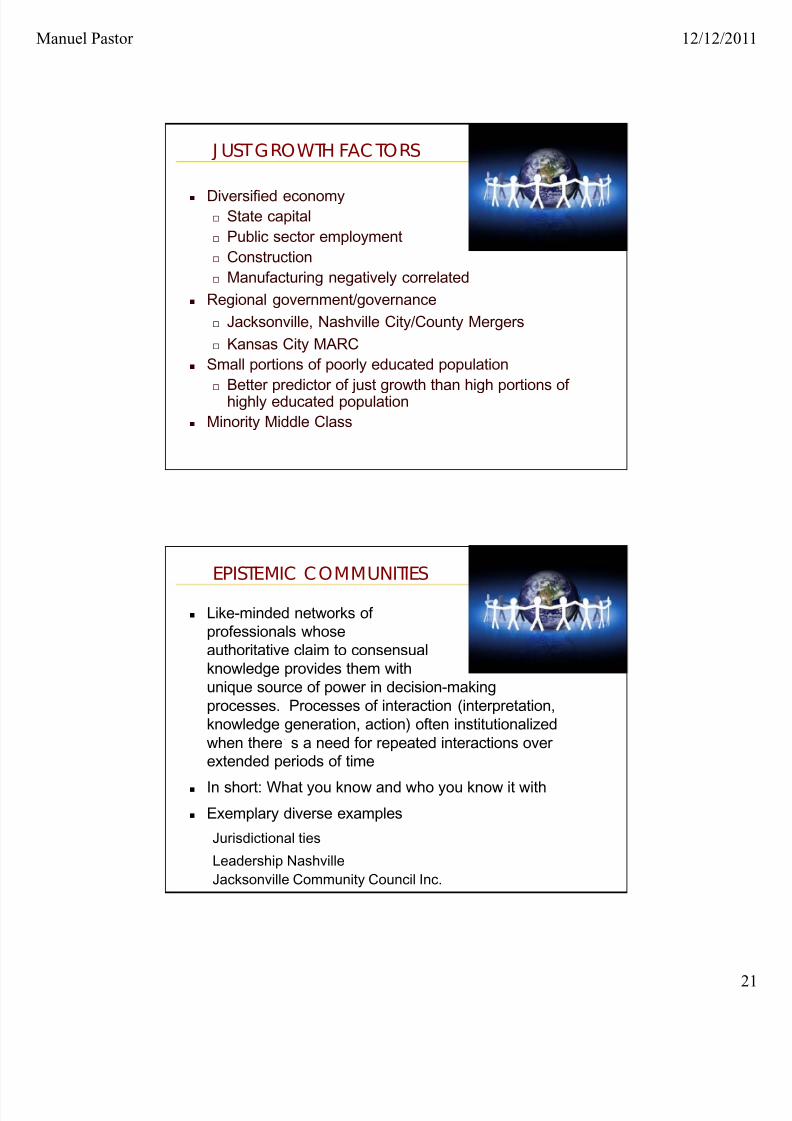
Diversified economy State capital
Public sector employment
Construction
Manufacturing negatively correlated
Regional government/governance
Jacksonville, Nashville City/County Mergers
Kansas City MARC
Small portions of poorly educated population
Better predictor of just growth than high portions ofhighly educated population
Minority Middle Class
JUST GROWTH FACTORS
Like-minded networks ofprofessionals whoseauthoritative claim to consensualknowledge provides them withunique source of power in decision-makingprocesses. Processes of interaction (interpretation,knowledge generation, action) often institutionalizedwhen there’s a need for repeated interactions overextended periods of time
In short: What you know and who you know it with
Exemplary diverse examples
Jurisdictional ties
Leadership Nashville
Jacksonville Community Council Inc.
EPISTEMIC COMMUNITIES

5/12/2018 Change is Gonna Come - slidepdf.com
http://slidepdf.com/reader/full/change-is-gonna-come 22/25
Manuel Pastor 12/12/
Founded in 1975 Multi-faceted community/participatory“think-tank” One of the earliest annual indicator projects
Annual studies on particular topics Volunteer citizen task force, facilitated by
staff Broad consultative process Consensus based recommendations for
action
Broadly shared priorities and sense ofcommon destiny
5/12/2018 Change is Gonna Come - slidepdf.com
http://slidepdf.com/reader/full/change-is-gonna-come 23/25
Manuel Pastor 12/12/
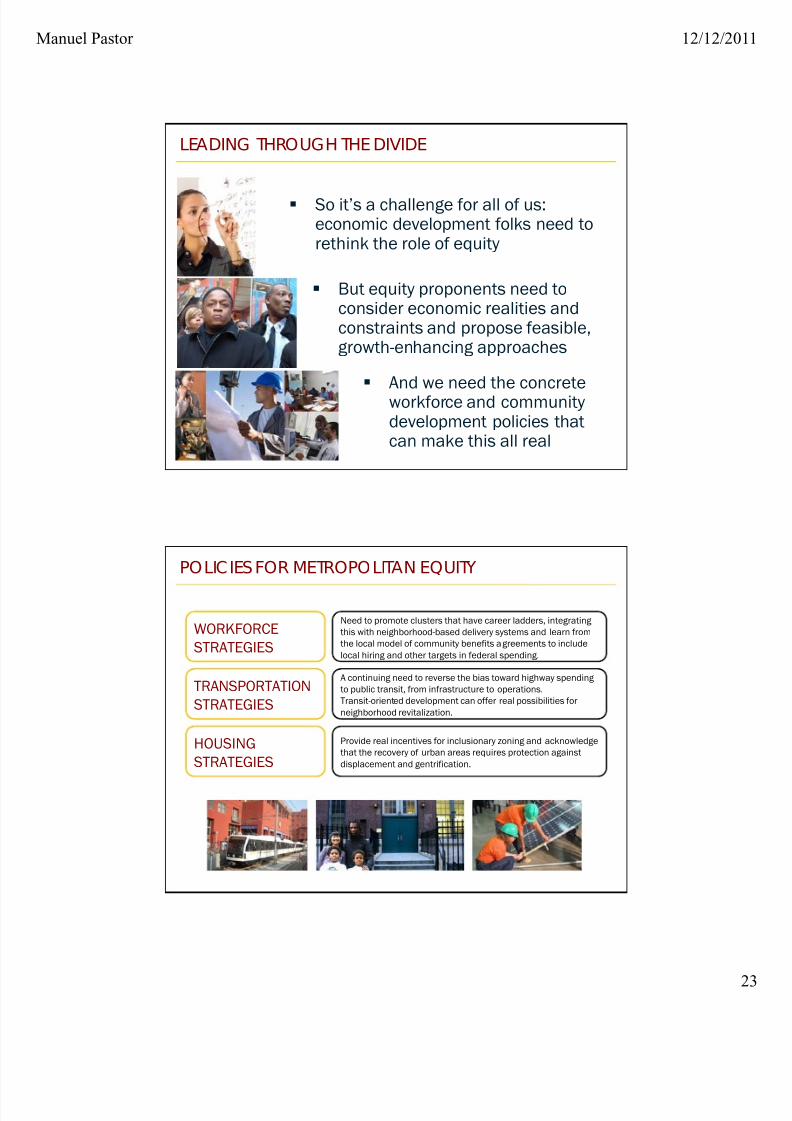
And we need the concreteworkforce and communitydevelopment policies thatcan make this all real
But equity proponents need toconsider economic realities andconstraints and propose feasible,growth-enhancing approaches
So it’s a challenge for all of us:economic development folks need torethink the role of equity
LEADING THROUGH THE DIVIDE
WORKFORCE
STRATEGIES
TRANSPORTATION
STRATEGIES
Need to promote clusters that have career ladders, integrating
this with neighborhood-based delivery systems and learn from
the local model of community benefits agreements to include
local hiring and other targets in federal spending.
A continuing need to reverse the bias toward highway spending
to public transit, from infrastructure to operations.
Transit-oriented development can offer real possibilities for
neighborhood revitalization.
HOUSING
STRATEGIES
Provide real incentives for inclusionary zoning and acknowledge
that the recovery of urban areas requires protection against
displacement and gentrification.
POLICIES FOR METROPOLITAN EQUITY

5/12/2018 Change is Gonna Come - slidepdf.com
http://slidepdf.com/reader/full/change-is-gonna-come 24/25
Manuel Pastor 12/12/
ASSET
BUILDING
HEALTHY
COMMUNITIES
Need to consider the financial deserts thatresult from lack of bank services. “Bank
On” programs help banks see the
customer base with new data, help
customers see the banks with financial
literacy, and create systems of
accountability.
Need to consider the lack of fresh food as
well as environmental disparities in both
exposures and opportunities. The
Reinvestment Fund, Policy, and Fresh Food
Financing Initiative are starts; park and
other access is key.
POLICIES FOR METROPOLITAN EQUITY
EDUCATIONAL
IMPROVEMENT
The toughest nut to crack and yetabsolutely essential to retention of families
in cities. There may be many different
strategies but mayors cannot stand apart
from this and there are significant federal
opportunities
Understanding thatcollaboration and conflictcan go together
Understanding the need for policypackages, unexpected alliances,and new collaborations
Understanding that equity and inclusionare no longer luxuries but imperativesfor economic and social sustainability
LEADING THROUGH THE DIVIDE

5/12/2018 Change is Gonna Come - slidepdf.com
http://slidepdf.com/reader/full/change-is-gonna-come 25/25
Manuel Pastor 12/12/
LEADING THROUGH THE DIVIDE
THE MORE THINGS CHANGE . . .


![Across the Universe - WUPSwups.info/wp-content/uploads/2015/10/Wups2.pdf · ... Nothing’s gonna change my world [F] Nothing’s gonna change my [C] world [C] Images of [Am] broken](https://static.fdocuments.net/doc/165x107/5ad363247f8b9aff738dee4d/across-the-universe-nothings-gonna-change-my-world-f-nothings-gonna.jpg)