Change in the Air (John Rother)
38
The Four Pillars The Four Pillars of Retirement Security of Retirement Security Social Security Social Security Pensions & Savings Pensions & Savings Earnings Earnings Health Insur ance Health Insurance
-
Upload
national-press-foundation -
Category
Documents
-
view
222 -
download
0
Transcript of Change in the Air (John Rother)

8/7/2019 Change in the Air (John Rother)
http://slidepdf.com/reader/full/change-in-the-air-john-rother 1/38
The Four PillarsThe Four Pillarsof Retirement Securityof Retirement Security
Social SecuritySocial Security
Pensions & SavingsPensions & SavingsEarningsEarnings
Health Insur anceHealth Insurance

8/7/2019 Change in the Air (John Rother)
http://slidepdf.com/reader/full/change-in-the-air-john-rother 2/38
Social Security: MAIN retirement inco
for 4/5 of economic brackets
20%
40%
60%
80%
100%
Social Secur ity
Pensions/ Annuities
Public Assistance
Assets
Misc. Other
Wages
Source:
Mar c
h2004CurrentPopula
tionsurvey
Perce n
tofretire m
en
tincome
from
all
sou
rce
s

8/7/2019 Change in the Air (John Rother)
http://slidepdf.com/reader/full/change-in-the-air-john-rother 3/38
Social Security: Cash Flow
Estimated OASDI and Cost Rates, 2001-50
[as a % of taxable payroll]
8
9
10
11
12
13
14
15
16
17
18
19
2001 2005 2010 2015 2020 2025 2030 2035 2040 2045 2050
Year
PercentofT a
xable
Payroll
2018

8/7/2019 Change in the Air (John Rother)
http://slidepdf.com/reader/full/change-in-the-air-john-rother 4/38
Social Security: Projected Trust Fund Assets
$0
$1,000
$2,000
$3,000
$4,000
$5,000
$6,000
$7,000
2001 2005 2010 2015 2020 2025 2030 2035 2040 2045 2050
Year
BillionsofDo
llar s
Assets at end of year,including interest
2042
2028
We are here
(in current dollars)

8/7/2019 Change in the Air (John Rother)
http://slidepdf.com/reader/full/change-in-the-air-john-rother 5/38
Significant Savings Required at All IncomeLevels to Maintain Standard of Living in
RetirementPre-Retirement FamilyIncome
$50,000 $80,000 $120,000
Income at 70% replacement level $35,000 $56,000 $84,000
Income from Social Security
(at Full Retirement Age) $20,436 $26,820 $35,364Income needed from savings and
investments $14,564 $29,180 $48,636
Principal needed at retirement to
generate above income(if withdrawn at 4% per year) $364,000 $729,500 $1,215,900
Extra needed for average medical
costs per couple
$300,000 $300,000 $300,000
TOTAL savings needed for a
secure retirement
$664,100 $1,029,500 $1,515,900

8/7/2019 Change in the Air (John Rother)
http://slidepdf.com/reader/full/change-in-the-air-john-rother 6/38
Defined-Benefit Pensions Disappearing
0%
10%
20%
30%
40%50%
60%
70%
1981 1991 2001
Def ined Ben efi t On ly
Def ined C on tribut ion O
Source: Alicia H. Munnell, Kevin E. Cahill, and Natalia A. Jivan,An Issue In Brief, Number 13, Center for Retirement Research at Boston College, September 2003.
% of Wage & Salary Workers Covered by Plan Type, 1981-2001

8/7/2019 Change in the Air (John Rother)
http://slidepdf.com/reader/full/change-in-the-air-john-rother 7/38
Median Amounts in Retirement Accountsby Age Group, 2001 and 2004
$0
$10
$20
$30
$40
$50
$60
$70
$80
$90
Under 35 35-44 45-54 55-64 65-74 75+
2001
2004
Source: Brian K. Bucks, Arthur B. Kennickell, and Kevin B. Moore, “Recent Changes in U.S. Family Finances:Evidence from the 2001 and 2004 Survey of Consumer Finances,” Federal Reserve Bulletin, January, 2006.
(in thousands of 2004 dollars)

8/7/2019 Change in the Air (John Rother)
http://slidepdf.com/reader/full/change-in-the-air-john-rother 8/38
I in 4 peoplebetween 45-54are takingmoney out of
401(k)s, IRAs

8/7/2019 Change in the Air (John Rother)
http://slidepdf.com/reader/full/change-in-the-air-john-rother 9/38
Personal Saving Rates Have Declined Steadilyfor Two Decades
-5%
0%
5%
10 %
15 %
20 %
1985 1986 1987 1988 1989 1990 1991 1992 1993 1994 1995 1996 1997 1998 1999 2000 2001 2002 2003 2004 2005 200
P
ercent of Income
Perso nal saving (FoF )
Perso nal saving (NIPA
Source: Federal Reserve Board, Flow of Funds Accounts, Table F10, Derivation of Measures of Personal Saving, various years.
Trends in Personal Saving Rates, 1985-2006

8/7/2019 Change in the Air (John Rother)
http://slidepdf.com/reader/full/change-in-the-air-john-rother 10/38
Boomers’ Net Worth
MedianNe t
Wo
rth
$118,000
$179,000
$146,200
$0
$50,000
$100,000
$150,000
$200,000
$250,000
AllBoomers Boomers51-60 Boomers42-50
Source:A
ARPPub
licPolicy
Institute
research
2004 figures, include home equity; Boomer ages 42-60 currently

8/7/2019 Change in the Air (John Rother)
http://slidepdf.com/reader/full/change-in-the-air-john-rother 11/38
62.9
18.421.0 21.8
24.5
28.3
0.0%
11.3 12.5 13.516.3
0.0
4 .3 4 .7 5 .3 6 .4
59.257.2
54.255.9
0%
10%
20%
30%
40%
50%
60%
70%
1 985 1990 1995 2000 2005
55-64
65-69
70-74
75+
Older Americans are Working Longer
Source: U.S. Bureau of Labor Statistics, Labor Force Statistics from the Current Population Survey, 1985-2005,accessed at http://data.bls.gov/PDQ/outside.jsp?survey=ln.
Labor Force Participation Rates for Persons Aged 55 and Older, by Age Group, 1985-2005

8/7/2019 Change in the Air (John Rother)
http://slidepdf.com/reader/full/change-in-the-air-john-rother 12/38
Options to StrengthenSocial Security . . .

8/7/2019 Change in the Air (John Rother)
http://slidepdf.com/reader/full/change-in-the-air-john-rother 13/38
Raise payroll tax ½ percentage point 24%
Include newly-hired State/Local workers 9%
Raise max. wages subject to Soc Sec tax 43%
Gradually raise age of full benefit to 70 38%
Increase calculation period to 38 years 16%
Index benefits for “average longevity” 25%
Reduce benefits for new retirees (by 5%) 26%
Diversify 15% of Trust Fund investments 16%
“Superlative” index the COLA calculation 14%
Raise the earliest eligibility age 10%

8/7/2019 Change in the Air (John Rother)
http://slidepdf.com/reader/full/change-in-the-air-john-rother 14/38
Social Security Poll Results
Reform Options Would Consider FAVOR
Increase wage cap to $150,000 81% 71%
Increase FICA ½ percent 72% 59%
Lower benefit formula 10% for
higher income only
67% 56%
Invest small portion (15%) of Trust Fund 54% 40%
Raise retirement age to 70 47% 33%
Index benefits for average longevity 46% 30%
5% benefit cut for NEW retirees 43% 28%
Convert from wage-indexing to
modified price-indexing
37% 26%
PUBLIC OPEN TO ADEQUATE ADJUSTMENTS
8/7/2019 Change in the Air (John Rother)
http://slidepdf.com/reader/full/change-in-the-air-john-rother 15/38
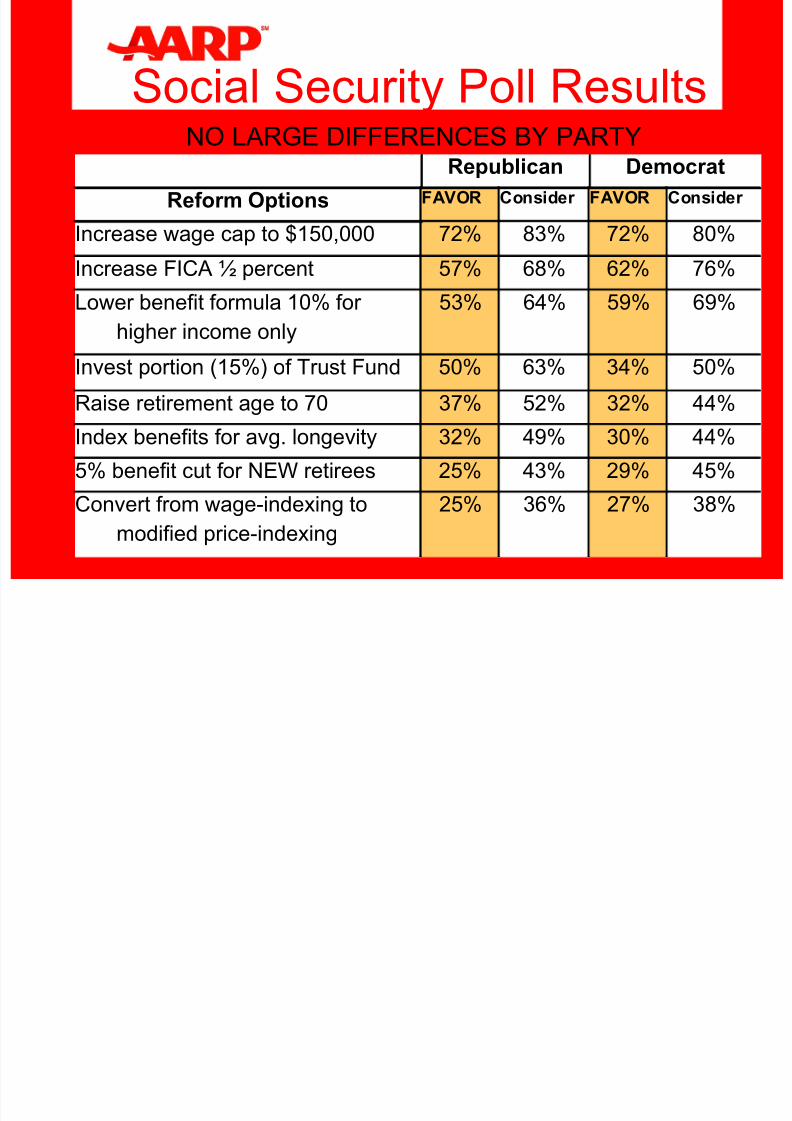
Social Security Poll Results
Republican Democrat
Reform Options FAVOR Consider FAVOR Consider
Increase wage cap to $150,000 72% 83% 72% 80%
Increase FICA ½ percent 57% 68% 62% 76%Lower benefit formula 10% for
higher income only
53% 64% 59% 69%
Invest portion (15%) of Trust Fund 50% 63% 34% 50%
Raise retirement age to 70 37% 52% 32% 44%Index benefits for avg. longevity 32% 49% 30% 44%
5% benefit cut for NEW retirees 25% 43% 29% 45%
Convert from wage-indexing to
modified price-indexing
25% 36% 27% 38%
NO LARGE DIFFERENCES BY PARTY

8/7/2019 Change in the Air (John Rother)
http://slidepdf.com/reader/full/change-in-the-air-john-rother 16/38
Social Security Poll Results
Retirement Savings Accounts FAVOR
Employers should be required to offer payrolldeductions to an IRA 79%
All workers should be enrolled in and contribute to a401(k) plan, unless they opt out 75%
Favor individual retirement savings accounts that
supplement Social Security, with contributions fromboth employee and employer
71%
PUBLIC FAVORS SUPPLEMENTAL SAVINGS

8/7/2019 Change in the Air (John Rother)
http://slidepdf.com/reader/full/change-in-the-air-john-rother 17/38

8/7/2019 Change in the Air (John Rother)
http://slidepdf.com/reader/full/change-in-the-air-john-rother 18/38
Medicare Reform

8/7/2019 Change in the Air (John Rother)
http://slidepdf.com/reader/full/change-in-the-air-john-rother 19/38
Below
Poverty
18%
100-125% oPoverty
10%
125-200% o
Poverty
21%
200-400% oPoverty
28%
Over 400% o
Poverty
23%
Source: MedPAC analysis of the Medicare Current Beneficiary Survey, Cost and Use file, 2004
People on Medicare By Income

8/7/2019 Change in the Air (John Rother)
http://slidepdf.com/reader/full/change-in-the-air-john-rother 20/38
0%
20%
40%
60%
80%
100%
Gettin
g Ne
eded Care
Gettin
g Ca
re Quickly
ho co
mmunicate we
ll
ourteou
s, Helpful Staff
Custom
er Service
l Ratin
g of Health Plan
( % "n
ot a problem
")
( % “a
lway
s")
( % “a
lway
s")
( % “a
lway
s")
( % "n
ot a problem
")
( %
“res
pond
ing “9
“ or “10
”)
CAHPS Health Plan Survey Comparison 2006
Source: 2006 CAHPS Health Plan Survey Chartbook
Medica
re
Medica
re
Medicare
Medica
re
Medica
re
Medica
re
Medicare beats Commercial Plansin Patient Satisfaction last 5 years

8/7/2019 Change in the Air (John Rother)
http://slidepdf.com/reader/full/change-in-the-air-john-rother 21/38

8/7/2019 Change in the Air (John Rother)
http://slidepdf.com/reader/full/change-in-the-air-john-rother 22/38

8/7/2019 Change in the Air (John Rother)
http://slidepdf.com/reader/full/change-in-the-air-john-rother 23/38
Rise in Health Care Costs per capita
$3,46
$6,69 $7,09
$9,52
$0
$2,000
$4,000
$6,000
$8,000
$10,000
1993 2004 2006 2011Source: Health Affairs, Trends, Health Spending Projections, February 2007
Projected

8/7/2019 Change in the Air (John Rother)
http://slidepdf.com/reader/full/change-in-the-air-john-rother 24/38
NOTES:

8/7/2019 Change in the Air (John Rother)
http://slidepdf.com/reader/full/change-in-the-air-john-rother 25/38
$0
$200
$400
$600
$800
Costs for Total Medicare ProgramCosts for Total Medicare Program
Billions
Overall Medicare Costs
Projection
Source: CMS, National Health Accounts
C

8/7/2019 Change in the Air (John Rother)
http://slidepdf.com/reader/full/change-in-the-air-john-rother 26/38
Costs for National Health ExpendituresCosts for National Health Expenditures
Billions
Overall Medicare Costs compared to Overall Health CostsSource: CMS, National Health Accounts
$0
$600
$1,200
$1,800
$2,400
$3,000
$3,600
1993 1998 2002 2004 2006 201
Costs for Total Medicare ProgramCosts for Total Medicare ProgramProjection

8/7/2019 Change in the Air (John Rother)
http://slidepdf.com/reader/full/change-in-the-air-john-rother 27/38

8/7/2019 Change in the Air (John Rother)
http://slidepdf.com/reader/full/change-in-the-air-john-rother 28/38
Analysis of Cost Growth over 4 years
0%
20%
40%
60%
80%
100%
Source:Na
tiona
lHeal th
ExpendituresA
cco
unts:
Definitions,Sources,a
ndMethod
sused
intheNHEA2
004,CMS
GeneralInflation
Medical Inflationabove general inflation
Population Growth
Intensity, Volume,Technological Change
& other residual factors
Factors in Healthcare Cost Growth
2000-04

8/7/2019 Change in the Air (John Rother)
http://slidepdf.com/reader/full/change-in-the-air-john-rother 29/38
Annual Malpractice Premiumscompared to total HC Expenditures
Source: In 2005, total National Health Expenditures were $1.988 trillion, CMS.The 2005 amount spent on malpractice insurance was $12 billion, according to NAIC
$1.988 TRILLIONin Health CareExpenditures
$12 billion inMalpractice Premiums

8/7/2019 Change in the Air (John Rother)
http://slidepdf.com/reader/full/change-in-the-air-john-rother 30/38
52%
19%
12%4%
0%
10%
20%
30%
40%
50%
60%
70%
80%
90%
100%
Retained as
PersonalIncome
Office Staff Office
Expenses
Malpractice
Premiums
Malpractice Premiums as a Percent of Physician Gross Income
Source: www.cms.hhs.gov/MedicareProgramRatesStats/downloads/mktbskt-economic-index.pdf 2006, 2005 data
P
ercent
ofPhysi cia
nIncome
2005

8/7/2019 Change in the Air (John Rother)
http://slidepdf.com/reader/full/change-in-the-air-john-rother 31/38
Effect of Excess HC Cost Growth

8/7/2019 Change in the Air (John Rother)
http://slidepdf.com/reader/full/change-in-the-air-john-rother 32/38
NOTES:
4 H l h S i h Bi 10

8/7/2019 Change in the Air (John Rother)
http://slidepdf.com/reader/full/change-in-the-air-john-rother 33/38
4 Health Sectors with Biggest 10-yearCost Increases, 1995 through 2004
4.3%
14.9%
0.9%
4.8%
3.5%
9.1%
2.9%
2.4% 4.3%
0.8%
2.8%1.5%
26.8%
20.9%
Hospital Care
Physician and Clinical Services
Dental Services
Other Prof. Services
Home Health Care
Other Non-Durable Medical Product
Rx Drugs
Durable Medical Equipment
Nursing Home Care
Other Personal Health Care
Admin. & Net Cost of Priv. HealthInsurancePublic Health Activity
Research
Structures & Equipment
Source:Calcu
lationsbyPP
IAARPusing
Centersfo
rMedicare&Medicaid
Services,Offi c
eoftheAct u
ary,CY1960-2004Natio
nalHealthEx
penditureData
HospitalsHospitals
Rx DrugsRx Drugs
Physician &Physician &
ClinicalClinicalServicesServices
Administration &Administration &
Net Cost of Private InsNet Cost of Private Ins27%
21%15%
9%

8/7/2019 Change in the Air (John Rother)
http://slidepdf.com/reader/full/change-in-the-air-john-rother 34/38

8/7/2019 Change in the Air (John Rother)
http://slidepdf.com/reader/full/change-in-the-air-john-rother 35/38
G d Ch i C M t K

8/7/2019 Change in the Air (John Rother)
http://slidepdf.com/reader/full/change-in-the-air-john-rother 36/38
Percent of Population
100%
20
40
60
80
20% 40% 60% 80% 100%
0%
3% of costs for50% of people
22% of costs for
1% of people
%
Health
Care
Dollar
sS
pent
Good Chronic Care Management Keyto a Large Segment of Cost
SOURCE: Conwell & Cohen, Agency for Healthcare Research and Quality, Statistical Brief #73, March 2005

8/7/2019 Change in the Air (John Rother)
http://slidepdf.com/reader/full/change-in-the-air-john-rother 37/38
Shared responsibility is necessary
BusinessGovernment
Individuals

8/7/2019 Change in the Air (John Rother)
http://slidepdf.com/reader/full/change-in-the-air-john-rother 38/38
2004 Election Analysis
– About 43% of the total vote was cast by 50+
– About 17% was cast by Americans 65+
– About 17% was cast by Americans under-30