
CHANDLER MALL SUBLEASE
11
PROPERTY HIGHLIGHTS SITE PLAN / AVAILABILITY AERIAL CONTACT DEMOGRAPHICS CHANDLER MALL SUBLEASE Chandler Blvd & Loop 101 - West of the Southwest Corner Chandler, Arizona Approximately 2,000 SF End Cap Brian Gast 602.682.8155 [email protected]
Transcript of CHANDLER MALL SUBLEASE
PROPERTY HIGHLIGHTS SITE PLAN / AVAILABILITY AERIAL CONTACT DEMOGRAPHICS
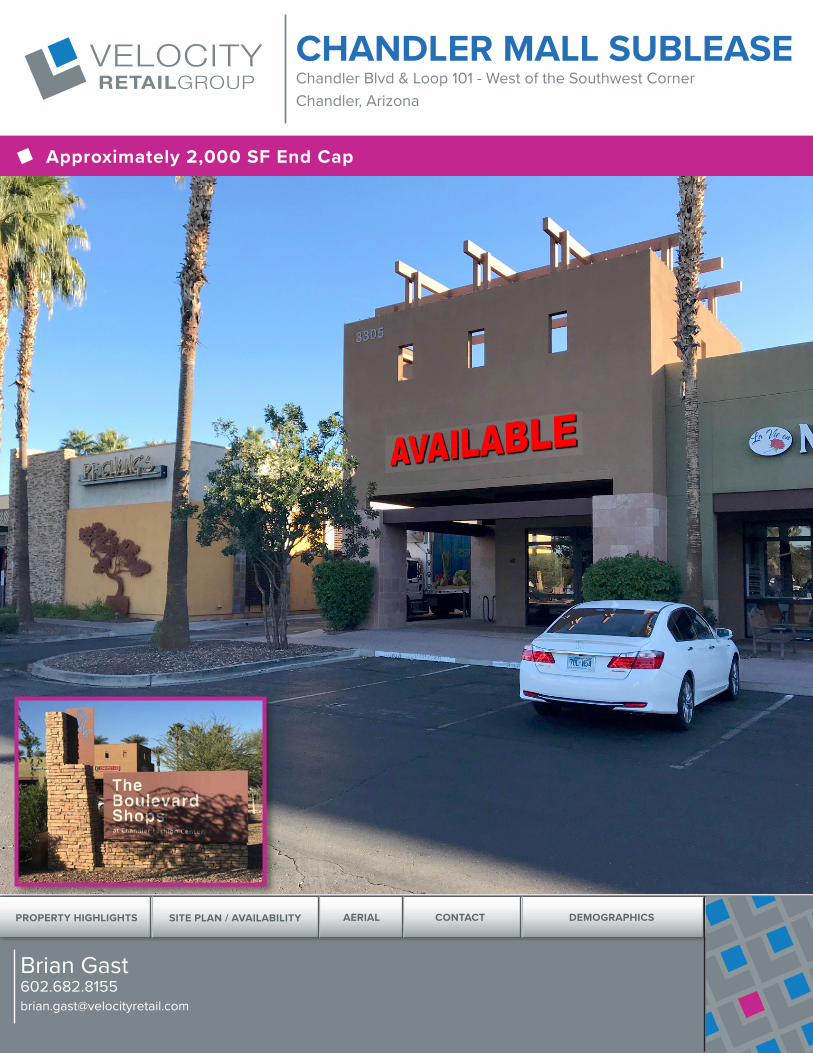
CHANDLER MALL SUBLEASEChandler Blvd & Loop 101 - West of the Southwest CornerChandler, Arizona
Approximately 2,000 SF End Cap
Brian [email protected]
PROPERTY HIGHLIGHTS SITE PLAN / AVAILABILITY AERIAL CONTACT DEMOGRAPHICS
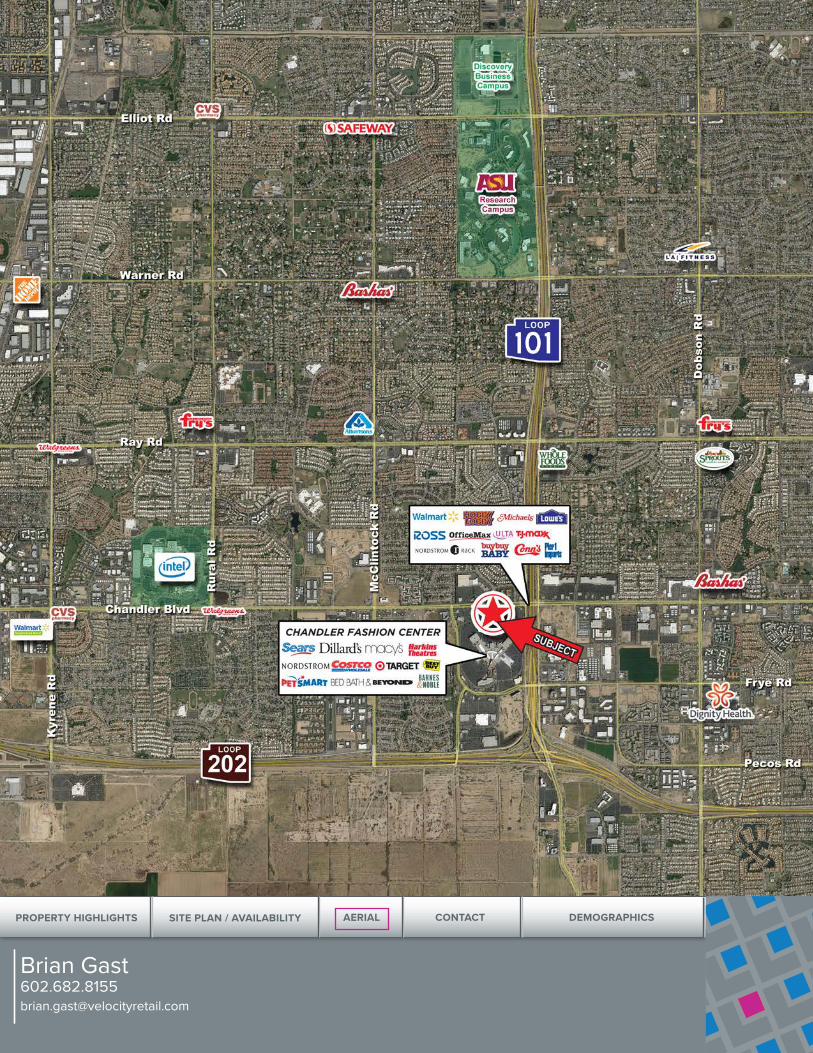
Property Highlights• Located in The Boulevard Shops at the
Chandler Mall• End Cap with great signage at one of the main
entrances to the mall• Adjacent to PF Chang’s• Over 40,000 cars per day drive right in front of
this space• Great demographics at one of Arizona’s top
regional malls
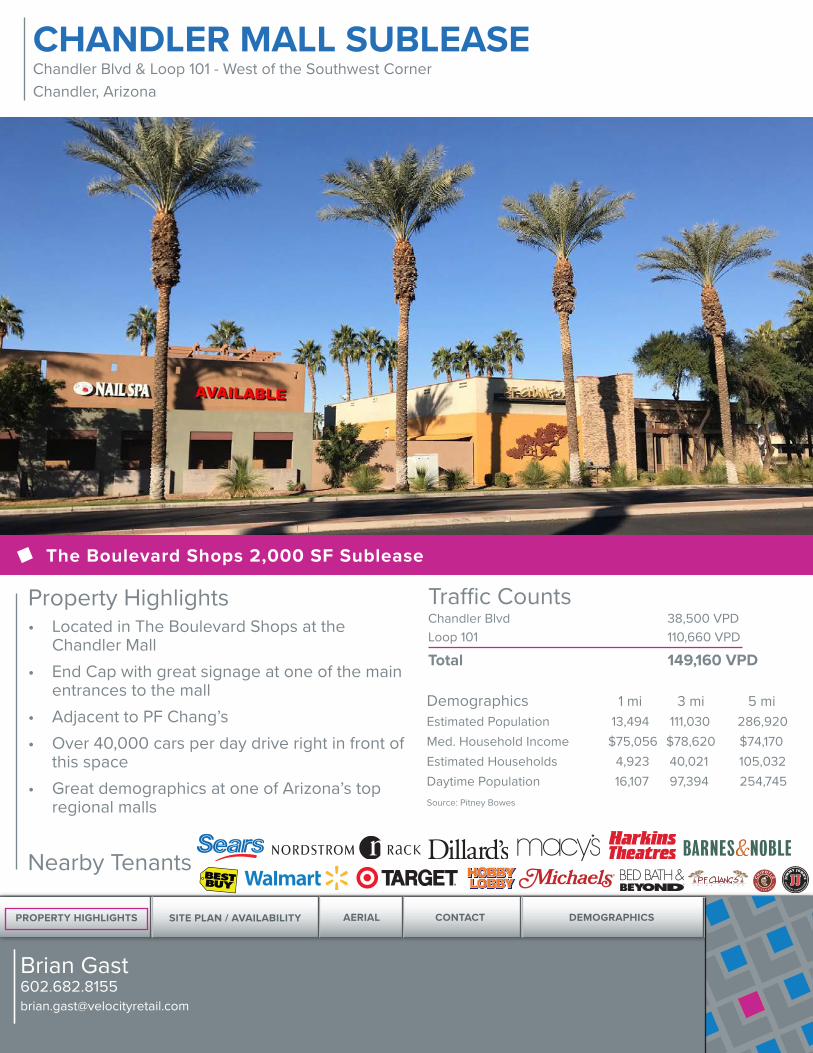
Traffic CountsChandler Blvd 38,500 VPDLoop 101 110,660 VPD
Total 149,160 VPD
Demographics 1 mi 3 mi 5 miEstimated Population 13,494 111,030 286,920Med. Household Income $75,056 $78,620 $74,170Estimated Households 4,923 40,021 105,032Daytime Population 16,107 97,394 254,745Source: Pitney Bowes
The Boulevard Shops 2,000 SF Sublease
CHANDLER MALL SUBLEASEChandler Blvd & Loop 101 - West of the Southwest CornerChandler, Arizona
Nearby Tenants
Brian [email protected]

PROPERTY HIGHLIGHTS SITE PLAN / AVAILABILITY AERIAL CONTACT DEMOGRAPHICS
Brian [email protected]
RING ROAD
27'-8
"60
'-0"
38'-1
0"21
'-3"
21'-9
"
170'-0"
32'-7
"30
'-1"
60'-3
"22
'-11"
38'-6
"19
'-4"
20'-8
"18
'-7"
23'-2
"
64'-10"
15'-2"
54'-0"
26'-0"
12'-0"48'-0"
10'-0"
50'
10'
60'
10'
70'
54'-10"
15'-2"
42'-5"
20'-8
"
27'-7"
20'-0
"14
'-0"
RING ROAD
27'-8
"38
'-10"
21'-3
"21
'-9"
170'-0"
32'-7
"30
'-1"
60'-3
"22
'-11"
38'-6
"19
'-4"
20'-8
"18
'-7"
23'-2
"
64'-10"
15'-2"
54'-0"
26'-0"
12'-0"48'-0"
10'-0"
50'
10'
60'
10'
70'
54'-10"
15'-2"
42'-5"
20'-8
"
27'-7"
20'-0
"14
'-0"
27'-8
"38
'-10"
21'-3
"21
'-9"
170'-0"
32'-7
"30
'-1"
60'-3
"22
'-11"
38'-6
"19
'-4"
20'-8
"18
'-7"
23'-2
"
64'-10"
15'-2"
54'-0"
26'-0"
80'-0"
70'-0"
12'-0"48'-0"
10'-0"
50'
10'
60'
60'10'
70'
54'-10"
15'-2"
42'-5"
20'-8
"
27'-7"
20'-0
"14
'-0"
NORTH
BOULEVARDSHOPS
NORTH
H05
F02
E01
E03
E04
E05
E09
E07
H01
H03
E02
G03
F03
F04
F07
F09
PADB02
F01
F08
NEKTER JUICE BAR1,439 SF
CAFE ZUPAS3,462 SF
AVAILABLE12,531 SF
FIVE GUYS BURGERSAND FRIES
2,200 SF
JIMMY JOHN'SGOURMET SANDWICHES
1,355 SF
CHIPOTLE MEXICAN GRILL2,205 SF
YOGURTLAND1,382 SF
FITNESS 4 HOMESUPERSTORE
2,631 SF
LASERAWAY1,414 SF
FINANCIAL ENGINES1,397 SF
ORECK VACUUMS1,488 SF
AHIPOKI BOWL2,000 SF
LA VIE EN NAIL SPA1,000 SF
GO WIRELESS1,900 SF
GEMSETTER & COMPANY1,753 SF
AMAZING LASH STUDIO2,325 SF
RED MOUNTAIN WEIGHT LOSS3,412 SF
P.F. CHANG'S7,000 SF
MERLE NORMAN697 SF
Mall Address:
BOULEVARD SHOPS3405-3495 W. Chandler Blvd.
Chandler, AZ 85226
NORTH
LEASE PLAN
Note:This is a schematic plan onlyintended to show the general layoutof the shopping center or partthereof. This plan is not to be scaled.
LAST UPDATED: 12.04.14BY: G2
BOULEVARDSHOPS
visit our web site atwww.macerich.com
For LeasingInformation Contact:
Greg CochranMark LeBlanc
MACERICH11411 North Tatum Blvd.
Phoenix, AZ 85028Phone: (602) 953-6267
Fax: (602) 953-1964
For Big Box Leasing Contact:Jennifer Brigham
MACERICH11411 North Tatum Blvd.
Phoenix, AZ 85028Phone: (602) 953-6450
Fax: (602) 953-1964
For Pad and Restaurant Leasing Contact:
Jerry StraussMACERICH
11411 North Tatum Blvd.Phoenix, AZ 85028
Phone: (602) 953-6521Fax: (602) 953-1964
Mall Address:
BOULEVARD SHOPS3405-3495 W. Chandler Blvd.
Chandler, AZ 85226
NORTH
Last Updated:JAN 02, 2018
CHANDLER MALL SUBLEASEChandler Blvd & Loop 101 - West of the Southwest CornerChandler, Arizona
AVAILABLE
PROPERTY HIGHLIGHTS SITE PLAN / AVAILABILITY AERIAL CONTACT DEMOGRAPHICS
Demographic Source: Applied Geographic Solutions 04/2018, TIGER Geography page 1 of 5©2018, Sites USA, Chandler, Arizona, 480-491-1112
Thi
s re
port
was
pro
duce
d us
ing
data
from
priv
ate
and
gove
rnm
ent s
ourc
es d
eem
ed to
be
relia
ble.
The
info
rmat
ion
here
in is
pro
vide
d w
ithou
t rep
rese
ntat
ion
or w
arra
nty.
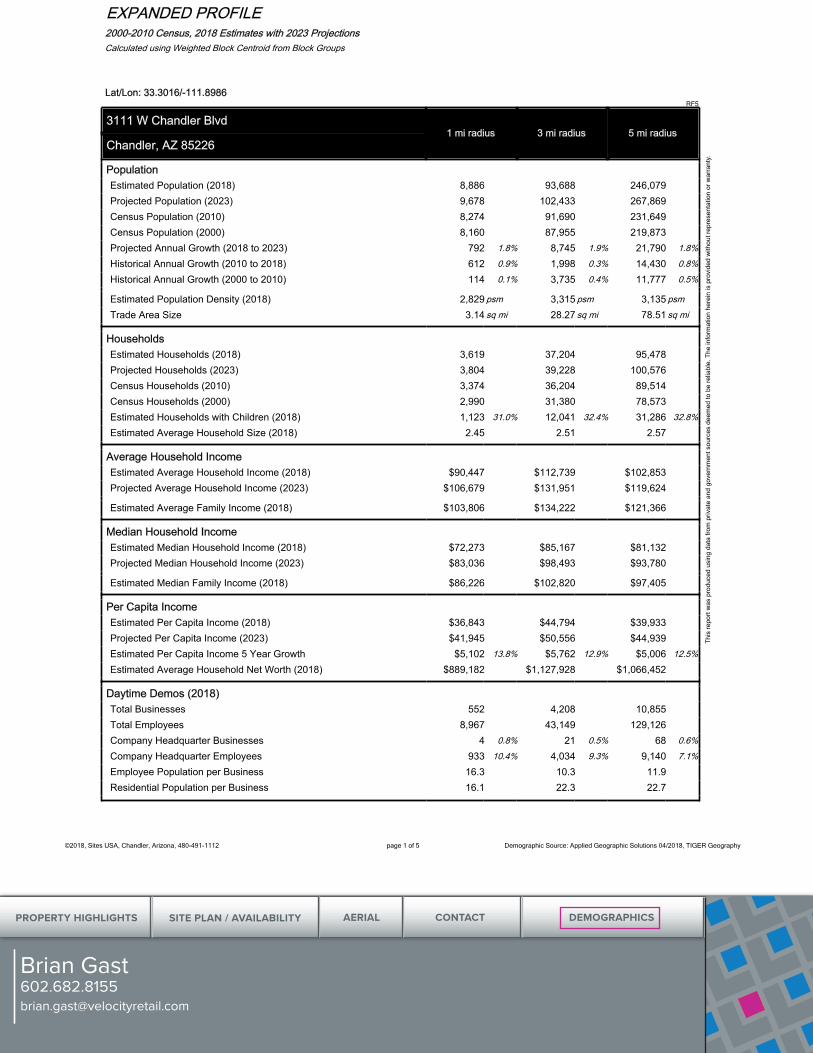
EXPANDED PROFILE2000-2010 Census, 2018 Estimates with 2023 ProjectionsCalculated using Weighted Block Centroid from Block Groups
Lat/Lon: 33.3016/-111.8986RF5
3111 W Chandler Blvd1 mi radius 3 mi radius 5 mi radius
Chandler, AZ 85226
PopulationEstimated Population (2018) 8,886 93,688 246,079Projected Population (2023) 9,678 102,433 267,869Census Population (2010) 8,274 91,690 231,649Census Population (2000) 8,160 87,955 219,873Projected Annual Growth (2018 to 2023) 792 1.8% 8,745 1.9% 21,790 1.8%
Historical Annual Growth (2010 to 2018) 612 0.9% 1,998 0.3% 14,430 0.8%
Historical Annual Growth (2000 to 2010) 114 0.1% 3,735 0.4% 11,777 0.5%
Estimated Population Density (2018) 2,829 psm 3,315 psm 3,135 psm
Trade Area Size 3.14 sq mi 28.27 sq mi 78.51 sq mi
HouseholdsEstimated Households (2018) 3,619 37,204 95,478Projected Households (2023) 3,804 39,228 100,576Census Households (2010) 3,374 36,204 89,514Census Households (2000) 2,990 31,380 78,573Estimated Households with Children (2018) 1,123 31.0% 12,041 32.4% 31,286 32.8%
Estimated Average Household Size (2018) 2.45 2.51 2.57
Average Household IncomeEstimated Average Household Income (2018) $90,447 $112,739 $102,853Projected Average Household Income (2023) $106,679 $131,951 $119,624
Estimated Average Family Income (2018) $103,806 $134,222 $121,366
Median Household IncomeEstimated Median Household Income (2018) $72,273 $85,167 $81,132Projected Median Household Income (2023) $83,036 $98,493 $93,780
Estimated Median Family Income (2018) $86,226 $102,820 $97,405
Per Capita IncomeEstimated Per Capita Income (2018) $36,843 $44,794 $39,933Projected Per Capita Income (2023) $41,945 $50,556 $44,939Estimated Per Capita Income 5 Year Growth $5,102 13.8% $5,762 12.9% $5,006 12.5%
Estimated Average Household Net Worth (2018) $889,182 $1,127,928 $1,066,452
Daytime Demos (2018)Total Businesses 552 4,208 10,855Total Employees 8,967 43,149 129,126Company Headquarter Businesses 4 0.8% 21 0.5% 68 0.6%
Company Headquarter Employees 933 10.4% 4,034 9.3% 9,140 7.1%
Employee Population per Business 16.3 10.3 11.9Residential Population per Business 16.1 22.3 22.7
Brian [email protected]
PROPERTY HIGHLIGHTS SITE PLAN / AVAILABILITY AERIAL CONTACT DEMOGRAPHICS
Demographic Source: Applied Geographic Solutions 04/2018, TIGER Geography page 2 of 5©2018, Sites USA, Chandler, Arizona, 480-491-1112
Thi
s re
port
was
pro
duce
d us
ing
data
from
priv
ate
and
gove
rnm
ent s
ourc
es d
eem
ed to
be
relia
ble.
The
info
rmat
ion
here
in is
pro
vide
d w
ithou
t rep
rese
ntat
ion
or w
arra
nty.
EXPANDED PROFILE2000-2010 Census, 2018 Estimates with 2023 ProjectionsCalculated using Weighted Block Centroid from Block Groups
Lat/Lon: 33.3016/-111.8986RF5
3111 W Chandler Blvd1 mi radius 3 mi radius 5 mi radius
Chandler, AZ 85226
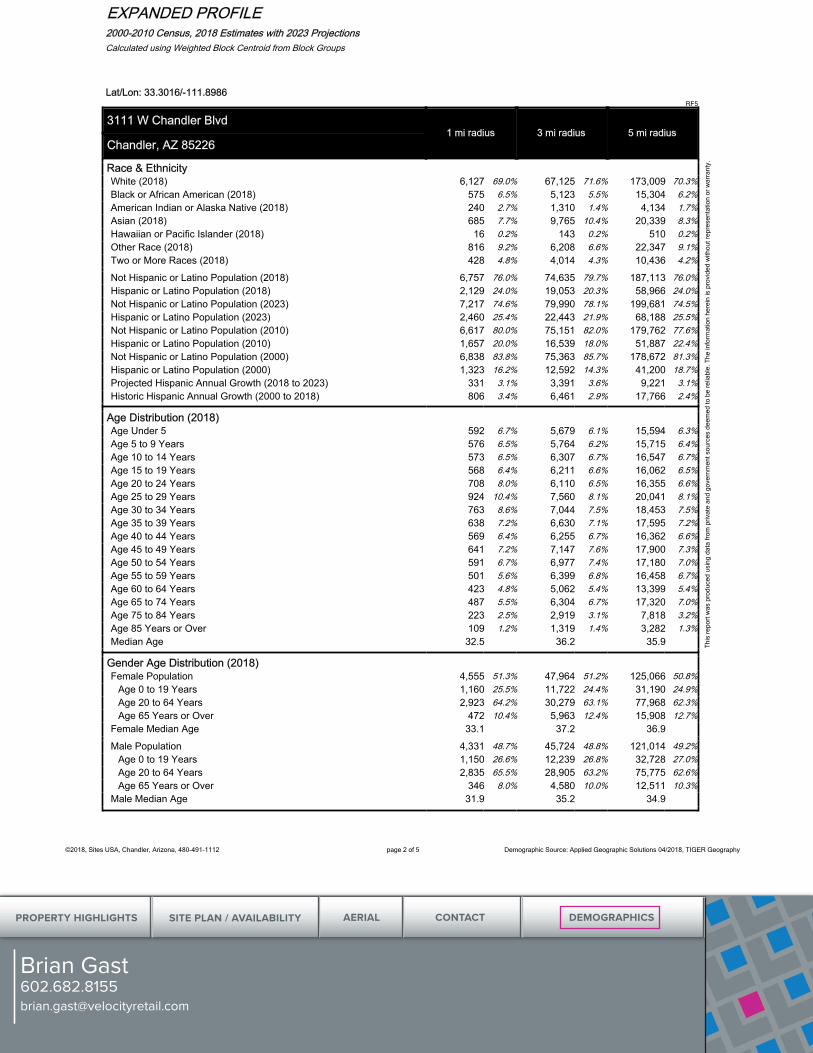
Race & EthnicityWhite (2018) 6,127 69.0% 67,125 71.6% 173,009 70.3%Black or African American (2018) 575 6.5% 5,123 5.5% 15,304 6.2%American Indian or Alaska Native (2018) 240 2.7% 1,310 1.4% 4,134 1.7%Asian (2018) 685 7.7% 9,765 10.4% 20,339 8.3%Hawaiian or Pacific Islander (2018) 16 0.2% 143 0.2% 510 0.2%Other Race (2018) 816 9.2% 6,208 6.6% 22,347 9.1%Two or More Races (2018) 428 4.8% 4,014 4.3% 10,436 4.2%
Not Hispanic or Latino Population (2018) 6,757 76.0% 74,635 79.7% 187,113 76.0%Hispanic or Latino Population (2018) 2,129 24.0% 19,053 20.3% 58,966 24.0%Not Hispanic or Latino Population (2023) 7,217 74.6% 79,990 78.1% 199,681 74.5%Hispanic or Latino Population (2023) 2,460 25.4% 22,443 21.9% 68,188 25.5%Not Hispanic or Latino Population (2010) 6,617 80.0% 75,151 82.0% 179,762 77.6%Hispanic or Latino Population (2010) 1,657 20.0% 16,539 18.0% 51,887 22.4%Not Hispanic or Latino Population (2000) 6,838 83.8% 75,363 85.7% 178,672 81.3%Hispanic or Latino Population (2000) 1,323 16.2% 12,592 14.3% 41,200 18.7%Projected Hispanic Annual Growth (2018 to 2023) 331 3.1% 3,391 3.6% 9,221 3.1%Historic Hispanic Annual Growth (2000 to 2018) 806 3.4% 6,461 2.9% 17,766 2.4%
Age Distribution (2018)Age Under 5 592 6.7% 5,679 6.1% 15,594 6.3%Age 5 to 9 Years 576 6.5% 5,764 6.2% 15,715 6.4%Age 10 to 14 Years 573 6.5% 6,307 6.7% 16,547 6.7%Age 15 to 19 Years 568 6.4% 6,211 6.6% 16,062 6.5%Age 20 to 24 Years 708 8.0% 6,110 6.5% 16,355 6.6%Age 25 to 29 Years 924 10.4% 7,560 8.1% 20,041 8.1%Age 30 to 34 Years 763 8.6% 7,044 7.5% 18,453 7.5%Age 35 to 39 Years 638 7.2% 6,630 7.1% 17,595 7.2%Age 40 to 44 Years 569 6.4% 6,255 6.7% 16,362 6.6%Age 45 to 49 Years 641 7.2% 7,147 7.6% 17,900 7.3%Age 50 to 54 Years 591 6.7% 6,977 7.4% 17,180 7.0%Age 55 to 59 Years 501 5.6% 6,399 6.8% 16,458 6.7%Age 60 to 64 Years 423 4.8% 5,062 5.4% 13,399 5.4%Age 65 to 74 Years 487 5.5% 6,304 6.7% 17,320 7.0%Age 75 to 84 Years 223 2.5% 2,919 3.1% 7,818 3.2%Age 85 Years or Over 109 1.2% 1,319 1.4% 3,282 1.3%Median Age 32.5 36.2 35.9
Gender Age Distribution (2018)Female Population 4,555 51.3% 47,964 51.2% 125,066 50.8%
Age 0 to 19 Years 1,160 25.5% 11,722 24.4% 31,190 24.9%Age 20 to 64 Years 2,923 64.2% 30,279 63.1% 77,968 62.3%Age 65 Years or Over 472 10.4% 5,963 12.4% 15,908 12.7%
Female Median Age 33.1 37.2 36.9
Male Population 4,331 48.7% 45,724 48.8% 121,014 49.2%Age 0 to 19 Years 1,150 26.6% 12,239 26.8% 32,728 27.0%Age 20 to 64 Years 2,835 65.5% 28,905 63.2% 75,775 62.6%Age 65 Years or Over 346 8.0% 4,580 10.0% 12,511 10.3%
Male Median Age 31.9 35.2 34.9
Brian [email protected]
PROPERTY HIGHLIGHTS SITE PLAN / AVAILABILITY AERIAL CONTACT DEMOGRAPHICS
Demographic Source: Applied Geographic Solutions 04/2018, TIGER Geography page 3 of 5©2018, Sites USA, Chandler, Arizona, 480-491-1112
Thi
s re
port
was
pro
duce
d us
ing
data
from
priv
ate
and
gove
rnm
ent s
ourc
es d
eem
ed to
be
relia
ble.
The
info
rmat
ion
here
in is
pro
vide
d w
ithou
t rep
rese
ntat
ion
or w
arra
nty.
EXPANDED PROFILE2000-2010 Census, 2018 Estimates with 2023 ProjectionsCalculated using Weighted Block Centroid from Block Groups
Lat/Lon: 33.3016/-111.8986RF5
3111 W Chandler Blvd1 mi radius 3 mi radius 5 mi radius
Chandler, AZ 85226
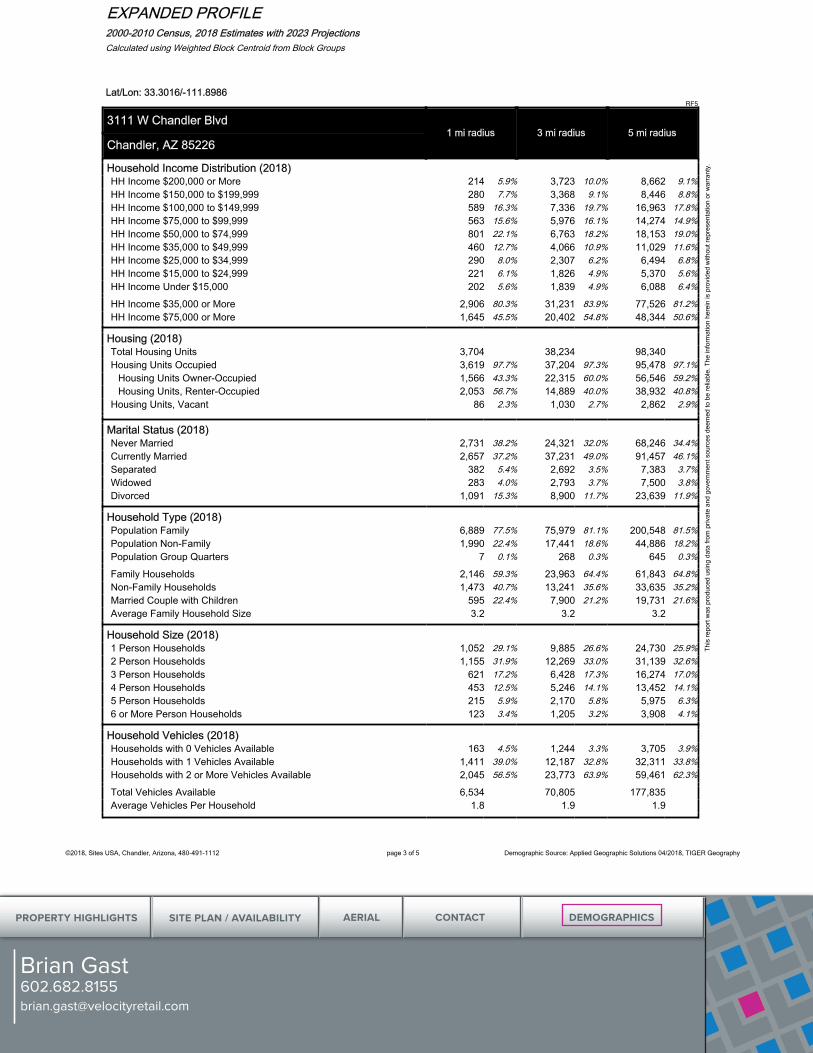
Household Income Distribution (2018)HH Income $200,000 or More 214 5.9% 3,723 10.0% 8,662 9.1%HH Income $150,000 to $199,999 280 7.7% 3,368 9.1% 8,446 8.8%HH Income $100,000 to $149,999 589 16.3% 7,336 19.7% 16,963 17.8%HH Income $75,000 to $99,999 563 15.6% 5,976 16.1% 14,274 14.9%HH Income $50,000 to $74,999 801 22.1% 6,763 18.2% 18,153 19.0%HH Income $35,000 to $49,999 460 12.7% 4,066 10.9% 11,029 11.6%HH Income $25,000 to $34,999 290 8.0% 2,307 6.2% 6,494 6.8%HH Income $15,000 to $24,999 221 6.1% 1,826 4.9% 5,370 5.6%HH Income Under $15,000 202 5.6% 1,839 4.9% 6,088 6.4%
HH Income $35,000 or More 2,906 80.3% 31,231 83.9% 77,526 81.2%HH Income $75,000 or More 1,645 45.5% 20,402 54.8% 48,344 50.6%
Housing (2018)Total Housing Units 3,704 38,234 98,340Housing Units Occupied 3,619 97.7% 37,204 97.3% 95,478 97.1%
Housing Units Owner-Occupied 1,566 43.3% 22,315 60.0% 56,546 59.2%Housing Units, Renter-Occupied 2,053 56.7% 14,889 40.0% 38,932 40.8%
Housing Units, Vacant 86 2.3% 1,030 2.7% 2,862 2.9%
Marital Status (2018)Never Married 2,731 38.2% 24,321 32.0% 68,246 34.4%Currently Married 2,657 37.2% 37,231 49.0% 91,457 46.1%Separated 382 5.4% 2,692 3.5% 7,383 3.7%Widowed 283 4.0% 2,793 3.7% 7,500 3.8%Divorced 1,091 15.3% 8,900 11.7% 23,639 11.9%
Household Type (2018)Population Family 6,889 77.5% 75,979 81.1% 200,548 81.5%Population Non-Family 1,990 22.4% 17,441 18.6% 44,886 18.2%Population Group Quarters 7 0.1% 268 0.3% 645 0.3%
Family Households 2,146 59.3% 23,963 64.4% 61,843 64.8%Non-Family Households 1,473 40.7% 13,241 35.6% 33,635 35.2%Married Couple with Children 595 22.4% 7,900 21.2% 19,731 21.6%Average Family Household Size 3.2 3.2 3.2
Household Size (2018)1 Person Households 1,052 29.1% 9,885 26.6% 24,730 25.9%2 Person Households 1,155 31.9% 12,269 33.0% 31,139 32.6%3 Person Households 621 17.2% 6,428 17.3% 16,274 17.0%4 Person Households 453 12.5% 5,246 14.1% 13,452 14.1%5 Person Households 215 5.9% 2,170 5.8% 5,975 6.3%6 or More Person Households 123 3.4% 1,205 3.2% 3,908 4.1%
Household Vehicles (2018)Households with 0 Vehicles Available 163 4.5% 1,244 3.3% 3,705 3.9%Households with 1 Vehicles Available 1,411 39.0% 12,187 32.8% 32,311 33.8%Households with 2 or More Vehicles Available 2,045 56.5% 23,773 63.9% 59,461 62.3%
Total Vehicles Available 6,534 70,805 177,835Average Vehicles Per Household 1.8 1.9 1.9
Brian [email protected]
PROPERTY HIGHLIGHTS SITE PLAN / AVAILABILITY AERIAL CONTACT DEMOGRAPHICS
Demographic Source: Applied Geographic Solutions 04/2018, TIGER Geography page 4 of 5©2018, Sites USA, Chandler, Arizona, 480-491-1112
Thi
s re
port
was
pro
duce
d us
ing
data
from
priv
ate
and
gove
rnm
ent s
ourc
es d
eem
ed to
be
relia
ble.
The
info
rmat
ion
here
in is
pro
vide
d w
ithou
t rep
rese
ntat
ion
or w
arra
nty.
EXPANDED PROFILE2000-2010 Census, 2018 Estimates with 2023 ProjectionsCalculated using Weighted Block Centroid from Block Groups
Lat/Lon: 33.3016/-111.8986RF5
3111 W Chandler Blvd1 mi radius 3 mi radius 5 mi radius
Chandler, AZ 85226
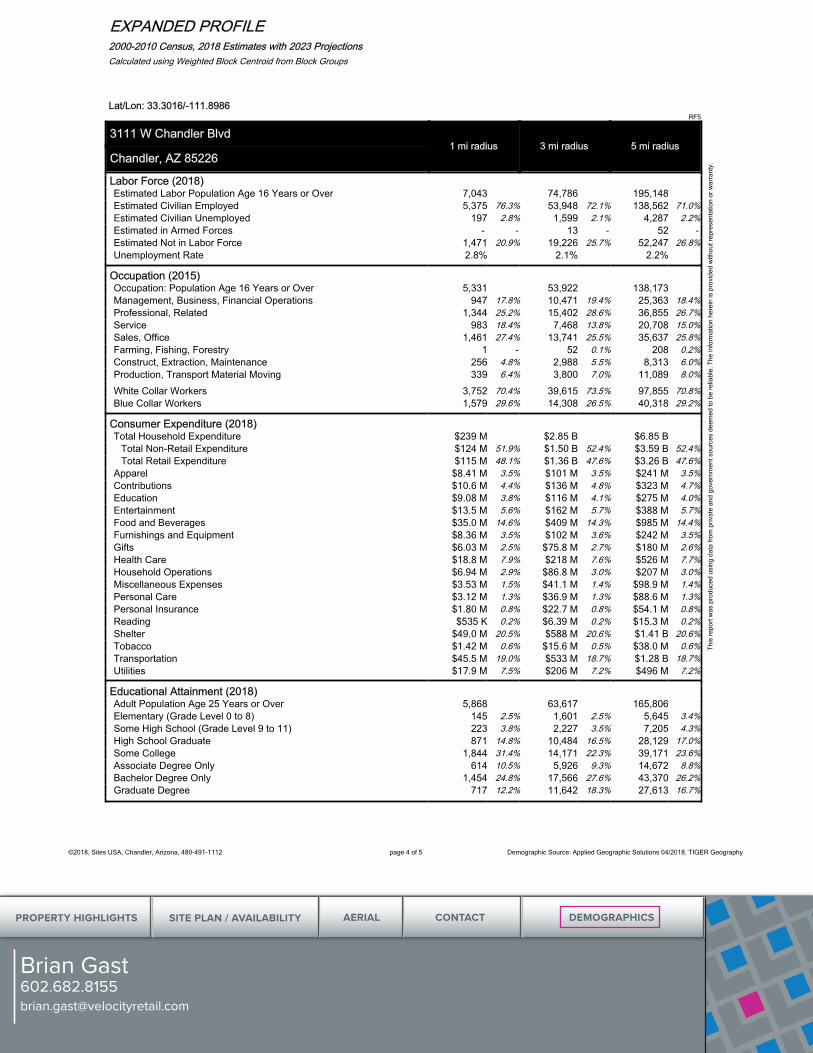
Labor Force (2018)Estimated Labor Population Age 16 Years or Over 7,043 74,786 195,148Estimated Civilian Employed 5,375 76.3% 53,948 72.1% 138,562 71.0%Estimated Civilian Unemployed 197 2.8% 1,599 2.1% 4,287 2.2%Estimated in Armed Forces - - 13 - 52 - Estimated Not in Labor Force 1,471 20.9% 19,226 25.7% 52,247 26.8%Unemployment Rate 2.8% 2.1% 2.2%
Occupation (2015)Occupation: Population Age 16 Years or Over 5,331 53,922 138,173Management, Business, Financial Operations 947 17.8% 10,471 19.4% 25,363 18.4%Professional, Related 1,344 25.2% 15,402 28.6% 36,855 26.7%Service 983 18.4% 7,468 13.8% 20,708 15.0%Sales, Office 1,461 27.4% 13,741 25.5% 35,637 25.8%Farming, Fishing, Forestry 1 - 52 0.1% 208 0.2%Construct, Extraction, Maintenance 256 4.8% 2,988 5.5% 8,313 6.0%Production, Transport Material Moving 339 6.4% 3,800 7.0% 11,089 8.0%
White Collar Workers 3,752 70.4% 39,615 73.5% 97,855 70.8%Blue Collar Workers 1,579 29.6% 14,308 26.5% 40,318 29.2%
Consumer Expenditure (2018)Total Household Expenditure $239 M $2.85 B $6.85 B
Total Non-Retail Expenditure $124 M 51.9% $1.50 B 52.4% $3.59 B 52.4%Total Retail Expenditure $115 M 48.1% $1.36 B 47.6% $3.26 B 47.6%
Apparel $8.41 M 3.5% $101 M 3.5% $241 M 3.5%Contributions $10.6 M 4.4% $136 M 4.8% $323 M 4.7%Education $9.08 M 3.8% $116 M 4.1% $275 M 4.0%Entertainment $13.5 M 5.6% $162 M 5.7% $388 M 5.7%Food and Beverages $35.0 M 14.6% $409 M 14.3% $985 M 14.4%Furnishings and Equipment $8.36 M 3.5% $102 M 3.6% $242 M 3.5%Gifts $6.03 M 2.5% $75.8 M 2.7% $180 M 2.6%Health Care $18.8 M 7.9% $218 M 7.6% $526 M 7.7%Household Operations $6.94 M 2.9% $86.8 M 3.0% $207 M 3.0%Miscellaneous Expenses $3.53 M 1.5% $41.1 M 1.4% $98.9 M 1.4%Personal Care $3.12 M 1.3% $36.9 M 1.3% $88.6 M 1.3%Personal Insurance $1.80 M 0.8% $22.7 M 0.8% $54.1 M 0.8%Reading $535 K 0.2% $6.39 M 0.2% $15.3 M 0.2%Shelter $49.0 M 20.5% $588 M 20.6% $1.41 B 20.6%Tobacco $1.42 M 0.6% $15.6 M 0.5% $38.0 M 0.6%Transportation $45.5 M 19.0% $533 M 18.7% $1.28 B 18.7%Utilities $17.9 M 7.5% $206 M 7.2% $496 M 7.2%
Educational Attainment (2018)Adult Population Age 25 Years or Over 5,868 63,617 165,806Elementary (Grade Level 0 to 8) 145 2.5% 1,601 2.5% 5,645 3.4%Some High School (Grade Level 9 to 11) 223 3.8% 2,227 3.5% 7,205 4.3%High School Graduate 871 14.8% 10,484 16.5% 28,129 17.0%Some College 1,844 31.4% 14,171 22.3% 39,171 23.6%Associate Degree Only 614 10.5% 5,926 9.3% 14,672 8.8%Bachelor Degree Only 1,454 24.8% 17,566 27.6% 43,370 26.2%Graduate Degree 717 12.2% 11,642 18.3% 27,613 16.7%
Brian [email protected]
PROPERTY HIGHLIGHTS SITE PLAN / AVAILABILITY AERIAL CONTACT DEMOGRAPHICS
Demographic Source: Applied Geographic Solutions 04/2018, TIGER Geography page 5 of 5©2018, Sites USA, Chandler, Arizona, 480-491-1112
Thi
s re
port
was
pro
duce
d us
ing
data
from
priv
ate
and
gove
rnm
ent s
ourc
es d
eem
ed to
be
relia
ble.
The
info
rmat
ion
here
in is
pro
vide
d w
ithou
t rep
rese
ntat
ion
or w
arra
nty.
EXPANDED PROFILE2000-2010 Census, 2018 Estimates with 2023 ProjectionsCalculated using Weighted Block Centroid from Block Groups
Lat/Lon: 33.3016/-111.8986RF5
3111 W Chandler Blvd1 mi radius 3 mi radius 5 mi radius
Chandler, AZ 85226
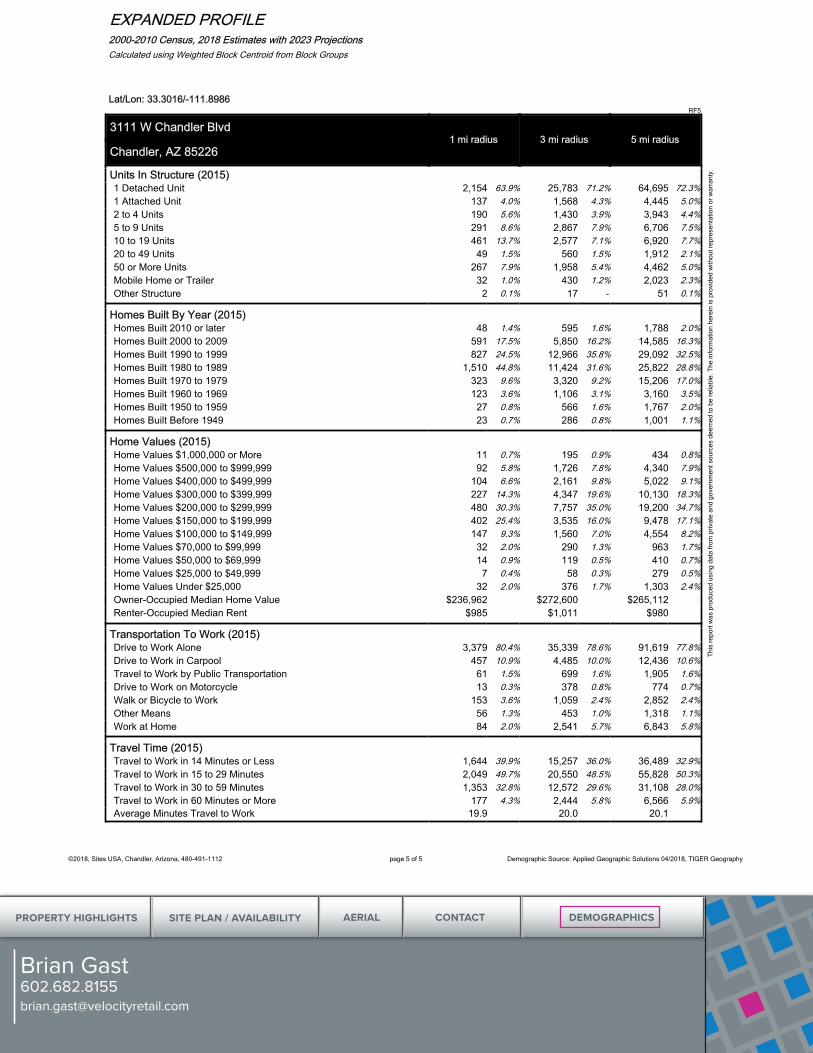
Units In Structure (2015)1 Detached Unit 2,154 63.9% 25,783 71.2% 64,695 72.3%1 Attached Unit 137 4.0% 1,568 4.3% 4,445 5.0%2 to 4 Units 190 5.6% 1,430 3.9% 3,943 4.4%5 to 9 Units 291 8.6% 2,867 7.9% 6,706 7.5%10 to 19 Units 461 13.7% 2,577 7.1% 6,920 7.7%20 to 49 Units 49 1.5% 560 1.5% 1,912 2.1%50 or More Units 267 7.9% 1,958 5.4% 4,462 5.0%Mobile Home or Trailer 32 1.0% 430 1.2% 2,023 2.3%Other Structure 2 0.1% 17 - 51 0.1%
Homes Built By Year (2015)Homes Built 2010 or later 48 1.4% 595 1.6% 1,788 2.0%Homes Built 2000 to 2009 591 17.5% 5,850 16.2% 14,585 16.3%Homes Built 1990 to 1999 827 24.5% 12,966 35.8% 29,092 32.5%Homes Built 1980 to 1989 1,510 44.8% 11,424 31.6% 25,822 28.8%Homes Built 1970 to 1979 323 9.6% 3,320 9.2% 15,206 17.0%Homes Built 1960 to 1969 123 3.6% 1,106 3.1% 3,160 3.5%Homes Built 1950 to 1959 27 0.8% 566 1.6% 1,767 2.0%Homes Built Before 1949 23 0.7% 286 0.8% 1,001 1.1%
Home Values (2015)Home Values $1,000,000 or More 11 0.7% 195 0.9% 434 0.8%Home Values $500,000 to $999,999 92 5.8% 1,726 7.8% 4,340 7.9%Home Values $400,000 to $499,999 104 6.6% 2,161 9.8% 5,022 9.1%Home Values $300,000 to $399,999 227 14.3% 4,347 19.6% 10,130 18.3%Home Values $200,000 to $299,999 480 30.3% 7,757 35.0% 19,200 34.7%Home Values $150,000 to $199,999 402 25.4% 3,535 16.0% 9,478 17.1%Home Values $100,000 to $149,999 147 9.3% 1,560 7.0% 4,554 8.2%Home Values $70,000 to $99,999 32 2.0% 290 1.3% 963 1.7%Home Values $50,000 to $69,999 14 0.9% 119 0.5% 410 0.7%Home Values $25,000 to $49,999 7 0.4% 58 0.3% 279 0.5%Home Values Under $25,000 32 2.0% 376 1.7% 1,303 2.4%Owner-Occupied Median Home Value $236,962 $272,600 $265,112Renter-Occupied Median Rent $985 $1,011 $980
Transportation To Work (2015)Drive to Work Alone 3,379 80.4% 35,339 78.6% 91,619 77.8%Drive to Work in Carpool 457 10.9% 4,485 10.0% 12,436 10.6%Travel to Work by Public Transportation 61 1.5% 699 1.6% 1,905 1.6%Drive to Work on Motorcycle 13 0.3% 378 0.8% 774 0.7%Walk or Bicycle to Work 153 3.6% 1,059 2.4% 2,852 2.4%Other Means 56 1.3% 453 1.0% 1,318 1.1%Work at Home 84 2.0% 2,541 5.7% 6,843 5.8%
Travel Time (2015)Travel to Work in 14 Minutes or Less 1,644 39.9% 15,257 36.0% 36,489 32.9%Travel to Work in 15 to 29 Minutes 2,049 49.7% 20,550 48.5% 55,828 50.3%Travel to Work in 30 to 59 Minutes 1,353 32.8% 12,572 29.6% 31,108 28.0%Travel to Work in 60 Minutes or More 177 4.3% 2,444 5.8% 6,566 5.9%Average Minutes Travel to Work 19.9 20.0 20.1
Brian [email protected]
PROPERTY HIGHLIGHTS SITE PLAN / AVAILABILITY AERIAL CONTACT DEMOGRAPHICS
2415 East Camelback Road, Suite 400Phoenix, Arizona 85016602.682.8100
The information contained in this brochure has been obtained from sources believed reliable. We have not verified the information, and make no guaran-tee, warranty or representation about it. Any financial projections, assumptions or estimates used are for example only and do not represent the current or future performance of the property. We recommend that you and/or your advisors conduct a complete analysis of the property and make your own deter-mination on the suitability of the property for your specific needs. Velocity Retail Group, LLC and the VRG logo are service marks of Velocity Retail Group, LLC. All other marks displayed in this document are the property of their respective owners.
Brian [email protected]