Willemien Troelstra Evelien van Doorn Benchmark Overheidskantoren 2008 11 december 2008.

Challenging Conformity: A Case for Diversity∗
Willemien Kets† Alvaro Sandroni‡
November 12, 2015
Abstract
Why do diverse groups outperform homogeneous groups in some settings, but not in
others? We show that while diverse groups experience more frictions than homogeneous
ones, they are also less conformist. Homogeneous groups minimize the risk of miscoor-
dination, but they may get stuck in an inefficient equilibrium. Diverse groups may fail
to coordinate, but if they do, they tend to attain efficiency. This fundamental tradeoff
determines how the optimal level of diversity varies with social and economic factors.
When it is vitally important to avoid miscoordination, homogeneous groups are opti-
mal. However, when it is critical to implement new and efficient practices, diverse groups
perform better.
∗Part of the material incorporated here was previously in a paper entitled “A belief-based theory of ho-
mophily” by the same authors (Kets and Sandroni, 2015a). We thank David Ahn, Larbi Alaoui, Sandeep Baliga,
Vincent Crawford, Vessela Daskalova, Georgy Egorov, Tim Feddersen, Matthew Jackson, Wouter Kager, Rachel
Kranton, George Mailath, Niko Matouschek, Friederike Mengel, Rosemarie Nagel, Alessandro Pavan, Antonio
Penta, Nicola Persico, Debraj Ray, Yuval Salant, Larry Samuelson, Paola Sapienza, Rajiv Sethi, Eran Shmaya,
Andy Skrzypacz, Jakub Steiner, Colin Stewart, Jeroen Swinkels, and numerous seminar audiences and confer-
ence participants for helpful comments and stimulating discussions.†Kellogg School of Management, Northwestern University. E-mail: [email protected]‡Kellogg School of Management, Northwestern University. E-mail: [email protected]
1

1. Introduction
Interacting with people like ourselves allows us to stay in our comfort zone. People with a
similar background pick up on the same subtle social cues, have a similar communication style,
and have similar experiences and beliefs (Gudykunst, 2004). Accordingly, homogeneous soci-
eties tend to be more cohesive, experience less conflict, and have fewer coordination problems
than more diverse ones (Jackson and Joshi, 2011). Yet, it pays for organizations to get out of
their comfort zone. Using 15 years of data on a large and comprehensive sample of public U.S.
corporations, Dezso and Ross (2012) show that, for innovation-focused firms, diversity leads
to better performance. Similarly, for innovation-focused banks, increases in racial diversity are
related to enhanced financial performance (Richard et al., 2003).1 However, in other settings,
diverse teams can experience severe communication problems, trumping all potential benefits
of diversity (De Dreu, 2006). Infamously, in January 1990 Avianca Flight 52 crashed, killing
73 of the 158 people on board, in large part due to poor communication between U.S. air traffic
control and Colombian crew (Cushman, 1990).
We analyze the effects of diversity on performance in a formal model. We consider a
setting where a manager chooses the composition of teams to maximize performance, that is,
total payoffs. Players are matched with other players in their team to play a game. Players
belong to different groups. If most of the team members belong to the same group, the team
is homogeneous. If the distribution of team members over groups is more even, the team is
diverse. Group membership is exogenous and observable; one can think of members of different
groups having different types such as race, gender, socioeconomic background, and so on.
Empirical evidence suggests that diversity can affect performance even if group membership
does not affect payoffs. For example, mergers and acquisitions often fail to meet expectations
due to incompatibilities in culture, even if there are obvious economic benefits (Cartwright
and Cooper, 1993). Indeed, if a player’s background and experiences influence his strategic
reasoning, then diversity can affect performance even if it has no direct effect on incentives.
As noted by Schelling (1960, p. 57, pp. 96–98), which equilibrium is played in a game with
multiple equilibria may depend on “who the parties are and what they know about each
other.” Players with different backgrounds may thus select different strategies, even if all are
fully rational and face the same incentives.
While intuitive, this is difficult to formalize using traditional game-theoretic methods. Clas-
1Also see Alesina et al. (2013) for cross-country evidence on the positive impact of diversity of skilled
immigration on economic development; Peri (2012) for state-level evidence that there is a positive association
between immigration and TFP; and Ottaviano and Peri (2006) for evidence that people that live in U.S. cities
that have become more culturally diverse experienced a significant increase in their wages. See Alesina and La
Ferrara (2005) for a survey of the effects of ethnic diversity on economic policies and outcomes.
2
sical game theory lacks a formal language to describe how a player’s identity can affect his
reasoning. To capture this, we enrich the standard game-theoretic framework by building on
the dual process account of Theory of Mind in psychology. This theory posits that an individ-
ual has an initial, instinctive reaction, and then adapt his views by reasoning about what he
would do if he were in the opponent’s position.2 In our model, players’ instinctive reactions
are modeled by impulses, that is, payoff-irrelevant signals that direct players to a course of
action. Each player then introspects on his impulse. That is, each player uses his own impulse
to form a conjecture about how his opponent might behave. In particular, a player who views
his opponent as someone who is similar to himself may think that his opponent is likely to
have a similar impulse. Players can then formulate a best response to their conjecture. How-
ever, players recognize that their opponent may have gone though a similar process. This may
lead them to revise their conjecture, and to formulate a best response to this revised conjec-
ture. This process continues to higher orders and the limit of this process is an introspective
equilibrium.
In an introspective equilibrium, players may fail to coordinate on one of the pure Nash
equilibria, yet achieve higher rates of coordination than in a mixed Nash equilibrium, consistent
with experimental evidence (Mehta et al., 1994). While introspective equilibrium thus allows
for non-Nash behavior, it should not be conflated with models where players can act irrationally.
As we show, the behavior predicted by introspective equilibrium is always consistent with
common knowledge of rationality.
Unlike in standard models, identity matters in an introspective equilibrium even if it is not
directly payoff relevant. This is the case if players with different backgrounds have different
impulses. For example, a major issue after the Sprint-Nextel merger in 2005 was that employees
who were used to the rigid rules at Sprint approached a situation differently than employees
accustomed to the more freewheeling culture of Nextel. Likewise, people who grew up in
collectivist cultures tend to react differently than people from individualistic cultures (Hofstede,
2001).
Cultural differences can be difficult to predict. The French, for example, generally commu-
nicate in a more indirect way than Americans, yet they are more direct in providing criticism
(Meyer, 2014). A Frenchman may know how to interpret criticism from a compatriot, while
an American may be taken aback. In general, it is easier to understand the perspective of
2See Epley and Waytz (2010) for a survey. The dual process account of Theory of Mind relies on a rapid
instinctive process and a slower cognitive process. As such, it is related to the two-systems account of decision-
making under uncertainty, popularized by Kahneman (2011), the foundations of which go back to the work of
the psychologist William James (1890/1983). See Section 2 for more discussion.
3

members of one’s own group, as opposed to outsiders.3
Accordingly, members of diverse teams may find it difficult to anticipate others’ instincts.
As a result, diverse teams may experience more frictions than homogeneous teams. However,
the very clash of perspectives that causes mishaps and misunderstandings in diverse teams may
also stimulate people to implement new solutions rather than sticking with established rou-
tines.The case of Pixar illustrates this point. In 2000, Pixar had just released three blockbuster
movies. Instead of continuing to work with the same team, Pixar hired Brad Bird, a director
who had just come off a movie that had been a financial failure. Bird engaged the “black
sheep” at Pixar – the artists “who have another way of doing things that nobody’s listening
to.” Bird also hired people that had no experience with the relevant animation technology
(Price, 2008). Pixar thus intentionally chose a diverse team. Indeed, it hired Bird “to come
shake things up” (Rao et al., 2008).
Pixar is renowned for stimulating diversity of thought, but the idea of bringing in outsiders
to provide a fresh perspective is of course hardly new.4 We study the effects of diversity in a
formal model. We focus on coordination games.5 Examples of coordination problems in orga-
nizations abound. Coordination on the same communication style (e.g., direct or indirect) is
central to communication (Cremer, 1993). Coordination on common meaning facilitates trade
(Lazear, 1999a) and makes it possible for an organization to use implicit contracts (Camerer
and Knez, 2002) or to deal with unforeseen contingencies (Kreps, 1990).
In coordination games, players face two types of difficulties: how to avoid miscoordination
and how to avoid coordination on an inefficient equilibrium. When players can accurately
predict other players’ reactions, as in homogeneous teams, they can avoid miscoordination by
conforming to what they expect others will do, even if that means coordinating on an inefficient
option. By contrast, in diverse teams, players’ impulses are not very informative of others’
reactions, and choices are driven primarily by payoff considerations.
We use this insight to characterize the optimal team composition in different economic
environments (i.e., payoff distributions). A manager (or planner) chooses the team composition
3For evidence from psychology and neuroscience that supports this hypothesis, see the meta-analysis by
Elfenbein and Ambady (2002) and the survey of de Vignemont and Singer (2006), respectively. For experimental
evidence in economics, see Jackson and Xing (2014) and Le Coq et al. (2015).4For example, organizations routinely hire outside consultants to work with their employees to implement
novel practices, and include representatives from various groups when they set up transition management teams.
Other notable examples include the design firm IDEO; a key feature of their organization is that “they throw a
bunch of people with different backgrounds together in a room [..] Doctors, opera singers and anthropologists
for example, and get them to brainstorm” (CBS 60 Minutes, 2013).5We thus abstract away from incentive problems. This allows us to isolate the effect of identity and reasoning
on team performance.
4

before payoffs are realized. His goal is to maximize expected total payoffs. After payoffs are
realized, players observe the game and select an action using introspection. In coordination
games where no option is clearly superior, a player has an incentive to follow his impulse if he
expects other players to follow theirs. The more homogeneous a team, the more aligned the
impulses are, and the lower the risk of miscoordination. It follows that in stable environments,
where it is unlikely that new, Pareto improving, options will become available, it is optimal to
have homogeneous teams.
Now consider a more dynamic environment where superior alternatives are likely to arise.
Coordinating on a new option gives higher payoffs than following established routines. In such
environments, homogeneity has a downside: the ability to accurately predict others’ impulses
makes it difficult to break away from inefficient routines. If a player’s initial impulse is to
follow the inefficient practice, then it is likely that his opponent has a similar impulse. So, he
has a strong incentive to conform. By contrast, if a player cannot anticipate the reaction of
his opponent, then his choice tends to be guided by payoffs. Hence, if diverse teams manage
to coordinate, they are more likely to coordinate on the efficient option. It follows that in
dynamic environments, diversity is optimal.
This is true even if there are no direct effect of diversity on payoffs. So, in our model,
diversity is not valuable or detrimental in itself. Hence, the beneficial effects of diversity that
we identify are above and beyond any direct, exogenously given ones. Our results demon-
strate that diversity can improve performance in a much broader context than was previously
assumed: diverse teams may outperform homogeneous teams even in the absence of skill com-
plementarities across groups or differences in information.
The basic advantage of diversity that we capture in this model has been observed empiri-
cally. Homogeneous societies with a strong culture often find it more difficult to break out of
inefficient equilibria than more diverse, open-minded societies (Mokyr, 1990). Likewise, orga-
nizations that foster an open, adaptive atmosphere are less likely to become mired in ineffective
practices (Pfeffer and Sutton, 1999).
We next ask how the likelihood of efficient coordination depends on both economic con-
ditions (i.e., payoff distribution) and social factors, such as group identity (i.e., correlation of
impulses within a group), assuming that the manager chooses the team composition optimally.
Since the introspective equilibrium is (essentially) unique in our games, we can obtain unam-
biguous comparative statics. Once again, the results differ depending on economic conditions.
In stable environments, a stronger group identity is conducive to coordination. In dynamic en-
vironments, groups with a strong identity may be less likely to implement the efficient option.
This is true even if they face a lower risk of miscoordination overall. These results reveal an
interesting interplay between social and economic factors. These interactions would be missed
5
if identity and introspection are not taken into account.
The driving forces behind our analysis are intuitive, yet they are difficult to capture with
standard game-theoretic approaches. First, identity must be incorporated into the theory so
that it is possible to examine how behavior varies with cultural and economic factors.6 Perhaps
even more importantly, it is necessary to have a theory that allows for the possibility of misco-
ordination in some games and selects an equilibrium in others. When players try to coordinate
their actions, they encounter the problem of miscoordination as well as the problem of ensuring
coordination on the efficient action. The former is about playing a Nash equilibrium versus
not playing a Nash equilibrium. The latter is about selecting the “right” Nash equilibrium.
Existing theories mostly focus on one or the other. For example, level-k models can model
nonequilibrium behavior, while introducing payoff perturbations or modeling players’ learning
process can be used to select a unique Nash equilibrium. Existing approaches typically cannot
both.7 Building on findings from psychology, we can tackle both issues simultaneously. This
allows us to explain why players fail to coordinate on a Nash equilibrium in some settings,
while selecting a particular Nash equilibrium in others. This, in turn, provides clear, intuitive,
and unambiguous comparative statics and novel testable predictions.
The outline of this paper is as follows. We introduce the basic model in Section 2. Section
3 studies the optimal team composition in different economic environments. Section 4 provides
comparative statics. Section 5 discusses the related literature, and Section 6 concludes. Proofs
are in the appendix.
2. Model
2.1. Coordination and introspection
There are two groups, A and B, each consisting of a unit mass of players. Members of these
groups are called A-players and B-players, respectively. Group membership is observable.8
6Existing work on identity in economics incorporates identity into the payoffs (Akerlof and Kranton, 2000).
It does not seem straightforward to capture the idea that diversity can reduce the pressure to conform in such
models; see Section 5 for a discussion.7A notable exception is quantal response equilibrium, or QRE (McKelvey and Palfrey, 1995). QRE does
not deal with the issue of diversity and does not allow for correlated play.8This is appropriate for applications where groups differ in their demographic attributes, such as gender
or race, or where people can signal their identity using markers (e.g., distinctive clothing or tattoos). All our
results extend qualitatively to settings where group membership is imperfectly observable or even unobservable
(or, equivalently, where players cannot condition their behavior on the group of their opponent, perhaps for
legal reasons), as when groups are defined by socioeconomic or educational background, sexual orientation, or
religion.
6

Players are matched to play a coordination game G, with payoffs given by:
s1 s2
s1 v∗,v∗ z,y
s2 y,z v,v , v∗ ≥ v, v∗ > y, z < v.
(G)
This game has two strict Nash equilibria: one in which both players choose s1, and one in
which both players choose s2. Coordinating on the former is (Pareto) efficient (i.e., v∗ ≥ v > z,
v∗ > y). However, coordinating on action s1 may also be risky. It is thus not clear a priori
how to play this game. However, since the game is played in a certain context, the context
may give players some insight on how to play. The dual process account of Theory of Mind
in psychology suggests how players can use introspection to anticipate others’ actions in a
particular context. According to the dual process account, people have impulses, and through
introspection (i.e., by observing their own impulse) players can learn about the impulses of
others and thus form a conjecture about their behavior. This may lead them to consider a
different action than the one suggested by their impulse; realizing that their opponent may
likewise adjust their behavior, they may revise their initial conjecture (see Epley and Waytz,
2010, for a survey).9,10
A person’s instinctive reaction to a strategic situation is shaped by his background (Triandis
and Suh, 2002). People with a similar background have a shared history or have similar
experiences. They can thus be expected to have a similar instinctive reaction to a given
context. People of different backgrounds, on the other hand, do not share the same history
and may respond differently. Moreover, a shared history makes it easier to anticipate someone’s
instinctive response. Accordingly, players find it easier to predict the impulse of someone who
is similar to them.11
We formalize the dual process account of Theory of Mind as follows. Each player has an
initial impulse to take an action. A player’s impulse is payoff-irrelevant. It is influenced by
his background (i.e., group) in the following way. Nature draws a (payoff-irrelevant) state
9These ideas have a long history in philosophy. According to Locke (1690/1975) people have a faculty of
“Perception of the Operation of our own Mind” and Mill (1872/1974) writes that understanding others’ mental
states first requires understanding “my own case.” Russell (1948) observes that “[t]he behavior of other people
is in many ways analogous to our own, and we suppose that it must have analogous causes.”10Robalino and Robson (2015) interpret Theory of Mind as the ability to learn other players’ payoffs, and
shows that this confers an evolutionary benefit in volatile environments.11For experimental evidence from psychology and neuroscience that shows that it is easier to predict the
behavior or expectations of similar people, see Elfenbein and Ambady (2002) and de Vignemont and Singer
(2006), respectively. For experimental evidence in economics, see, e.g., Jackson and Xing (2014) and Le Coq
et al. (2015).
7

θC = 1, 2 for each group C = A,B. Each state θC = 1, 2 is equally likely ex ante for each
group C. The states are (positively) correlated across groups: conditional on the state θA
being m = 1, 2, we have θB = m with probability λ ∈ (12, 1), and likewise with the group
labels interchanged. If θA = 1 then the initial impulse of an A-player is to take action s1 with
probability q ∈ (12, 1), independently across players; likewise, if θA = 2, then an A-player has
an impulse to choose action s2 with probability q. Analogous statements hold for B-players. If
q is close to 1, then group membership strongly influences impulses; if q is close to 12, the effect
of group membership on impulses is weak. We define the strength of players’ group identity as
the probability Qin that two players from the same group receive the same impulse. Lemma
A.2 in the appendix shows that Qin lies strictly between 12
and 1, and is increasing in q. So,
impulses are correlated within a group; and if q is close to 1, then group identity strongly
guides impulses. The probability that players from different groups have the same impulse is
denoted by Qout. By Lemma A.2, Qout lies strictly between 12
and Qin. In words, impulses are
more strongly correlated within groups than across groups, reflecting the idea that players find
it easier to anticipate the impulses of members with a similar background.
Players are matched in pairs to play the game. A player’s first instinct is to follow his
impulse, without any strategic considerations. We refer to this initial stage as level 0. That
is, a level-0 strategy σ0j for player j maps his impulse into an action si = s1, s2. At higher
levels, players realize that if their opponent belongs to the same group, then they are likely
to have a similar impulse. So, through introspection (i.e., by observing their own impulses),
players obtain an informative signal about what their opponents will do. At level 1, a player
formulates a best response to the belief that his opponent will follow her impulse. This defines
a level-1 strategy σ1j for each player j that maps his impulse and the identity of the opponent
into an action. This introspective process continues to higher orders: at level k > 1, players
formulate a best response to their beliefs about their opponents’ action at level k − 1; this
defines a level-k strategy σkj for each player j. The levels do not represent actual behavior;
they are merely constructs in a player’s mind. We are interested in the limit of this process as
the level k goes to infinity. If such a limit strategy σj exists for each player j, then the profile
σ = (σj)j is an introspective equilibrium.
Proposition 2.1. [Existence and Uniqueness Introspective Equilibrium] Every coor-
dination game G has an introspective equilibrium σG = (σGj )j, and, it is essentially unique.12
The proof follows from Proposition A.3 in the appendix, which provides a complete char-
12That is, the introspective equilibrium is unique for almost every combination of parameters: the range of
parameters for which the introspective equilibrium is not unique has Lebesgue measure 0; see the discussion in
Appendix A.
8

acterization of the equilibrium for every combination of parameters.13 Every introspective
equilibrium is a correlated equilibrium, so that behavior in an introspective equilibrium is
consistent with common knowledge of rationality (Aumann, 1987). However, players need not
follow their impulse in an introspective equilibrium, unlike with action recommendations in
correlated equilibrium or sunspots. This proves to be important for the relative performance
of homogeneous and diverse teams as we discuss in Section 3. Another critical distinction
is that the introspective process selects an (essentially) unique prediction, while games often
have many correlated equilibria. This delivers a powerful tool. It allows us to characterize the
optimal team composition and obtain comparative statics regarding the likelihood of efficient
coordination as a function of social and economic factors; see Section 3 and 4, respectively.
2.2. Teams
Players interact in teams. A manager assigns players to one of two teams, labeled T1 and
T2. Each team consists of a unit mass of players. Teams can be more or less diverse. For
example, if all A-players are assigned to team T1 (say), and all B-players to team T2, teams
are completely homogeneous. If half of the players of each group are assigned to each of the
teams, teams are (maximally) diverse. Each player is matched to play the coordination game
with a member of the same team. That is, members of team T1 are matched with members of
T1, and members of T2 are matched with members of team T2. Matchings within a team are
uniform and independent across players.
A manager chooses the team assignments to maximize team performance. In the model,
team performance is measured by the total payoffs. Suppose player j is matched with some
player k and follows a strategy σj(ij, k) which maps his impulse ij = 1, 2 and the identity of
his opponent (viz., k) into an action s = s1, s2. If players j and k have impulses ij and ik,
respectively, the payoff of player j is
πj(σj(ij, k), σk(ik, j)),
where πj(s, s′) is the payoff in the coordination game for a player if he chooses action s and his
partner chooses action s′ (e.g., πj(σj(ij, k), σk(ik, j)) = v∗ if σj(ij, k) = σk(ik, j) = s1). Taking
the expectation over the distribution of impulses and the random matching (given the team
assignments α), and summing over all players gives the total payoff CG(σ;α), where G denotes
the game (i.e., payoff realizations).
At the time a manager assigns players to teams, he does not know the payoffs in the
game G. He chooses the team assignment α to maximize the total payoffs given the economic
13Kets and Sandroni (2015b) show a similar result in the context of two-player games where identity plays
no role.
9

environment, i.e., the distribution of the payoffs. We assume throughout that the payoff distri-
bution has a well defined joint density f(v∗, y, v, z). After payoffs are realized, players observe
the payoffs and play the coordination game, taking the team assignment as given, following
the introspective process described earlier. So, if players play according to the introspective
equilibrium σG, then the manager’s optimization problem is
maxα
E[CG(σG;α)], (2.1)
where the expectation is taken over the possible payoff realizations. By Proposition 2.1, the
manager’s maximization problem (2.1) is well defined.
Solving the maximization problem (2.1) is challenging because that there are many possi-
ble team assignments α. Fortunately, by Lemma 2.2 below, we can analyze the problem by
simply looking at the team composition, that is, the unevenness with which the two groups are
distributed across across teams. For a given team assignment α, define the team composition
d as:
d = 12·∣∣∣∣share of A-players assigned to T1
total measure of A-players− share of B-players assigned to T1
total measure of B-players
∣∣∣∣+12·∣∣∣∣share of A-players assigned to T2
total measure of A-players− share of B-players assigned to T2
total measure of B-players
∣∣∣∣ .The team composition d measures the share of players that need to be reassigned in order to
attain an even distribution of groups across teams (Duncan and Duncan, 1955). The team
composition d lies between 0 and 1. If d is close to 1, then teams are homogeneous; if d is close
to 0, then teams are (maximally) diverse. The next result shows that the total payoff depends
only on the team composition, not on the exact team assignment.
Lemma 2.2. Suppose team assignments α, α′ lead to the same team composition d. Then, the
expected total payoff in the introspective equilibrium is the same under both team assignments
(i.e., E[CG(σG;α)] = E[CG(σG;α′)], with σG the introspective equilibrium for the game G).
With some abuse of notation, we write E[CG(σG; d)] for E[CG(σG;α)] when the team as-
signment α gives rise to the team composition d. Lemma 2.2 implies that we can simplify the
manager’s optimization problem significantly: his optimization problem becomes
maxd∈[0,1]
E[CG(σG; d)]. (2.2)
The optimal team composition d∗ is the team composition that maximizes the total payoff
(i.e., d∗ solves (2.2)). If the optimal team composition d∗ is close to 0, then it is optimal to
have diverse teams; if the optimal team composition d∗ is close to 1, then it is optimal to
have homogeneous teams. In the next section, we consider the optimal team composition for
different economic environments.
10

3. Challenging conformity
We characterize how the benefits of diversity vary with the economic environment (i.e., the
payoff distribution). We consider two extreme cases that differ in the likelihood of a substantial
innovation. To fix ideas, consider the following game:
s1 s2
s1 v∗,v∗ 0,0
s2 0,0 1,1 , v∗ ≥ 1.
(G1)
If v∗ is equal to 1, then both actions are equally attractive in the sense that players receive
the same payoffs when they coordinate on either of the actions. If v∗ is greater than 1, then
action s1 is more attractive than action s2. In many applications of interest, the off-diagonal
payoffs may not be zero. In that case, the relative attractiveness is not measured by the ratio of
coordination payoffs in the two pure Nash equilibria (viz., v∗/v = v∗ in the present example),
but by the “risk-adjusted” ratio of payoffs, defined as
R :=v∗ − yv − z
.
Action s1 is relatively attractive if the payoff v∗ to coordinating on action s1 or the payoff z
to playing s1 when the other player chooses s2 is high relative to the payoff v to coordinating
on s2 or the payoff y to playing s2 when the other chooses s1, that is, when R is large (i.e.,
R � 1). Conversely, if R is close to 0, then action s2 is relatively attractive. If R = 1, then
both actions are equally attractive.
From the viewpoint of the manager, the game payoffs are uncertain, i.e., random variables.14
The economic environment is represented by the joint payoff density. To keep notation simple,
we take the payoffs to action s2 to be fixed, while the payoffs to action s1 may fluctuate, so
that we can write f(v∗, z) for the joint density of payoffs.15 We restrict attention to economic
environments where the higher-order moments of the payoffs are finite, that is,
E[|v∗|1+η],E[|z|2+2η],E[|v∗ · z|1+η] <∞ (3.1)
for some η > 0. This includes the case where payoffs are bounded and many other cases; see
Remark 2 in the appendix.
14With some abuse of notation, we use the same symbol (e.g., v∗) for both the random variable and its
realization in the main text.15Our results do not depend on this in any way.
11

3.1. Stable environments
We first consider economic environments that are stable in the sense that both actions
are likely to be equally attractive, that is, the payoffs of the game G are such that the risk-
adjusted payoff ratio R is likely to be close to 1. This models the following situation. Suppose
an innovation can make coordinating on action s1 superior to coordinating on s2. In a stable
environment environment, such innovations are unlikely to appear and if they do, any Pareto
improvement is likely to be small.
Formally, for δ < 1, two actions are δ-equally attractive if the payoffs are in the (1 − δ)-neighborhood UR=1
1−δ of the event that R = 1.16 The environment is δ-stable if the probability
that the two actions are δ-equally attractive is greater than δ. If δ is close to 1, then the two
actions are almost equally attractive (with high probability).
The next result shows that if the economic environment is stable, homogeneous teams are
optimal.
Theorem 3.1. [Homogeneous Teams Optimal in Stable Environments] In stable eco-
nomic environments, it is optimal to have homogeneous teams. For every ε > 0, there is δ < 1
such that if the economic environment is δ-stable, then the optimal team composition d∗ is
greater than 1− ε.
Intuitively, if both actions are equally attractive, total payoffs are maximized when the
potential for miscoordination is minimized. As members of the same group can more accurately
predict each others’ reactions than the responses of members of the other group, the risk of
miscoordinating is minimized when teams are homogeneous.
Theorem 3.1 is consistent with experimental evidence that shows that subjects are more
successful at coordinating when they interact with their own group (Weber and Camerer,
2003; Chen and Chen, 2011; Jackson and Xing, 2014). It is also consistent with empirical
evidence that demonstrates that conflict is minimized in homogeneous teams with congruent
expectations and values; see Jackson and Joshi (2011) for a survey. Reagans and Zuckerman
(2001), for example, find in their study of corporate R&D teams that diversity has a negative
impact on communication between team members. Indeed, homogeneous teams perform better
than diverse teams on simple tasks that require ample coordination (Bowers et al., 2000). By
contrast, diversity tends to be associated with more conflict and more coordination problems
(Pelled et al., 1999).
16So, the open neighborhood UR=11−δ of the event that R = 1 contains all points (v∗, z) such that the distance
between (v∗, z) and a point (v∗, z) for which R = (v∗− y)/(v− z) = 1 is less than 1− δ (in the usual Euclidean
topology on R2). Since the risk-adjusted payoff ratio R is continuous, the risk-adjusted payoff ratio is close to
1 on UR=11−δ .
12
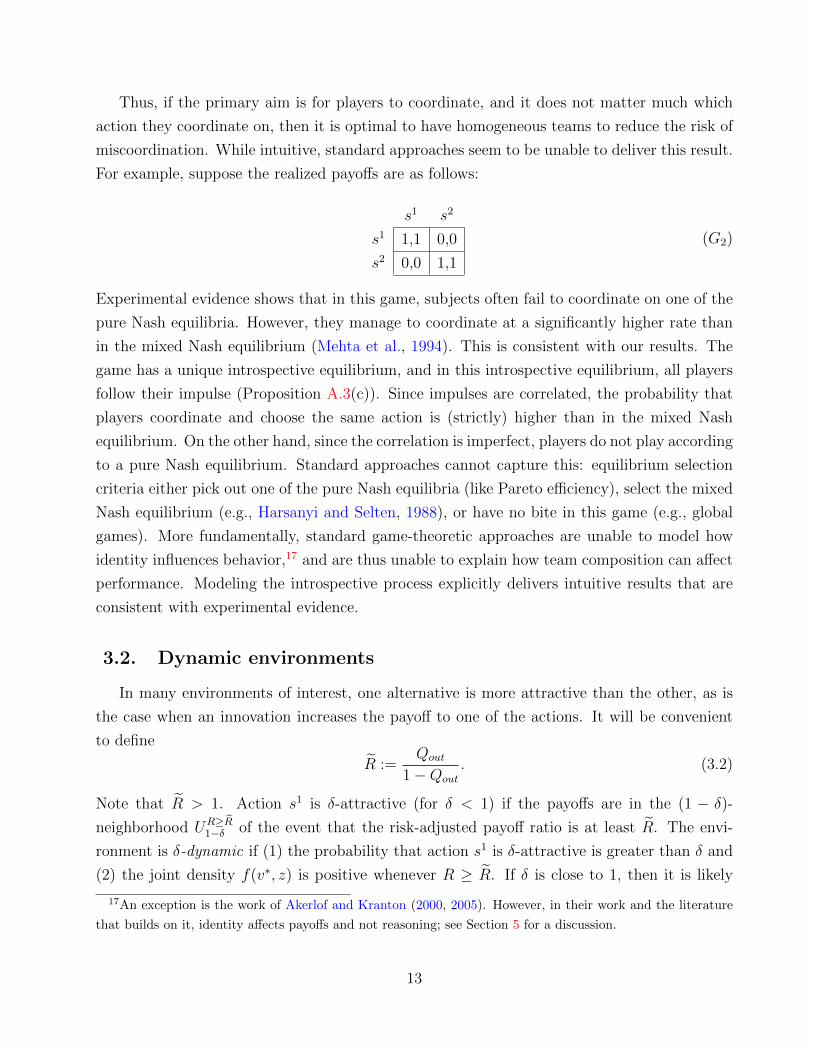
Thus, if the primary aim is for players to coordinate, and it does not matter much which
action they coordinate on, then it is optimal to have homogeneous teams to reduce the risk of
miscoordination. While intuitive, standard approaches seem to be unable to deliver this result.
For example, suppose the realized payoffs are as follows:
s1 s2
s1 1,1 0,0
s2 0,0 1,1
(G2)
Experimental evidence shows that in this game, subjects often fail to coordinate on one of the
pure Nash equilibria. However, they manage to coordinate at a significantly higher rate than
in the mixed Nash equilibrium (Mehta et al., 1994). This is consistent with our results. The
game has a unique introspective equilibrium, and in this introspective equilibrium, all players
follow their impulse (Proposition A.3(c)). Since impulses are correlated, the probability that
players coordinate and choose the same action is (strictly) higher than in the mixed Nash
equilibrium. On the other hand, since the correlation is imperfect, players do not play according
to a pure Nash equilibrium. Standard approaches cannot capture this: equilibrium selection
criteria either pick out one of the pure Nash equilibria (like Pareto efficiency), select the mixed
Nash equilibrium (e.g., Harsanyi and Selten, 1988), or have no bite in this game (e.g., global
games). More fundamentally, standard game-theoretic approaches are unable to model how
identity influences behavior,17 and are thus unable to explain how team composition can affect
performance. Modeling the introspective process explicitly delivers intuitive results that are
consistent with experimental evidence.
3.2. Dynamic environments
In many environments of interest, one alternative is more attractive than the other, as is
the case when an innovation increases the payoff to one of the actions. It will be convenient
to define
R :=Qout
1−Qout
. (3.2)
Note that R > 1. Action s1 is δ-attractive (for δ < 1) if the payoffs are in the (1 − δ)-
neighborhood UR≥R1−δ of the event that the risk-adjusted payoff ratio is at least R. The envi-
ronment is δ-dynamic if (1) the probability that action s1 is δ-attractive is greater than δ and
(2) the joint density f(v∗, z) is positive whenever R ≥ R. If δ is close to 1, then it is likely
17An exception is the work of Akerlof and Kranton (2000, 2005). However, in their work and the literature
that builds on it, identity affects payoffs and not reasoning; see Section 5 for a discussion.
13

that action s1 is more attractive than the alternative action, and the difference in payoffs can
be significant.
The next result shows that in dynamic environments, diversity is optimal.
Theorem 3.2. [Diversity Optimal in Dynamic Environments] In dynamic economic
environments, it is optimal to have diverse teams. For every ε > 0, there is δ < 1 such that if
the economic environment is δ-dynamic, then the optimal team composition d∗ is less than ε.
Theorem 3.2 is consistent with empirical evidence that shows a positive effect of diversity
on financial performance for organizations focused on innovation, but not for other types of
organizations (e.g., Richard et al., 2003; Dezso and Ross, 2012), and that organizations with
diverse management teams are better able to adapt to changing conditions (Wiersema and
Bantel, 1992).
The mechanism through which diversity can improve performance in dynamic environments
can be illustrated by means of a pure coordination game. Suppose the realized payoffs are as
follows:s1 s2
s1 4,4 0,0
s2 0,0 1,1
(G3)
Coordinating on action s1 is optimal in this case. Suppose groups have a strong identity
(i.e., Qin close to 1), and consider a player who is matched with a member of his own group.
Since group identity is strong, the player’s impulse is highly informative of the impulse of
his opponent. If the player has an impulse to play action s2, then, through introspection, he
realizes that his opponent is likely to have a similar impulse. At level 1, the expected payoff
of choosing action s2 is thus close to 1, while the expected payoff of action s1 is close to 0.
Accordingly, it is optimal for the player to follow his impulse at level 1. A simple inductive
argument shows that the same is true at higher levels. So, players who are matched with their
own group may coordinate on the Pareto-dominated Nash equilibrium (viz., (s2, s2)).18
Now suppose the player is matched with a member of the other group. Since impulses
are less strongly correlated across groups (i.e., Qout < Qin), it is difficult for the player to put
himself into his opponent’s shoes. In the extreme case where impulses are minimally correlated
across groups (i.e., Qout close to 12), a player’s impulse is almost completely uninformative of his
opponent’s impulse. Consequently, the player assigns about equal probability to his opponent
18Van Huyck et al. (1991) report experimental evidence that subjects may indeed coordinate on inefficient
alternatives even if the losses of miscoordination are the same across actions and if there is no historical
precedent. Outside the laboratory, where context and salience are likely to impact choices, we may even see
more coordination on inefficient actions.
14

playing each action at level 1. His expected payoff from playing action s2 is thus close to12·1+ 1
2·0 = 1
2at level 1, while the expected payoff of playing action s1 is close to 1
2·4+ 1
2·0 = 2,
almost independent of his own impulse. Accordingly, a player who is matched with a player
from the other group selects action s1 at level 1 in this case, even if he has an impulse to play
the other action. The same is true at higher levels. In effect, players’ inability to anticipate
the impulses of members of the other group reduces the pressure to conform.19 To maximize
team performance in this environment, the manager thus wants to maximize the fraction of
cross-group interactions. This intuition extends to cases where action s1 is potentially more
risky than the alternative.
Diversity can thus improve team performance even if groups do not have different informa-
tion and there are no skill complementarities across groups. It does so by reducing conformity
and inertia, allowing teams to coordinate on the Pareto-dominant equilibrium. There is ample
evidence that groups have a tendency to follow familiar routines even in situations where they
are no longer appropriate. While this reduces the risk of miscoordination, it may also limit
the group’s agility and its ability to adapt to changing circumstances (Gersick and Hackman,
1990). Strategic complementarities often lead to inertia. For example, in their study of young
high technology firms, Baron et al. (1996) show that management choices made at the time
a firm was founded strongly affects the time that new practices are adopted. Even if a new
alternative presents a clear Pareto improvement, it is not always adopted. Individuals may
choose an inefficient action because they believe that this is the norm for the group (Bicchieri
and Fukui, 1999). Pfeffer and Sutton (1999) present evidence that in many industries, orga-
nizations fail to adopt work practices that are commonly known to be superior. According
to Pfeffer and Sutton, what high-performance organizations excel in is implementation, not
so much in identifying complex technological solutions. So, inertia, conformity, and strategic
complementarities can greatly affect performance, consistent with our approach.
The mechanism through which diversity improves performance in dynamic environments
does not rely on the premise that members of diverse teams have complementary skills or
information that can be used to solve complex problems, as is the focus of much of the existing
literature on diversity (e.g., Hong and Page, 2001). Instead, diversity improves performance
because it increases strategic uncertainty. A lack of congruent expectations makes it harder to
anticipate the impulses of team members and so, discourages persistent practices. Eisenhardt
(1989) shows that considering different perspectives can allow groups to avoid an escalation
19This explains the form of the threshold R in (3.2): if the impulses of players from the other group are
easy to predict (i.e., Qout close to Qin), then the threshold is high (i.e., R� 1), and players face considerable
pressure to conform, even when interacting with the other group. When the impulses from the other group are
difficult to anticipate (i.e., Qout close to 12 ), then the pressure is mitigated, and R is close to 1.
15
of commitment to any one option, and to be more open to changing course if that leads to
better outcomes. A number of papers have established a link between the diversity of teams
and their willingness to consider alternative options and to deviate from established routines.
Simons et al. (1999) show that diverse management teams are less inclined to focus on a single
alternative and are more open to considering different courses of action. Phillips et al. (2006)
present experimental evidence that diversity in backgrounds can stimulate team members to
consider the issue from multiple perspectives, even if different groups have exactly the same
information. There is also ample anecdotal evidence. President Franklin D. Roosevelt, for
example, is known for assembling teams of clashing personalities, and for trying to avoid
working with agencies with homogeneous, entrenched cultures (Greenstein, 1988, p. 28–30).
The introspective process plays a critical role in deriving this result. While a player’s im-
pulse suggests a course of action, he need not follow his impulse in an introspective equilibrium
(unlike in a correlated equilibrium or with sunspots). Schelling (1960, pp. 112–113) recognized
that focal points can be inherently unstable, in which case they merely shape mutual expecta-
tions. The instability of focal points in diverse teams makes it possible for these teams to break
out of Pareto-dominated Nash equilibria. This is hard to capture using existing approaches.
For example, in global games, the risk dominant Nash equilibrium is always selected, indepen-
dent of other factors. So, the global games approach cannot account for how diversity affects
the ability of teams to adapt to changing circumstances.20
In effect, teams face two types of coordination problems. The first is basic: how to co-
ordinate in the first place (on either alternative). The second is no less important: how to
ensure that the team coordinates on the efficient Nash equilibrium? It is difficult to solve both
coordination problems simultaneously. If agents can accurately predict the impulses of others
(as in homogeneous teams), then they can successfully coordinate on one of the alternatives.
But, this comes at the risk of being stuck in the Pareto-dominated Nash equilibrium. On the
other hand, if there is a lack of congruent expectations (as in diverse teams), then teams can
break out of the Pareto-dominated Nash equilibrium and coordinate on the efficient outcome.
However, if none of the alternatives is especially attractive, incongruent expectations may lead
to miscoordination. This fundamental tradeoff is resolved differently in different economic
environment, leading the manager to opt for diverse teams in dynamic environments, and ho-
mogeneous teams in more stable ones. The next section studies the comparative statics of the
likelihood that the efficient Nash equilibrium is played when the team composition is chosen
optimally.
20Indeed, introspection does not always lead players to play the risk dominant Nash equilibrium. When
identity affects the likelihood that players coordinate on the efficient equilibrium, choosing the team composition
optimally becomes important.
16
4. Implementation rate
Having characterized the optimal team composition, we can study how behavior changes
when social and economic factors are varied. We focus on the likelihood that the efficient
alternative is implemented. We take an ex ante perspective: for a given economic environment
(i.e., distribution over payoffs), we ask how the probability that players implement the efficient
action in the introspective equilibrium varies when social and economic factors change.
For a given economic environment f(v∗, z), the implementation rate If (Qin) is the proba-
bility that a randomly chosen pair of players coordinates on the Pareto-dominant Nash equi-
librium (s1, s1) in the introspective equilibrium when the team composition is chosen optimally
for the given environment. That is, if we denote by ProbσG,d(s1, s1) the probability that two
randomly matched players both choose action s1 in the introspective equilibrium σG when the
team composition is d (given the realized payoffs), then the implementation rate is
If (Qin) := E[ProbσG,d∗(Qin)(s1, s1)],
where the expectation is taken over payoffs, as before. For simplicity, we focus in this section
on environments that satisfy somewhat stronger conditions than the environments in Section
3. The economic environment is strongly stable if it is δ-stable for some δ < 1 and the risk-
adjusted payoff ratioR lies between 1/R and R (with probability 1). The economic environment
is strongly dynamic if it is δ-dynamic for some δ < 1 and R is at least R (with probability 1).
The results extend qualitatively to more general environments.
We first consider how the implementation rate varies when the economic environment
changes. The first result shows that players are more likely to coordinate on the efficient out-
come when it becomes more attractive. Say that the economic environment f(v∗, z) strongly
dominates the economic environment f ′(v∗, z) if the distribution FR of the risk-adjusted payoff
ratio R induced by f(v∗, z) strictly first-order stochastically dominates the distribution F ′R of
R under f ′(v∗, z) (i.e., FR(r) < F ′R(r) for all r in the interior of the support of FR and F ′R).
Proposition 4.1. [Implementation Rate Increases with Payoffs] The implementation
rate increases when action s1 becomes more attractive. If the economic environments f and
f ′ are both strongly stable or both strongly dynamic and f(v∗, z) dominates f ′(v∗, z), then
If (Qin) ≥ If (Qin), with strict inequality when f(v∗, z) and f ′(v∗, z) are strongly dynamic.
Intuitively, when the efficient outcome (s1, s1) becomes more attractive, the payoff structure
of the game provides more guidance. In this case, the efficient outcome becomes a natural focal
point for coordination. This leads to more coordination on the efficient action. This is intuitive.
Suppose that players receive v∗ ≥ 1 and 1 if they coordinate on s1 and s2, respectively, and
17

0 otherwise, as in the game G1. Also suppose that action s2 is nevertheless salient in some
contexts, perhaps for historical reasons. So, players may have an impulse to choose action
s2, and think it is likely that members of their group may have a similar impulse. We would
expect more efficient coordination in an environment where v∗ either takes on the value 10 or
the value 1 (say, with equal probability) than in environments where v∗ can be 1.00001 or 1
(again, with equal probability).21 In other words, if payoff differences are limited, then social
factors have a more significant impact on choice than if payoff differences were larger. This
is consistent with empirical evidence. Van Huyck et al. (1991) show that subjects choose the
efficient option less often when other concerns (such as history or risk) become more important.
Standard game-theoretic approaches seem to be unable to deliver this result as they generally
do not trade off the saliency of an action and its payoffs.
We next turn to the effect of group identity. In stable environments, groups with a strong
identity are more successful at coordinating on the efficient outcome.
Proposition 4.2. [Implementation Rate Increases with Identity if Stable] In strongly
stable environments, the implementation rate increases when group identity is strengthened. If
the economic environment f(v∗, z) is strongly stable and Qin > Q′in, then If (Qin) > If (Q′in).
The intuition is straightforward: if a group has a stronger identity, players can accurately
predict the impulses of the members of their own group. This allows them to coordinate more
effectively, increasing the implementation rate.
However, the next result suggests that this intuition is incomplete: in dynamic environ-
ments, groups with a strong identity are less successful at coordinating on the efficient outcome.
Say that the environment is fully dynamic (for Qin) if it is strongly dynamic and the density
of the risk-adjusted payoff ratio R is weakly increasing in R for R ≤ Qin
1−Qin.
Proposition 4.3. [Implementation Rate Decreases with Identity if Dynamic] In fully
dynamic environments, the implementation rate decreases when group identity is strengthened.
If the economic environment f(v∗, z) is fully dynamic for Qin, then the implementation rate
strictly decreases in Qin.
So, strengthening group identity reduces the probability that the Pareto-dominant Nash
equilibrium is played when the environment is dynamic. This result may seem surprising at first
sight. As noted above, it is easier for group members to anticipate each others’ impulses when
the group’s identity is strong. However, there is also a counteracting effect. Because group
members can more accurately predict each others’ impulses when group identity is strong,
21The payoff distributions in this simple example do not have a well defined density, but the intuition extends
to settings where payoffs are continuously distributed.
18

they have a strong incentive to follow their impulse. Players thus feel a stronger pressure to
conform. In fully dynamic environments, the latter effect dominates the former: an increase
in the pressure to conform leads to a significant decrease in likelihood of coordinating on the
efficient outcome.
On the other hand, if group identity is weak, players are less conformist and more open to
selecting the efficient option. Proposition 4.3 may thus shed light on why more diverse and
open-minded societies are more likely to abandon outdated practices than homogeneous ones
with a strong culture (Mokyr, 1990). Likewise, organizations with an open culture are less
likely to stick with inefficient practices (Pfeffer and Sutton, 1999).
Our approach thus allows us to consider the interplay of social and economic factors, such
as group identity and the payoff distribution. The results shed light on why groups with a weak
identity may be more successful at implementing a course of action in some environments, but
not in others.22 Standard equilibrium analysis does not produce these results. In the standard
framework, equilibrium selection does not depend on social or cultural factors. These methods
are thus fundamentally unsuitable to investigate the effect of diversity on team performance.
Existing models of learning and evolution in games are also unable to capture the interplay
of social and economic factors highlighted here. Some models in the literature on learning
and evolution predict that a particular Nash equilibrium (such as the risk-dominant Nash
equilibrium) is selected in the limit (e.g., Kandori et al., 1993; Young, 1993). In other models,
play can converge to different Nash equilibria depending on the starting point of the dynamic
process; by introducing a probability distribution (usually uniform) over the possible starting
points, the probability that players choose a Nash equilibrium in the limit can be characterized.
In all these cases, predictions do not vary with social or cultural factors such as diversity and
group identity. A small literature has shown that when players interact in a network, the
structure of local interactions may determine whether the risk-dominant equilibrium spreads
to the entire population (e.g., Blume, 1995; Morris, 2000). Our random matching approach
allows us to derive clear and unambiguous comparative statics and reveal a rich interplay
between social and economic factors.23
More broadly, players face two types of problems when trying to coordinate their actions,
as noted earlier. First, at the most basic level, players simply need to avoid miscoordination.
Second, and no less important, they need to decide what to coordinate on. In particular, while
it is desirable to implement the efficient option, this may not be feasible when a group has
22We could also do comparative statics on more traditional measures, such as team payoffs. Similar results
obtain.23Also, note that the network structure in the existing literature plays a very different role than team
composition or group identity do in ours.
19

developed a certain routine. There is a fundamental tension between these two objectives. On
the one hand, players can avoid miscoordination when there are strong group norms. On the
other hand, while norms can reduce the risk of miscoordination, they may also make it difficult
for players to switch to superior alternatives when these become available. That is, reducing
the risk of miscoordination may come at the cost of increasing inertia and conformism. To
capture this fundamental tension, one needs a solution concept that leaves open the possibility
of miscoordination when no action is more attractive than the other, while it selects the Pareto-
dominant Nash equilibrium when it is significantly more attractive than the alternative. The
introspective equilibrium introduced here does exactly that: when the payoff structure gives
little guidance, players may fail to coordinate effectively; but if one option is clearly superior,
all players choose it.
5. Related literature
An emerging literature in economics studies the effect of identity and culture on economic
outcomes. In the seminal work of Akerlof and Kranton (2000) and much of the subsequent
literature, an agent’s identity enters his utility function; see, for instance, the work of Ak-
erlof and Kranton (2005) on the role of identity in organizations. By contrast, in our work,
a player’s identity affects his reasoning about others. Kets and Sandroni (2015a) use the ap-
proach developed here to show how identity shapes social interaction patterns.24 Bisin and
Verdier (2001), Kuran and Sandholm (2008), and Bisin et al. (2015) develop models of cultural
transmission of preferences and cultural integration. A number of authors have investigated
the effects of diversity on economic outcomes such as public good provision both theoretically
and empirically; see Alesina and La Ferrara (2005) for a survey.
The nature, design, and performance of organizations has been widely studied in economics;
see Gibbons and Roberts (2013) for a recent overview. Within this literature, our work is most
closely related to the papers that study the costs and benefits of diversity. Important contri-
butions to this literature include Lazear (1999a,b), Hong and Page (2001), Page (2007), Prat
(2002), and Van den Steen (2010). Hong and Page (2001), Page (2007), Prat (2002), and Van
den Steen (2010) focus on the problem of identifying the optimal solution in complex environ-
ments, but do not consider the question of how the optimal outcome can be implemented, as
we do. These works thus abstract away from the strategic dimension and thus cannot explain
24So, the present approach can be used to explain homophily. See Baccara and Yariv (2013) and P¦ski and
Szentes (2013) for alternative approaches. Calvo-Armengol et al. (2009), Currarini et al. (2009), Galeotti and
Mattozzi (2011), Bramoulle et al. (2012), Golub and Jackson (2012), and Patacchini and Zenou (2012), among
others, study the economic implications.
20

why organizations may fail to adopt work practices that are commonly known to be superior,
as is the case in many industries (Pfeffer and Sutton, 1999). Lazear (1999b) shows that diverse
teams may outperform homogeneous teams if different groups have complementary skills. We
show that diversity can have economic benefits even if this conditions is not met, by reducing
conformity, thus uncovering a novel source of benefits of diversity in organizations.
The literature has also considered the effect of corporate culture on organizational perfor-
mance; see Kreps (1990) and Cremer (1993) for seminal contributions, and see Hermalin (2013)
for a survey. Rather than focusing on corporate culture, we consider the effect of cultural dif-
ferences between the different groups that make up an organization. Kreps (1990) noted that
cultural rules can act as focal principles in organizations and reduce coordination problems.
We provide a formal mechanism through which identity and culture can aid in equilibrium
selection, and use this to derive comparative statics.
Benabou (2013) provides an economic analysis of groupthink, which may lead to unwar-
ranted optimism about a new course of action. By contrast, we are interested in conformity to
outdated practices and organizational inertia. Bernheim (1994) presents a model of conformity
which is fundamentally different from ours.
Focal points have been studied formally in a number of papers (e.g., Crawford and Haller,
1990; Sugden, 1995; Bacharach and Stahl, 2000; Janssen, 2001). This literature focuses on how
players describe their options and under what conditions an alternative can become salient.
The process we consider bears some resemblance with level-k and cognitive hierarchy models
which successfully predict behavior in a wide range of games (Crawford et al., 2013). In these
models, players formulate a best response to the conjecture that other players are of lower level,
and level-0 players are nonstrategic. A key difference is that we are interested in equilibrium
behavior, while the level-k literature focuses on non-equilibrium outcomes. In addition, the
level-k literature does not consider payoff-irrelevant signals such as impulses, which are critical
in our setting.25
Our model is also very different from global games (Carlsson and van Damme, 1993). There
is no payoff uncertainty in our model, and, most importantly, the economic implications differ
significantly. While a global-games approach always selects the risk-dominant equilibrium,
this need not be the case in our setting even if there is a unique strict risk-dominant solution
25The introspective process also bears some resemblance to the tracing procedure (Harsanyi and Selten,
1988). This procedure involves an axiomatic determination of players’ common priors and the construction of
fictitious games. The fictitious games are used to select a Nash equilibrium of the original game. Our approach
is inspired by evidence from psychology, both in its definition of the reasoning process and the initial beliefs,
does not require the construction of auxiliary games, and gives different predictions. For example, the tracing
procedure selects the risk-dominant equilibrium in coordination games, but this need not be the case for our
process.
21

that is also payoff dominant.26 This allows us to provide a novel rationale for diversity in
organizations, and to provide novel comparative statics.
Equilibrium selection has also been studied in the literature on learning and evolution.
Most of the models in this literature either select a particular Nash equilibrium (such as the
risk-dominant one) or predict a distribution over Nash equilibria that is independent of social
and cultural factors such as group identity and diversity (Mailath, 1998). These models thus
cannot account for systematic differences in behavior across groups that differ in terms of
their social and cultural characteristics. When players interact only with their neighbors in
a network, the evolution of play may depend on the network structure (e.g., Blume, 1995;
Morris, 2000). Given the discrete nature of networks, it has proven difficult to characterize
the interaction structures that maximize total payoffs or to provide unambiguous comparative
statics. Our approach, which combines random matching with a model of how players’ identity
affects their strategic behavior, is both tractable and offers intuitive and testable predictions.
The methodological contribution of this paper is that it can account both for the failure
to play according to a Nash equilibrium (like level-k models) in certain settings as well as
players’ ability to select a unique Nash equilibrium (like global games or learning models) in
others. Whether players may fail to coordinate or select a unique Nash equilibrium depends
in a natural way on economic incentives. The theory can do so without departing from the
assumption that players are perfectly rational: in all cases, behavior can be described by
a correlated equilibrium. However, while a game can have many correlated equilibria, the
theory selects an (essentially) unique equilibrium, allowing us to characterize the optimal team
composition in different environments and to provide clear and intuitive comparative statics.
6. Conclusions
This paper shows that there is a clear and compelling economic rationale for diversity
even in the absence of skill complementarities or differences in information: diversity chal-
lenges conformity and stimulates the adoption of efficient practices. However, the very clash
of perspectives that can make diverse teams successful may also enhance conflict and miscoor-
dination. So, when the primary goal is to align behavior, diversity can be harmful. Consistent
with empirical evidence, diversity improves performance in innovation-based industries, but
not in others (Jackson and Joshi, 2011).
At the heart of our contribution is our model of introspection. Building on findings from
26Grout et al. (2014) study the relative performance of homogeneous and diverse teams in a beauty contest
game. The setting they consider is fundamentally different from ours. In particular, there is no Pareto superior
option in their setting. The results are also different.
22

psychology, we develop an explicit, and fully rational, model of introspection and reasoning
that delivers a formal account of the effects of identity and diversity on economic outcomes.
The model yields non-Nash equilibrium outcomes in some games and Nash-equilibrium selec-
tion in other games, while returning a unique prediction in each of our games. The model
provides intuitive comparative statics, and reveals a rich interplay between cultural and eco-
nomic factors. The comparative statics are consistent with empirical evidence, but are difficult
to produce using standard approaches.
While we focused on teams and organizations, our model can be used more broadly to
study which societies are more likely to thrive and innovate (Mokyr, 1990), to design diversity
policies (Kets and Sandroni, 2015a), and to identify optimal organizational cultures (Hermalin,
2013). Exploring the economic implications of culture and identity promises to be an exciting
research agenda.
23

Appendix A Preliminary results
A.1 Team composition
Fix a team T . The majority group of team T is the group (say, A) such that at least half
the players in the team belong to that group. We refer to the other group (e.g., B) as the
minority group. If A is the majority group in team T1, then B is the majority group in T2 and
vice versa.
We can characterize the team composition in terms of the share of the team members that
belongs to the majority group.
Lemma A.1. Let p1, p2 ≥ 12
be the share of the majority group in teams T1 and T2, respectively.
Then, p1 = p2 =: p, and the team composition is d = 2p− 1.
Proof. By symmetry, if a share p1 ≥ 12
of the members of team T1 belong to group A (say),
then the share of A-players in team T2 is 1− p1. It follows that the share of B-players in team
T2 is p2 = 1− (1− p1). In other words, if the majority in one team makes up a share p of the
team, then the majority in the other team also makes up a share p of the team. We can thus
write the team composition d as
12· |p1 − (1− p1)|+ 1
2· |(1− p2)− p2| = 2p− 1,
where the last line uses that p2 = p1 =: p. �
A.2 Impulses
It will be helpful to characterize the probability that two players have the same impulse.
Recall that, conditional on θA = 1, an A-player has an impulse to play action s1 with probability
q ∈ (12, 1). Likewise, conditional on θA = 2, an A-player has an impulse to play action s2
with probability q. Analogous statements apply to B-players. Conditional on θA = m, we
have θB = m with probability λ ∈ (12, 1), where 1, 2. The following result characterizes the
probability that two players have the same impulse.
Lemma A.2. Let q ∈ (12, 1) be the probability that a player of group A has the impulse to
choose s1 conditional on θA = 1, and analogously for group B. Then:
(a) the probability that two distinct A-players have the same impulse is Qin := q2 +(1−q)2 ∈(12, 1);
24

(b) the probability that two distinct A-players have the impulse to play s1 is equal to 12Qin;
(c) the conditional probability that an A-player j has the impulse to play action s1 given that
another A-player j′ has the impulse to play action s1 is equal to Qin;
(d) the probability that an A-player and a B-player have the same impulse is Qout := λ ·Qin+
(1− λ) · (1−Qin) ∈ (12, Qin);
(e) the probability that an A-player and a B-player have the impulse to play s1 is equal to12Qout;
(f) the conditional probability that an A-player j has the impulse to play action s1 given that
a B-player j′ has the impulse to play s1 is equal to Qout;
Proof. We denote the probability measure over impulses and θA, θB by P. For example, the
probability that θA = 1 is P(θA = 1), and the conditional probability that an A-player jA has
an impulse to play action s2 conditional on θA = 1 is P(jA = 2 | θA = 1). Also, the probability
that two A-players jA and j′A have an impulse to play action s1 and s2, respectively, is denoted
P(jA = 1, j′A = 2), the probability that jA has an impulse to play s1 given that j′A has an
impulse to play s2 is P(jA = 1 | j′A = 2), and the probability that an A-player jA and a
B-player jB have an impulse to play s1 is P(jA = 1, jB = 1).
(a) Consider two A-players jA and j′A, jA 6= j′A. The probability that jA and j′A have the same
impulse is
P(jA = 1, j′A = 1) + P(jA = 2, j′A = 2).
By symmetry, P(jA = 1, j′A = 1) = P(jA = 2, j′A = 2), so it suffices to compute P(jA = 1, j′A =
1). We have
P(jA = 1, j′A = 1) = P(jA = 1, j′A = 1 | θA = 1) · P(θA = 1) +
P(jA = 1, j′A = 1 | θA = 2) · P(θA = 2)
= P(jA = 1 | θA = 1) · P(j′A = 1 | θA = 1) · P(θA = 1) +
P(jA = 1 | θA = 2) · P(j′A = 1 | θA = 2) · P(θA = 2)
= 12· q2 + 1
2· (1− q)2, (A.1)
where the second line uses that impulses of A-players are conditionally independent given θA,
and the last line follows by definition. The probability that two distinct A-players have the
same impulse is thus
2 ·(12· q2 + 1
2· (1− q)2
)=: Qin.
25

(b) By (A.1), the probability that two distinct A-players have an impulse to play action s1 is12· q2 + 1
2· (1− q)2 = 1
2·Qin.
(c) The conditional probability that an A-player jA has the impulse to play action s1 given
that another A-player j′A has the impulse to play action s1 is
P(jA = 1 | j′A = 1) =P(jA = 1, j′A = 1)
P(j′A = 1)
=12· q2 + 1
2· (1− q)212
= Qin
where we have used (A.1) again, and where we have used that the ex ante probability that a
player j has an impulse to play action s1 is 12.
(d) Consider an A-player jA and a B-player jB. The probability that jA and jB have the same
impulse is
P(jA = 1, jB = 1) + P(jA = 2, jB = 2).
As before, P(jA = 1, jB = 1) = P(jA = 2, jB = 2), by symmetry. It thus suffices to compute
P(jA = 1, jB = 1). We have
P(jA = 1, jB = 1) = P(jA = 1, jB = 1 | θA = 1, θB = 1) · P(θA = 1, θB = 1) +
P(jA = 1, jB = 1 | θA = 2, θB = 1) · P(θA = 2, θB = 1) +
P(jA = 1, jB = 1 | θA = 1, θB = 2) · P(θA = 1, θB = 2) +
P(jA = 1, jB = 1 | θA = 2, θB = 2) · P(θA = 2, θB = 2)
= 12· [λq2 + 2(1− λ) · q · (1− q) + λ · (1− q)2]
= 12· [λQin + (1− λ) · (1−Qin)]. (A.2)
The probability that an A-player and a B-player have the same impulse is thus
2 · P(jA = 1, jB = 1) = λQin + (1− λ) · (1−Qin) =: Qout.
In the limit where λ approaches 12
(i.e., θA and θB are uncorrelated), we have Qout = 12
(i.e.,
no correlation in impulses across groups). In the limit where λ approaches 1 (θA and θB are
perfectly correlated), we have Qout = Qin (i.e., correlation in impulses across groups equals the
correlation in impulses within groups).
(e) This result is immediate from (A.2).
26

(f) The conditional probability that an A-player jA has the impulse to play action s1 given
that a B-player jB has the impulse to play s1 is
P(jA = 1 | jB = 1) =P(jA = 1, jB = 1)
jB = 1= Qout.
�
A.3 Characterization introspective equilibrium
We characterize the introspective equilibria for symmetric (2 × 2) coordination games.
Recall that payoffs are given by:
s1 s2
s1 v∗,v∗ z,y
s2 y,z v,v
(A.3)
By assumption, v∗ ≥ v, v∗ > y, and z < v. So, the game has two strict Nash equilibria, viz.,
(s1, s1) and (s2, s2), and the first is (weakly) payoff dominant. The ratio
R :=v∗ − yv − z
is the ratio of risk-adjusted payoffs in the coordination game. The pure Nash equilibrium of
the coordination game in which both players choose action s1 is risk dominant in the sense of
Harsanyi and Selten (1988) if R ≥ 1, and the pure Nash equilibrium in which both players
choose s2 is risk dominant if R ≤ 1. By Lemma A.1, the team composition can be written as
d = 2p − 1, where p ≥ 12
is the fraction of players in each team that belongs to the majority
group, and 1− p is the fraction of players that belongs to the minority group (see Lemma A.1
for definitions).
The following result provides a complete characterization of introspective equilibria in sym-
metric (2 × 2) coordination games. Equilibrium behavior depends on the realization of the
payoff parameters; there are different regions, separated by the following thresholds:
Uin(Qin) =Qin
1−Qin
;
Uout(Qin) =Qout
1−Qout
;
Lout(Qin) =1−Qout
Qout
;
Lin(Qin) =1−Qin
Qin
.
27

Since Qin > Qout >12, we have Uin(Qin) > Uout(Qin) > 1 > Lout(Qin) > Lin(Qin).
Proposition A.3. [Introspective Equilibrium Symmetric Coordination Games] Con-
sider a symmetric coordination game and let R = v∗−yv−z be the risk-adjusted payoff ratio. Then:
(a) If
R > Uin(Qin),
then there is a unique introspective equilibrium. In this unique introspective equilibrium,
all players choose action s1, regardless of their impulse or whom they are matched with;
(b) If
R ∈(Uout(Qin), Uin(Qin)
),
then there is a unique introspective equilibrium. In this unique introspective equilibrium,
players follow their impulse when they are matched with a member of their own group, and
choose s1 (regardless of their impulse) otherwise when they are matched with a member
of the other group;
(c) If
R ∈(Lout(Qin), Uout(Qin)
),
then there is a unique introspective equilibrium. In this unique introspective equilibrium,
all players follow their impulse, regardless of whom they are matched with.
(d) If
R ∈(Lin(Qin), Lout(Qin)),
then there is a unique introspective equilibrium. In this unique introspective equilibrium,
players follow their impulse when they are matched with a member of their own group, and
choose s2 (regardless of their impulse) otherwise when they are matched with a member
of the other group;
(e) If
R < Lin(Qin)
then there is a unique introspective equilibrium. In this unique introspective equilibrium,
all players choose action s2, regardless of their impulse or whom they are matched with.
(f) If R is equal to Uin(Qin), Uout(Qin), Lout(Qin), or Lin(Qin), then at least some players are
indifferent between playing a fixed action and following their impulses in some of their
matches.
28

Proof. By assumption, all players follow their impulse at level 0. For level k > 0, suppose
that all players follow their impulse at any level ` < k. Since group membership is observable,
players can condition their action on which group their opponent belongs to. We thus consider
two cases: the case where players are matched with members of their own group, and the case
where players are matched with members of the other group.
Case 1: Within-group matchings. Consider an A-player who is matched with another
A-player. If this player has an impulse to play action s2, then ignoring his impulse and choosing
s1 at level k is the unique best response if and only if
v∗ · (1−Qin) + z ·Qin > v ·Qin + y · (1−Qin)
or, equivalently, if and only if
R >Qin
1−Qin
=: Uin(Qin),
where we have used Lemma A.2 for the conditional probability that players from the same
group have an impulse to play action s given that player j has an impulse to play action s′.
Conversely, if R < Uin(Qin), the unique best response for an A-player at level k is to follow
his impulse when he is matched with a player from his own group. When R = Uin(Qin), the
player is indifferent between following his impulse and choosing action s1. Next suppose that
the player (who is matched with a player from his own group) has an impulse to play action
s1. Ignoring his impulse and choosing action s2 is the unique best response at level k if and
only if
v · (1−Qin) + y ·Qin > v∗ ·Qin + z · (1−Qin),
or, equivalently, if and only if
R <1−Qin
Qin
:= Lin(Qin).
Conversely, if R > Lin(Qin), the unique best response for the player (who is matched with
his own group and has an impulse to choose s1) at level k is to follow his impulse and choose
action s1. The same statements, of course, apply to B-players.
Case 2: Across-group matchings. Consider an A-player who is matched with a B-player
and who has an impulse to play action s2. In this case, ignoring the impulse and playing action
s1 is the unique best response at level k if and only if
v∗ · (1−Qout) + z ·Qout > v ·Qout + y · (1−Qout)
29
or, equivalently, if and only if
R >Qout
1−Qout
=: Uout(Qin),
where we have used Lemma A.2 for the conditional probability that players from different
groups have an impulse to play action s given that player j has an impulse to play action s′.
Conversely, if R < Uout(Qin), then it is a unique best response at level k for the player (who
is matched with a player from the other group and has an impulse to play s2) to follow his
impulse. If R = Uout(Qin), then the player is indifferent between following his impulse and
playing action s1 (i.e., ignoring his impulse). Next suppose the player has an impulse to play
action s1. Ignoring his impulse and choosing action s2 is the unique best response if and only
if
R <1−Qout
Qout
:= Lout(Qin).
Conversely, if R > Lout(Qin), then the unique best response at level k is to follow his impulse
in this case. When R = Lout(Qin), the player is indifferent between following his impulse and
ignoring it. Analogous statements apply to B-players who are matched with a member of
group A.
The above characterizes the best responses at level k. Next consider level k+ 1, taking the
best responses at level k as given. It is straightforward to check that the best responses at
level k are also best responses at level k + 1. To see this, first suppose that R > Uin(Qin). In
this case, all players choose s1 at level k, regardless of their impulse or whom they are matched
with. Clearly, the unique best response at level k + 1 is to choose s1, independent of one’s
impulse, group, or group of the opponent. Next suppose R ∈ (Uout(Qin), Uin(Qin)). At level
k, players ignore their impulse and play action s1 when they are matched with a player of the
other group, and follow their impulse when they are matched with the own group. At level
k + 1, it is thus the unique best response for a player who is matched with a player of the
other group to ignore his impulse and choose action s1. Also, for a player who is matched
with the own group, following his impulse is the unique best response at level k + 1 (given
that following one’s impulse is the unique best response at level k against the conjecture that
players of the own group follow their impulse). If R ∈ (Lout(Qin), Uout(Qin)), all players follow
their impulse at level k, and this is the unique best response to the belief that all players
follow their impulse; so, following one’s impulse is the unique best response in this case. If
R ∈ (Lin(Qin), Lout(Qin)), it is the unique best response for players at level k to choose s2
when matched with a player of the other group and to follow their impulse otherwise; by a
similar argument as above, this is the unique best response at level k + 1 also. Finally, if
R < Lin(Qin), then all players choose s2 at level k; clearly, the unique best response at level
30
k + 1 is to choose action s2. One can repeat this argument to show that the best responses at
level k are also best responses for any level ` ≥ k. So, if R is not equal to one of the thresholds
(i.e., R 6= Lin(Qin), Lout(Qin), Uout(Qin), Uin(Qin)), we have a unique introspective equilibrium.
If R falls on one of the thresholds (i.e., R = Lin(Qin), Lout(Qin), Uout(Qin), Uin(Qin)), there
are multiple introspective equilibria where players that are indifferent between following their
impulse and playing a fixed action mix between their actions. �
A few aspects are worth noting.
First, while players sometimes coordinate on the risk dominant Nash equilibrium, it is
not always played. For example, if R ≥ 1, (s1, s1) is a risk dominant Nash equilibrium, but
players only coordinate on s1 (with probability 1) if R > Uin(Qin) > 1. By contrast, if R ∈[1, Uout(Qin)), players follow their impulse in all their matches and may potentially coordinate
on action s2 or miscoordinate. In the intermediate range (i.e., R ∈ (Uout(Qin), Uin(Qin))),
players choose s1 (regardless of their impulse) when they are matched with the other group,
but follow their impulse otherwise.
Second, players may ignore their impulse in the introspective equilibrium. In this case,
players do not follow the “action recommendation” from the impulse, unlike in correlated
equilibrium.
Third, the introspective process ends after a few rounds in this class of games. So, even
if players are bounded in their reasoning about others, they will play according to the intro-
spective equilibrium. In other games, players adjust their action at each level; see Kets and
Sandroni (2015a) and Kets and Sandroni (2015b) for examples.
Fourth, the result is robust to relaxing the assumption that group membership is per-
fectly observable: it largely goes through if players can observe their opponent’s group only
imperfectly. Even if players cannot observe their opponent’s group at all, the introspective
equilibrium is very similar. It is again (essentially) unique; if R is sufficiently high (low), all
players choose s1 (respectively, s2); and for intermediate values of R, some players follow their
impulse, while others choose a fixed action (s1 or s2 depending on whether R is high or low).
Finally, the introspective equilibrium is essentially unique: it is unique for almost all values
of the parameters, that is, the parameters for which the introspective equilibrium is unique has
measure 1 under the Lebesgue measure or, in fact, under any payoff distribution that admits
a density (i.e., is absolutely continuous with respect to Lebesgue measure). It will be useful to
adopt a tie-breaking rule to handle the case where players are indifferent, as discussed in the
next remark.
Remark 1. For the remainder of the paper, we will assume that if players are indifferent
between following their impulse and choosing a fixed action s (regardless of their impulse)
31

when matched with members of a certain group, they will follow their impulse. The choice of
tie-breaking rule does not affect our results in any way. This is because the values of the payoff
parameters for which (some subset of) players are indifferent has measure 0 in the economic
environments that we consider. So, the manager would choose the same team composition
regardless of the tie-breaking rule that is used.
Fixing a tie-breaking rule allows us to simplify notation: we can fix a particular introspective
equilibrium for values of the parameters where players are indifferent, instead of working with
equivalence classes of introspective equilibria (which differ only on a set of parameters of
measure zero). Henceforth, when we calculate expected payoff (for given majority share p and
group identity Qin), we will do so assuming that players play according to the introspective
equilibrium characterized in Proposition A.3 whenever no player is indifferent, and follow the
above tie-breaking rule otherwise; we will denote this introspective equilibrium by σG. /
A.4 Equilibrium payoffs
We characterize the total payoff in the (essentially) unique introspective equilibrium. Fix
the majority share p and the strength Qin of players’ group identity (where the majority share
p is defined in Lemma A.1). By Proposition A.3 (and using the tie-breaking rule discussed in
Remark 1), we have the following:
1. If R > Uin(Qin), then in the introspective equilibrium, all players choose action s1,
regardless of their impulse;
2. If Uout < R ≤ Uin(Qin), then in the introspective equilibrium, players choose action s1,
regardless of their impulse, when matched with a player of the other group and follow
their impulse otherwise;
3. If Lout(Qin) ≤ R ≤ Uout(Qin), then in the introspective equilibrium, all players follow
their impulse;
4. If Lin(Qin) ≤ R < Lout(Qin), then in the introspective equilibrium, players choose action
s2, regardless of their impulse, when matched with a player of the other group and follow
their impulse otherwise;
5. For any R < Lin(Qin), then in the introspective equilibrium, all players choose action s2,
regardless of their impulse.
We calculate the team payoff in the introspective equilibrium for each of these regions. As
before, let p ≥ 12
be the share of the majority group in the team. The game G can be
summarized by the payoff parameters v∗ and z, so we will write G = (v∗, z) here.
32

It will be useful to calculate the team payoff in the introspective equilibrium (i.e., the sum
of payoffs accruing to members of a given team), as opposed to the total payoff (i.e., the sum of
payoffs accruing to all players). By symmetry, the total payoff in the introspective equilibrium
is simply twice the payoff of an individual team (in equilibrium).
We need to consider different ranges of parameters. First, suppose that the payoff parame-
ters G = (v∗, z) and group identity Qin are such that R > Uin(p,Qin). In that case, all players
choose s1 regardless of their impulse. Then, a team’s payoff in the introspective equilibrium
σG is
γ1(p,Qin, v∗, z) := v∗.
Next, suppose that Uout(p,Qin) < R ≤ Uin(p,Qin) when the game is G = (v∗, z). Then, in
the introspective equilibrium σG, players choose action s1, regardless of their impulse, when
matched with a player of the other group and follow their impulse otherwise. So, a team’s
payoff in the introspective equilibrium σG is
γ2(p,Qin, v∗, z) := p ·
[p ·(12· (v∗ + v) ·Qin + 1
2· (y + z) · (1−Qin)
)+ (1− p) · v∗
]+
(1− p) ·[(1− p) ·
(12· (v∗ + v) ·Qin + 1
2· (y + z) · (1−Qin)
)+ p · v∗
],
where we have used Lemma A.2 for the probability that two distinct players have an impulse
to a given action. Again, the team payoff is the sum of the payoffs accruing to the two
groups. When players interact with members of their own group, their expected payoff is12· (v∗ + v) ·Qin + 1
2· (y+ z) · (1−Qin); if they interact with members of the other group, it is
v∗.
Suppose Lmin(p,Qin) ≤ R ≤ Uout(p,Qin) when the game is G = (v∗, z), so that all play-
ers follow their signal in the introspective equilibrium. The team payoff in the introspective
equilibrium σG is then
γ3(p,Qin, v∗, z) := 1
2·[(p2 + (1− p)2
)·Qin + 2p · (1− p) ·Qout
]· (v∗ + v)+
12·[(p2 + (1− p)2
)· (1−Qin) + 2p · (1− p) · (1−Qout)
]· (y + z),
where we have again used Lemma A.2.
If Lmaj(p,Qin) ≤ R < Lmin(p,Qin) when the game is G = (v∗, z), then in the introspective
equilibrium σG, players choose action s2 when matched with the other group, and follow their
impulse otherwise. The team payoff in this introspective equilibrium is
γ4(p,Qin, v∗, z) := p ·
[p ·(12· (v∗ + v) ·Qin + 1
2· (y + z) · (1−Qin)
)+ (1− p) · v
]+
(1− p) ·[(1− p) ·
(12· (v∗ + v) ·Qin + 1
2· (y + z) · (1−Qin)
)+ p · v
]33

Finally, suppose that R < Lmaj(p,Qin) when the game is G = (v∗, z). In that case, all
players choose action s2, and the team payoff in the introspective equilibrium σG is
γ5(p,Qin, v∗, z) := v.
The team payoff is thus given by
C(p,Qin, v∗, z) :=
γ1(p,Qin, v∗, z) if R > Uin(Qin);
γ2(p,Qin, v∗, z) if Uout(Qin) < R ≤ Uin(Qin);
γ3(p,Qin, v∗, z) if Lout(Qin) ≤ R ≤ Uout(Qin);
γ4(p,Qin, v∗, z) if Lin(Qin) ≤ R < Lout(Qin);
γ5(p,Qin, v∗, z) if R < Lin(Qin).
As there are two teams, the total payoff in the introspective equilibrium is CG(σG; d) =
2C(p,Qin, v∗, z) when the game is G = (v∗, z), where we recall that the team composition
d is equal to 2p− 1 when the share of the majority is p ≥ 12
(Lemma A.1). While the functions
γ1, γ2, γ3, γ4, and γ5 are all continuous in the payoff parameters v∗, z, the share p of the
majority, and group identity Qin, the function C(p,Qin, v∗, z) is generally discontinuous at the
thresholds R = Uin(p,Qin), Uout(p,Qin), Lmin(p,Qin), Lmaj(p,Qin).
Appendix B Proofs
B.1 Proof of Lemma 2.2
Fix a game G. By Proposition A.3 in Appendix A, for generic values of the parameters,
there is a unique introspective equilibrium σG = (σGj )j. In this introspective equilibrium, the
strategy σGj of a player depends only on his own group and the group of the player he is matched
with. That is, if players j and k belong to the same group C and are matched with players j′
and k′, respectively, who both belong to group C ′, then σGj = σGk .27 So, for each pair of groups
C,C ′ = A,B and a given team T = T1, T2, there is a strategy σGC,C′,T that maps impulses into
actions such that for each C-player j in team T with impulse ij that is matched with a C ′-player
c′, we have σGj (ij, c′) = σGC,C′,T (ij). Since the payoff distribution has a well-defined density, the
values of the payoff parameters for which the introspective equilibrium is not unique have zero
probability for a given Qin. So, the expected total payoff in the introspective equilibrium does
27Of course, depending on the realization of their impulses, players j and k may end up taking different
actions even if they belong to the same group and are both matched to the same group (and neither is
indifferent between his actions): if player j’s impulse ij is different from player k’s impulse ik, then we could
have σGj (ij , k) = s and σGk (ik, j) = s′ for s, s′ = s1, s2 and s 6= s.
34

not depend on the individual identity of players (i.e., who is matched with whom), only on the
shares of players of each group assigned to different teams, that is, on the team composition
(Lemma A.1). �.
B.2 Proof of Theorem 3.1
We use the results and notation from Appendix A. It will be convenient to work with
random variables rather than with densities. For the proofs, we make the distinction between
a random variable and its realization: we write v∗ for the random variable that gives the
coordination payoff for s1, and v∗ for its realization. Likewise, we write z for the random
variable that gives the payoff to a player who chooses s1 when his opponent chooses s2, and
z for its realization. So, (v∗, z) is a random vector (taking values in R2), and f(v∗, z) is its
joint density. The joint density f(v∗, z) corresponds to a distribution function F (v∗, z) (i.e.,
F (v∗, z) is the probability that v∗ is at most v∗ and z is at most z). We also define the random
variable R by
R :=v∗ − yv − z
.
The collection of δ-stable environments thus corresponds to a set of random variables. For
δ < 1, let ΠS,δ be the set of random vectors (v∗, z) (taking values in R2) that satisfy the
moment conditions (3.1) as well as the following conditions:
Sδ-I the probability that v∗ and z are in UR=11−δ is greater than δ;
Sδ-II the payoffs have a well-defined joint density;
Sδ-III the event that v∗ ≥ v, v∗ > y, and v > z has probability 1.
With some abuse of terminology we will refer to the elements of ΠS,δ as δ-stable economic
environments.
Let ΠR=1 be the set of random vectors (taking values in R2) that (1) are such that R = 1
with probability 1; and that (2) satisfy the moment condition (3.1) and condition Sδ-III.
Note that the elements of ΠR=1 do not represent an economic environment, since they do not
have a well-defined density (the event that R = 1 is an event that has Lebesgue measure
zero). However, it will be a useful benchmark. In this benchmark case, it is optimal to have
maximally homogeneous teams.
Lemma B.1. Fix Qin. For any random vector in ΠR=1, the unique optimal team composition
is d∗ = 1.
35

Proof. Fix Qin and (v∗, z) ∈ ΠR=1. Since R = 1 with probability 1, the expected team payoff
is E[C(p,Qin,v∗, z)] = E[γ3(p,Qin,v
∗, z)]. By (3.1), we can “pass to the limit,” that is, we
havedE[γ3(p,Qin,v
∗, z)]
dp= E
[dγ3(p,Qin,v∗, z)
dp
].
Sincedγ3(p,Qin, v
∗, z)
dp= (2p− 1) · (Qin −Qout) · (v∗ + v − y − z),
we have dγ3(p,Qin,v∗,z)
dp≥ 0 for any realization (v∗, z) of (v∗, z), with strict inequality if p > 1
2
(given that p ≥ 12
and given Sδ-III). Hence, the expected team payoff is maximized at p∗ = 1.
By Lemma A.1, the unique optimal team composition in this environment is d∗ = 2p∗−1 = 1. �
If the environment is δ-stable, then it is close to the case where R = 1 (with probability 1).
The next step is to show that the expected team payoff is continuous. Define Π to be the set
of random variables that take values in R2 and that satisfy conditions (3.1), Sδ-II and Sδ-III,
and let ΠS := Π ∪ ΠR=1. Clearly, ΠS,δ ⊂ ΠS for every δ < 1.
The law µ(v∗,z) of a random vector (v∗, z) is the distribution of (v∗, z): for every measurable
subset A of R2, µ(v∗,z)(A) is the probability that (v∗, z) ∈ A. We identify the collection ΠS
with the subset ∆S of the set of Borel probability measures on R2 such that µ ∈ ∆S if
and only if µ is the law of some (v∗, z) ∈ ΠS; we can likewise define the set ∆R=1 as the
set of laws of random vectors in ΠR=1. We endow ∆S with the relative topology (with the
set of Borel probability measures endowed with its usual weak convergence topology). A
sequence {(v∗n, zn)}n of random vectors in ΠS converges to a random vector (v∗, z) if the laws
of {(v∗n, zn)}n converge to the law of (v∗, z) in the weak topology.
Define the function gS : [12, 1] × (1
2, 1) × ΠS → R by gS(p,Qin,v
∗, z) := E[C(p,Qin,v∗, z)].
This function is continuous:
Lemma B.2. For every Qin, the function gS(·, Qin, ·, ·) is jointly continuous in its arguments.
Proof. Fix (v∗, z) ∈ ΠS. Since v∗ and z are random variables, the team payoff C(p,Qin,v∗, z)
is also a random variable (for any p and Qin). Denote by M the collection of random variables
C(p,Qin,v∗, z) for which (v∗, z) ∈ ΠS. Then, since the elements of ΠS satisfy the moment
conditions (3.1), the set M is uniformly integrable (Billingsley, 1968).
Consider a sequence {(pn,v∗n, zn)}n=1,2,..., where for every n, pn ∈ [12, 1] and (v∗, z) ∈ ΠS.
Suppose the sequence {(pn,v∗n, zn)}n=1,2,... converges to (p,v∗, z) for p ∈ [12, 1] and (v∗, z) ∈ ΠS.
We claim that the sequence {C(pn,v∗n, zn)}n=1,2,... of random variables converges weakly to the
random variable C(p,Qin,v∗, z). The first step is to show the set of discontinuities of the
measurable function C(·, ·,v∗, z) has measure 0 under the distribution whenever (v∗, z) ∈ ΠS.
36

To see this, suppose that (v∗, z) ∈ Π ⊂ ΠS. Then, the distribution of (v∗, z) has a well-
defined density (condition Sδ-II) and thus assigns zero probability to the event that R =
Uin(Qin), Uout(Qin), Lout(Qin), Lin(Qin), which are the potential points of discontinuity of C(Appendix A.4). Alternatively, if (v∗, z) ∈ ΠR=1 ⊂ ΠS, then the function C is equal to the
function γ3 with probability 1. The result then follows because γ3 does not have any disconti-
nuities. So, the set of discontinuities of C(·, ·,v∗, z) has zero measure. We can then apply the
mapping theorem (Billingsley, 1968, Thm. 5.1) to show that the sequence {C(pn,v∗n, zn)}n=1,2,...
of random variables converges weakly to the random variable C(p,Qin,v∗, z). By uniform inte-
grability, it follows that E[C(pn, Qin,v∗n, zn)] converges to E[C(p,Qin,v
∗, z)] (Billingsley, 1968,
Thm 5.4). That is, gS(pn, Qin,v∗n, zn)→ gS(p,Qin,v
∗, z). �
Since the team payoff C is neither continuous in its arguments nor bounded, some work is
required that the expected team payoff is continuous. The argument in the proof of Lemma
B.2 has two main steps. First, the assumption that the payoff parameters have a continuous
distribution (condition Sδ-II) implies that the set of discontinuities of C has measure 0, and
this ensures that the measurable function C converges weakly when its arguments converge
in the appropriate sense. Second, the moment restrictions (3.1) ensure that the expectation
of C converges when the measurable function C converges. So, even if the function C is not
continuous or bounded, its expectation is continuous and finite.28
We can now apply standard tools to show that when we are close to the benchmark case
where R = 1 with probability 1, then the optimal team composition will be close to homoge-
neous. Define the “value function” vSQin: ∆S → R for Qin by
vSQin(µ(v∗,z)) := max
p∈[ 12,1]
gS(p, Qin,v∗, z).
Define the associated correspondence of maximizers by
P ∗Qin(µ(v∗,z)) := {p ∈ [1
2, 1] : gS(p,Qin,v
∗, z) = vSQin(µ(v∗,z))}.
That is, vSQin(p, µ(v∗,z)) is the expected team payoff when the majority share p is chosen to
maximize the team payoff for given Qin and (v∗, z), and the set P ∗Qin(µ(v∗,z)) (possibly empty)
contains the majority shares at which this maximum is attained. For example, for (v∗, z) ∈ΠR=1, we have P ∗Qin
(µ(v∗,z)) = {1} by Lemma B.1.
By the Berge maximum theorem (e.g., Aliprantis and Border, 2006, Thm. 17.31), the value
function vSQinis continuous, and the correspondence P ∗Qin
has nonempty compact values and is
28It is clear from the proof of Lemma B.2 that we could alternatively have shown that the function
gS(p,Qin,v∗, z) is jointly continuous in p, v∗, z, and Qin; the present result, however, is what we need
for our proofs.
37

upper hemicontinuous . Fix ε > 0. Since the correspondence P ∗Qin(·) is upper hemicontinuous
and nonempty, the set
V Sε,Qin
:= {µ ∈ ∆S : P ∗Qin(µ) ⊂ (1− ε
2, 1]}
is open in ∆S and nonempty; in fact, it contains the closed set ∆R=1. For δ < 1, define
W S1−δ := {µ ∈ ∆S : µ(UR=1
1−δ ) > δ},
where we recall that UR=11−δ is the (open) neighborhood of the event that R = 1. Clearly, the
sets W S1−δ shrink with δ, that is, if δ < δ′ < 1, then W S
1−δ′ ( W S1−δ. Also, W S
1−δ is open in ∆S
(Billingsley, 1968) and contains the closed set ∆R=1. Moreover, ∆S,δ ⊂ W S1−δ for any δ < 1.
So, by choosing δ sufficiently close to 1, we have
∆S,δ ⊂ W S1−δ ⊂ V S
ε,Qin.
That is, for any ε > 0, if the environment is δ-stable for δ sufficiently close to 1 (for a
given ε), then for any p∗Qin(µ(v∗,z)) ∈ P ∗Qin
(µ(v∗,z)), we have p∗Qin(µ(v∗,z)) > 1 − ε/2, and thus
d∗(Qin) > 1 − ε (Lemma A.1). In words, if the manager assigns high probability to the
alternatives being roughly equally attractive, then it is optimal to have almost homogeneous
teams. �
B.3 Proof of Theorem 3.2
We follow a similar approach as in the proof of Theorem 3.1: we characterize the optimal
team composition for a benchmark case, and show that the optimal team composition is close
to the optimal team composition for the benchmark case whenever the environment is close to
the benchmark case.
As in the proof of Theorem 3.1, it will be convenient to work with and their laws rather
than with densities. We use the notation introduced there.
So, as before, the collection of δ-dynamic environments corresponds to a set of random
variables. For δ < 1, let ΠD,δ be the set of random vectors (v∗, z) (taking values in R2) that
satisfy the moment conditions (3.1) as well as the following conditions:
Dδ-I the probability that v∗ and z are in UR≥R1−δ is greater than δ;
Dδ-II the payoffs have a well-defined joint density f(v∗, z);
Dδ-III f(v∗, z) > 0 for every v∗, z such that R > R;
Dδ-IV the event that v∗ ≥ v, v∗ > y, and v > z has probability 1.
38

We note that R = Uout(Qin) in the notation of Appendix A, and we will henceforth use this
notation in the proof.
Consider the set ΠD of random vectors (on R2) such that R ≥ Uout(Qin) with probability
1 and that satisfy conditions Dδ-II–Dδ-IV as well as condition (3.1). Clearly, ΠD ⊂ ΠD,δ for
every δ < 1. In this benchmark case, it is optimal to have maximally diverse teams.
Lemma B.3. Fix Qin. For any (v∗, z) ∈ ΠD, the unique optimal team composition is d∗ = 0.
Proof. Fix Qin and (v∗, z) ∈ ΠD. The expected team payoff when the majority share is p is
E[C(p,Qin,v∗, z)] = E[IR∈(Uout(Qin),Uin(Qin)] · γ2(p,Qin,v
∗, z)]+
E[IR>Uin(Qin) · γ1(p,Qin,v∗, z)],
where IE is the indicator function for the event E, and where we have used the notation in
Appendix A.4.29 By (3.1), we can bring the derivative inside the expectation operator when
calculating the derivative, as before. Using that the thresholds (viz., Uout(Qin) and Uin(Qin))
and the function γ1(p,Qin,v∗, z) do not depend on p, we thus have
dE[C(p,Qin,v∗, z)]
dp= E
[IR∈(Uout(Qin),Uin(Qin)] ·
γ2(p,Qin,v∗, z)
dp
].
If the function γ2(·, Qin, v∗, z) has a unique maximum p∗ = p∗(Qin) that is independent of
the realizations v∗ and z of v∗ and z, respectively, such that v∗ ≥ v, v∗ > y, and v > z
(consistent with condition Dδ-IV), then this is the unique maximum for the expected team
payoff E[C(·, Qin,v∗, z)] (for a given Qin). (Note that condition Dδ-III rules out that the
manager is indifferent among team compositions.)
So, it remains to show that the function γ2(·, Qin, v∗, z) is maximized when p = 1
2assuming
that the payoff realizations v∗ and z satisfy v∗ ≥ v, v∗ > y, and v > z. For any (v∗, z) ∈ R2,
dγ2(p,Qin, v∗, z)
dp= (4p− 2) · [1
2· (v∗ + v) ·Qin + 1
2· (y + z) · (1−Qin)− v∗].
It thus suffices to show that
v∗ > 12· (v∗ + v) ·Qin + 1
2· (y + z) · (1−Qin).
We can rewrite this inequality as
12· (1−Qin) · (v∗ + v − y − z) + 1
2· (v∗ − v) > 0.
29Note that the event that R = Uout(Qin) has zero probability (by condition Dδ-II), so that E[IR=Uout(Qin) ·γ3(p,Qin,v
∗, z)] = 0. We can thus omit this term.
39

This inequality is satisfied if v∗ ≥ v, v∗ > y, and v > z (given that Qin < 1). So, under
conditions Dδ-III and Dδ-IV, the expectation of γ2 is maximized uniquely (for given Qin) at
p∗(Qin) = 12. By Lemma A.1, the unique optimal team composition in this environment is
d∗(Qin) = 2p∗(Qin)− 1 = 0 for any group identity Qin. �
We can now apply a continuity argument, as in the proof of Theorem 3.2. As in the proof
of Theorem 3.2, let Π be the set of laws of random variables on R2 that satisfy conditions (3.1),
Dδ-II, and Dδ-IV.30 As before, we can identify Π with the set ∆ of laws of random vectors in Π,
and we can endow it with the relative topology induced by the weak topology. Clearly, ΠD,δ ⊂ Π
for every δ, so that ΠD is also a subset of Π. Define the function gD : [12, 1]× (1
2, 1)× Π→ R
by gD(p,Qin,v∗, z) := E[C(p,Qin,v
∗, z)]. The following is a direct corollary of Lemma B.2.
Corollary B.4. For every Qin, the function gD(·, Qin, ·, ·) is jointly continuous in its argu-
ments.
We can again apply the Berge maximum theorem to show that when we are close to
the benchmark case, then the optimal team composition is almost maximally diverse. For
Qin ∈ (12, 1), define the value function vDQin
: ∆→ R by
vDQin(µ(v∗,z)) := max
p∈[ 12,1]
gD(p, Qin,v∗, z).
Also, define the correspondence of maximizers by
P ∗Qin(µ(v∗,z)) := {p ∈ [1
2, 1] : gD(p,Qin,v
∗, z) = vDQin(µ(v∗,z))}.
As before, vDQin(µ(v∗,z)) is the expected team payoff when the majority share p is chosen so as
to maximize the team payoff (for given Qin and v∗, z), and this maximum is attained at the
majority shares that belong to the set P ∗Qin(µ(v∗,z)).
Again, it follows from the Berge maximum theorem (e.g., Aliprantis and Border, 2006,
Thm. 17.31) that the value function vDQinis continuous. Moreover, the correspondence P ∗Qin
has
nonempty compact values and is upper hemicontinuous. Let ε > 0. Since the correspondence
P ∗Qin(·) is upper hemicontinuous and nonempty, the set
V Dε,Qin
:= {µ ∈ Π : P ∗Qin(µ) ⊂ [1
2, 12
+ 12ε)}
is open in Π and nonempty. Clearly, it contains the closed set ΠD. For δ < 1, define
WD1−δ := {µ ∈ Π : µ(UR≥R
1−δ ) > δ},30It is immediate that the set Π as defined here is identical to the set Π in the proof of Theorem 3.1. Likewise
for the set ∆.
40

where we recall that UR≥R1−δ is the (open) neighborhood of the event that R ≥ R = Uout(Qin).
As before, W S1−δ decreases in δ and is open in ∆ (Billingsley, 1968). It also contains the closed
set ∆D. In addition, ∆D,δ ⊂ WD1−δ for every δ. So, if δ is sufficiently close to 1,
∆D,δ ⊂ WD1−δ ⊂ V D
ε,Qin.
In words: if the environment is δ-dynamic for δ sufficiently close to 1 (for a fixed ε > 0), then
the majority share that maximizes the expected team payoff is less than 12
+ 12ε. By Lemma
A.1, we thus have d∗(Qin) < ε. So, if it is likely that action s1 is substantially more attractive
than the alternative, then it is optimal to have diverse teams. �
Remark 2. Some comments on the role of the moment conditions (3.1) are in order. The
conditions are used in two ways. First, it ensures that we can “pass to the limit” when
taking derivatives. Second, it ensures that the optimal team composition is continuous in an
appropriate sense in the proofs of Theorems 3.1 and 3.2. While condition 3.1 is much weaker
than assuming that payoffs are bounded, it is stronger than what is needed; the condition
could be relaxed at the expense of complicating notation and proofs. Finally, the condition
on the moment of z in (3.1) is stronger than the other conditions (viz., we require E[|z|2+2η]
to be finite for some η > 0, while we only require E[|v∗|1+η] to be finite). This is because the
relevant equations include higher powers of z than of v∗. /
B.4 Proof of Proposition 4.1
As in the proofs of Theorem 3.1 and 3.2, we distinguish between a random variable x and
its realization x. Denote the distribution of the risk-adjusted payoff under f(v∗, z) and f ′(v∗, z)
by FR(r) and F ′R(r), respectively. So, FR(r) is the probability of the event that R = v∗−yv−z ≤ r
when the economic environment is f(v∗, z); F ′R(r) is defined analogously.
The probability that the Pareto-dominant Nash equilibrium (s1, s1) is played can easily be
derived from the characterization of the team payoffs in Appendix A. Fix the majority share p
and group identity Qin. Then, when the risk-adjusted payoff ratio is equal to R, the probability
that the payoff dominant Nash equilibrium (s1, s1) is played is given by
ν(R; p,Qin) :=
ν1(p,Qin) if R > Uin(Qin);
ν2(p,Qin) if Uout(Qin) < R ≤ Uin(Qin);
ν3(p,Qin) if Lout(Qin) ≤ R ≤ Uout(Qin);
ν4(p,Qin) if Lin(Qin) ≤ R < Lout(Qin);
ν5(p,Qin) if R < Lin(Qin);
41

where
ν1(p,Qin) :=1
ν2(p,Qin) :=(p2 + (1− p)2
)· 12Qin + 2p · (1− p)
ν3(p,Qin) :=(p2 + (1− p)2
)· 12Qin + 2p · (1− p) · 1
2Qout
ν4(p,Qin) :=(p2 + (1− p)2
)· 12·Qin
ν5(p,Qin) :=0.
It is easy to check that for every p < 1 and Qin,
ν1(p,Qin) > ν2(p,Qin) > ν3(p,Qin) > ν4(p,Qin) > ν5(p,Qin),
so that for every p and Qin, the function ν(R; p,Qin) is increasing in R.
Fix Qin and a random vector (v∗, z) with joint density f(v∗, z) (which represents the eco-
nomic environment, as before) and associated distribution FR(r) over the risk-adjusted payoff
ratio. If there is a unique majority share p∗(v∗,z)(Qin) that maximizes the expected team payoff
in the introspective equilibrium, then the implementation rate is given by
If (Qin) := E[ν(R; p∗(v∗,z)(Qin), Qin)]
= FR(Lin(Qin)) · ν5(p∗(v∗,z)(Qin), Qin) +
(FR(Lout(Qin))− FR(Lin(Qin))) · ν4(p∗(v∗,z)(Qin), Qin) +
(FR(Uout(Qin))− FR(Lout(Qin))) · ν3(p∗(v∗,z)(Qin), Qin) +
(FR(Uin(Qin))− FR(Uout(Qin))) · ν2(p∗(v∗,z)(Qin), Qin) +
(1− FR(Uin(Qin))) · ν1(p∗(v∗,z)(Qin), Qin).
We consider strongly stable and strongly dynamic economic environments in turn.
Fully stable environments A minor modification of the proof of Lemma B.1 shows that it
is optimal to have maximally homogeneous teams when the environment f is strongly stable:
p∗(v∗,z)(Qin) = 1. Moreover, when the environment is strongly stable, it assigns probability 1
to the event that R ∈ [Lout(Qin), Uout(Qin)] = [1/R, R]. So, the implementation rate can be
written as
If (Qin) = ν3(1, Qin).
This is true for any strongly stable environment f(v∗, z). So, If (Qin) = If ′(Qin) for any
strongly stable environments f(v∗, z), f ′(v∗, z).
42
Fully dynamic environments When the environment f(v∗, z) is strongly dynamic, Lemma
B.3 shows that the unique optimal team composition is p∗(v∗,z)(Qin) = 12. Moreover, when the
environment is strongly stable, we have that R ≥ Uout(Qin) = R with probability 1. We can
thus simplify the expression for the implementation rate to
If (Qin) = FR(Uin(Qin)) · ν2(12 , Qin) + (1− FR(Uin(Qin))) · ν1(12 , Qin)
As f dominates f ′, we have FR(r) < F ′R(r) for all r ∈ (R,∞). In particular,
FR(Uin(Qin)) < F ′R(Uin(Qin)),
and the result follows. �
B.5 Proof of Proposition 4.2
As before, we distinguish between a random variable x and its realization x. As noted in
the proof of Proposition 4.1, it is optimal to have homogeneous teams when the environment
f(v∗, z) is strongly stable, that is, p∗(v∗,z)(Qin) = 1. Moreover, as in the proof of Proposition
4.1, the implementation rate is simply
If (Qin) = ν3(1, Qin) = 12Qin.
This function is clearly strictly increasing in the strength Qin of players’ identity. �
This result extends to more general environments. We can use a similar continuity argument
as in the proof of Theorem 3.1 and then apply the implicit function theorem to account for
the fact that the optimal team composition may change when group identity changes.
B.6 Proof of Proposition 4.3
Fix Qin. As before, if there is a unique majority share p∗(v∗,z)(Qin) that maximizes the ex-
pected team payoff in the introspective equilibrium (given the economic environment f(v∗, z)),
then the implementation rate is given by
If (Qin) = FR(Uin(Qin)) · ν2(p∗(v∗,z)(Qin), Qin) + (1− FR(Uin(Qin))) · ν1(p∗(v∗,z)(Qin), Qin),
where FR(r) is the distribution of the risk-adjusted payoff ratio induced by f(v∗, z) Differenti-
ating this expression with respect to Qin gives:
dIf (Qin)
dQin
= FR(Uin(Qin)) ·dν2(p
∗(v∗,z)(Qin), Qin)
dQin
−
− fR(Uin(Qin)) · dUin(Qin)
dQin
· (ν1(p∗(v∗,z)(Qin), Qin)− ν2(p∗(v∗,z)(Qin), Qin)), (B.1)
43

where fR is the density of R induced by FR. The first term in (B.1) is the increase in the
implementation rate due to the enhanced coordination when players follow their impulses in at
least some of their matches (i.e., when R ∈ (Uout(Qin), Uin(Qin)]). We encountered a similar
effect in stable environments; cf. the proof of Proposition 4.2. The second term is the decrease
in the implementation rate due to the stronger pressure to conform: when Qin increases, there
is a smaller range of R for which all players choose action s1 (i.e., Uin(Qin) increases). For a
given economic environment, the derivative of ν2 at the optimal team composition p∗ is given
by
dν2dQin
=∂ν2∂Qin
+∂ν2∂p∗· dp
∗
dQin
= 12·((p∗)2 + (1− p∗)2
)+ p∗ · (1− p∗) · (λ− (1− λ)) +
(2p∗ − 1) · (Qin −Qout) ·dp∗
dQin
where we have used the expression for Qout in Lemma A.2. The existence of dp∗
dQinfollows from
the implicit function theorem by standard arguments. We also have
dUin(Qin)
dQin
=1
(1−Qin)2> 0;
ν1(12, Qin)− ν2(12 , Qin) =1
2· (1− 1
2Qin) > 0.
Finally, by Lemma B.3, it is optimal to have maximally diverse teams when the environment
(v∗, z) is fully dynamic, that is, p∗(v∗,z)(Qin) = 12. This gives
dν2(p∗(v∗,z)(Qin), Qin)
dQin
= 2λ.
Using these results, we see that the implementation rate strictly decreases in Qin if and
only if
fR(Uin(Qin)) · 2−Qin
(1−Qin)2> 2λFR(Uin(Qin)).
Using that in fully dynamic environments, the density fR is weakly increasing in R for R ≤Uin(Qin), we have
FR(Uin(Qin)) =
∫ Uin(Qin)
Uout(Qin)
fR(r)dr ≤ fR(Uin(Qin)) · (Uin(Qin)− Uout(Qin)).
So, the implementation rate strictly decreases with group identity whenever
fR(Uin(Qin)) · 2−Qin
(1−Qin)2> 2λfR(Uin(Qin)) ·
( Qin
1−Qin
− Qout
1−Qout
).
44

Given that fR(Uin(Qin)) > 0 by definition (see (2) in the definition of δ-dynamic environ-
ments),this inequality holds if and only if
2−Qin
(1−Qin)2> 2λ
( Qin
1−Qin
− Qout
1−Qout
).
Applying Lemma A.2 and rewriting gives that this holds if and only if
(2−Qin) · (1− λQin − (1− λ) ·Qin) > 2λ(1− λ) · (2Qin − 1) · (1−Qin).
It can be checked that this inequality holds for any Qin ∈ (12, 1) and λ ∈ (1
2, 1). �
As is the case for Proposition 4.2, this result extends to more general environments. As in
the proof of Theorem 3.2, we can use a continuity argument to show that similar results hold
for environments that are almost strongly dynamic.
References
Akerlof, G. A. and R. E. Kranton (2000). Economics and identity. Quarterly Journal of
Economics 115, 715–753.
Akerlof, G. A. and R. E. Kranton (2005). Identity and the economics of organizations. Journal
of Economic Perspectives 19, 9–32.
Alesina, A., J. Harnoss, and H. Rapoport (2013). Birthplace diversity and economic prosperity.
Working Paper 18699, NBER.
Alesina, A. and E. La Ferrara (2005). Ethnic diversity and economic performance. Journal of
Economic Literature 43, 762–800.
Aliprantis, C. and K. Border (2006). Infinite Dimensional Analysis: A Hitchhiker’s Guide (3rd
ed.). Springer.
Aumann, R. J. (1987). Correlated equilibria as an expression of Bayesian rationality. Econo-
metrica 55, 1–18.
Baccara, M. and L. Yariv (2013). Homophily in peer groups. American Economic Journal:
Microeconomics 5, 69–96.
Bacharach, M. and D. O. Stahl (2000). Variable-frame level-n theory. Games and Economic
Behavior 32, 220–246.
45

Baron, J. N., M. D. Burton, and M. T. Hannan (1996). The road taken: Origins and evolution
of employment systems in emerging companies. Industrial and Corporate Change 5, 239–275.
Benabou, R. (2013). Groupthink: Collective delusions in organizations and markets. Review
of Economic Studies 80, 429–462.
Bernheim, B. D. (1994). A theory of conformity. Journal of Political Economy 102, 841–877.
Bicchieri, C. and Y. Fukui (1999). The great illusion: Ignorance, informational cascades, and
the persistence of unpopular norms. Business Ethics Quarterly 9, 127–155.
Billingsley, P. (1968). Convergence of Probability Measures (1st ed.). Wiley.
Bisin, A., E. Patacchini, T. Verdier, and Y. Zenou (2015). Bend it like Beckham: Ethnic
identity and integration. Working paper.
Bisin, A. and T. Verdier (2001). The economics of cultural transmission and the dynamics of
preferences. Journal of Economic Theory 97, 298–319.
Blume, L. E. (1995). The statistical mechanics of best-response strategy revision. Games and
Economic Behavior 11, 111–145.
Bowers, C. A., J. A. Pharmer, and E. Salas (2000). When member homogeneity is needed in
work teams: A meta-analysis. Small Group Research 31, 305–327.
Bramoulle, Y., S. Currarini, M. O. Jackson, P. Pin, and B. W. Rogers (2012). Homophily and
long-run integration in social networks. Journal of Economic Theory 147, 1754–1786.
Calvo-Armengol, A., E. Patacchini, and Y. Zenou (2009). Peer effects and social networks in
education. Review of Economic Studies 76, 1239–1267.
Camerer, C. F. and M. Knez (2002). Coordination in organizations: A game-theoretic perspec-
tive. In Z. Shapira (Ed.), Organizational Decision Making, Chapter 8. Cambridge University
Press.
Carlsson, H. and E. van Damme (1993). Global games and equilibrium selection. Economet-
rica 61, 989–1018.
Cartwright, S. and C. L. Cooper (1993). The role of culture compatibility in successful orga-
nizational marriage. Academy of Management Executive 7, 57–70.
CBS 60 Minutes (2013, January 7). How to design breakthrough inventions?
46

Chen, R. and Y. Chen (2011). The potential of social identity for equilibrium selection. Amer-
ican Economic Review 101, 2562–2589.
Crawford, V. P., M. A. Costa-Gomes, and N. Iriberri (2013). Structural models of nonequi-
librium strategic thinking: Theory, evidence, and applications. Journal of Economic Liter-
ature 51, 5–62.
Crawford, V. P. and H. Haller (1990). Learning how to cooperate: Optimal play in repeated
coordination games. Econometrica 58, 571–595.
Cremer, J. (1993). Corporate culture and shared knowledge. Industrial and Corporate
Change 2, 351–386.
Currarini, S., M. O. Jackson, and P. Pin (2009). An economic model of friendship: Homophily,
minorities, and segregation. Econometrica 77, 1003–1045.
Cushman, J. (1990). Avianca flight 52: The delays that ended in disaster. New York Times .
February 5.
De Dreu, C. K. W. (2006). When too little or too much hurts: Evidence for a curvilinear
relationship between task conflict and innovation in teams. Journal of Management 32,
83–107.
de Vignemont, F. and T. Singer (2006). The empathic brain: How, when and why? Trends in
Cognitive Sciences 10 (10), 435–441.
Dezso, C. L. and D. G. Ross (2012). Does female representation in top management improve
firm performance? A panel data investigation. Strategic Management Journal 33, 1072–1089.
Duncan, O. D. and B. Duncan (1955). A methodological analysis of segregation indices.
American Sociological Review 20, 200–217.
Eisenhardt, K. M. (1989). Making fast strategic decisions in high-velocity environments.
Academy of Management Journal 32, 543–576.
Elfenbein, H. A. and N. Ambady (2002). On the universality and cultural specificity of emotion
recognition: A meta-analysis. Psychological Bulletin 128, 243–249.
Epley, N. and A. Waytz (2010). Mind perception. In S. T. Fiske, D. T. Gilbert, and G. Lindzey
(Eds.), Handbook of Social Psychology (Fifth ed.), Volume 1, Chapter 14. Wiley.
47

Galeotti, A. and A. Mattozzi (2011). “Personal influence”: Social context and political com-
petition. American Economic Journal: Microeconomics 3, 307–327.
Gersick, C. J. and J. R. Hackman (1990). Habitual routines in task-performing groups. Orga-
nizational Behavior and Human Decision Processes 47, 65–97.
Gibbons, R. and J. Roberts (Eds.) (2013). Handbook of Organizational Economics. Princeton
University Press.
Golub, B. and M. O. Jackson (2012). How homophily affects the speed of learning and best-
response dynamics. Quarterly Journal of Economics 127, 1287–1338.
Greenstein, F. I. (1988). Leadership in the Modern Presidency. Harvard University Press.
Grout, P. A., S. Mitraille, and S. Sonderegger (2014). The costs and benefits of coordinating
with a different group. Working paper, University of Nottingham.
Gudykunst, W. B. (2004). Bridging Differences: Effective Intergroup Communication. SAGE.
Harsanyi, J. C. and R. Selten (1988). A General Theory of Equilibrium Selection in Games.
MIT Press.
Hermalin, B. E. (2013). Leadership and corporate culture. In R. Gibbons and J. Roberts
(Eds.), Handbook of Organizational Economics, pp. 432–478. Princeton University Press.
Hofstede, G. (2001). Culture’s Consequences: Comparing Values, Behaviors, Institutions and
Organizations Across Nations. SAGE.
Hong, L. and S. E. Page (2001). Problem solving by heterogeneous agents. Journal of Economic
Theory 97, 123–163.
Jackson, M. O. and Y. Xing (2014). Culture-dependent strategies in coordination games.
Proceedings of the National Academy of Sciences 111, 10889–10896.
Jackson, S. E. and A. Joshi (2011). Work team diversity. In S. Zedeck (Ed.), APA Handbook
of Industrial and Organizational Psychology, Volume 1, Chapter 20. American Psychological
Association.
James, W. (1890/1983). Principles of Psychology. Harvard University Press.
Janssen, M. C. W. (2001). Rationalizing focal points. Theory and Decision 50, 119–148.
Kahneman, D. (2011). Thinking, Fast and Slow. Macmillan.
48

Kandori, M., G. J. Mailath, and R. Rob (1993). Learning, mutation, and long run equilibria
in games. Econometrica 61, 29–56.
Kets, W. and A. Sandroni (2015a). A belief-based theory of homophily. Working paper,
Northwestern University.
Kets, W. and A. Sandroni (2015b). A rational approach to coordination. Mimeo, Northwestern
University.
Kreps, D. M. (1990). Corporate culture and economic theory. In J. Alt and K. Shepsle (Eds.),
Perspectives on Positive Political Economy, pp. 90–143. Cambridge University Press.
Kuran, T. and W. Sandholm (2008). Cultural integration and its discontents. Review of
Economic Studies 75, 201–228.
Lazear, E. P. (1999a). Culture and language. Journal of Political Economy 107 (S6), S95–S126.
Lazear, E. P. (1999b). Globalisation and the market for team-mates. Economic Journal 109,
C15–C40.
Le Coq, C., J. Tremewan, and A. K. Wagner (2015). On the effects of group identity in
strategic environments. European Economic Review 76, 239–252.
Locke, J. (1690/1975). An essay concerning human understanding. Oxford University Press.
Mailath, G. J. (1998). Do people play Nash equilibrium? Lessons from evolutionary game
theory. Journal of Economic Literature XXXVI, 1347–1374.
McKelvey, R. D. and T. R. Palfrey (1995). Quantal response equilibria for normal form games.
Games and Economic Behavior 10, 6–38.
Mehta, J., C. Starmer, and R. Sugden (1994). The nature of salience: An experimental
investigation of pure coordination games. American Economic Review 84, 658–673.
Meyer, E. (2014). The Culture Map: Breaking Through the Invisible Boundaries of Global
Business. PublicAffairs.
Mill, J. S. (1872/1974). A system of logic, ratiocinative and inductive, Volume 7 of Collected
works of John Stuart Mill. University of Toronto Press.
Mokyr, J. (1990). The Lever of Riches: Technological Creativity and Economic Progress.
Oxford University Press.
49

Morris, S. (2000). Contagion. Review of Economic Studies 67, 57–78.
Ottaviano, G. I. P. and G. Peri (2006). The economic value of cultural diversity: Evidence
from US cities. Journal of Economic Geography 6, 9–44.
Page, S. E. (2007). The Difference: How the Power of Diversity Creates Better Groups, Firms,
Schools, and Societies. Princeton University Press.
Patacchini, E. and Y. Zenou (2012). Ethnic networks and employment outcomes. Regional
Science and Urban Economics 42, 938–949.
Pelled, L. H., K. M. Eisenhardt, and K. R. Xin (1999). Exploring the black box: An analysis of
work group diversity, conflict and performance. Administrative Science Quarterly 44, 1–28.
Peri, G. (2012). The effect of immigration on productivity: Evidence from U.S. states. Review
of Economics and Statistics 94, 348–358.
Pfeffer, J. and R. I. Sutton (1999). Knowing “what” to do is not enough: Turning knowledge
into action. California Management Review 42, 83–108.
Phillips, K. W., G. B. Northcraft, and M. A. Neale (2006). Surface-level diversity and decision-
making in groups: When does deep-level similarity help? Group Processes & Intergroup
Relations 9, 467–482.
Prat, A. (2002). Should a team be homogenous? European Economic Review 46, 1187–1207.
Price, D. (2008). The Pixar Touch. Alfred A. Knopf.
P¦ski, M. and B. Szentes (2013). Spontaneous discrimination. American Economic Review 103,
2412–2436.
Rao, H., R. Sutton, and A. P. Webb (2008). Innovation lessons from Pixar: An interview with
Oscar-winning director Brad Bird. McKinsey Quarterly . April.
Reagans, R. and E. W. Zuckerman (2001). Networks, diversity, and productivity: The social
capital of corporate R&D teams. Organization Science 12, 502–517.
Richard, O., A. McMillan, K. Chadwick, and S. Dwyer (2003). Employing an innovation
strategy in racially diverse workforces: Effects on firm performance. Group & Organization
Management 28, 107–126.
Robalino, N. and A. J. Robson (2015). The evolution of strategic sophistication. American
Economic Review . forthcoming.
50

Russell, B. (1948). Human knowledge: Its scope and limits. George Allen & Unwin.
Schelling, T. (1960). The Strategy of Conflict. Harvard University Press.
Simons, T., L. H. Pelled, and K. A. Smith (1999). Making use of difference: Diversity, de-
bate, and decision comprehensiveness in top management teams. Academy of Management
Journal 42, 662–673.
Sugden, R. (1995). A theory of focal points. Economic Journal 105, 533–550.
Triandis, H. C. and E. M. Suh (2002). Cultural influences on personality. Annual Review of
Psychology 53, 133–160.
Van den Steen, E. (2010). Culture clash: The costs and benefits of homogeneity. Management
Science 56, 1718–1738.
Van Huyck, J. B., R. C. Battalio, and R. O. Beil (1991). Strategic uncertainty, equilibrium
selection, and coordination failure in average opinion games. Quarterly Journal of Eco-
nomics 106, 885–910.
Weber, R. A. and C. F. Camerer (2003). Cultural conflict and merger failure: An experimental
approach. Management Science 49, 400–415.
Wiersema, W. F. and K. A. Bantel (1992). Top management team demography and corporate
strategic change. Academy of Management Journal 35, 91–121.
Young, H. P. (1993). The evolution of conventions. Econometrica 61, 57–84.
51