Challenges of Growth 2013 - Eurocontrol | - Driving … of Growth 2013 task 4 european air traffic...
64
Challenges of Growth 2013 Task 4: European Air Traffic in 2035 EUROCONTROL Network Manager nominated by the European Commission
Transcript of Challenges of Growth 2013 - Eurocontrol | - Driving … of Growth 2013 task 4 european air traffic...
Challenges of Growth 2013
Task 4: European Air Traffic in 2035
EUROCONTROL
Network Managernominated by the European Commission

Challenges of Growth 2013 Task 4: European Air Traffic in 2035 3
Summary
This report presents the 2013 update of the EUROCONTROL 20-year forecast of IFR flight movements in Europe up to 2035. It focuses on developments after 2019; traffic evolution between now and 2019 is discussed in the EUROCONTROL 7-year forecast published in February 2013 (Ref. 5). This forecast replaces the EUROCONTROL Long-Term Forecast issued in December 2010, and was prepared as a task of Challenges of Growth 2013.
Looking 20 or more years ahead, it is more robust to consider not just a single forecast, but a range of potential scenarios for how air transport in Europe, and the factors influencing it, might develop. This forecast uses four scenarios to explore the future of the aviation and the risks that lie ahead:
n scenario A: Global Growth;n scenario C: Regulated Growth (most-likely);n scenario C’: Happy Localism;n scenario D: Fragmenting World.
Each scenario has different input assumptions: economic growth, fuel prices, load factors, hub-and-spoke versus point-to-point etc. This leads to different volumes of traffic, and different underlying patterns of growth: long- versus short-haul, rates of up-gauging of aircraft etc.
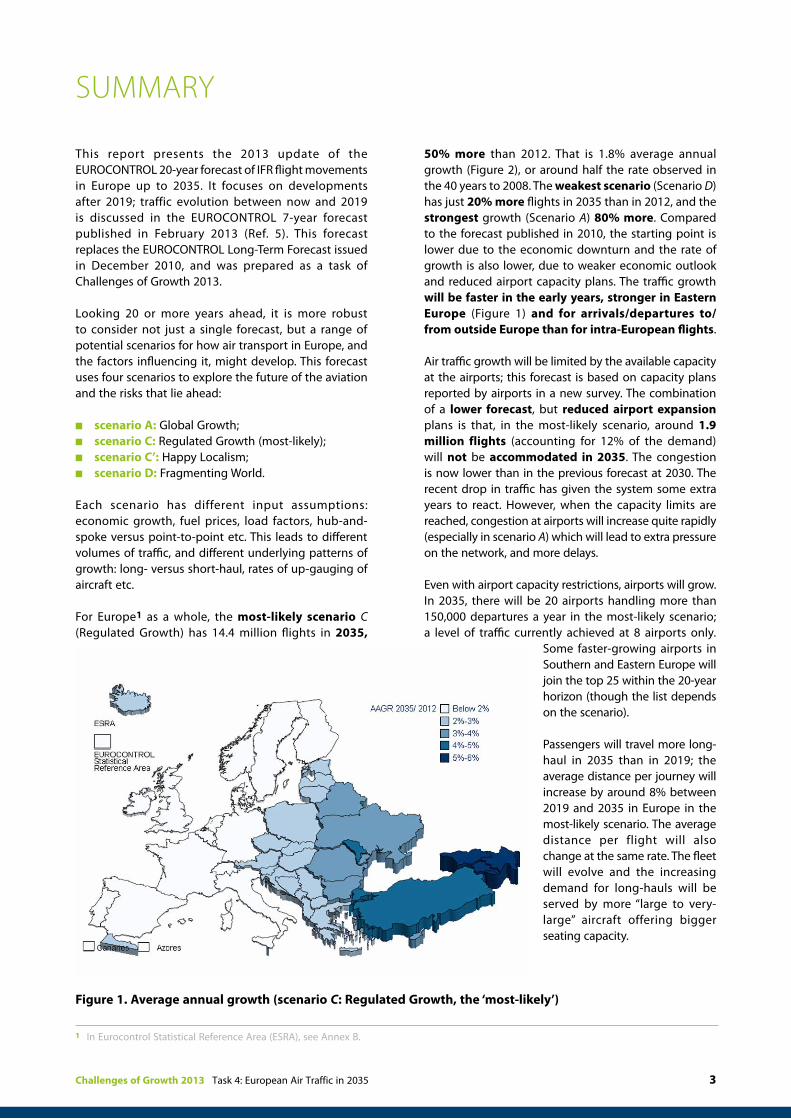
For Europe1 as a whole, the most-likely scenario C (Regulated Growth) has 14.4 million flights in 2035,
50% more than 2012. That is 1.8% average annual growth (Figure 2), or around half the rate observed in the 40 years to 2008. The weakest scenario (Scenario D) has just 20% more flights in 2035 than in 2012, and the strongest growth (Scenario A) 80% more. Compared to the forecast published in 2010, the starting point is lower due to the economic downturn and the rate of growth is also lower, due to weaker economic outlook and reduced airport capacity plans. The traffic growth will be faster in the early years, stronger in Eastern Europe (Figure 1) and for arrivals/departures to/from outside Europe than for intra-European flights.
Air traffic growth will be limited by the available capacity at the airports; this forecast is based on capacity plans reported by airports in a new survey. The combination of a lower forecast, but reduced airport expansion plans is that, in the most-likely scenario, around 1.9 million flights (accounting for 12% of the demand) will not be accommodated in 2035. The congestion is now lower than in the previous forecast at 2030. The recent drop in traffic has given the system some extra years to react. However, when the capacity limits are reached, congestion at airports will increase quite rapidly (especially in scenario A) which will lead to extra pressure on the network, and more delays.
Even with airport capacity restrictions, airports will grow. In 2035, there will be 20 airports handling more than 150,000 departures a year in the most-likely scenario; a level of traffic currently achieved at 8 airports only.
Some faster-growing airports in Southern and Eastern Europe will join the top 25 within the 20-year horizon (though the list depends on the scenario).
Passengers will travel more long-haul in 2035 than in 2019; the average distance per journey will increase by around 8% between 2019 and 2035 in Europe in the most-likely scenario. The average distance per flight will also change at the same rate. The fleet will evolve and the increasing demand for long-hauls will be served by more “large to very-large” aircraft offering bigger seating capacity.
Figure 1. Average annual growth (scenario C: Regulated Growth, the ‘most-likely’)
1 In Eurocontrol Statistical Reference Area (ESRA), see Annex B.

Due to the economic downturn leading to slower traffic growth rates than expected, this 20-year forecast starts lower than the previous one published in 2010. Moreover, the baseline economic growth is also expected to be slower from 2020, and airport expansion plans have been sharply reduced compared to the previous forecast. This 20-year forecast expects 3.4 million fewer flights in 2030 than what was forecasted for 2030 in 2010.
With twenty years horizon the forecast is clearly prone to changes in economic, political and social conditions of the future World. Some of the risks have been addressed in the four scenarios of this forecast but there are many other factors that have the potential to change aviation as we know it. Some of the major ones are discussed in section 4.7. Users are advised to consider these when using the forecast results.
The future sustainability of European aviation is also highly dependent on the pace of both traffic growth and technological development, and of evolving public perceptions. To ensure sustainable growth, a comprehensive approach will be required to environmental impact management, including operational, technological, regulatory and market-based measures. The scope of work is ambitious and success will be dependent on investment and international cooperation. The outcomes will have a significant influence on the industry’s ability to reduce its environmental impact.
IFR Movements(000s) Traffic Multiple
2035/ 20122009 2010 2011 2012 2019 2020 2025 2030 2035
A: Global Growth 9,413 9,493 9,784 9,548 12,045 12,485 14,139 15,749 17,338 1.8
C: Regulated Growth . . . . 11,169 11,411 12,561 13,520 14,356 1.5
C’: Happy Localism . . . . 11,169 11,338 12,236 13,015 13,769 1.4
D: Fragmenting World . . . . 10,132 10,194 10,612 10,840 11,249 1.2
Average Annual GrowthAAGR 2035/ 20122009 2010 2011 2012 2019/
20122020/2019
2025/2021
2030/2026
2035/2031
A: Global Growth -6.6% 0.8% 3.1% -2.4% 3.4% 3.7% 2.5% 2.2% 1.9% 2.6%
C: Regulated Growth . . . . 2.3% 2.2% 1.9% 1.5% 1.2% 1.8%
C’: Happy Localism . . . . 2.3% 1.5% 1.5% 1.2% 1.1% 1.6%
D: Fragmenting World . . . . 0.9% 0.6% 0.8% 0.4% 0.7% 0.7%
Figure 2. Summary of forecast for Europe.

Challenges of Growth 2013 Task 4: European Air Traffic in 2035 5
1. Introduction 7
1.1 General 7
1.2 Summary of the forecast method 7
2. What might future demand be like? 8
3. Four scenarios for the future 10
4. Forecast results 14
4.1 Summary of results 14
4.2 Airport capacity 20
4.3 Airport and airline network 23
4.4 Travel distance and aircraft size 25
4.5 High-speed train 27
4.6 Comparison with previous forecast 28
4.7 Risks 30
5. Environmental impact 31
5.1 Global Impacts 31
5.2 Local Impacts 32
5.3 Uneven Impacts 33
6. Glossary 34
Annex A Forecast method 35
Annex B Geographical definitions 38
Annex C Summary forecast for ESRA 42
Annex D Summary forecast by Region 45
Annex E Alternative Fuels 59
Annex F Political targets 60
Annex G References 61
ContentS
Acknowledgements:
We would like to thank the members of the STATFOR User Group and the Working Group 1 (WG1) of the Community Observatory on Airport Capacity who contributed to the scenario workshop of this task.
The airport capacity data used in this work were gathered from the Airport Corner tool. We would like to thank also the EUROCONTROL Airport Unit experts for their support.
6
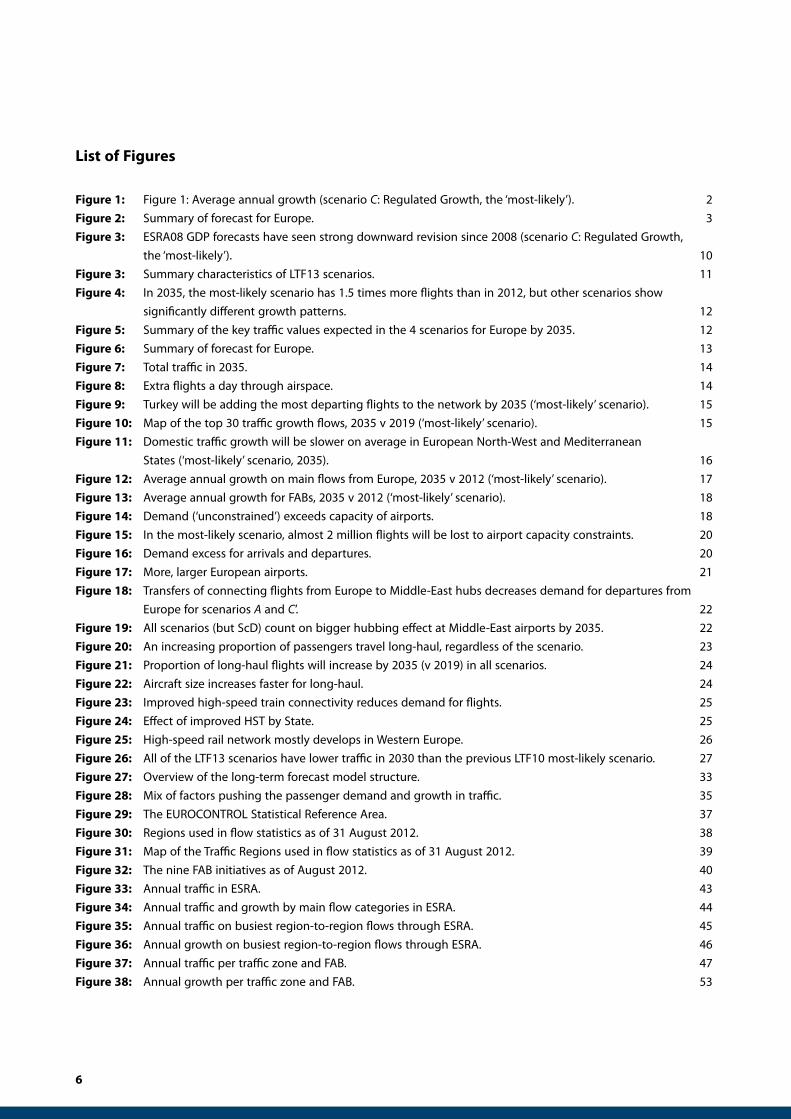
List of Figures
Figure 1: Figure 1: Average annual growth (scenario C: Regulated Growth, the ‘most-likely’). 2
Figure 2: Summary of forecast for Europe. 3
Figure 3: ESRA08 GDP forecasts have seen strong downward revision since 2008 (scenario C: Regulated Growth,
the ‘most-likely’). 10
Figure 3: Summary characteristics of LTF13 scenarios. 11
Figure 4: In 2035, the most-likely scenario has 1.5 times more flights than in 2012, but other scenarios show
significantly different growth patterns. 12
Figure 5: Summary of the key traffic values expected in the 4 scenarios for Europe by 2035. 12
Figure 6: Summary of forecast for Europe. 13
Figure 7: Total traffic in 2035. 14
Figure 8: Extra flights a day through airspace. 14
Figure 9: Turkey will be adding the most departing flights to the network by 2035 (‘most-likely’ scenario). 15
Figure 10: Map of the top 30 traffic growth flows, 2035 v 2019 (‘most-likely’ scenario). 15
Figure 11: Domestic traffic growth will be slower on average in European North-West and Mediterranean
States (‘most-likely’ scenario, 2035). 16
Figure 12: Average annual growth on main flows from Europe, 2035 v 2012 (‘most-likely’ scenario). 17
Figure 13: Average annual growth for FABs, 2035 v 2012 (‘most-likely’ scenario). 18
Figure 14: Demand (‘unconstrained’) exceeds capacity of airports. 18
Figure 15: In the most-likely scenario, almost 2 million flights will be lost to airport capacity constraints. 20
Figure 16: Demand excess for arrivals and departures. 20
Figure 17: More, larger European airports. 21
Figure 18: Transfers of connecting flights from Europe to Middle-East hubs decreases demand for departures from
Europe for scenarios A and C’. 22
Figure 19: All scenarios (but ScD) count on bigger hubbing effect at Middle-East airports by 2035. 22
Figure 20: An increasing proportion of passengers travel long-haul, regardless of the scenario. 23
Figure 21: Proportion of long-haul flights will increase by 2035 (v 2019) in all scenarios. 24
Figure 22: Aircraft size increases faster for long-haul. 24
Figure 23: Improved high-speed train connectivity reduces demand for flights. 25
Figure 24: Effect of improved HST by State. 25
Figure 25: High-speed rail network mostly develops in Western Europe. 26
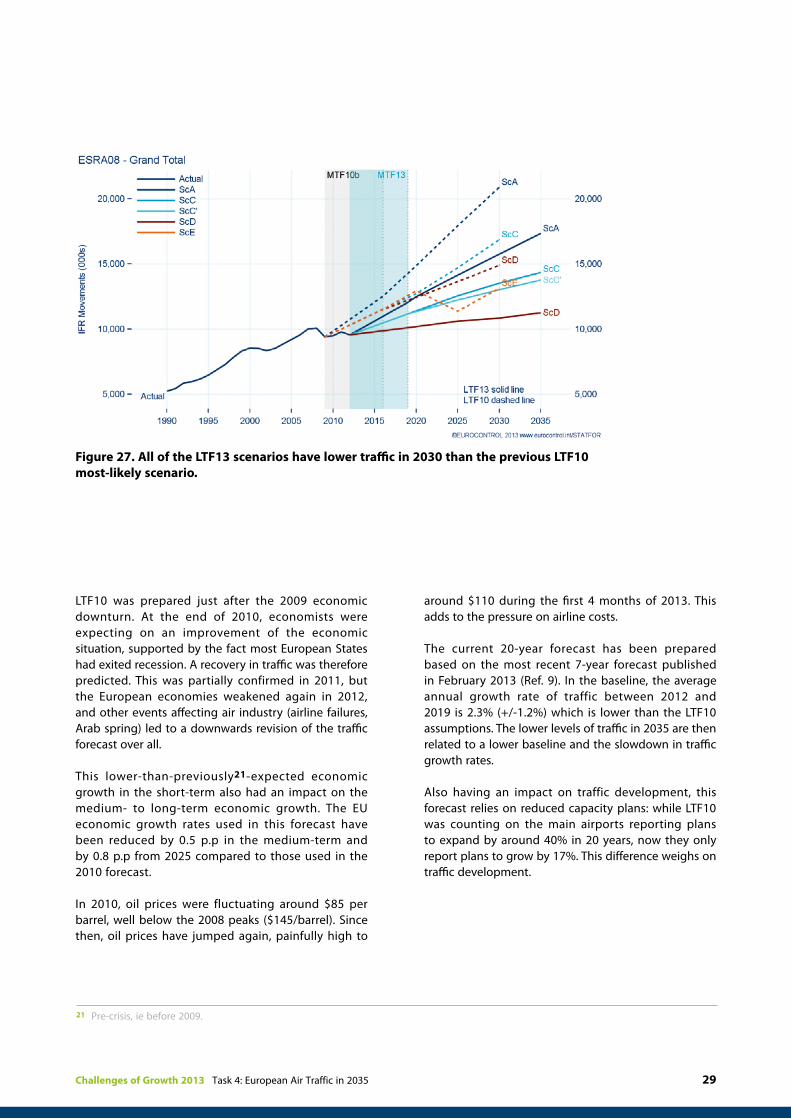
Figure 26: All of the LTF13 scenarios have lower traffic in 2030 than the previous LTF10 most-likely scenario. 27
Figure 27: Overview of the long-term forecast model structure. 33
Figure 28: Mix of factors pushing the passenger demand and growth in traffic. 35
Figure 29: The EUROCONTROL Statistical Reference Area. 37
Figure 30: Regions used in flow statistics as of 31 August 2012. 38
Figure 31: Map of the Traffic Regions used in flow statistics as of 31 August 2012. 39
Figure 32: The nine FAB initiatives as of August 2012. 40
Figure 33: Annual traffic in ESRA. 43
Figure 34: Annual traffic and growth by main flow categories in ESRA. 44
Figure 35: Annual traffic on busiest region-to-region flows through ESRA. 45
Figure 36: Annual growth on busiest region-to-region flows through ESRA. 46
Figure 37: Annual traffic per traffic zone and FAB. 47
Figure 38: Annual growth per traffic zone and FAB. 53
Challenges of Growth 2013 Task 4: European Air Traffic in 2035 7
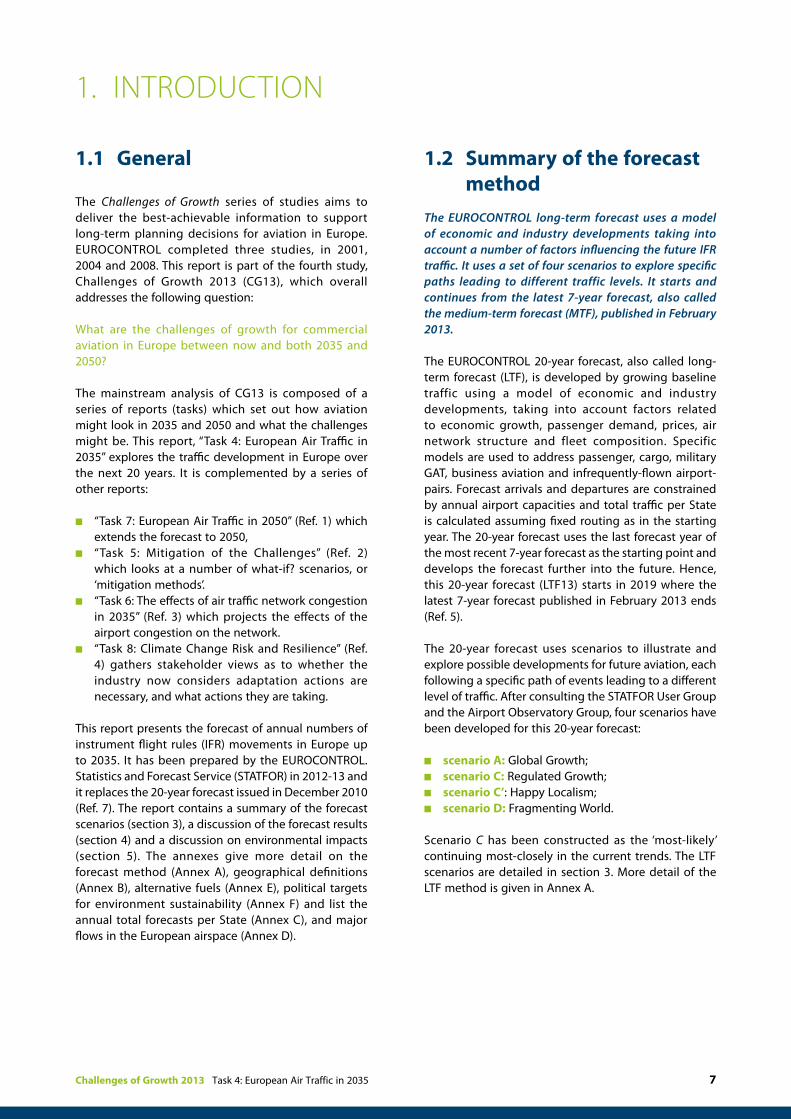
1.1 General
The Challenges of Growth series of studies aims to deliver the best-achievable information to support long-term planning decisions for aviation in Europe. EUROCONTROL completed three studies, in 2001, 2004 and 2008. This report is part of the fourth study, Challenges of Growth 2013 (CG13), which overall addresses the following question:
What are the challenges of growth for commercial aviation in Europe between now and both 2035 and 2050?
The mainstream analysis of CG13 is composed of a series of reports (tasks) which set out how aviation might look in 2035 and 2050 and what the challenges might be. This report, “Task 4: European Air Traffic in 2035” explores the traffic development in Europe over the next 20 years. It is complemented by a series of other reports:
n “Task 7: European Air Traffic in 2050” (Ref. 1) which extends the forecast to 2050,
n “Task 5: Mitigation of the Challenges” (Ref. 2) which looks at a number of what-if? scenarios, or ‘mitigation methods’.
n “Task 6: The effects of air traffic network congestion in 2035” (Ref. 3) which projects the effects of the airport congestion on the network.
n “Task 8: Climate Change Risk and Resilience” (Ref. 4) gathers stakeholder views as to whether the industry now considers adaptation actions are necessary, and what actions they are taking.
This report presents the forecast of annual numbers of instrument flight rules (IFR) movements in Europe up to 2035. It has been prepared by the EUROCONTROL. Statistics and Forecast Service (STATFOR) in 2012-13 and it replaces the 20-year forecast issued in December 2010 (Ref. 7). The report contains a summary of the forecast scenarios (section 3), a discussion of the forecast results (section 4) and a discussion on environmental impacts (section 5). The annexes give more detail on the forecast method (Annex A), geographical definitions (Annex B), alternative fuels (Annex E), political targets for environment sustainability (Annex F) and list the annual total forecasts per State (Annex C), and major flows in the European airspace (Annex D).
1.2 Summary of the forecast method
The EUROCONTROL long-term forecast uses a model of economic and industry developments taking into account a number of factors influencing the future IFR traffic. It uses a set of four scenarios to explore specific paths leading to different traffic levels. It starts and continues from the latest 7-year forecast, also called the medium-term forecast (MTF), published in February 2013.
The EUROCONTROL 20-year forecast, also called long-term forecast (LTF), is developed by growing baseline traffic using a model of economic and industry developments, taking into account factors related to economic growth, passenger demand, prices, air network structure and fleet composition. Specific models are used to address passenger, cargo, military GAT, business aviation and infrequently-flown airport-pairs. Forecast arrivals and departures are constrained by annual airport capacities and total traffic per State is calculated assuming fixed routing as in the starting year. The 20-year forecast uses the last forecast year of the most recent 7-year forecast as the starting point and develops the forecast further into the future. Hence, this 20-year forecast (LTF13) starts in 2019 where the latest 7-year forecast published in February 2013 ends (Ref. 5).
The 20-year forecast uses scenarios to illustrate and explore possible developments for future aviation, each following a specific path of events leading to a different level of traffic. After consulting the STATFOR User Group and the Airport Observatory Group, four scenarios have been developed for this 20-year forecast:
n scenario A: Global Growth;n scenario C: Regulated Growth;n scenario C’: Happy Localism;n scenario D: Fragmenting World.
Scenario C has been constructed as the ‘most-likely’ continuing most-closely in the current trends. The LTF scenarios are detailed in section 3. More detail of the LTF method is given in Annex A.
1. IntroduCtIon
8
2. What mIght future demand be lIke?
Even if the traffic growth rates in the medium term are expected to remain well below the pre-2009 long term trend (see Ref. 5), there is still some potential for further growth of air traffic in Europe. However the demand will not be homogeneous and the traffic growth will not be uniform. Each market segment will be different, long-haul different from short-haul, and each part of Europe different from the other. In introducing this new 20-year forecast we focus on a different deviation from uniformity: between the past and the future.
It can be too easy to imagine that future air traffic will be rather like the past, only with more of it. This, in a nutshell, is the ‘most-likely scenario’. One role of a long-term forecast is to challenge the assumptions and preconceptions underlying such a scenario. Different decision-makers may indeed have different views about what ‘business as usual’ means (one of the reasons we have stopped using the term for ‘most-likely’). The scenarios of a long-term forecast are there to provide not just a quantitative foundation for thinking about a baseline case, but also to inform a discussion of risks. The long-term forecast is above all about helping decision-makers to understand the risks: what might happen, and will our plans work if so?
Some fundamentals will remain with us: IFR flights will still be about moving people and goods safely, efficiently, cost-effectively and with minimum impact on the environment. Aviation will still be an economic catalyst for business, for tourism, and for manufacturing industry. Aviation will still deliver social connectivity and security – bringing families, friends and States together. If these fundamentals, the “why?” of aviation, are immutable then the “when?”, “what?”, “where?”, “how?” and “how much?” are all up for change.
This is a twenty-year2 forecast. Twenty three years ago, to give just a few examples: EU was made of 12 States only (1989), the deregulation of aviation in Europe was a work-in-progress (1992 milestone yet to come); Ryanair had just abandoned business class in the process of becoming low-cost (1990); the Baltic States were taking steps towards independence (1990-1991); Tim Berners-Lee had just kicked off the world wide web (1989); London/Heathrow had 50% more flights than
There is growth to come over the next twenty years of aviation but it may look quite different from what we have been used to. The 20-year forecast challenges our preconceptions of ‘most-likely scenario’.
Paris/Charles de Gaulle (1991), compared to 5% fewer in 2012, Aeroflot had the biggest fleet in Europe in 1989 with more than 3,000 airframes.
So what are the factors that have the potential to be far bigger in the next 20 years than ever they did in the last?
Regulation is returning. After the recent banking failures, in which too little regulation played its part, more is to be expected. Not the piecemeal regulation of prices and market access that was the theme of the regulations un-wound in the 1990s, nor regulation that is entirely new: noise chapters have been with us for some time, but now the pace of environmental regulation is accelerating (CO2 of course, in the coming years, but then CO2 standards, NOx, contrails,…); and competition regulators are increasingly showing their teeth.
Indeed, costs will be under scrutiny as never before, because the debts incurred during the recent financial crisis will reduce many a European government’s ability to invest in infrastructure projects or subsidise their transport system through public-service obligation routes or otherwise.
In this, air traffic management is a relatively small part, but the regulations related to the Single European Sky will fundamentally change the value chain, with the sharing of cost-risk and with the business trajectory putting more power in the hands of the aircraft operator. This has the potential to change operators’ profitability, but also business models.
Co-modality, whether competition or collaboration between modes, has certainly had significant local effects so far and more is in the pipeline. However, for reasons already discussed, further high-speed rail infrastructure is likely to come more slowly.
On the forecasts we use, China overtakes the US in terms of total GDP from 2030. As well as its geopolitical implications, this will be accompanied by changes to the flows of the World economy: of raw materials, finished goods, and finance. Just as global transport
2 Twenty-three years, to be precise.

Challenges of Growth 2013 Task 4: European Air Traffic in 2035 9
re-configured for globalisation, so it will re-configure again for sinicisation3 – or should that be BRIC-isation4?
In terms of air traffic growth, Europe will be in the slow lane, with the Middle-East and China (Asia/Pacific) growing much more rapidly. The rapid growth of short-haul, low-cost in the last twenty years has changed passengers’ expectations of short-haul aviation, and hence affected all carriers’ short-haul models. Perhaps the competition from the Middle-East in long-haul will have a similar transformational power.
The climate is changing. How it will change is increasingly becoming clear, more uncertain is when (Ref. 6). After discussions with the STATFOR User Group, for this forecast we have assumed that the major impacts of this lie largely beyond 2035, but they are definitely risks for the later years of the forecast: the threats to the infrastructure and to daily operations, the changed travel patterns as Summer temperatures rise and skiing availability changes, the economic challenges of droughts.
Oil prices and supply are well represented in the scenarios of the forecast. Although we have not seen any indisputable evidence for or against a near-term peaking of oil; it seems to remain a possibility that has been quantitatively assessed in previous forecast (Ref. 7).
The economic crisis has provided an additional opportunity for governments to address what has long been identified: the sustainability, or rather unsustainability, of pension provisions. In many European countries there will be older pensioners, and poorer. In fact, the effects of this could be a higher propensity to fly on average, since those of working age fly more often.
For short-haul flights, it might seem that every new European airline in the last ten years has trumpeted its low-cost credentials. The transformational business model of the next twenty years may be with us already or yet to appear. Perhaps long-haul low cost, or the multi-national alliance, air taxi, or the co-modal firm?
Transport remains a target for terrorists and the ‘hassle factor’ of security checks which has been talked about so much since 2001 has, if anything, become even more an issue with a growing perception of the intrusiveness of the data and physical checks. This could blend back into the accepted background again, but it could also turn into a disincentive for travel to some destinations.
3 Sinic ≈ Chinese4 BRIC: Brazil, Russia, India and China.

10
3. four scenarios for the future
Looking twenty years ahead, the World we live in may change in many ways and it is impossible to predict all of the factors, events, decisions and actions that will shape it. Our understanding of global system dependencies and dynamics can never be perfect and, perhaps even more importantly, it is limited by our current experience and knowledge. To overcome this difficulty, we have developed various scenarios, depending on factors like the economy, fuel prices etc. Based on these scenarios, the 20-year forecast explores various possible ways in which the air traffic might evolve in the future.
In contrast to the 7-year forecasts which develop a central forecast as a base scenario and an interval around with bounds referred to as high and low scenarios, the 20-year scenarios are individual, qualitatively-different representations of the many possible futures. Rather than creating an interval that is likely to cover the number of future flights, they each follow a specific path of events and developments that corresponds to the forecast traffic. What the 20-year forecast aims at is not providing the exact future traffic counts but more the understanding of the factors that will shape future air traffic and the risks that lie ahead. None of the scenarios will actually become true in 2035. In reality, the future number of flights will be the result of the effective realisation of the various factors and will be nearer to some of the 20-year forecast scenarios than some others. Nevertheless, these scenarios provide context to help organizations consider the implications of future events (e.g what events might lead to high/low traffic growth), and help them prepare for change and uncertainty.
The 20-year forecast uses a set of four scenarios to explore the future of aviation:A: Global Growth, C: Regulated Growth, C’: Happy Localism and D: Fragmenting World. Each scenario has a specific storyline and a mix of characteristics following aparticular path into the future with the aim to improve our understanding of factorsthat will influence future traffic growth and the risks that lie ahead. Scenario C hasbeen constructed as the ‘most-likely’ and continues in current trends.
The last 20-year forecast (LTF10) published in December 2010 used four scenarios for the future, largely based on previous long-term forecasts. Scenarios A: Global Growth, C: Regulated Growth and D: Fragmenting World drew on the work done for CONSAVE5, ACARE6 and the IPCC7 although they had been updated to reflect the views on likely future developments in aviation. We also developed a specific scenario, “Scenario E: Resource Limits” to address the possibility of reaching the peak in oil production.
Historically, there have been four scenarios in the EUROCONTROL 20-year forecasts published. These four scenarios together were judged to capture a range of possible futures for the Industry that was wide enough to support the formulation of strategy. Based on collective decisions of the STATFOR User Group and other experts, the storylines of the scenarios have changed from time to time to better explore the paths leading to different traffic levels.
5 http://www.dir.de/consave/6 http://www.acare4europe.org/7 http://www.ipcc.ch/ (though IPCC has recently been moving away from its high-growth scenario)
2004 2006 2008 2010 2013
A: Global Growth • • • • •
B: Business As Usual • • •
C: Regulated Growth • • • • •
D: Fragmenting World • • • • •
E: Resource Limits •
C’: Happy Localism •
Development of scenarios in 20-year forecasts per publication year (‘most-likely’ highlighted).

Challenges of Growth 2013 Task 4: European Air Traffic in 2035 11
For this 20-year forecast (LTF13), we revisited these four scenarios again and, after discussion with the STATFOR User Group (SUG) and the WG 1 of the Airport Observatory, it has been decided to drop Scenario E. Not that the risk of peak oil has gone away, but it was felt that modelling it again was not necessarily the highest priority. Instead discussions during the scenario workshop led to the conclusion that we needed to envisage a scenario in which Europe would look increasingly inwards whilst maintaining the momentum of economic growth. Thus, a new scenario “Scenario C’: Happy Localism” has been introduced. The latter has been basically defined around the scenario C with the idea that fragile Europe would “better“ manage to adapt economically, technologically and politically by keeping an inwards perspective. In other words “Small is beautiful“.
In summary, in this forecast we look at the following four scenarios for the future of the aviation in Europe in twenty years horizon in the LTF13:
n Scenario A: Global Growth (Technological Growth): Strong economic growth in an increasingly globalised World, with technology used successfully to mitigate the effects of sustainability challenges such as the environment or resources availability.
n Scenario C: Regulated Growth : Moderate economic growth, with regulation reconciling the environmental, social and economic demands to address the growing global sustainability concerns. This scenario has been constructed as the ‘most-likely’ of the four, most closely following the current trends.
n Scenario C’: Happy Localism: this scenario is introduced to investigate an alternative path for the future. With European economies being more and more fragile, increasing pressure on costs, stricter environmental constraints, air travel in Europe would adapt to new global environment but taking an inwards perspective. There would be less globalization, more trade inside EU (e.g. Turkey joining Europe is important in this scenario). Also, slow growth of leisure travel to outside Europe, however certainly more inside EU. More point- to-point traffic within Europe. It does not mean that Europe does not grow or does not adapt to
new technologies and innovation but its main focus is “local”. Although this scenario is mostly based on scenario C (as its name indicates), it also inherits some aspects of other scenarios like higher fuel prices or low business aviation traffic of scenario D.
n Scenario D: Fragmenting World: A World of increasing tensions between regions, with more security threats, higher fuel prices, reduced trade and transport integration and knock-on effects of weaker economies.
As with every update of the 20-year forecast, input data have been fully revised using the latest available figures (such as GDP growth, population age structure, etc.). Furthermore, the input assumptions have been brought up to date with our current expectations for the future developments which may have changed since the LTF10 production as the external circumstances have evolved.
Any user of the forecast is strongly advised to consider all four scenarios as a means to manage risk. There are also a number of other important risks (see section 4.7), which this forecast has not included. In particular, the possibility should be considered of changes to the routing of traffic and of major external events.
The general ‘storylines’ above are further elaborated and translated into quantitative terms to serve as input assumptions in the 20-year forecast model. Since the LTF starts from the end of the MTF, the scenario factors are described from 2019 onwards. Some of the more important factors are:
GDP growth The base GDP forecast has been prepared by Oxford Economics Ltd. (January 2013 update). The forecast growth for 2019-2035 in the EU27 averages 1.6% per annum and is directly used in scenario C: Regulated Growth. It is 0.2 percentage points (p.p) higher in scenario A, 0.5 p.p lower in scenario D and 0.2 p.p lower in scenario C’. In the most-likely scenario, the GDP growth trend for EU27 has been cut8 by around 0.5 p.p compared to what was expected in the previous 20-year forecast (LTF10) and by around 0.8 p.p compared to what was expected in the previous Challenges of Growth (CG08) as shown in Figure 3.
2004 2006 2008 2010 2013
A: Global Growth • • • • •
B: Business As Usual • • •
C: Regulated Growth • • • • •
D: Fragmenting World • • • • •
E: Resource Limits •
C’: Happy Localism •
8 Comparison of the GDP average annual growth rates over the 20-year period between 2010 and 2030 from Oxford Economics Ltd economic forecasts.

12
Elasticities describe the relationships between GDP growth and growth in passenger demand. Following the exploration of market maturity in Task 3 of Challenges of Growth 2013 (Ref. 8) these have been fully recalibrated for this forecast. The study reviewed the elasticities for all region pairs and also examined the specific characteristics of domestic flows in the forecast in order to express the less rapid growth of the domestic markets. While there is a number of European states whose domestic traffic has not grown for some years, there are none that are mature in the sense of having an elasticity near zero for all traffic.
Oil prices steadily grow in scenarios A and C reaching around $145 per barrel (in 2010$) by 2035. Uncertainty about the stability of oil production in scenarios C’ and D results in speculation, high price volatility and high prices In the model, this is captured by persistently high oil prices starting at around $105/barrel in 2019 climbing to around $200/barrel in 2035. Due to higher refining margins in scenarios C’ and D (than in scenarios A or C), the kerosene prices increase somewhat faster and therefore have somewhat stronger effect on fares when these costs are passed onto passengers.
Environmental regulation Even if a global market-based measure to address CO2 emissions is delayed and the EU Emissions Trading Scheme (ETS) for aviation continues with a reduced scope, the 20-year forecast still needs to reflect the costs of emissions for airlines in the period 2019-2035. We assume that some framework is in place in which 100% of CO2 emissions
are paid for. This could be by auctioning of emissions permits, but the forecast is not sensitive to the actual mechanism by which these costs are incurred. Scenario D sees the strongest regulation with highest CO2 costs (around €107/tonne CO2 in 2035). Scenarios C and C’ are more successful at adapting to the global long-term sustainability issues and so have lower costs (around €66/tonne CO2 in 2035). In scenario A the technology has successfully moved towards less carbon-intensive energy sources and therefore has the lowest CO2 costs (around €42/tonne CO2 in 2035). The method assumes that these additional costs of airlines are fully passed onto passengers via an increase in fares.
Network structure of the airlines, i.e. concentration of traffic into hubs or use of more point-to-point operations, has an effect on the total number of flights and their regional distribution. This forecast assumes a growing importance of Middle-East hubs (namely Dubai, Abu Dhabi and Doha) for connecting traffic to/from Middle-East, Asia/Pacific and Southern Africa, resulting in slower growth of transferring passengers at European hubs on these flows. This assumption is used in all but scenario D (possible instability in the Middle-East). In scenarios A and C, Istanbul airport plays also a key role with higher hubbing rates (to a lesser extent compared to previous Middle-East airports) for connecting traffic to/from Asia/Pacific and Southern Africa. This emphasis on Turkey is however not kept in scenario C’ where Europe is seen as a region increasingly flown over by long-haul international flights.
Figure 3. ESRA08 GDP forecasts have seen strong downward revision since 2008.
Challenges of Growth 2013 Task 4: European Air Traffic in 2035 13
A:Global Growth
C:Regulated Growth
D:Fragmenting World
C’:Happy Localism
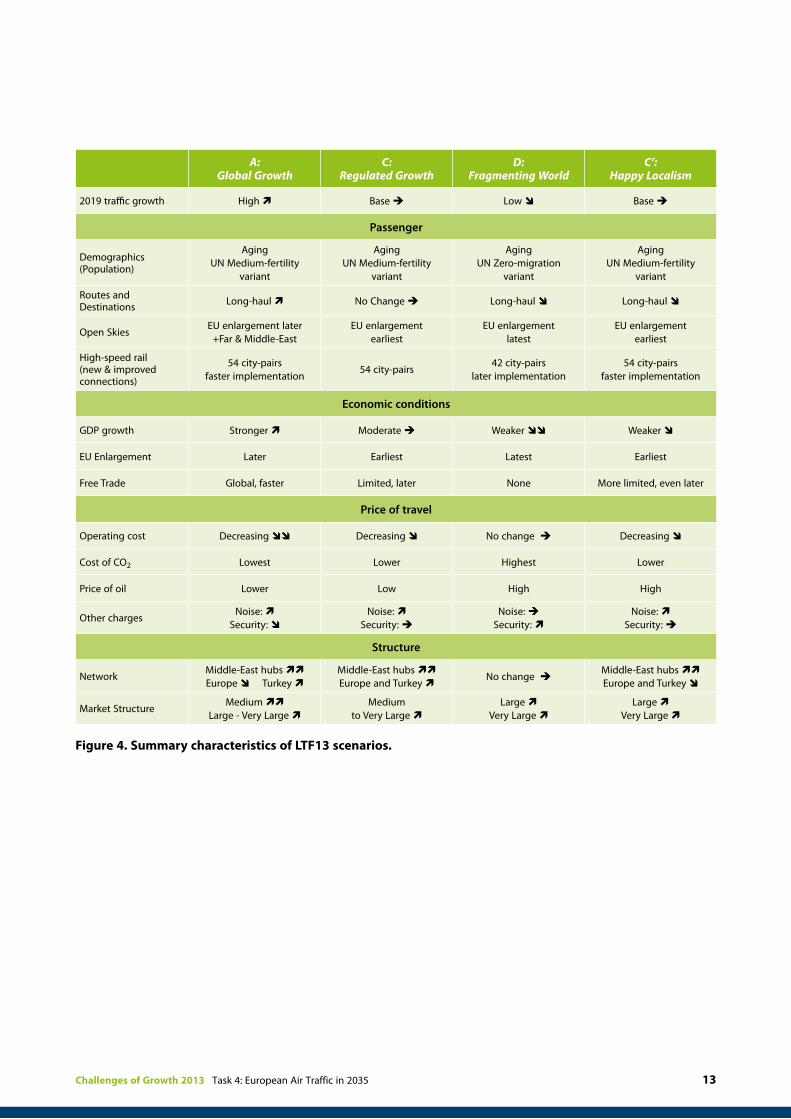
2019 traffic growth High Base è Low Base è
Passenger
Demographics(Population)
AgingUN Medium-fertility
variant
AgingUN Medium-fertility
variant
AgingUN Zero-migration
variant
AgingUN Medium-fertility
variant
Routes andDestinations Long-haul No Change è Long-haul Long-haul
Open SkiesEU enlargement later
+Far & Middle-EastEU enlargement
earliestEU enlargement
latestEU enlargement
earliest
High-speed rail(new & improved connections)
54 city-pairs faster implementation
54 city-pairs42 city-pairs
later implementation54 city-pairs
faster implementation
Economic conditions
GDP growth Stronger Moderate è Weaker Weaker
EU Enlargement Later Earliest Latest Earliest
Free Trade Global, faster Limited, later None More limited, even later
Price of travel
Operating cost Decreasing Decreasing No change è Decreasing
Cost of CO2 Lowest Lower Highest Lower
Price of oil Lower Low High High
Other chargesNoise:
Security: Noise:
Security: èNoise: è
Security: Noise:
Security: è
Structure
NetworkMiddle-East hubs Europe Turkey
Middle-East hubs Europe and Turkey
No change èMiddle-East hubs Europe and Turkey
Market Structure Medium
Large - Very Large Medium
to Very Large Large
Very Large Large
Very Large
Figure 4. Summary characteristics of LTF13 scenarios.

14
4. foreCaSt reSultS
In the ‘most-likely’ scenario of the forecast, there will be 14.4 million IFR movements in Europe in 2035, 1.5 times more than in 2012. The growth will average at 1.8% annually but it will be faster in the early years, stronger in Eastern Europe and faster for traffic to and from Europe than for intra-European flights. Turkey will be the largest generator of extra flights in Europe, and will also see the biggest number of additional departing flights in its airspace. Two of the other scenarios forecast substantially different traffic volumes: 17.3 and 11.2 million flights, respectively.
4.1 Summary of results
Figure 5. In 2035, the most-likely scenario has 1.5 times more flights than in 2012,but other scenarios show significantly different growth patterns.
IFR Mvts (million)2035
Traffic Multiple2035/2012
Ave Annual Growth
2035/2012
Extra flights/day (thousands)
A: Global Growth 17.3 1.8 2.6% 21
C: Regulated Growth 14.4 1.5 1.8% 13
C’: Happy Localism 13.8 1.4 1.6% 12
D: Fragmenting World 11.2 1.2 0.7% 5
Figure 6. Summary of the key traffic values expected in the 4 scenarios for Europe by 2035.
Challenges of Growth 2013 Task 4: European Air Traffic in 2035 15
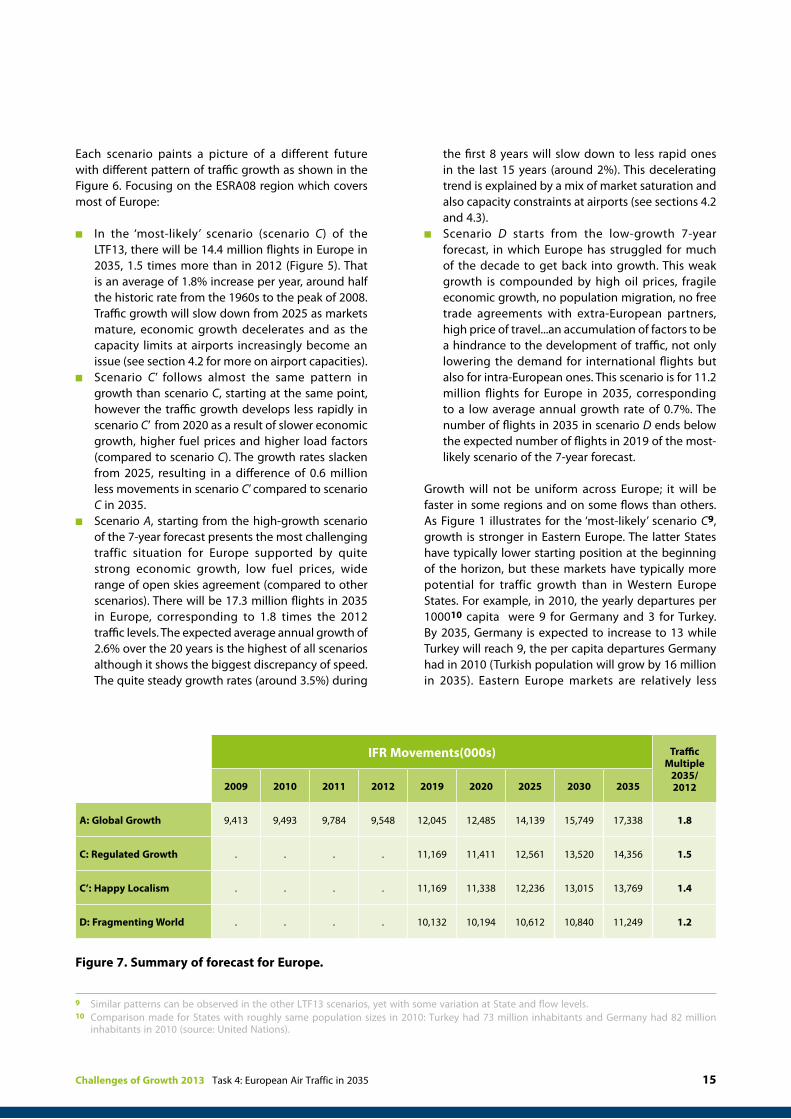
Each scenario paints a picture of a different future with different pattern of traffic growth as shown in the Figure 6. Focusing on the ESRA08 region which covers most of Europe:
n In the ‘most-likely’ scenario (scenario C) of the LTF13, there will be 14.4 million flights in Europe in 2035, 1.5 times more than in 2012 (Figure 5). That is an average of 1.8% increase per year, around half the historic rate from the 1960s to the peak of 2008. Traffic growth will slow down from 2025 as markets mature, economic growth decelerates and as the capacity limits at airports increasingly become an issue (see section 4.2 for more on airport capacities).
n Scenario C’ follows almost the same pattern in growth than scenario C, starting at the same point, however the traffic growth develops less rapidly in scenario C’ from 2020 as a result of slower economic growth, higher fuel prices and higher load factors (compared to scenario C). The growth rates slacken from 2025, resulting in a difference of 0.6 million less movements in scenario C’ compared to scenario C in 2035.
n Scenario A, starting from the high-growth scenario of the 7-year forecast presents the most challenging traffic situation for Europe supported by quite strong economic growth, low fuel prices, wide range of open skies agreement (compared to other scenarios). There will be 17.3 million flights in 2035 in Europe, corresponding to 1.8 times the 2012 traffic levels. The expected average annual growth of 2.6% over the 20 years is the highest of all scenarios although it shows the biggest discrepancy of speed. The quite steady growth rates (around 3.5%) during
the first 8 years will slow down to less rapid ones in the last 15 years (around 2%). This decelerating trend is explained by a mix of market saturation and also capacity constraints at airports (see sections 4.2 and 4.3).
n Scenario D starts from the low-growth 7-year forecast, in which Europe has struggled for much of the decade to get back into growth. This weak growth is compounded by high oil prices, fragile economic growth, no population migration, no free trade agreements with extra-European partners, high price of travel...an accumulation of factors to be a hindrance to the development of traffic, not only lowering the demand for international flights but also for intra-European ones. This scenario is for 11.2 million flights for Europe in 2035, corresponding to a low average annual growth rate of 0.7%. The number of flights in 2035 in scenario D ends below the expected number of flights in 2019 of the most-likely scenario of the 7-year forecast.
Growth will not be uniform across Europe; it will be faster in some regions and on some flows than others. As Figure 1 illustrates for the ‘most-likely’ scenario C9, growth is stronger in Eastern Europe. The latter States have typically lower starting position at the beginning of the horizon, but these markets have typically more potential for traffic growth than in Western Europe States. For example, in 2010, the yearly departures per 100010 capita were 9 for Germany and 3 for Turkey. By 2035, Germany is expected to increase to 13 while Turkey will reach 9, the per capita departures Germany had in 2010 (Turkish population will grow by 16 million in 2035). Eastern Europe markets are relatively less
IFR Movements(000s) Traffic Multiple
2035/ 20122009 2010 2011 2012 2019 2020 2025 2030 2035
A: Global Growth 9,413 9,493 9,784 9,548 12,045 12,485 14,139 15,749 17,338 1.8
C: Regulated Growth . . . . 11,169 11,411 12,561 13,520 14,356 1.5
C’: Happy Localism . . . . 11,169 11,338 12,236 13,015 13,769 1.4
D: Fragmenting World . . . . 10,132 10,194 10,612 10,840 11,249 1.2
Figure 7. Summary of forecast for Europe.
9 Similar patterns can be observed in the other LTF13 scenarios, yet with some variation at State and flow levels.10 Comparison made for States with roughly same population sizes in 2010: Turkey had 73 million inhabitants and Germany had 82 million
inhabitants in 2010 (source: United Nations).
16
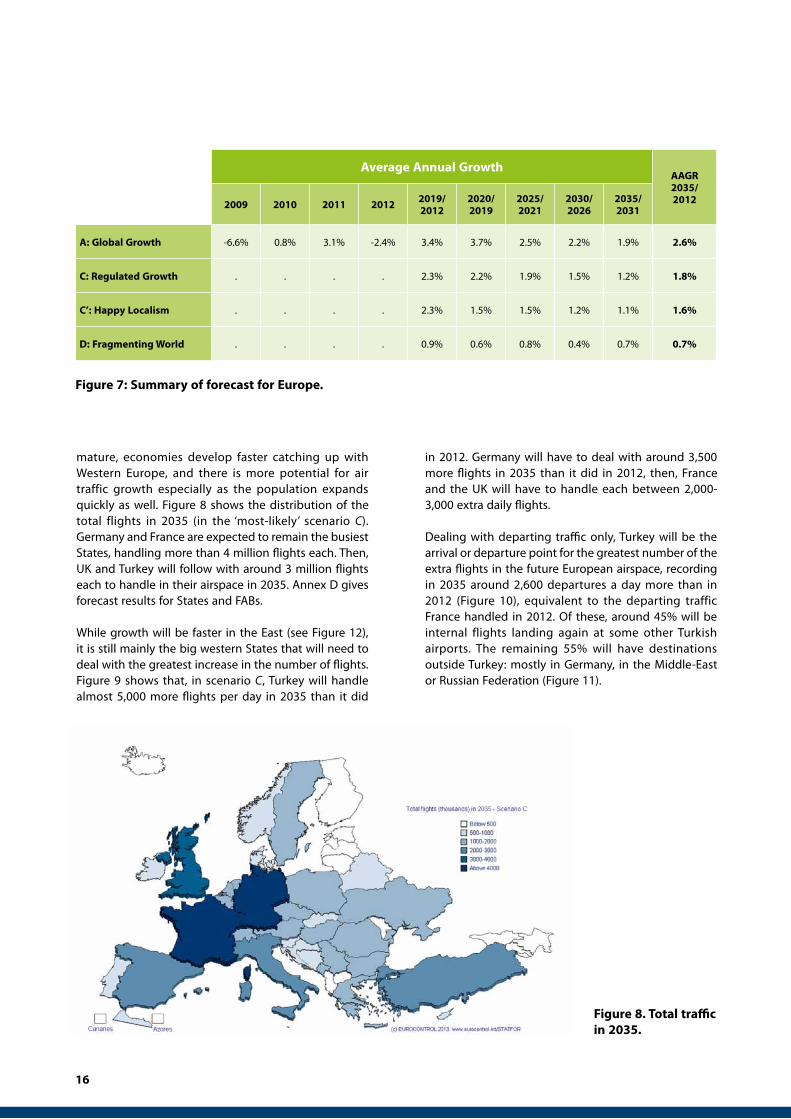
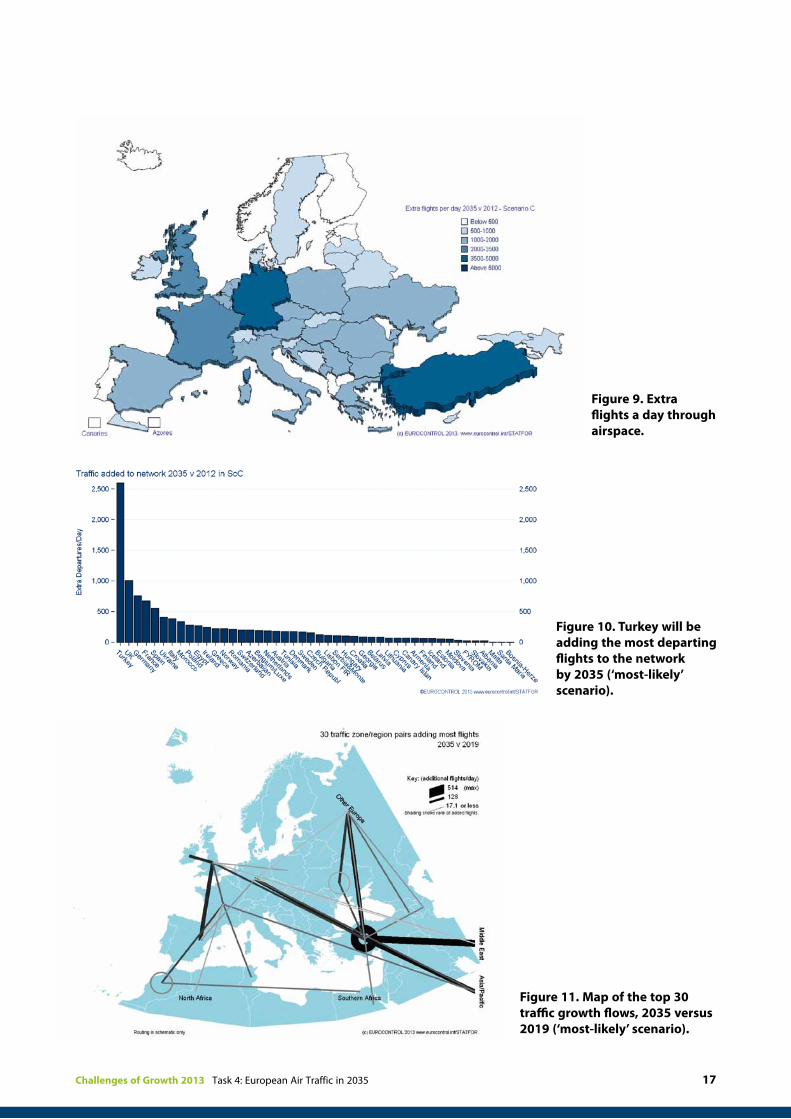
mature, economies develop faster catching up with Western Europe, and there is more potential for air traffic growth especially as the population expands quickly as well. Figure 8 shows the distribution of the total flights in 2035 (in the ‘most-likely’ scenario C). Germany and France are expected to remain the busiest States, handling more than 4 million flights each. Then, UK and Turkey will follow with around 3 million flights each to handle in their airspace in 2035. Annex D gives forecast results for States and FABs.
While growth will be faster in the East (see Figure 12), it is still mainly the big western States that will need to deal with the greatest increase in the number of flights. Figure 9 shows that, in scenario C, Turkey will handle almost 5,000 more flights per day in 2035 than it did
in 2012. Germany will have to deal with around 3,500 more flights in 2035 than it did in 2012, then, France and the UK will have to handle each between 2,000-3,000 extra daily flights.
Dealing with departing traffic only, Turkey will be the arrival or departure point for the greatest number of the extra flights in the future European airspace, recording in 2035 around 2,600 departures a day more than in 2012 (Figure 10), equivalent to the departing traffic France handled in 2012. Of these, around 45% will be internal flights landing again at some other Turkish airports. The remaining 55% will have destinations outside Turkey: mostly in Germany, in the Middle-East or Russian Federation (Figure 11).
Figure 7: Summary of forecast for Europe.
Average Annual GrowthAAGR 2035/ 20122009 2010 2011 2012 2019/
20122020/2019
2025/2021
2030/2026
2035/2031
A: Global Growth -6.6% 0.8% 3.1% -2.4% 3.4% 3.7% 2.5% 2.2% 1.9% 2.6%
C: Regulated Growth . . . . 2.3% 2.2% 1.9% 1.5% 1.2% 1.8%
C’: Happy Localism . . . . 2.3% 1.5% 1.5% 1.2% 1.1% 1.6%
D: Fragmenting World . . . . 0.9% 0.6% 0.8% 0.4% 0.7% 0.7%
Figure 8. Total traffic in 2035.
Challenges of Growth 2013 Task 4: European Air Traffic in 2035 17
Figure 9. Extra flights a day through airspace.
Figure 10. Turkey will be adding the most departing flights to the network by 2035 (‘most-likely’ scenario).
Figure 11. Map of the top 30 traffic growth flows, 2035 versus 2019 (‘most-likely’ scenario).

18
The split between the different flows (domestic flights, international arrivals and departures, and overflights) in the airspace varies in each State, one of the most obvious reasons being the geographical size of the State.
For ESRA, intra-European flights currently account for slightly less than 80% of the total traffic arrivals and departures for around 20% and the share of overflights is negligible (see Figure 35 in Annex C). A general trend observed in this forecast is the decline of the share of intra-European flights by 2035 (and consequently the increase of the share of international arrivals/departures). One of the reasons for that is the less rapid growth of the domestic markets, mainly in North West and Mediterranean Europe, already observed in the last 5 years and expected to last as these markets become more and more mature.
In the fastest growing scenario (scenario A), the share of internal flights is expected to decrease to two-thirds of the total traffic. This scenario favours long-haul traffic to the short-haul one. It counts on the development of the Middle-East hubbing pushing connecting traffic outside Europe (though in Turkey). The expected average growth rate of the internal flows is just below 2% per year over the twenty years.
In the most-likely scenario (scenario C), the share of the internal flights will decrease by 10 p.p to 70%. This scenario is for a fast EU enlargement, bringing some economic benefits to joining states earlier than in scenario A, and for increasing hubbing rates in Europe which explain the larger share than in previous scenario. However, the growth of the intra-European traffic over the next twenty years will be significantly lower (1.3% annually) especially when compared to the international traffic from and to outside Europe (3.2% annually) accounting for 28% of the total traffic by 2035. The traffic flying over European airspace will
grow at even faster rates (4.4%) though it will represent only 2% of the total traffic. Within Europe, the growth of the different flow (internals, arrivals/departures and overflights) in each State will evolve in a different ways as summarised in Figure 12.
Scenario C’ is a variation of the most-likely scenario weakening the dependence of Europe on outside world. It expects a shift of some of the tourist traffic to Europe destination rather than outside Europe, less long-haul traffic connecting inside Europe, limited free trade with extra-European partners. This results in a lower average annual growth rate for international arrivals/departures (2.8%) than in scenario C.
Scenario D expresses the greater tensions in the world, inside and outside Europe (no migration, no free trade agreements, postponed EU enlargement…). If this scenario shows similar distribution of traffic flows than in scenarios C and C’ (roughly 70% internal, 28% arrivals/departures and 2% overflights), the development of internal traffic in Europe by 2035 is almost flat (0.3%) while the growth rate of international traffic averages at 1.8%.
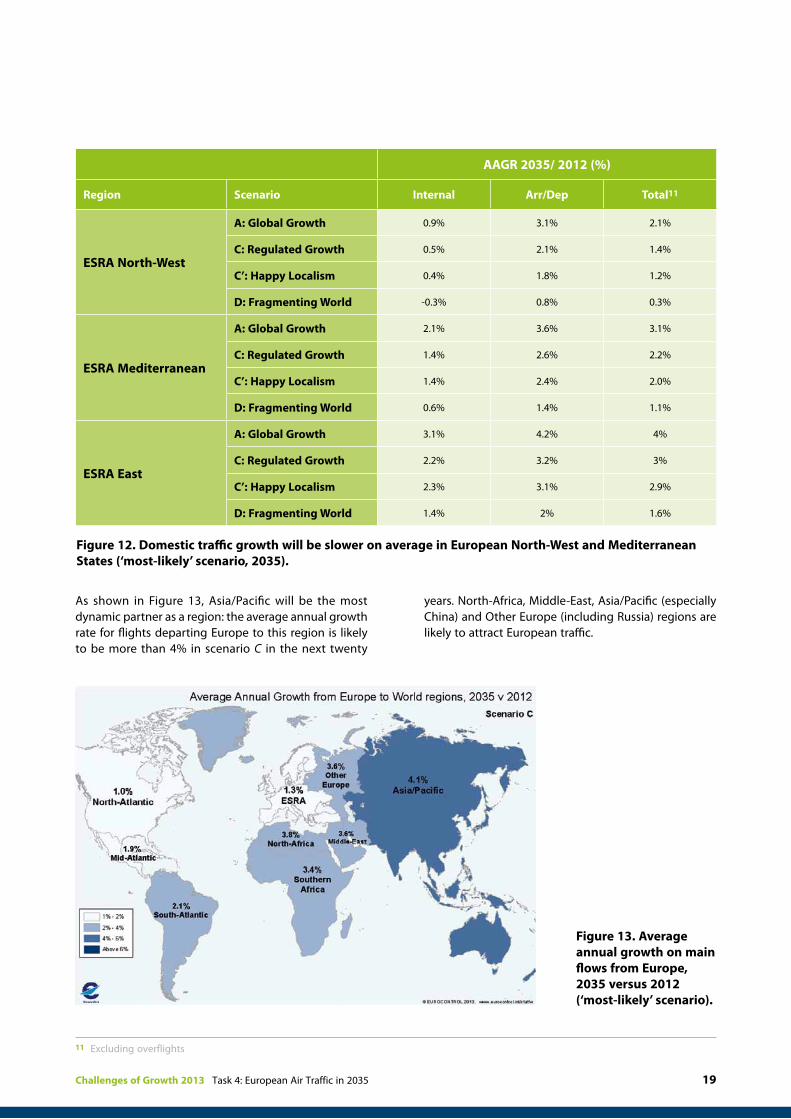
In many of the ESRA North-West and Mediterranean States (e.g. Germany, the UK, France, Italy), domestic traffic has not grown for some years. This trend will continue within the next 20 years in the most-likely scenario; with intra-European traffic to show growth rates slowing down to an average of 0.5% per year for ESRA North-West and 1.4% per year for ESRA Mediterranean. However, ESRA Eastern States will see faster growth rates averaging at 2.2% per year in scenario C: as explained, the potential for traffic development is higher in this part of Europe. As far as the arrivals/departures flows are concerned, ESRA East and ESRA Mediterranean markets will show higher growth rates (2.6%-3% per year) than North Western States (below 1.5% per year) in 2035, scenario C.
Challenges of Growth 2013 Task 4: European Air Traffic in 2035 19
As shown in Figure 13, Asia/Pacific will be the most dynamic partner as a region: the average annual growth rate for flights departing Europe to this region is likely to be more than 4% in scenario C in the next twenty
years. North-Africa, Middle-East, Asia/Pacific (especially China) and Other Europe (including Russia) regions are likely to attract European traffic.
11 Excluding overflights
AAGR 2035/ 2012 (%)
Region Scenario Internal Arr/Dep Total11
ESRA North-West
A: Global Growth 0.9% 3.1% 2.1%
C: Regulated Growth 0.5% 2.1% 1.4%
C’: Happy Localism 0.4% 1.8% 1.2%
D: Fragmenting World -0.3% 0.8% 0.3%
ESRA Mediterranean
A: Global Growth 2.1% 3.6% 3.1%
C: Regulated Growth 1.4% 2.6% 2.2%
C’: Happy Localism 1.4% 2.4% 2.0%
D: Fragmenting World 0.6% 1.4% 1.1%
ESRA East
A: Global Growth 3.1% 4.2% 4%
C: Regulated Growth 2.2% 3.2% 3%
C’: Happy Localism 2.3% 3.1% 2.9%
D: Fragmenting World 1.4% 2% 1.6%
Figure 12. Domestic traffic growth will be slower on average in European North-West and Mediterranean States (‘most-likely’ scenario, 2035).
Figure 13. Average annual growth on main flows from Europe, 2035 versus 2012 (‘most-likely’ scenario).
20
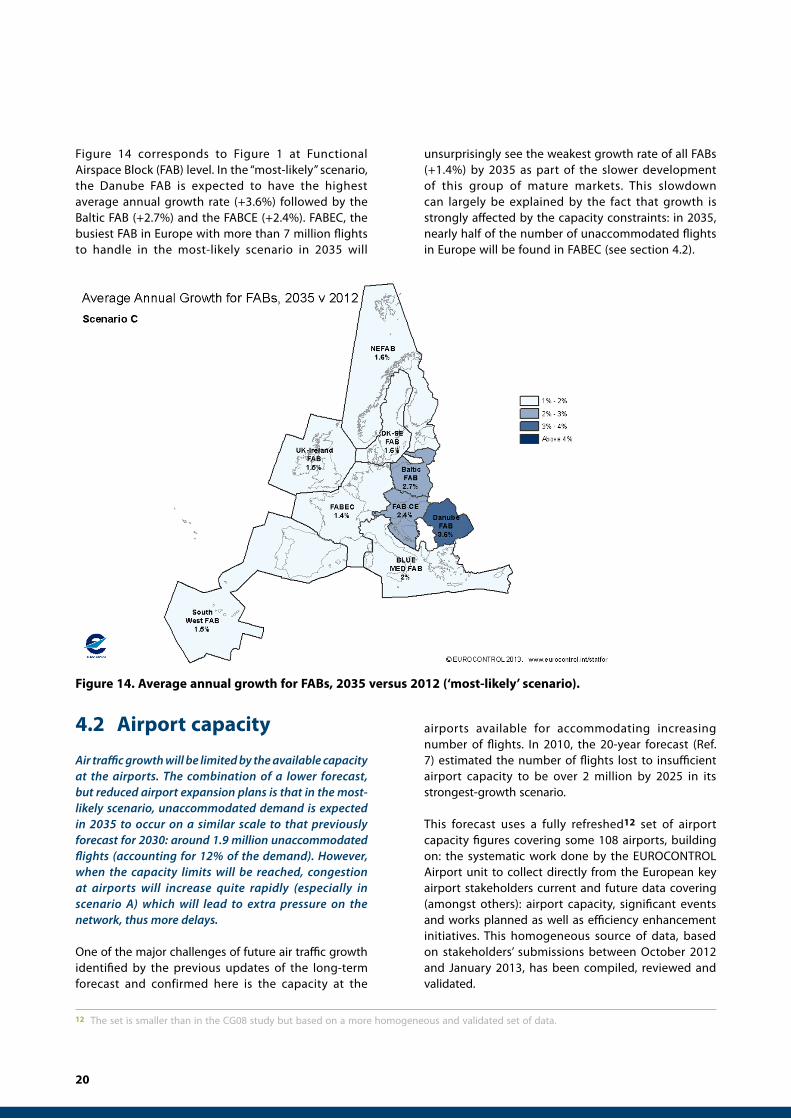
Figure 14 corresponds to Figure 1 at Functional Airspace Block (FAB) level. In the “most-likely” scenario, the Danube FAB is expected to have the highest average annual growth rate (+3.6%) followed by the Baltic FAB (+2.7%) and the FABCE (+2.4%). FABEC, the busiest FAB in Europe with more than 7 million flights to handle in the most-likely scenario in 2035 will
unsurprisingly see the weakest growth rate of all FABs (+1.4%) by 2035 as part of the slower development of this group of mature markets. This slowdown can largely be explained by the fact that growth is strongly affected by the capacity constraints: in 2035, nearly half of the number of unaccommodated flights in Europe will be found in FABEC (see section 4.2).
Figure 14. Average annual growth for FABs, 2035 versus 2012 (‘most-likely’ scenario).
4.2 Airport capacity
Air traffic growth will be limited by the available capacity at the airports. The combination of a lower forecast, but reduced airport expansion plans is that in the most-likely scenario, unaccommodated demand is expected in 2035 to occur on a similar scale to that previously forecast for 2030: around 1.9 million unaccommodated flights (accounting for 12% of the demand). However, when the capacity limits will be reached, congestion at airports will increase quite rapidly (especially in scenario A) which will lead to extra pressure on the network, thus more delays.
One of the major challenges of future air traffic growth identified by the previous updates of the long-term forecast and confirmed here is the capacity at the
airports available for accommodating increasing number of flights. In 2010, the 20-year forecast (Ref. 7) estimated the number of flights lost to insufficient airport capacity to be over 2 million by 2025 in its strongest-growth scenario.
This forecast uses a fully refreshed12 set of airport capacity figures covering some 108 airports, building on: the systematic work done by the EUROCONTROL Airport unit to collect directly from the European key airport stakeholders current and future data covering (amongst others): airport capacity, significant events and works planned as well as efficiency enhancement initiatives. This homogeneous source of data, based on stakeholders’ submissions between October 2012 and January 2013, has been compiled, reviewed and validated.
12 The set is smaller than in the CG08 study but based on a more homogeneous and validated set of data.

Challenges of Growth 2013 Task 4: European Air Traffic in 2035 21
Where information for some key airports was not available, additional data received from STATFOR User Group members (especially the Navigation Service Providers) helped completing the above mentioned sample.
The current sample of actual and future capacity data covers traffic at European airports representing 83% of the 2012 of all European flights in 2012, 8.1 million flights in total, either departed from or arrived at one of these airports. Over the next 20 years, the capacity14 of the system is expected to increase by 17%, not evenly distributed across the 108 airports. This is a lower percentage of capacity expansion compared to the LTF10 figure which was 40% (over 155 airports). The comparison of the unaccommodated demand with the previous forecast is made difficult as the set of airports with future capacity limits has been fully revisited aiming at being more reliable. Moreover, in the tough economic context: the lack of revenue, the difficulty in obtaining finance and the growing resistance to transport infrastructure projects (e.g. noise, see sections 5.2 and 5.3), some airports reconsidered their plans. Out of the 13 airports which contributed significantly to the capacity growth in LTF10, 12 have cut back their expansion plans.
Along with these difficulties in implementing capacity plans, the decline in traffic experienced in 2009-2012 and into 2013 has lifted the pressure on airport
capacity, giving the system some extra years to react and adapt. With a slower than expected recovery of growth and a return to previous 2008 record flight-counts now delayed to 2016, it may seem that airport congestion is less of a problem for the next few years. It is, indeed, recognised also by the 7-year forecast published in February 2013 (Ref. 5) which estimates the number of unaccommodated flights in 2019 to be only around 0.14 million departures, 1.2% of the expected ‘unconstrained’ demand in the most-likely (base) scenario. But, as Figure 15 illustrates, in the longer-term the demand will grow, the number of movements at European airports will increase, and the airports will be busy and not always able to fully respond.
The reduction in traffic is in fact also responsible for the future difficulties for airports to respond to the lack of capacity. In the tough economic environment, air industry operators remain under pressure: fewer flights means less revenue at airports, thus fewer possibilities to finance future expansion plans.
The impact of capacity limits on the network are estimated in Figure 16:
n In the most-likely scenario C: Regulated Growth, around 1.9 million flights will be lost, approximately 12% of demand in 2035. This is less than in LTF10 in terms of flights, about the same in percentage terms, mainly because of overall lower forecast
Figure 15. Demand (‘unconstrained’13) exceeds capacity of airports.
13 When we refer to demand throughout this report we always mean ‘unconstrained’ demand, i.e. demand ‘not constrained’ by airport capacity which is essentially a supply-side limit.
14 The capacity limits at airport are not varied by scenario.

22
levels compared to three years ago (see section 4.6 for a discussion of results in the two forecasts). The unaccommodated demand of 2 million flights previously expected to be lost in 2030 in the LTF10 will now only happen five years later. The recent drop in traffic has given the system five extra years to react.
n In the fastest growing scenario A: Global Growth, the LTF13 estimates around 4.4 million flights to be lost due to airport capacity shortfall in 2035, corresponding to 20% of the unconstrained demand. The corresponding congestion levels are also delayed compared to the previous forecast, but as in the previous forecast, once the limits are reached, the congestion spreads and the number of unaccommodated flights grow quickly (almost doubling between 2030 and 2035).
n Scenario C’ and D, as a result of slower traffic growth rates, will reduce the demand at airports compared to the other scenarios. In 2035, the system will only be unable to accept the demand for 1 million flights in scenario C’ and 0.2 million in scenario D.
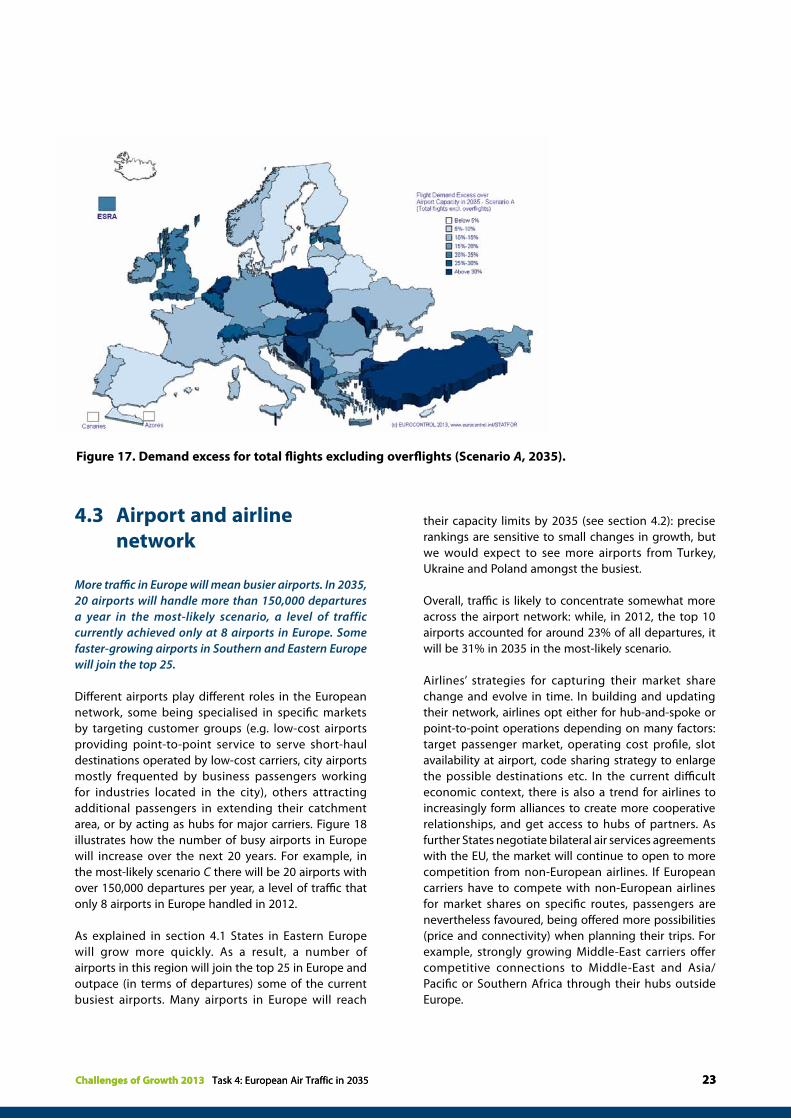
The mismatch between capacity and demand is not the same across Europe. There are regions where the shortfall is likely to be bigger: Turkey will be the most penalised facing almost 30% excess of demand for arrivals and departures at their airports in the most-likely scenario C by 2035. Other States located mostly
in Eastern Europe, like Bulgaria, Hungary, Romania will have around 17%-22% (each) excess of demand not accommodated by 2035 in the scenario C (Figure 17).
Two further tasks of Challenges of Growth 2013 study investigate the impact of lack of airport capacity:
n Network congestion (Ref. 3) quantifies the network impact of operating highly congested airports.
n Mitigation (Ref. 2) examines some of the potential solutions to lack of capacity.
Of course, the airport capacities used here are not the final word on what capacity will be available in 2035: new projects may be launched, operations can be further optimised to squeeze more out of existing infrastructure, and more investments may be secured. Yet, at the same time, projects currently foreseen may be delayed, reduced in scope or even cancelled. Comparing data from the 2008 Challenges of Growth and now provides plenty of examples of plans being extended, or being scaled back.
Therefore the figures cited in this section should only be an indication of the expected trends, they are likely to change as airports develop and adapt to the increasing demand. Nevertheless, this section reiterates and reconfirms the airport capacity challenge identified by the previous studies (Challenges of Growth publications15 since 2001).
Unaccommodated IFRFlights (million) Unaccommodated demand (%)
2020 2025 2030 2035 2020 2025 2030 2035
A: Global Growth 0.4 1.3 2.3 4.4 3% 8% 13% 20%
C: Regulated Growth 0.2 0.5 1.2 1.9 1% 4% 8% 12%
C’: Happy Localism 0.1 0.3 0.6 1.0 1% 2% 5% 7%
D: Fragmenting World 0.0 0.1 0.1 0.2 0% 1% 1% 2%
Figure 16. In the most-likely scenario, almost 2 million flights will be lost to airport capacity constraints.Unit: reduction in total flights (excluding overflights) when airport constraints are taken into account
15 http://www.eurocontrol.int/articles/challenges-growth
Challenges of Growth 2013 Task 4: European Air Traffic in 2035 23Challenges of Growth 2013 Task 4: European Air Traffic in 2035 23
4.3 Airport and airline network
More traffic in Europe will mean busier airports. In 2035, 20 airports will handle more than 150,000 departures a year in the most-likely scenario, a level of traffic currently achieved only at 8 airports in Europe. Some faster-growing airports in Southern and Eastern Europe will join the top 25.
Different airports play different roles in the European network, some being specialised in specific markets by targeting customer groups (e.g. low-cost airports providing point-to-point service to serve short-haul destinations operated by low-cost carriers, city airports mostly frequented by business passengers working for industries located in the city), others attracting additional passengers in extending their catchment area, or by acting as hubs for major carriers. Figure 18 illustrates how the number of busy airports in Europe will increase over the next 20 years. For example, in the most-likely scenario C there will be 20 airports with over 150,000 departures per year, a level of traffic that only 8 airports in Europe handled in 2012.
As explained in section 4.1 States in Eastern Europe will grow more quickly. As a result, a number of airports in this region will join the top 25 in Europe and outpace (in terms of departures) some of the current busiest airports. Many airports in Europe will reach
their capacity limits by 2035 (see section 4.2): precise rankings are sensitive to small changes in growth, but we would expect to see more airports from Turkey, Ukraine and Poland amongst the busiest.
Overall, traffic is likely to concentrate somewhat more across the airport network: while, in 2012, the top 10 airports accounted for around 23% of all departures, it will be 31% in 2035 in the most-likely scenario.
Airlines’ strategies for capturing their market share change and evolve in time. In building and updating their network, airlines opt either for hub-and-spoke or point-to-point operations depending on many factors: target passenger market, operating cost profile, slot availability at airport, code sharing strategy to enlarge the possible destinations etc. In the current difficult economic context, there is also a trend for airlines to increasingly form alliances to create more cooperative relationships, and get access to hubs of partners. As further States negotiate bilateral air services agreements with the EU, the market will continue to open to more competition from non-European airlines. If European carriers have to compete with non-European airlines for market shares on specific routes, passengers are nevertheless favoured, being offered more possibilities (price and connectivity) when planning their trips. For example, strongly growing Middle-East carriers offer competitive connections to Middle-East and Asia/Pacific or Southern Africa through their hubs outside Europe.
Figure 17. Demand excess for total flights excluding overflights (Scenario A, 2035).

24
Figure 19 shows the effect16 of hubbing assumptions in the LTF on demand for departures from European airports (before constraining with airport capacities). Figure 20 shows the map of differences.
n Scenario C, most-likely, assumes the growing importance of Middle-East as well as European hubs (emphasis on Istanbul) over the next twenty years. This represents an additional 1.9% demand for departures when compared to the 2035 forecast having the same hubbing patterns as now.
n Scenario A assumes increasing share of Middle-East and Istanbul hubs but reduced hubbing
share everywhere else in Europe. Compared with a forecast with no specific hubbing assumption, the expected change in departures would be a reduction of 0.7% from European airports in 2035 since the passengers will more transfer outside Europe, though a little bit in Turkey.
n Scenario C’ favours more point-to-point traffic within Europe and gives importance to Middle-East hubs. This will represent a reduction of 1.7% of the demand for departures in 2035, compared to a 2035 forecast with similar hubbing situation as now. This the scenario with the highest number of flights “lost” out of the 3 scenarios.
Figure 18. More, larger European airports.Note: upper and lower bounds for the columns are ±50,000.
Change in flights(000s)
Difference in ‘unconstrained’ demand for flights (%)
2020 2025 2030 2035 2020 2025 2030 2035
A: Global Growth -8.8 -56.3 -108.5 -162.6 -0.1% -0.4% -0.6% -0.7%
C: Regulated Growth 17.0 108.1 210.5 318.0 0.1% 0.8% 1.4% 1.9%
C’: Happy Localism -13.7 -87.9 -173.6 -269.4 -0.1% -0.7% -1.2% -1.7%
Figure 19. Transfers of connecting flights from Europe to Middle-East hubs decreases demand for departures from Europe for scenarios A and C’.
16 This comparison estimates the percentage difference in demand between the unconstrained forecast with hubbing hypotheses (see Figure 4) and the unconstrained forecast without hubbing change. Scenario D is not shown as it does not involve any change in hubbing from now.
0
10
20
30
40
50
60
70
100
200
300
400
500
100
200
300
400
500
100
200
300
400
500
100
200
300
400
500
100
200
300
400
500
Actual-2012 ScA-2035 ScC’-2035ScC-2035 ScD-2035 Scenario
Deps (000s)
© EUROCONTROL 2013 www.eurocontrol.int/STATFOR
Number of Large Airports of each size
35
8
64
27
5 4 3
96
1
11
53
1
4950
44
6
2 1

Challenges of Growth 2013 Task 4: European Air Traffic in 2035 25
4.4 Travel distance and aircraft size
Passengers will travel more long-haul in 2035 than in 2019; the average distance per journey will increase by around 8% between 2019 and 2035 for European departures. The average distance per flight will change at the same rate. The fleet will evolve and the increasing demand for long-hauls will be served by more “large to very-large” aircraft offering greater seating capacity.
In the forecast, there are a number of factors weighing on the travel distances: new free trade and opens
skies agreements, new states joining the EU, changing hubbing and holiday destinations preferences, weakness of domestic flows etc. All of these factors, blended into the forecast method, have interlinked effects on the passenger demand.
Figure 21 illustrates the increasing length of journeys: in all four scenarios there will be relatively fewer trips below 900 miles (circa 1500km, short-haul) in 2035 than in 2019. More passengers will be flying to destinations over 900 miles. In result, the average distance per journey will increase by some 8% between 2019 and 2035, in scenario C.
Figure 18. More, larger European airports.Note: upper and lower bounds for the columns are ±50,000.
Figure 20. All scenarios (but ScD) count on bigger hubbing effect at Middle-East airports by 2035.Note: 9% corresponds to the percentage difference for lhr in ScC.
Figure 21. An increasing proportion of passengers travel long-haul, regardless of the scenario.

26
As for the passengers, the proportion of long-haul flights will slightly increase in all scenarios. People will on average travel farther and the average distance per flight will increase in parallel. Figure 22 suggests that all scenarios will see an increase in proportion of medium- and long-haul flights between 2019 and 2035. As a consequence, the proportion of short-haul flights will shrink accordingly. In numbers, the average distance per departing flight will increase by some 7% between 2019 and 2035, in the most-likely scenario.
Between 2019 and 2035, the flights will not be flown by the same aircraft; in particular long-haul flights will be operated by larger aircraft to serve the higher numbers of passengers travelling long-distance.
The fleet in Europe develops. Airlines focus on the most efficient and economical utilisation of their aircraft; they can opt between increasing frequencies
or size of aircraft to offer more seating capacity, they balance their fixed and operating costs and plan their fleet renewal accordingly. Manufacturers compete in capturing the market and offer new types of aircraft on both ends of the size-spectrum with better fuel-efficiency and emission parameters.
Figure 23 shows how the average aircraft size changes in the LTF13 scenarios. In all four scenarios, long-haul flights are served with bigger aircraft. The most-likely scenario the average will offer on average around 1.3%17 more seating capacity per flight each year18. Larger aircraft are used for short-haul flights in the environmental scenario C: Regulated Growth.
The technological and steady economic growth in scenario A: Global Growth also captures more passengers on short-haul by offering higher seating capacities.
17 1.0%-1.3%18 These would mainly correspond to very large jets Airbus380 or Boeing 747 derivatives.
Figure 22. Proportion of long-haul flights will increase by 2035 (versus 2019) in all scenarios.
Average annual change in aircraft size (seats/flight)
1-300 Miles 301-600M 601-900M 901-1200M Over 1200M Total
A: Global Growth 1.1% 0.8% 0.6% 0.5% 1.3% 1.2%
C: Regulated Growth 1.3% 1.1% 0.9% 0.8% 1.3% 1.3%
C’: Happy Localism 0.1% 0.9% 0.6% 0.5% 1.6% 1.0%
D: Fragmenting World 0.4% 1.2% 0.8% 0.7% 1.7% 1.1%
Figure 23. Aircraft size increases faster for long-haul.

Challenges of Growth 2013 Task 4: European Air Traffic in 2035 27
4.5 High-speed train
High-speed train both competes with and complements short-haul passenger air transport. Over 50 city-pairs will be connected by new or improved links between 2019 and 2035. Passengers opting for rail will reduce the demand for flights by a little over 0.5% in 2035, often easing the pressure at congested airports rather than reducing the number of operated flights.
One of the major competitors of short-haul air transport is high-speed train (HST). Operating at high speeds, the train can offer comparable transport times for distances up to 800km (Ref. 10). It can also successfully attract passengers by providing in some cases a lower risk of delay, less security hassle, shorter distance to the city centre. HST can sometimes also be perceived as more comfortable (new trains) and more ‘green’ means of transport and possibly other aspects depending on personal preferences of travellers (loyalty programmes). There are cases of ‘comodality’ where HST provides feeder services to air travel, but in this analysis our focus is on the reduction in short-haul flights that results from this.
The LTF focuses on the speed of air travel over rail transport as the major factor for capturing the share in
the market. The high-speed rail network continuously develops, new links are built, new connections added and connecting times improved. The LTF13 considers improvements on over 50 city-pairs from projects19 being finished between 2019 and 2035. These are schematically pictured in blue in Figure 26.
Due to more passengers opting for high-speed train instead of travelling by air, the ‘unconstrained’ demand for flights (in principal short-haul) will be reduced by somewhat of 0.6% overall in total Europe by 2035 in the most-likely scenario. The HST network does not develop in all parts of Europe to the same extent. Even if the HST network are cross border, the States with more projects in the pipeline are likely to see stronger reduction in demand for flights by 2035 (Figure 25), such as France and Spain ( 2.5% each) or Sweden (-3%).
The reduction in demand for flights does not directly translate in a reduction of operated flights. Increasingly, the high-speed train connects the major urban areas and notably where the airports are highly congested. This could result in easing the pressure on airports, freeing some capacity at strategic bottlenecks within the network, thus reducing the level of unaccommodated flights.
19 TEN-T priority projects, Alpine tunnel, LGV Sud Europe Mediterranee links, etc. This figure excludes city-pairs which are too close to have a viable air link (Brussels-Lille for example).
Reduction in ‘unconstrained’ demand for flights (%)
2020 2025 2030 2035
A: Global Growth -0.2% -0.5% -0.5% -0.6%
C: Regulated Growth 0.0% -0.4% -0.5% -0.6%
C’: Happy Localism -0.2% -0.5% -0.5% -0.6%
D: Fragmenting World . 0.0% -0.4% -0.4%
Reduction in ‘unconstrained’ demand for flights (%)
C: Regulated Growth
LTF13
2035
Denmark -0.8%
France -2.5%
Germany -0.5%
Italy -0.7%
Spain -2.5%
Sweden -3.0%
Switzerland -0.7%
UK -0.6%
Figure 24. Improved high-speed train connectivity reduces demand for flights.
Figure 25. Effect of improved HSTby State

28
A wider analysis of possible effects of offering high-speed train connections as an alternative to short-haul flights has been conducted in Ref. 2, an analysis using a much-extended hypothetical HST network.
4.6 Comparison with previous forecast
LTF13 has different growth in traffic compared the last long-term forecast prepared in 2010. Due to the economic downturn leading to slower traffic growth rates than expected, the LTF13 starting point is lower. After 2020, the baseline economic growth is also expected to be slower by around 0.5%. The LTF13 expects between 3.4 and 5.2 million fewer flights in 2030 than what was forecasted in 2010. The most challenging scenario of the current forecast (A: Global Growth) is slightly below the previous most-likely scenario (C: Regulated Growth), translating a severe downwards revision.
The last EUROCONTROL Long-Term Forecast was published in the end of 2010 (Ref. 7). It used the latest EUROCONTROL 7-year forecast (MTF10b) published in September 2010 as the baseline (Ref. 11) and it developed four scenarios for the future of air traffic up to 2030: A: Global Growth, C: Regulation & Growth, D: Fragmenting World and E: Limit Resources. Of these, scenarios A, C and D have been mostly re-used in the current LTF scenarios. A comparison of the LTF10 with the current forecast (LTF13) is presented in Figure 27. Scenario E, not represented in the LTF13, is excluded from the discussion below. However a short projection of the implications of such a scenario is given in section 4.7.
When comparing the two forecasts, all of the LTF13 scenarios have lower traffic in 2030 than the previous LTF10 most-likely scenario. The main reason is the much lower baseline traffic for the LTF13. The LTF10 was produced based on the MTF10b, a forecast showing average annual growth rates of traffic of around 3% (+/-1.2%).
Figure 26. High-speed rail network mostly develops in Western Europe20
20 In this simplified schematic view city-pairs are connected by direct lines instead of following the railroad network. The diagram does not show the whole network, only changes between 2012-2019 and 2019-2035.
Challenges of Growth 2013 Task 4: European Air Traffic in 2035 29
LTF10 was prepared just after the 2009 economic downturn. At the end of 2010, economists were expecting on an improvement of the economic situation, supported by the fact most European States had exited recession. A recovery in traffic was therefore predicted. This was partially confirmed in 2011, but the European economies weakened again in 2012, and other events affecting air industry (airline failures, Arab spring) led to a downwards revision of the traffic forecast over all.
This lower-than-previously21-expected economic growth in the short-term also had an impact on the medium- to long-term economic growth. The EU economic growth rates used in this forecast have been reduced by 0.5 p.p in the medium-term and by 0.8 p.p from 2025 compared to those used in the 2010 forecast.
In 2010, oil prices were fluctuating around $85 per barrel, well below the 2008 peaks ($145/barrel). Since then, oil prices have jumped again, painfully high to
around $110 during the first 4 months of 2013. This adds to the pressure on airline costs.
The current 20-year forecast has been prepared based on the most recent 7-year forecast published in February 2013 (Ref. 9). In the baseline, the average annual growth rate of traffic between 2012 and 2019 is 2.3% (+/-1.2%) which is lower than the LTF10 assumptions. The lower levels of traffic in 2035 are then related to a lower baseline and the slowdown in traffic growth rates.
Also having an impact on traffic development, this forecast relies on reduced capacity plans: while LTF10 was counting on the main airports reporting plans to expand by around 40% in 20 years, now they only report plans to grow by 17%. This difference weighs on traffic development.
Figure 27. All of the LTF13 scenarios have lower traffic in 2030 than the previous LTF10 most-likely scenario.
21 Pre-crisis, ie before 2009.

30
4.7 Risks
Users of the forecasts are strongly advised to use the forecast range (from scenario D to scenario A) as an indicator of risk. These four scenarios only cover a limited range of possibilities. Also, this flight forecast elaborates on a medium-term flight forecast prepared in the conditions of unstable economic situation with serious risk of further aggravation and downside effects on traffic development.
The main sources of uncertainty in the forecast are:
n The economic forecasts used here were updated in January 2013. The economic outlook remains uncertain and the return to growth has been delayed. Experience of recent years suggests that we could still see further downward revisions in growth, and further delay of the recovery. The low scenario provides some guidance here.
n More generally, future network changes (e.g. new routes) are not modeled by the forecast. The possible opening of Kosovo airspace is an up-side risk for some States, but a downside risk for others.
n Tourism trends are quite variable. The medium-term forecast aims to be accurate over the seven-year period, rather than identifying which will be the new holiday “destination of preference” in a given year. The recent political instability in both Egypt and Tunisia has led to more variability in tourism destinations.
n Oil prices remain changeable with oil being increasingly an item of speculation and investment. With fuel accounting for 25-35% or even more
of costs of the airlines, this can have an effect on fares and cost of travel for customer. As far as oil is concerned, some assumptions have been made to produce the forecast, but there are some risks to be considered, as much can change over the next twenty years. In particular in the LTF10, the scenario E: Resource Limits was assessing the quantitative effects on European traffic of a theoretical possibility of World oil production reaching its peak in 2020. If we were to explore the consequences of a same possibility on the most-likely scenario, we could expect a 10-year break in traffic growth between 2020 and 2030, meaning that there would be just over 12 million flights in Europe in 2035, representing a loss of 2.2 million flights compared to the scenario C. The annual growth rate over the period would average around 1% a much slower rate than the 1.8% expected in the most-likely scenario.
n Participation of aviation in the Emission Trading Scheme, currently under intense debate, was not integrated in the 7-year forecast22 but factored in into this forecast via assumptions on CO2 costs from 2020 onwards. However, such regulatory measures (eg. new tax regimes or further environmental limits) contribute to the uncertainty of air transport growth, can be introduced rapidly and change the local outlook for flight growth.
n Terrorist attacks, wars and natural disasters. The last seven years have not been quiet ones for aviation. There is no reason to believe the next seven years will be uneventful, with the effects of a further volcano eruption or an H1N1 flu pandemic being some of the risks. The impact on air traffic could be a temporary one, or more significant.
22 Predecessor of this 20-year forecast.

Challenges of Growth 2013 Task 4: European Air Traffic in 2035 31
The environmental impacts of aviation are both global (e.g. CO2 emissions from burning fuel) and local (e.g. noise and local air quality impacts). Moreover, there are often difficult trade-offs to be made between the various impacts. The Challenges of Growth 2008 Environment Technical Report presented a comprehensive overview of aviation’s environmental challenges and the main issues have not changed significantly since its publication (see Ref. 12).
Aviation industry stakeholders have long been working to reduce such environmental impacts, with notable results. Current average aircraft noise levels are around 20 dB lower than 40 years ago and within Europe average emissions of the greenhouse gas carbon dioxide (CO2) per passenger kilometre (pkm) have fallen from over 160 grams CO2 per passenger km in 1995 to under 120 grams CO2 per pkm in 2010, although to some extent such improvements have been offset by traffic growth (see Ref. 13, 14).
Operational and technological improvements and challenging political targets, will undoubtedly continue to reduce the relative environmental impact of aviation (see Ref. 27 and Annex E). However, even at the modest levels of growth forecast in scenario C, without an unforeseen step change, improvements in aircraft technology are unlikely to outstrip growth in the medium-term. Consequently, the overall environmental impact of aviation is likely to increase out until 2035, although it may be considerably mitigated.
5.1 Global Impacts
European aviation’s absolute CO2 emissions will continue to grow but at a slower rate than traffic. Emissions per passenger km may decrease by up to 2% per year if fuel efficiency and traffic forecasts evolve as expected.
In the LTF’s outward-looking scenarios C and A, the contribution of aviation to the European economy will increase as the world becomes ever more connected and international trade and tourism expand. However this will be mirrored by a growing necessity to ensure
that the aviation industry develops in a sustainable manner. Globally, CO2 emissions will become an increasing constraint, gaining in international political importance as the impacts of climate change are more widely experienced. In 2011 civil aviation accounted for around 3.5% of CO2 emissions in Europe (see Ref. 15). However, as other industries decarbonise, this proportion will increase, driving political pressure to reduce the sector’s emissions. Other factors such as resource use will also grow in importance leading to increasing focus on the ‘cradle to grave’ aircraft lifecycle (see Ref. 12 and16).
Current growth forecasts are substantially lower than historical trends, enabling the projected emissions gap to be reduced: lower demand will lead to a lesser increase in absolute emissions whilst facilitating fuel efficiency. In scenario C, currently considered the most-likely scenario, aviation’s environmental impacts are mitigated by a combination of technological and operational improvements. This is complemented by strong regulation which introduces more stringent standards and drives fuel efficiency whilst minimising the impact on passenger demand. Lower fuel costs are unlikely to decrease incentives to improve fuel efficiency due to the attendant reduction in operating costs and carbon dioxide emissions. Progress in the development of low-carbon alternative fuels is also expected to make a contribution to overall emissions reductions, although uncertainties remain as to the rate and scale of development (Ref. 17, 18 and Annex F).
This combination of operational, technological and regulatory measures will permit intra-European (SES) traffic to grow by around 25% whilst carbon dioxide emissions increase by considerably less. For flights arriving and departing from Europe, growth in emissions will be less than half of the forecast increase in traffic for 2035. Although absolute emissions will grow, emissions per passenger km will continue to fall. Assuming an annual fuel efficiency improvement of 1% from operational and technological improvements in combination with the trend towards larger aircraft and higher load factors, a 2% per annum decrease in CO2 emissions per pkm is not unrealistic. This is arguably high compared to recent forecasts which posit that similar international targets for fuel efficiency
5. enVIronmental ImPaCt
Technological and operational improvements will continue to reduce aviation’s relative environmental impact. However, even with moderate traffic growth, overall impacts will increase, although they may be considerably mitigated.

32
are not achievable without additional measures, and the need for such measures in Europe is certainly not negated (see Ref. 19). However, traffic growth in Europe is expected to be much slower than in other regions whilst uptake of new technologies should not be affected due to the need to reduce fuel costs and improve environmental performance. If such a trend were sustainable, it could see overall emissions per passenger km fall by almost 40% by 2035 (compared to 2013), although this is undoubtedly ambitious and would be highly dependent on achieving expected technological and operational improvements.
In scenario C’, the inward perspective which leads to more moderate growth and reduced expansion of long haul markets translates to a smaller increase in emissions and a greater reduction in emissions per aircraft movement. Growing environmental concerns will increase pressure for sustainable travel and promote the adoption of environmentally beneficial technologies. In scenario D, the reduction in intra-Europe traffic causes absolute emissions to decrease, although the continuing mitigation of aviation’s environmental impact will be dependent on achieving ongoing improvements in a politically and economically unstable environment.
Although it may be low by historical standards, scenario A’s average annual growth rate of 2.6% constitutes the LTF’s most challenging environmental scenario due to the larger increase in traffic. However, overall emissions increase at a slower rate as stronger growth drives technological improvements and fleet renewal, thus hastening the introduction of better performing aircraft. Consequently, whilst intra-European traffic may grow by up to 50%, emissions will increase by around a third and emissions per passenger km will have the potential to decrease by around 2% per year. However, achieving such technology-driven sustainability benefits will be challenging and will depend on investment and regulatory support in preceding years (see Ref. 18). Further, in higher growth scenarios, the pressure of traffic growth on already constrained capacity at many European airports may reduce performance and increase inefficiency (see Ref. 3). This may lead to increased fuel burn and emissions through, for example, increased holding or delayed departures.
By 2035, aviation’s non-CO2 climate impacts, such as contrail formation and en-route NOx emissions, are likely to be much better understood. In turn, this may lead to the introduction of technical, operational and regulatory measures to control and limit their
production. Eventual decisions will need to be made according to the available scientific evidence. This may involve trajectories that are not optimised for fuel use and thus trade-offs with CO2 production.
5.2 Local Impacts
Technological improvements will continue to reduce aircraft engine noise although may be offset by traffic growth and evolving public perception.
Noise, with its immediate and tangible effect on local communities will remain a key constraint in a moderate growth scenario. Advances in reducing aircraft engine noise can be expected as engine by-pass ratios continue to increase and older, noisier aircraft are phased out, although some of this benefit may be offset by the introduction of lower emission open rotor aircraft on regional routes.
Despite improvements in technology which will decrease the actual noise impact per flight, growth in air traffic demand may lead to an increase in populations affected by aircraft noise (Ref. 12). This may trigger more stringent regulatory measures, such as more restrictive noise abatement procedures and airport operational noise quotas and curfews, a further challenge to constrained capacity. However, this may be countered by more stringent noise certification limits which will drive technology development and fleet replacement. Such standards will continue to be revised as technology improves with potentially decreasing lengths of time between the introduction of new certification limits; 29 years passed between the implementation of Chapter 3 and Chapter 4 whereas the gap between implementation of Chapter 4 and its successor will be 11 years. There will also be an increased focus on ATM to mitigate impacts e.g. through operational measures which reduce noise or through noise distribution. Development of land-use planning, where control is dependent on local regulations, will also influence the extent of future population exposure to aircraft noise.
Currently demonstrated trends towards the onset of annoyance at lower levels of actual noise may be a bigger concern and may lead to increased opposition to airport expansion, in particular the construction of new runways (see Ref. 12 and 20). This may be exacerbated by the trend towards larger aircraft to accommodate increased demand on existing routes, particularly in scenarios A and C, as there will be a proportional increase in larger noise events. Moreover,

Challenges of Growth 2013 Task 4: European Air Traffic in 2035 33
with a shift towards high-speed trains between some city pairs, and the demand for intercontinental travel continuing to grow, some short-haul may be released to accommodate larger aircraft serving long-haul routes with a similar increase in noise impact per movement (see Ref. 12). Again, this is most likely in scenarios A and C.
The introduction of new-generation aircraft with reduced engine noise but requiring longer take-off runs at higher thrust due to their greater weight may also modify local noise patterns. As discussed in CG13 Task 8 (see Ref. 4), in the medium to long term the increased take-off runs and reduce climb rates which may be required as the climate changes and temperatures rise may also serve to modify ground noise contour shape and size. Such redistributions of noise impact may exacerbate the trend towards the onset of annoyance at lower levels of noise (see Ref. 21).
Growth in traffic may also lead to an increase in local air quality impacts, despite ongoing technological and operational improvements. Impact will vary with location, scale of operation and the relative contribution of other local sources. However, in areas where relative concentrations from other sources such as road transport are reduced, any increase in aviation’s impact will be more tangible. Trends in public opposition on the grounds of air quality and odour suggest that this may be a bigger constraint in future. If local air quality regulatory limits are exceeded, or more stringent limit values introduced, this may impose an environmental cap on capacity. For a more detailed discussion of air quality issues (see Annex 4 in Ref. 12).
5.3 Uneven Impacts
Evolution of environmental impacts is linked to changes in demand and thus will vary throughout Europe.
Just as the evolution of traffic growth will not be even throughout Europe, the evolution of environmental impacts will not be uniform (see Figure 1). To a large extent it does not matter where CO2 is emitted as its impact is a result of overall atmospheric accumulation, although this will of course impact national emissions inventories and airport carbon targets. However, of greater significance will be local impacts, particularly noise. High growth in traffic at a location may expose new populations to aircraft noise, potentially inciting new community opposition. This may be offset to some extent by increased employment opportunities and economic growth. However, resistance to infrastructure
expansion is a complex issue and some opposition may be intractable. In the medium to longer term, forecast demand evolution may also be altered by climate change impacts (see Ref. 4).
34
6. gloSSary
AAGR Average Annual Growth RateBRIC Brazil, Russia, India, ChinaCG08, CG13 Challenges of Growth 2008, 2013CONSAVE Constrained Scenarios on Aviation and Emissions programme Co-modality Efficient use of different transport modes on their own and in combinationConstrained Forecast constrained by capacity limits at major airports Demand Unconstrained demand (demand before constraining by airport capacity)ECAC European Civil Aviation ConferenceESRA, ESRA08 EUROCONTROL Statistical Reference Area (2008)EU European UnionETS Emission Trading SchemeFAB Functional Airspace BlockGAT General Air TrafficGDP Gross Domestic ProductHST high-speed trainIAG International Airline GroupICAO International Civil Aviation OrganisationIFR Instrument Flight RulesLTF Long-term forecast (20 years)MTF Medium-term forecast (7 years)pkm passenger kilometrep.p percentage pointsScA scenario A (similarly C, C’, D)SES Single European SkySESAR Single European Sky ATM ResearchSTATFOR Statistics and Forecast Service of EUROCONTROLSUG STATFOR User GroupTR Traffic Region (a grouping of TZs)TZ Traffic Zone (≈State, except for Spain, Portugal, Belgium and Luxembourg, Serbia and
MontenegroUnaccommodated demand The forecast flights that exceed an airport’s reported capacity.Unconstrained Forecast not constrained by capacity limits at major airports
Detailed explanations of the above terms and others are available in EUROCONTROL Glossary for Flight Statistics & Forecasts (Ref. 22).

Challenges of Growth 2013 Task 4: European Air Traffic in 2035 35
Long-term forecast model
The long-term forecast uses a model of economic and industry developments to grow airport-pair traffic that is forecast by the latest MTF further into the future. It addresses passenger, cargo, military GAT, business aviation and small airport-pairs’ traffic by specific sub-models and then combines the results to produce the final traffic forecast per State.
The long-term forecast method, like the medium-forecast method (MTF), uses a model of economic and industry developments to grow the baseline airport-pair traffic and produce a view of future flight movements. Each LTF is strictly linked to the latest available MTF whose final forecast year is used as the starting point of the LTF. This also means that the LTF model ignores any events that may happen between now and the final MTF year (starting year of the LTF) as these should be fully covered by the MTF. The LTF10 starts from the 2016 forecast of September 2010 update of the MTF (Ref. 11).
Figure 28 illustrates the LTF model and its sub-models which serve to produce forecasts of passenger, cargo, military GAT, business aviation and small airport-pairs flights and, after merging these, to provide the total flight forecast. Since passenger flights traditionally represent the greatest part of all IFR flights (around 85%
in 2009), the passenger traffic sub-model is the most detailed and is structured around five main groups of factors:
n Global economy factors represent the key economic developments driving the demand for air transport.
n Factors characterising the passengers and their travel preferences change patterns in travel demand and travel destinations.
n Price of tickets set by the airlines to cover their operating costs influences passengers’ travel decisions and their choice of transport.
n More hub-and-spoke or point-to-point network may alter the number of connections and flights needed to travel from origin to destination.
n Market structure describes the size of aircraft used to satisfy the passenger demand and converts the passenger numbers into flights.
Cargo, military GAT, business aviation and small airport-pairs flights’ sub-models are less sophisticated, relying more on historical evolution, sometimes in combination with economic developments.
Total forecast arrivals and departures are restricted by airport capacity before the flights are ‘flown’ through the airspace (assuming same routing as in the baseline year) and the final forecast of total flights per State is produced.
Figure 28. Overview of the long-term forecast model structureNote: environment-related factors shown in green.
Passengers
Demographics Open Skies
Alternatives toAir Transport
RoutesDestinations
Economy
GDP EUEnlargement
Free Trade
Economy
Price
OperatingCosts
Oil and fuel Security
FaresPassengers
MarketStructure
Market Structure
Airport CapacityAirportCapacity
FlightsForecast
BaselineRouting
Total TrafficForecast
PassengerForecast
NetworkChange Network
Cargo Forecast
GDPElasticity
EnvironmentalRegulation
Military GAT Forecast
Business Jets Forecast
Small Airport-Pairs Forecast
Base
line
Traffi
cfr
om M
TF
PriceElasticity
annex a foreCaSt method
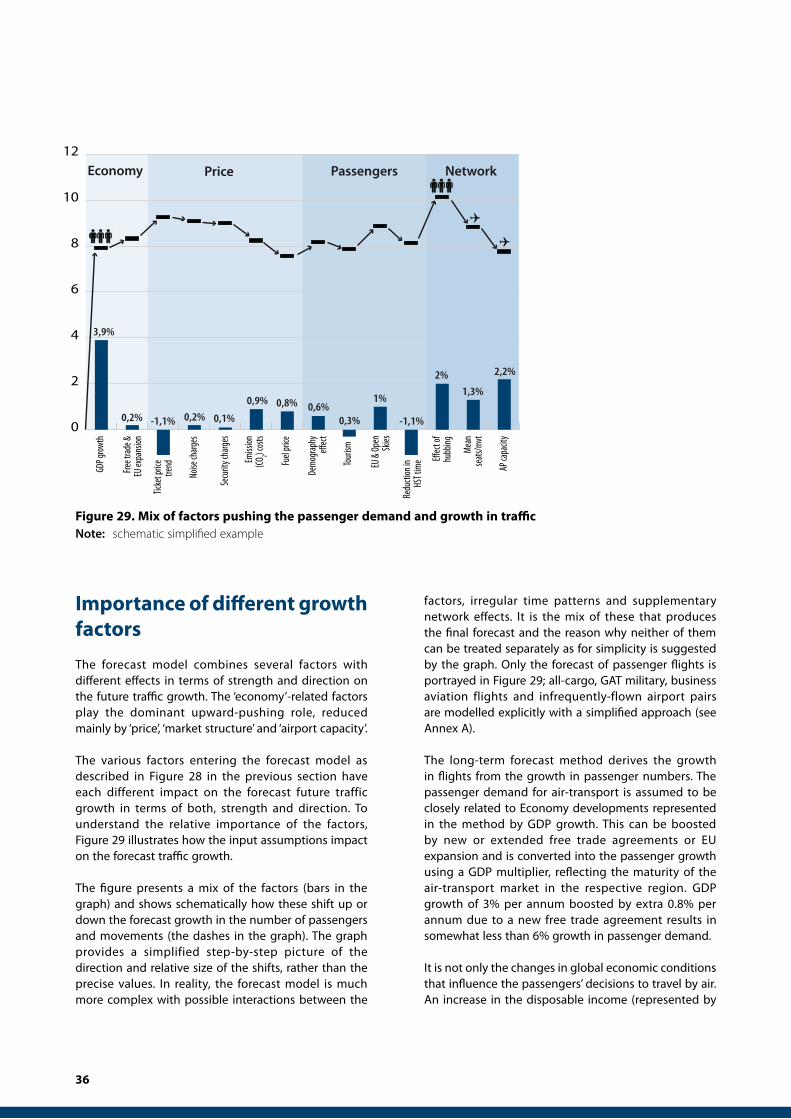
36
Importance of different growth factors
The forecast model combines several factors with different effects in terms of strength and direction on the future traffic growth. The ‘economy’-related factors play the dominant upward-pushing role, reduced mainly by ‘price’, ‘market structure’ and ‘airport capacity’.
The various factors entering the forecast model as described in Figure 28 in the previous section have each different impact on the forecast future traffic growth in terms of both, strength and direction. To understand the relative importance of the factors, Figure 29 illustrates how the input assumptions impact on the forecast traffic growth.
The figure presents a mix of the factors (bars in the graph) and shows schematically how these shift up or down the forecast growth in the number of passengers and movements (the dashes in the graph). The graph provides a simplified step-by-step picture of the direction and relative size of the shifts, rather than the precise values. In reality, the forecast model is much more complex with possible interactions between the
factors, irregular time patterns and supplementary network effects. It is the mix of these that produces the final forecast and the reason why neither of them can be treated separately as for simplicity is suggested by the graph. Only the forecast of passenger flights is portrayed in Figure 29; all-cargo, GAT military, business aviation flights and infrequently-flown airport pairs are modelled explicitly with a simplified approach (see Annex A).
The long-term forecast method derives the growth in flights from the growth in passenger numbers. The passenger demand for air-transport is assumed to be closely related to Economy developments represented in the method by GDP growth. This can be boosted by new or extended free trade agreements or EU expansion and is converted into the passenger growth using a GDP multiplier, reflecting the maturity of the air-transport market in the respective region. GDP growth of 3% per annum boosted by extra 0.8% per annum due to a new free trade agreement results in somewhat less than 6% growth in passenger demand.
It is not only the changes in global economic conditions that influence the passengers’ decisions to travel by air. An increase in the disposable income (represented by
3,9%
0
2
4
6
8
10
12
0,2% -1,1% 0,2% 0,1%
0,9% 0,8% 0,6%0,3%
1%
-1,1%
2%
1,3%
2,2%
GDP g
rowt
h
Free t
rade
&EU
expa
nsion
Noise
charg
es
Secu
rity c
harg
es
Emiss
ion(CO
2) cos
ts
Fuel
price
Dem
ogra
phy
effec
t
EU &
Ope
nSk
ies
Effec
t of
hubb
ing
Mean
seat
s/mvt
AP ca
pacit
y
Redu
ction
inHS
T tim
eTour
ism
Ticke
t pric
etre
nd
Q
Q
PriceEconomy Passengers Network
Figure 29. Mix of factors pushing the passenger demand and growth in traffic Note: schematic simplified example
Challenges of Growth 2013 Task 4: European Air Traffic in 2035 37
the GDP growth) and hence more money to spend on travel can be counterbalanced by equal or faster increase in Price of travel. There are several contributors to the evolution of fares: continuously decreasing trend in the air-ticket price is lifted by noise and security charges added to the cost, additional expenses of the airlines related to CO2 emissions and oil price are passed onto the customers by increased fares. Naturally, changes in prices have inverse effect on the demand (higher price => less demand) determined by the price elasticity.
A decision to take a plane is of course not a result of the mere possibility to do so (even though one may argue that the strong growth of low-cost carriers proves the opposite). Leisure and business Passengers decide where and how they want to travel. Aging of population as well as changing tourism preferences can reduce the flight demand in some regions, EU expansion or Open Skies agreements can facilitate
air-transport and encourage demand in others. Alternative means of transport such as high-speed rail may drag over some of the travellers if fast enough and providing comparable comfort. Travelling from one point to another may require taking several flights with a stronger hubbing system.
Demand in terms of number of passengers is converted into the number of flights using an assumption about the “Market Structure”, which is the structure of the fleet and use of aircraft. The expected increase in the mean size of aircraft coupled with increasing load factors reduces the growth, so the growth in fights is significantly less than in passenger numbers.
The airports’ ability to serve the flights is represented by the Airport Capacity figures. Though the overall capacity of the system increases, it may not always be at the right place, right time or simply enough to allow for the growth in traffic as demanded.
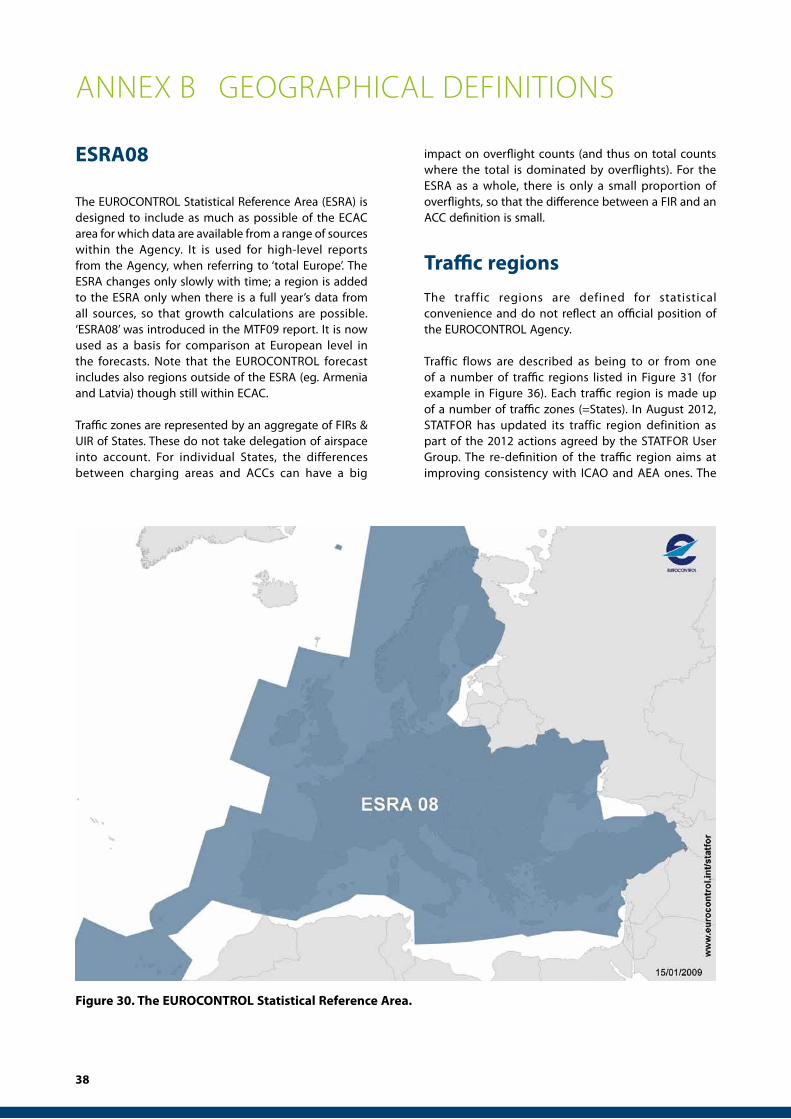
38
annex b geograPhICal defInItIonS
ESRA08
The EUROCONTROL Statistical Reference Area (ESRA) is designed to include as much as possible of the ECAC area for which data are available from a range of sources within the Agency. It is used for high-level reports from the Agency, when referring to ‘total Europe’. The ESRA changes only slowly with time; a region is added to the ESRA only when there is a full year’s data from all sources, so that growth calculations are possible. ‘ESRA08’ was introduced in the MTF09 report. It is now used as a basis for comparison at European level in the forecasts. Note that the EUROCONTROL forecast includes also regions outside of the ESRA (eg. Armenia and Latvia) though still within ECAC.
Traffic zones are represented by an aggregate of FIRs & UIR of States. These do not take delegation of airspace into account. For individual States, the differences between charging areas and ACCs can have a big
impact on overflight counts (and thus on total counts where the total is dominated by overflights). For the ESRA as a whole, there is only a small proportion of overflights, so that the difference between a FIR and an ACC definition is small.
Traffic regions
The traffic regions are defined for statistical convenience and do not reflect an official position of the EUROCONTROL Agency.
Traffic flows are described as being to or from one of a number of traffic regions listed in Figure 31 (for example in Figure 36). Each traffic region is made up of a number of traffic zones (=States). In August 2012, STATFOR has updated its traffic region definition as part of the 2012 actions agreed by the STATFOR User Group. The re-definition of the traffic region aims at improving consistency with ICAO and AEA ones. The
Figure 30. The EUROCONTROL Statistical Reference Area.

Challenges of Growth 2013 Task 4: European Air Traffic in 2035 39
new definition is listed in Figure 31. In Figure 31, traffic zones are indicated by the first letters of the ICAO location codes for brevity.
As far as “Europe” is concerned, it is split into two regions: ESRA (defined in the previous section) and Other Europe.
For flow purposes, ESRA is split into a “North-West” region mostly of mature air traffic markets, a
“Mediterranean” region stretching from the Canaries to Turkey and with a significant tourist element, and an Eastern region.
The ‘Other Europe’ region (i.e. non ESRA) includes the States along the border of ESRA and extends from Greenland to the Urals and Azerbaijan.
The map of the nine traffic regions used in our statistics is displayed in Figure 32.
ICAO region/country
ESRA North-West EB, ED, EF, EG, EH, EI, EK, EL, EN, ES, ET, LF, LN, LO, LS
ESRA Mediterranean GC, LC, LE, LG, LI, LM, LP, LT
ESRA East BK, EP, LA, LB, LD, LH, LJ, LK, LQ, LR, LU, LW, LY, LZ, UK
Other EuropeBG, BI, EE, EK (Faroe Islands), ENSB (Bodo Oc.), EV, EY, GE, LX, UB, UD, UG, UH, UI, UL, UM, UN, UO, UR, US, UU, UW, Shanwick Oc., Santa Maria FIR
North Atlantic C, K, P
Mid-Atlantic M, T
South-Atlantic S
North-Africa DA, DT, GM, HE, HL
Southern Africa D, F, G, H, (except DA, DT, HE, HL, GC, GM)
Middle-East L, O (except OA, OP)
Asia/Pacific A, N, P, Y, OA, OP, R, V, W, Z (except ZZZZ), U (except UK and areas in Other Europe)
Figure 31. Regions used in flow statistics as of 31 August 2012.
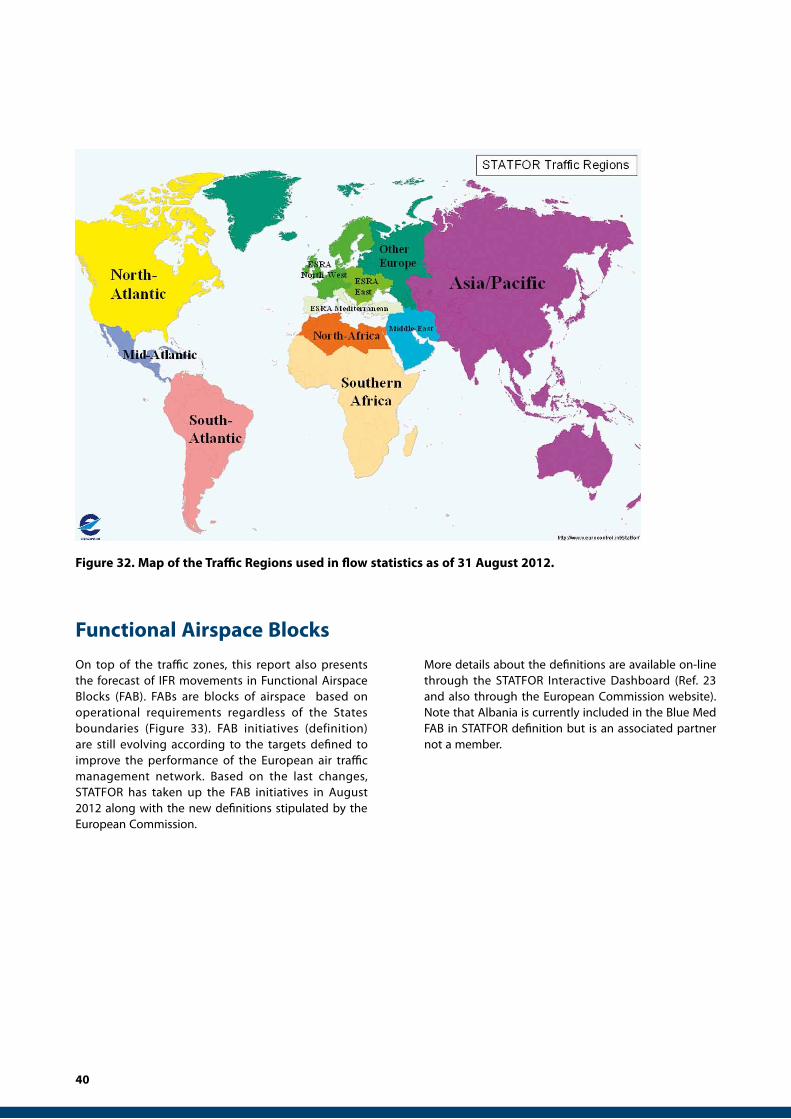
40
Functional Airspace Blocks
On top of the traffic zones, this report also presents the forecast of IFR movements in Functional Airspace Blocks (FAB). FABs are blocks of airspace based on operational requirements regardless of the States boundaries (Figure 33). FAB initiatives (definition) are still evolving according to the targets defined to improve the performance of the European air traffic management network. Based on the last changes, STATFOR has taken up the FAB initiatives in August 2012 along with the new definitions stipulated by the European Commission.
More details about the definitions are available on-line through the STATFOR Interactive Dashboard (Ref. 23 and also through the European Commission website). Note that Albania is currently included in the Blue Med FAB in STATFOR definition but is an associated partner not a member.
Figure 32. Map of the Traffic Regions used in flow statistics as of 31 August 2012.

Challenges of Growth 2013 Task 4: European Air Traffic in 2035 41
Figure 33. The nine FAB initiatives as of August 2012.

42
annex C Summary foreCaSt for eSra
Figure 34. Annual traffic in ESRA
IFR Movements(000s) Annual Growth AAGR 2035/ 2012
Traffic Mul-tiple
2035/ 20122009 2010 2011 2012 2019 2020 2025 2030 2035 2009 2010 2011 2012 2019 2020 2025 2030 2035
Total: Internal
ScA 7,602 7,562 7,790 7,514 9,091 9,359 10,208 10,934 11,510 . -0.5% 3.0% -3.5% 2.8% 2.9% 1.8% 1.4% 1.0% 1.9% 1.5
ScC . . . . 8,474 8,625 9,265 9,735 10,068 . . . . 1.7% 1.8% 1.4% 1.0% 0.7% 1.3% 1.3
ScC' . . . . 8,474 8,576 9,095 9,495 9,855 . . . . 1.7% 1.2% 1.2% 0.9% 0.7% 1.2% 1.3
ScD . . . . 7,710 7,733 7,918 7,947 8,102 . . . . 0.4% 0.3% 0.5% 0.1% 0.4% 0.3% 1.1
Total:Arr/Dep
ScA 1,711 1,815 1,883 1,916 2,760 2,921 3,660 4,461 5,366 . 6.1% 3.7% 1.7% 5.4% 5.8% 4.6% 4.0% 3.8% 4.6% 2.8
ScC . . . . 2,520 2,605 3,074 3,518 3,966 . . . . 4.0% 3.4% 3.4% 2.7% 2.4% 3.2% 2.1
ScC' . . . . 2,520 2,582 2,928 3,271 3,621 . . . . 4.0% 2.5% 2.5% 2.2% 2.1% 2.8% 1.9
ScD . . . . 2,261 2,295 2,506 2,684 2,911 . . . . 2.4% 1.5% 1.8% 1.4% 1.6% 1.8% 1.5
Total:Overflight
ScA 100 116 112 119 194 205 271 354 461 . 15% -3.4% 6.6% 7.2% 5.7% 5.8% 5.5% 5.4% 6.1% 3.9
ScC . . . . 175 182 222 267 321 . . . . 5.6% 4.0% 4.1% 3.8% 3.7% 4.4% 2.7
ScC' . . . . 175 180 213 249 292 . . . . 5.6% 3.3% 3.4% 3.1% 3.3% 4.0% 2.5
ScD . . . . 161 165 188 209 236 . . . . 4.4% 2.5% 2.6% 2.2% 2.4% 3.0% 2.0
Grand Total
ScA 9,413 9,493 9,784 9,548 12,045 12,485 14,139 15,749 17,338 . 0.8% 3.1% -2.4% 3.4% 3.7% 2.5% 2.2% 1.9% 2.6% 1.8
ScC . . . . 11,169 11,411 12,561 13,520 14,356 . . . . 2.3% 2.2% 1.9% 1.5% 1.2% 1.8% 1.5
ScC' . . . . 11,169 11,338 12,236 13,015 13,769 . . . . 2.3% 1.5% 1.5% 1.2% 1.1% 1.6% 1.4
ScD . . . . 10,132 10,194 10,612 10,840 11,249 . . . . 0.9% 0.6% 0.8% 0.4% 0.7% 0.7% 1.2
Figure 35. Annual traffic and growth by main flow categories in ESRA

Challenges of Growth 2013 Task 4: European Air Traffic in 2035 43
IFR Movements(000s) Annual Growth AAGR 2035/ 2012
Traffic Mul-tiple
2035/ 20122009 2010 2011 2012 2019 2020 2025 2030 2035 2009 2010 2011 2012 2019 2020 2025 2030 2035
Total: Internal
ScA 7,602 7,562 7,790 7,514 9,091 9,359 10,208 10,934 11,510 . -0.5% 3.0% -3.5% 2.8% 2.9% 1.8% 1.4% 1.0% 1.9% 1.5
ScC . . . . 8,474 8,625 9,265 9,735 10,068 . . . . 1.7% 1.8% 1.4% 1.0% 0.7% 1.3% 1.3
ScC' . . . . 8,474 8,576 9,095 9,495 9,855 . . . . 1.7% 1.2% 1.2% 0.9% 0.7% 1.2% 1.3
ScD . . . . 7,710 7,733 7,918 7,947 8,102 . . . . 0.4% 0.3% 0.5% 0.1% 0.4% 0.3% 1.1
Total:Arr/Dep
ScA 1,711 1,815 1,883 1,916 2,760 2,921 3,660 4,461 5,366 . 6.1% 3.7% 1.7% 5.4% 5.8% 4.6% 4.0% 3.8% 4.6% 2.8
ScC . . . . 2,520 2,605 3,074 3,518 3,966 . . . . 4.0% 3.4% 3.4% 2.7% 2.4% 3.2% 2.1
ScC' . . . . 2,520 2,582 2,928 3,271 3,621 . . . . 4.0% 2.5% 2.5% 2.2% 2.1% 2.8% 1.9
ScD . . . . 2,261 2,295 2,506 2,684 2,911 . . . . 2.4% 1.5% 1.8% 1.4% 1.6% 1.8% 1.5
Total:Overflight
ScA 100 116 112 119 194 205 271 354 461 . 15% -3.4% 6.6% 7.2% 5.7% 5.8% 5.5% 5.4% 6.1% 3.9
ScC . . . . 175 182 222 267 321 . . . . 5.6% 4.0% 4.1% 3.8% 3.7% 4.4% 2.7
ScC' . . . . 175 180 213 249 292 . . . . 5.6% 3.3% 3.4% 3.1% 3.3% 4.0% 2.5
ScD . . . . 161 165 188 209 236 . . . . 4.4% 2.5% 2.6% 2.2% 2.4% 3.0% 2.0
Grand Total
ScA 9,413 9,493 9,784 9,548 12,045 12,485 14,139 15,749 17,338 . 0.8% 3.1% -2.4% 3.4% 3.7% 2.5% 2.2% 1.9% 2.6% 1.8
ScC . . . . 11,169 11,411 12,561 13,520 14,356 . . . . 2.3% 2.2% 1.9% 1.5% 1.2% 1.8% 1.5
ScC' . . . . 11,169 11,338 12,236 13,015 13,769 . . . . 2.3% 1.5% 1.5% 1.2% 1.1% 1.6% 1.4
ScD . . . . 10,132 10,194 10,612 10,840 11,249 . . . . 0.9% 0.6% 0.8% 0.4% 0.7% 0.7% 1.2
IFR Movements(000s)
2005 2006 2007 2008 2009 2010 2011 2012 2019 2020 2025 2030 2035
1ESRA North-W
ESRA North-W
ScA 3878.2 3934.1 3995.6 3973.1 3665.3 3573.2 3679.4 3581.4 3978.7 4072.9 4192.9 4307.5 4358.4
ScC . . . . . . . . 3798.1 3847.3 3941.6 3988.5 4021.4
ScC' . . . . . . . . 3798.1 3824.5 3878.0 3885.4 3943.7
ScD . . . . . . . . 3504.7 3492.5 3458.1 3374.2 3341.9
2ESRA Mediter
ESRA North-W
ScA 1568.6 1606.0 1709.5 1684.3 1548.8 1576.8 1674.8 1653.8 2047.4 2124.3 2417.4 2653.6 2855.9
ScC . . . . . . . . 1904.5 1944.7 2165.3 2321.2 2426.9
ScC' . . . . . . . . 1904.5 1930.4 2090.7 2217.1 2298.7
ScD . . . . . . . . 1717.8 1724.1 1782.7 1789.7 1819.2
3ESRA Mediter
ESRA Mediter
ScA 1375.1 1471.4 1573.3 1518.2 1445.0 1466.9 1480.4 1350.0 1725.7 1748.4 1922.7 2058.2 2171.1
ScC . . . . . . . . 1590.9 1606.1 1717.2 1820.9 1876.0
ScC' . . . . . . . . 1590.9 1598.0 1704.6 1807.6 1871.0
ScD . . . . . . . . 1444.9 1451.9 1505.6 1522.9 1564.7
4 ESRA EastESRA North-W
ScA 455.4 495.5 528.6 560.0 513.5 510.6 520.3 520.4 729.1 773.0 901.7 1022.1 1120.6
ScC . . . . . . . . 656.0 680.1 789.7 863.6 929.7
ScC' . . . . . . . . 656.0 676.8 771.7 838.7 909.4
ScD . . . . . . . . 580.7 590.2 636.0 667.2 705.5
5ESRA North-W
North Atlant
ScA 291.9 298.2 315.3 319.2 290.4 288.8 302.0 293.7 354.3 365.0 394.5 433.8 476.4
ScC . . . . . . . . 339.4 341.0 353.0 360.4 372.0
ScC' . . . . . . . . 339.4 335.1 331.5 331.1 335.9
ScD . . . . . . . . 313.7 308.0 292.4 278.0 268.4
6ESRA North-W
Other Europe
ScA 191.1 200.7 222.0 242.6 203.6 215.4 243.3 254.8 341.6 363.1 423.6 488.3 540.2
ScC . . . . . . . . 307.5 319.1 369.9 410.2 452.0
ScC' . . . . . . . . 307.5 316.5 354.3 382.5 414.8
. . . . . . . . 272.3 278.0 304.2 320.3 338.8
Figure 36. Annual traffic on busiest region-to-region flows through ESRA.

44
Annual Growth AAGR 2035/ 2012
Traffic Mul-tiple
2035/ 20122005 2006 2007 2008 2009 2010 2011 2012 2019 2020 2025 2030 2035
1ESRA North-W
ESRA North-W
ScA . 1.4% 1.6% -0.6% -7.7% -2.5% 3.0% -2.7% 1.5% 2.4% 0.6% 0.5% 0.2% 0.9% 1.2
ScC . . . . . . . . 0.8% 1.3% 0.5% 0.2% 0.2% 0.5% 1.1
ScC' . . . . . . . . 0.8% 0.7% 0.3% 0.0% 0.3% 0.4% 1.1
ScD . . . . . . . . -0.3% -0.3% -0.2% -0.5% -0.2% -0.3% 0.9
2ESRA Mediter
ESRA North-W
ScA . 2.4% 6.4% -1.5% -8.0% 1.8% 6.2% -1.3% 3.1% 3.8% 2.6% 1.9% 1.5% 2.4% 1.7
ScC . . . . . . . . 2.0% 2.1% 2.2% 1.4% 0.9% 1.7% 1.5
ScC' . . . . . . . . 2.0% 1.4% 1.6% 1.2% 0.7% 1.4% 1.4
ScD . . . . . . . . 0.5% 0.4% 0.7% 0.1% 0.3% 0.4% 1.1
3ESRA Mediter
ESRA Mediter
ScA . 7.0% 6.9% -3.5% -4.8% 1.5% 0.9% -8.8% 3.6% 1.3% 1.9% 1.4% 1.1% 2.1% 1.6
ScC . . . . . . . . 2.4% 1.0% 1.3% 1.2% 0.6% 1.4% 1.4
ScC' . . . . . . . . 2.4% 0.4% 1.3% 1.2% 0.7% 1.4% 1.4
ScD . . . . . . . . 1.0% 0.5% 0.7% 0.2% 0.5% 0.6% 1.2
4ESRA East
ESRA North-W
ScA . 8.8% 6.7% 5.9% -8.3% -0.6% 1.9% 0.0% 4.9% 6.0% 3.1% 2.5% 1.9% 3.4% 2.2
ScC . . . . . . . . 3.4% 3.7% 3.0% 1.8% 1.5% 2.6% 1.8
ScC' . . . . . . . . 3.4% 3.2% 2.7% 1.7% 1.6% 2.5% 1.7
ScD . . . . . . . . 1.6% 1.6% 1.5% 1.0% 1.1% 1.3% 1.4
5ESRA North-W
North Atlant
ScA . 2.2% 5.8% 1.2% -9.0% -0.6% 4.6% -2.7% 2.7% 3.0% 1.6% 1.9% 1.9% 2.1% 1.6
ScC . . . . . . . . 2.1% 0.5% 0.7% 0.4% 0.6% 1.0% 1.3
ScC' . . . . . . . . 2.1% -1.2% -0.2% -0.0% 0.3% 0.6% 1.1
ScD . . . . . . . . 0.9% -1.8% -1.0% -1.0% -0.7% -0.4% 0.9
6ESRA North-W
Other Europe
ScA . 5.1% 11% 9.3% -16% 5.8% 13% 4.7% 4.3% 6.3% 3.1% 2.9% 2.0% 3.3% 2.1
ScC . . . . . . . . 2.7% 3.8% 3.0% 2.1% 2.0% 2.5% 1.8
ScC' . . . . . . . . 2.7% 2.9% 2.3% 1.5% 1.6% 2.1% 1.6
ScD . . . . . . . . 1.0% 2.1% 1.8% 1.0% 1.1% 1.2% 1.3
Figure 37. Annual growth on busiest region-to-region flows through ESRA.
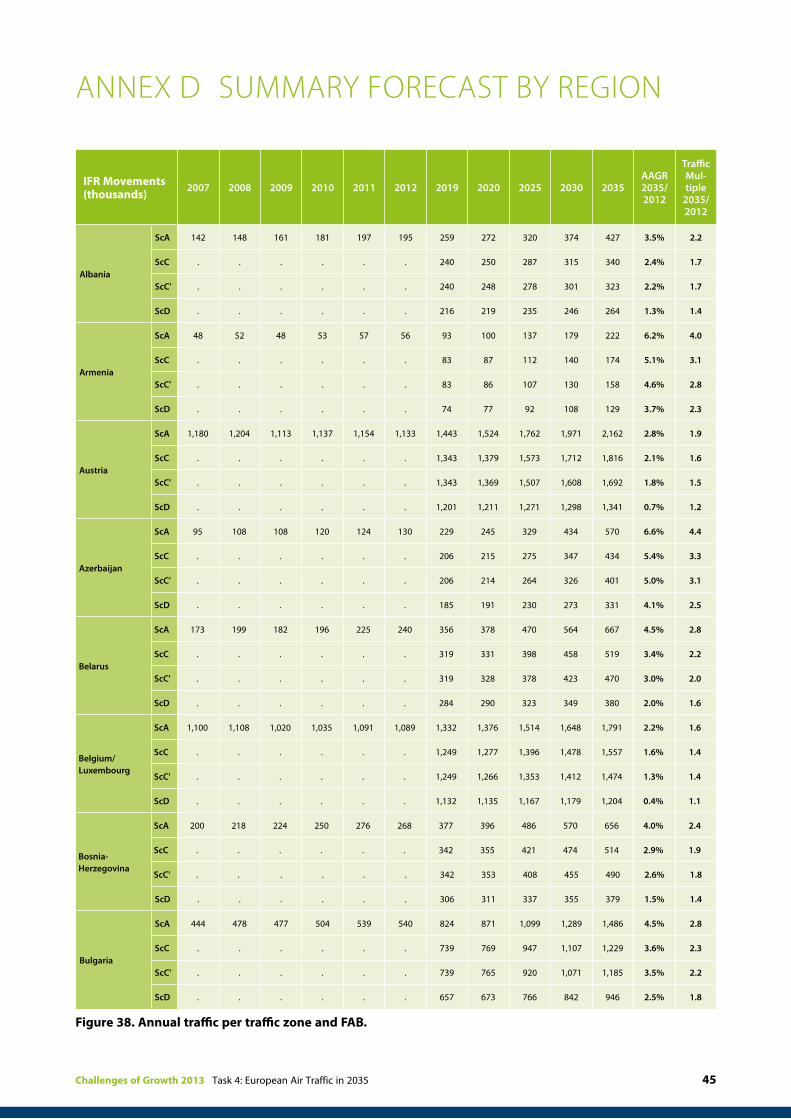
Challenges of Growth 2013 Task 4: European Air Traffic in 2035 45
Annual Growth AAGR 2035/ 2012
Traffic Mul-tiple
2035/ 20122005 2006 2007 2008 2009 2010 2011 2012 2019 2020 2025 2030 2035
1ESRA North-W
ESRA North-W
ScA . 1.4% 1.6% -0.6% -7.7% -2.5% 3.0% -2.7% 1.5% 2.4% 0.6% 0.5% 0.2% 0.9% 1.2
ScC . . . . . . . . 0.8% 1.3% 0.5% 0.2% 0.2% 0.5% 1.1
ScC' . . . . . . . . 0.8% 0.7% 0.3% 0.0% 0.3% 0.4% 1.1
ScD . . . . . . . . -0.3% -0.3% -0.2% -0.5% -0.2% -0.3% 0.9
2ESRA Mediter
ESRA North-W
ScA . 2.4% 6.4% -1.5% -8.0% 1.8% 6.2% -1.3% 3.1% 3.8% 2.6% 1.9% 1.5% 2.4% 1.7
ScC . . . . . . . . 2.0% 2.1% 2.2% 1.4% 0.9% 1.7% 1.5
ScC' . . . . . . . . 2.0% 1.4% 1.6% 1.2% 0.7% 1.4% 1.4
ScD . . . . . . . . 0.5% 0.4% 0.7% 0.1% 0.3% 0.4% 1.1
3ESRA Mediter
ESRA Mediter
ScA . 7.0% 6.9% -3.5% -4.8% 1.5% 0.9% -8.8% 3.6% 1.3% 1.9% 1.4% 1.1% 2.1% 1.6
ScC . . . . . . . . 2.4% 1.0% 1.3% 1.2% 0.6% 1.4% 1.4
ScC' . . . . . . . . 2.4% 0.4% 1.3% 1.2% 0.7% 1.4% 1.4
ScD . . . . . . . . 1.0% 0.5% 0.7% 0.2% 0.5% 0.6% 1.2
4ESRA East
ESRA North-W
ScA . 8.8% 6.7% 5.9% -8.3% -0.6% 1.9% 0.0% 4.9% 6.0% 3.1% 2.5% 1.9% 3.4% 2.2
ScC . . . . . . . . 3.4% 3.7% 3.0% 1.8% 1.5% 2.6% 1.8
ScC' . . . . . . . . 3.4% 3.2% 2.7% 1.7% 1.6% 2.5% 1.7
ScD . . . . . . . . 1.6% 1.6% 1.5% 1.0% 1.1% 1.3% 1.4
5ESRA North-W
North Atlant
ScA . 2.2% 5.8% 1.2% -9.0% -0.6% 4.6% -2.7% 2.7% 3.0% 1.6% 1.9% 1.9% 2.1% 1.6
ScC . . . . . . . . 2.1% 0.5% 0.7% 0.4% 0.6% 1.0% 1.3
ScC' . . . . . . . . 2.1% -1.2% -0.2% -0.0% 0.3% 0.6% 1.1
ScD . . . . . . . . 0.9% -1.8% -1.0% -1.0% -0.7% -0.4% 0.9
6ESRA North-W
Other Europe
ScA . 5.1% 11% 9.3% -16% 5.8% 13% 4.7% 4.3% 6.3% 3.1% 2.9% 2.0% 3.3% 2.1
ScC . . . . . . . . 2.7% 3.8% 3.0% 2.1% 2.0% 2.5% 1.8
ScC' . . . . . . . . 2.7% 2.9% 2.3% 1.5% 1.6% 2.1% 1.6
ScD . . . . . . . . 1.0% 2.1% 1.8% 1.0% 1.1% 1.2% 1.3
annex d Summary foreCaSt by regIon
Figure 38. Annual traffic per traffic zone and FAB.
IFR Movements (thousands)
2007 2008 2009 2010 2011 2012 2019 2020 2025 2030 2035AAGR 2035/ 2012
Traffic Mul-tiple
2035/ 2012
Albania
ScA 142 148 161 181 197 195 259 272 320 374 427 3.5% 2.2
ScC . . . . . . 240 250 287 315 340 2.4% 1.7
ScC' . . . . . . 240 248 278 301 323 2.2% 1.7
ScD . . . . . . 216 219 235 246 264 1.3% 1.4
Armenia
ScA 48 52 48 53 57 56 93 100 137 179 222 6.2% 4.0
ScC . . . . . . 83 87 112 140 174 5.1% 3.1
ScC' . . . . . . 83 86 107 130 158 4.6% 2.8
ScD . . . . . . 74 77 92 108 129 3.7% 2.3
Austria
ScA 1,180 1,204 1,113 1,137 1,154 1,133 1,443 1,524 1,762 1,971 2,162 2.8% 1.9
ScC . . . . . . 1,343 1,379 1,573 1,712 1,816 2.1% 1.6
ScC' . . . . . . 1,343 1,369 1,507 1,608 1,692 1.8% 1.5
ScD . . . . . . 1,201 1,211 1,271 1,298 1,341 0.7% 1.2
Azerbaijan
ScA 95 108 108 120 124 130 229 245 329 434 570 6.6% 4.4
ScC . . . . . . 206 215 275 347 434 5.4% 3.3
ScC' . . . . . . 206 214 264 326 401 5.0% 3.1
ScD . . . . . . 185 191 230 273 331 4.1% 2.5
Belarus
ScA 173 199 182 196 225 240 356 378 470 564 667 4.5% 2.8
ScC . . . . . . 319 331 398 458 519 3.4% 2.2
ScC' . . . . . . 319 328 378 423 470 3.0% 2.0
ScD . . . . . . 284 290 323 349 380 2.0% 1.6
Belgium/ Luxembourg
ScA 1,100 1,108 1,020 1,035 1,091 1,089 1,332 1,376 1,514 1,648 1,791 2.2% 1.6
ScC . . . . . . 1,249 1,277 1,396 1,478 1,557 1.6% 1.4
ScC' . . . . . . 1,249 1,266 1,353 1,412 1,474 1.3% 1.4
ScD . . . . . . 1,132 1,135 1,167 1,179 1,204 0.4% 1.1
Bosnia- Herzegovina
ScA 200 218 224 250 276 268 377 396 486 570 656 4.0% 2.4
ScC . . . . . . 342 355 421 474 514 2.9% 1.9
ScC' . . . . . . 342 353 408 455 490 2.6% 1.8
ScD . . . . . . 306 311 337 355 379 1.5% 1.4
Bulgaria
ScA 444 478 477 504 539 540 824 871 1,099 1,289 1,486 4.5% 2.8
ScC . . . . . . 739 769 947 1,107 1,229 3.6% 2.3
ScC' . . . . . . 739 765 920 1,071 1,185 3.5% 2.2
ScD . . . . . . 657 673 766 842 946 2.5% 1.8

46
IFR Movements (thousands)
2007 2008 2009 2010 2011 2012 2019 2020 2025 2030 2035AAGR 2035/ 2012
Traffic Mul-tiple
2035/ 2012
Canary Islands
ScA 308 307 267 275 298 275 329 341 396 449 500 2.6% 1.8
ScC . . . . . . 294 299 328 351 370 1.3% 1.3
ScC' . . . . . . 294 297 317 331 346 1.0% 1.3
ScD . . . . . . 264 263 267 264 262 -0.2% 1.0
Croatia
ScA 398 422 422 459 497 495 695 730 882 1,027 1,175 3.8% 2.4
ScC . . . . . . 634 656 768 857 930 2.8% 1.9
ScC' . . . . . . 634 652 743 818 882 2.5% 1.8
ScD . . . . . . 568 577 624 656 699 1.5% 1.4
Cyprus
ScA 242 272 268 285 281 270 394 421 562 704 872 5.2% 3.2
ScC . . . . . . 352 366 447 527 611 3.6% 2.3
ScC' . . . . . . 352 363 424 484 547 3.1% 2.0
ScD . . . . . . 315 323 363 397 438 2.1% 1.6
Czech Republic
ScA 646 682 648 668 695 679 914 961 1,129 1,278 1,421 3.3% 2.1
ScC . . . . . . 826 850 979 1,077 1,159 2.3% 1.7
ScC' . . . . . . 826 844 944 1,026 1,099 2.1% 1.6
ScD . . . . . . 734 742 790 818 853 1.0% 1.3
Denmark
ScA 631 629 576 595 625 605 742 770 850 935 1,002 2.2% 1.7
ScC . . . . . . 696 713 769 816 855 1.5% 1.4
ScC' . . . . . . 696 707 744 772 800 1.2% 1.3
ScD . . . . . . 634 635 644 643 649 0.3% 1.1
Estonia
ScA 153 174 153 156 178 189 258 275 318 383 427 3.6% 2.3
ScC . . . . . . 231 238 276 310 345 2.7% 1.8
ScC' . . . . . . 231 237 267 294 325 2.4% 1.7
ScD . . . . . . 203 206 224 237 253 1.3% 1.3
FYROM
ScA 123 125 125 125 124 113 151 160 196 238 277 4.0% 2.5
ScC . . . . . . 139 145 174 198 217 2.9% 1.9
ScC' . . . . . . 139 145 170 192 211 2.8% 1.9
ScD . . . . . . 125 127 138 148 163 1.6% 1.4
Finland
ScA 245 261 240 242 267 252 316 327 361 401 440 2.5% 1.7
ScC . . . . . . 280 284 301 316 335 1.2% 1.3
ScC' . . . . . . 280 283 295 306 323 1.1% 1.3
ScD . . . . . . 249 248 247 245 248 -0.1% 1.0
Figure 38 (continued). Annual traffic per traffic zone and FAB.
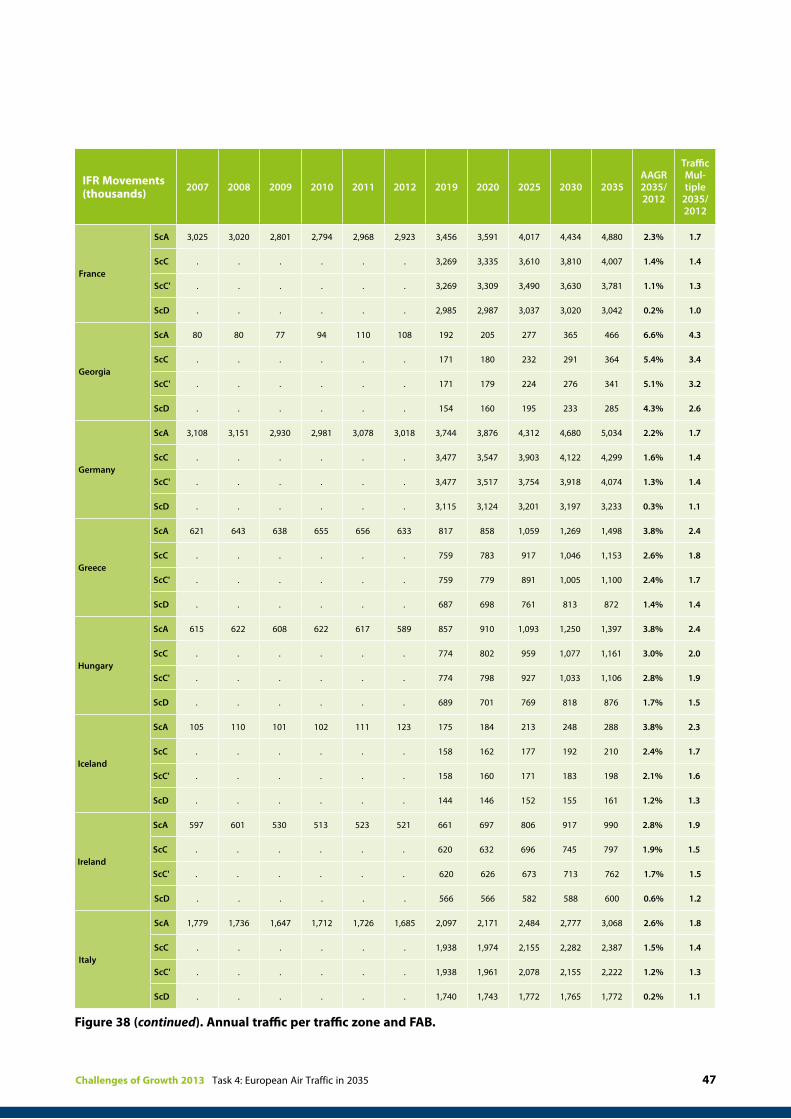
Challenges of Growth 2013 Task 4: European Air Traffic in 2035 47
IFR Movements (thousands)
2007 2008 2009 2010 2011 2012 2019 2020 2025 2030 2035AAGR 2035/ 2012
Traffic Mul-tiple
2035/ 2012
France
ScA 3,025 3,020 2,801 2,794 2,968 2,923 3,456 3,591 4,017 4,434 4,880 2.3% 1.7
ScC . . . . . . 3,269 3,335 3,610 3,810 4,007 1.4% 1.4
ScC' . . . . . . 3,269 3,309 3,490 3,630 3,781 1.1% 1.3
ScD . . . . . . 2,985 2,987 3,037 3,020 3,042 0.2% 1.0
Georgia
ScA 80 80 77 94 110 108 192 205 277 365 466 6.6% 4.3
ScC . . . . . . 171 180 232 291 364 5.4% 3.4
ScC' . . . . . . 171 179 224 276 341 5.1% 3.2
ScD . . . . . . 154 160 195 233 285 4.3% 2.6
Germany
ScA 3,108 3,151 2,930 2,981 3,078 3,018 3,744 3,876 4,312 4,680 5,034 2.2% 1.7
ScC . . . . . . 3,477 3,547 3,903 4,122 4,299 1.6% 1.4
ScC' . . . . . . 3,477 3,517 3,754 3,918 4,074 1.3% 1.4
ScD . . . . . . 3,115 3,124 3,201 3,197 3,233 0.3% 1.1
Greece
ScA 621 643 638 655 656 633 817 858 1,059 1,269 1,498 3.8% 2.4
ScC . . . . . . 759 783 917 1,046 1,153 2.6% 1.8
ScC' . . . . . . 759 779 891 1,005 1,100 2.4% 1.7
ScD . . . . . . 687 698 761 813 872 1.4% 1.4
Hungary
ScA 615 622 608 622 617 589 857 910 1,093 1,250 1,397 3.8% 2.4
ScC . . . . . . 774 802 959 1,077 1,161 3.0% 2.0
ScC' . . . . . . 774 798 927 1,033 1,106 2.8% 1.9
ScD . . . . . . 689 701 769 818 876 1.7% 1.5
Iceland
ScA 105 110 101 102 111 123 175 184 213 248 288 3.8% 2.3
ScC . . . . . . 158 162 177 192 210 2.4% 1.7
ScC' . . . . . . 158 160 171 183 198 2.1% 1.6
ScD . . . . . . 144 146 152 155 161 1.2% 1.3
Ireland
ScA 597 601 530 513 523 521 661 697 806 917 990 2.8% 1.9
ScC . . . . . . 620 632 696 745 797 1.9% 1.5
ScC' . . . . . . 620 626 673 713 762 1.7% 1.5
ScD . . . . . . 566 566 582 588 600 0.6% 1.2
Italy
ScA 1,779 1,736 1,647 1,712 1,726 1,685 2,097 2,171 2,484 2,777 3,068 2.6% 1.8
ScC . . . . . . 1,938 1,974 2,155 2,282 2,387 1.5% 1.4
ScC' . . . . . . 1,938 1,961 2,078 2,155 2,222 1.2% 1.3
ScD . . . . . . 1,740 1,743 1,772 1,765 1,772 0.2% 1.1
Figure 38 (continued). Annual traffic per traffic zone and FAB.

48
IFR Movements (thousands)
2007 2008 2009 2010 2011 2012 2019 2020 2025 2030 2035AAGR 2035/ 2012
Traffic Mul-tiple
2035/ 2012
Latvia
ScA 202 225 206 214 235 233 329 348 418 492 563 3.9% 2.4
ScC . . . . . . 283 293 343 385 428 2.7% 1.8
ScC' . . . . . . 283 292 331 366 404 2.4% 1.7
ScD . . . . . . 248 253 277 295 316 1.3% 1.4
Lisbon FIR
ScA 427 438 406 429 450 438 543 562 648 729 809 2.7% 1.8
ScC . . . . . . 491 499 545 580 611 1.5% 1.4
ScC' . . . . . . 491 495 524 543 564 1.1% 1.3
ScD . . . . . . 442 440 441 436 432 -0.1% 1.0
Lithuania
ScA 195 219 192 206 233 236 338 356 425 490 556 3.8% 2.4
ScC . . . . . . 297 307 358 398 438 2.7% 1.9
ScC' . . . . . . 297 305 344 376 410 2.4% 1.7
ScD . . . . . . 261 266 290 306 326 1.4% 1.4
Malta
ScA 82 84 85 95 81 97 138 147 182 220 264 4.5% 2.7
ScC . . . . . . 129 135 159 181 205 3.3% 2.1
ScC' . . . . . . 129 135 157 177 199 3.2% 2.1
ScD . . . . . . 120 124 139 153 169 2.5% 1.8
Moldova
ScA 35 41 44 54 60 64 101 109 145 176 203 5.1% 3.2
ScC . . . . . . 91 95 119 146 163 4.2% 2.6
ScC' . . . . . . 91 94 116 139 154 3.9% 2.4
ScD . . . . . . 81 84 99 113 132 3.2% 2.1
Morocco
ScA 323 331 312 339 352 324 446 469 596 744 922 4.7% 2.9
ScC . . . . . . 396 409 483 554 631 2.9% 1.9
ScC' . . . . . . 396 406 464 519 583 2.6% 1.8
ScD . . . . . . 353 358 389 416 448 1.4% 1.4
Netherlands
ScA 1,108 1,090 996 1,013 1,085 1,083 1,320 1,357 1,478 1,596 1,686 1.9% 1.6
ScC . . . . . . 1,240 1,265 1,368 1,442 1,498 1.4% 1.4
ScC' . . . . . . 1,240 1,255 1,339 1,401 1,467 1.3% 1.4
ScD . . . . . . 1,123 1,128 1,159 1,167 1,185 0.4% 1.1
Norway
ScA 536 550 526 537 563 587 674 717 759 853 898 1.9% 1.5
ScC . . . . . . 646 677 698 740 769 1.2% 1.3
ScC' . . . . . . 646 676 701 727 759 1.1% 1.3
ScD . . . . . . 609 609 609 609 613 0.2% 1.0
Figure 38 (continued). Annual traffic per traffic zone and FAB.

Challenges of Growth 2013 Task 4: European Air Traffic in 2035 49
IFR Movements (thousands)
2007 2008 2009 2010 2011 2012 2019 2020 2025 2030 2035AAGR 2035/ 2012
Traffic Mul-tiple
2035/ 2012
Poland
ScA 556 612 566 599 655 684 962 1,010 1,188 1,343 1,496 3.5% 2.2
ScC . . . . . . 858 884 1,021 1,133 1,234 2.6% 1.8
ScC' . . . . . . 858 879 987 1,080 1,176 2.4% 1.7
ScD . . . . . . 758 769 827 868 920 1.3% 1.3
Romania
ScA 432 444 434 470 487 487 749 795 1,007 1,186 1,359 4.6% 2.8
ScC . . . . . . 664 691 844 979 1,082 3.5% 2.2
ScC' . . . . . . 664 687 818 943 1,038 3.3% 2.1
ScD . . . . . . 587 601 680 742 815 2.3% 1.7
Santa Maria FIR
ScA 109 116 113 118 123 118 153 158 180 203 227 2.9% 1.9
ScC . . . . . . 141 143 154 162 170 1.6% 1.4
ScC' . . . . . . 141 141 146 149 153 1.1% 1.3
ScD . . . . . . 129 128 125 122 120 0.1% 1.0
Serbia&Montenegro
ScA 457 497 513 543 558 535 729 768 940 1,111 1,276 3.9% 2.4
ScC . . . . . . 666 693 827 935 1,021 2.9% 1.9
ScC' . . . . . . 666 689 801 897 973 2.6% 1.8
ScD . . . . . . 596 606 661 706 771 1.6% 1.4
Slovakia
ScA 324 345 337 370 382 381 546 578 697 799 897 3.8% 2.4
ScC . . . . . . 495 511 604 678 733 2.9% 1.9
ScC' . . . . . . 495 509 586 654 703 2.7% 1.8
ScD . . . . . . 443 450 491 520 555 1.6% 1.5
Slovenia
ScA 306 327 313 328 353 346 462 487 587 679 773 3.6% 2.2
ScC . . . . . . 425 440 517 579 627 2.6% 1.8
ScC' . . . . . . 425 437 499 552 595 2.4% 1.7
ScD . . . . . . 380 386 417 438 468 1.3% 1.4
Spain
ScA 1,779 1,747 1,581 1,608 1,665 1,557 1,865 1,927 2,237 2,549 2,858 2.7% 1.8
ScC . . . . . . 1,719 1,752 1,922 2,058 2,179 1.5% 1.4
ScC' . . . . . . 1,719 1,734 1,855 1,950 2,044 1.2% 1.3
ScD . . . . . . 1,553 1,557 1,599 1,588 1,592 0.1% 1.0
Sweden
ScA 708 736 654 664 724 724 910 949 1,057 1,179 1,281 2.5% 1.8
ScC . . . . . . 844 866 937 1,005 1,064 1.7% 1.5
ScC' . . . . . . 844 861 909 947 991 1.4% 1.4
ScD . . . . . . 765 766 779 787 800 0.4% 1.1
Figure 38 (continued). Annual traffic per traffic zone and FAB.
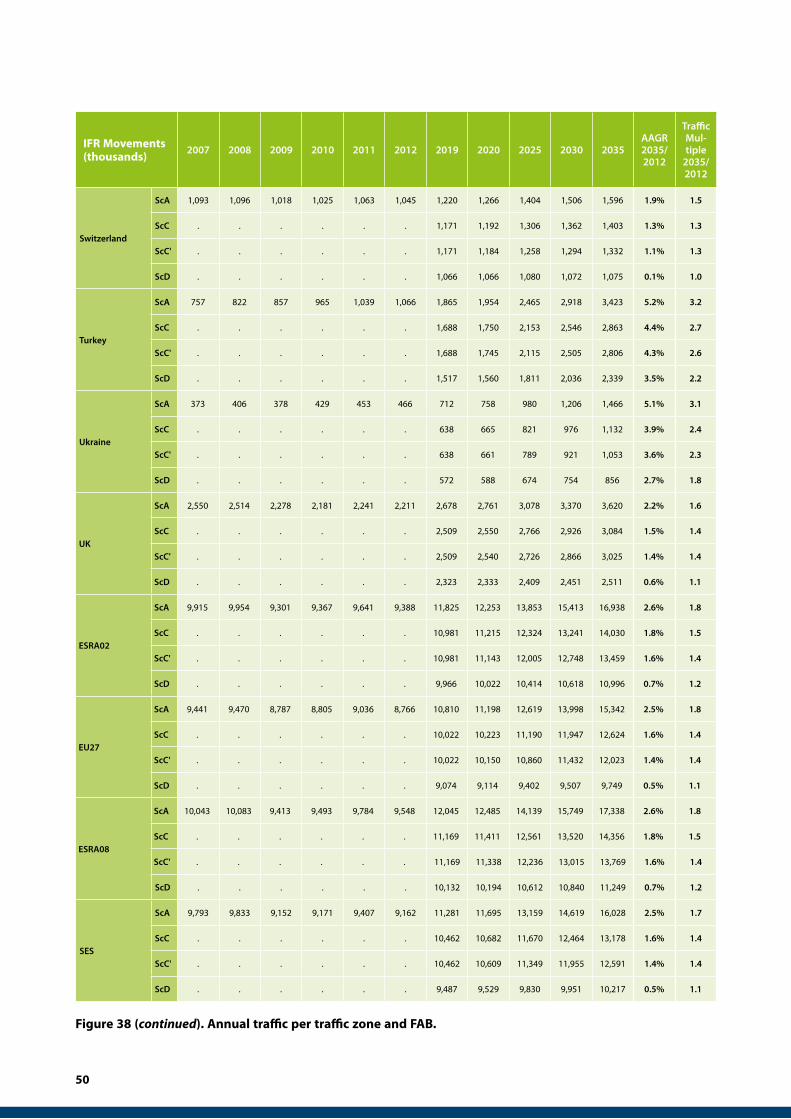
50
IFR Movements (thousands)
2007 2008 2009 2010 2011 2012 2019 2020 2025 2030 2035AAGR 2035/ 2012
Traffic Mul-tiple
2035/ 2012
Switzerland
ScA 1,093 1,096 1,018 1,025 1,063 1,045 1,220 1,266 1,404 1,506 1,596 1.9% 1.5
ScC . . . . . . 1,171 1,192 1,306 1,362 1,403 1.3% 1.3
ScC' . . . . . . 1,171 1,184 1,258 1,294 1,332 1.1% 1.3
ScD . . . . . . 1,066 1,066 1,080 1,072 1,075 0.1% 1.0
Turkey
ScA 757 822 857 965 1,039 1,066 1,865 1,954 2,465 2,918 3,423 5.2% 3.2
ScC . . . . . . 1,688 1,750 2,153 2,546 2,863 4.4% 2.7
ScC' . . . . . . 1,688 1,745 2,115 2,505 2,806 4.3% 2.6
ScD . . . . . . 1,517 1,560 1,811 2,036 2,339 3.5% 2.2
Ukraine
ScA 373 406 378 429 453 466 712 758 980 1,206 1,466 5.1% 3.1
ScC . . . . . . 638 665 821 976 1,132 3.9% 2.4
ScC' . . . . . . 638 661 789 921 1,053 3.6% 2.3
ScD . . . . . . 572 588 674 754 856 2.7% 1.8
UK
ScA 2,550 2,514 2,278 2,181 2,241 2,211 2,678 2,761 3,078 3,370 3,620 2.2% 1.6
ScC . . . . . . 2,509 2,550 2,766 2,926 3,084 1.5% 1.4
ScC' . . . . . . 2,509 2,540 2,726 2,866 3,025 1.4% 1.4
ScD . . . . . . 2,323 2,333 2,409 2,451 2,511 0.6% 1.1
ESRA02
ScA 9,915 9,954 9,301 9,367 9,641 9,388 11,825 12,253 13,853 15,413 16,938 2.6% 1.8
ScC . . . . . . 10,981 11,215 12,324 13,241 14,030 1.8% 1.5
ScC' . . . . . . 10,981 11,143 12,005 12,748 13,459 1.6% 1.4
ScD . . . . . . 9,966 10,022 10,414 10,618 10,996 0.7% 1.2
EU27
ScA 9,441 9,470 8,787 8,805 9,036 8,766 10,810 11,198 12,619 13,998 15,342 2.5% 1.8
ScC . . . . . . 10,022 10,223 11,190 11,947 12,624 1.6% 1.4
ScC' . . . . . . 10,022 10,150 10,860 11,432 12,023 1.4% 1.4
ScD . . . . . . 9,074 9,114 9,402 9,507 9,749 0.5% 1.1
ESRA08
ScA 10,043 10,083 9,413 9,493 9,784 9,548 12,045 12,485 14,139 15,749 17,338 2.6% 1.8
ScC . . . . . . 11,169 11,411 12,561 13,520 14,356 1.8% 1.5
ScC' . . . . . . 11,169 11,338 12,236 13,015 13,769 1.6% 1.4
ScD . . . . . . 10,132 10,194 10,612 10,840 11,249 0.7% 1.2
SES
ScA 9,793 9,833 9,152 9,171 9,407 9,162 11,281 11,695 13,159 14,619 16,028 2.5% 1.7
ScC . . . . . . 10,462 10,682 11,670 12,464 13,178 1.6% 1.4
ScC' . . . . . . 10,462 10,609 11,349 11,955 12,591 1.4% 1.4
ScD . . . . . . 9,487 9,529 9,830 9,951 10,217 0.5% 1.1
Figure 38 (continued). Annual traffic per traffic zone and FAB.
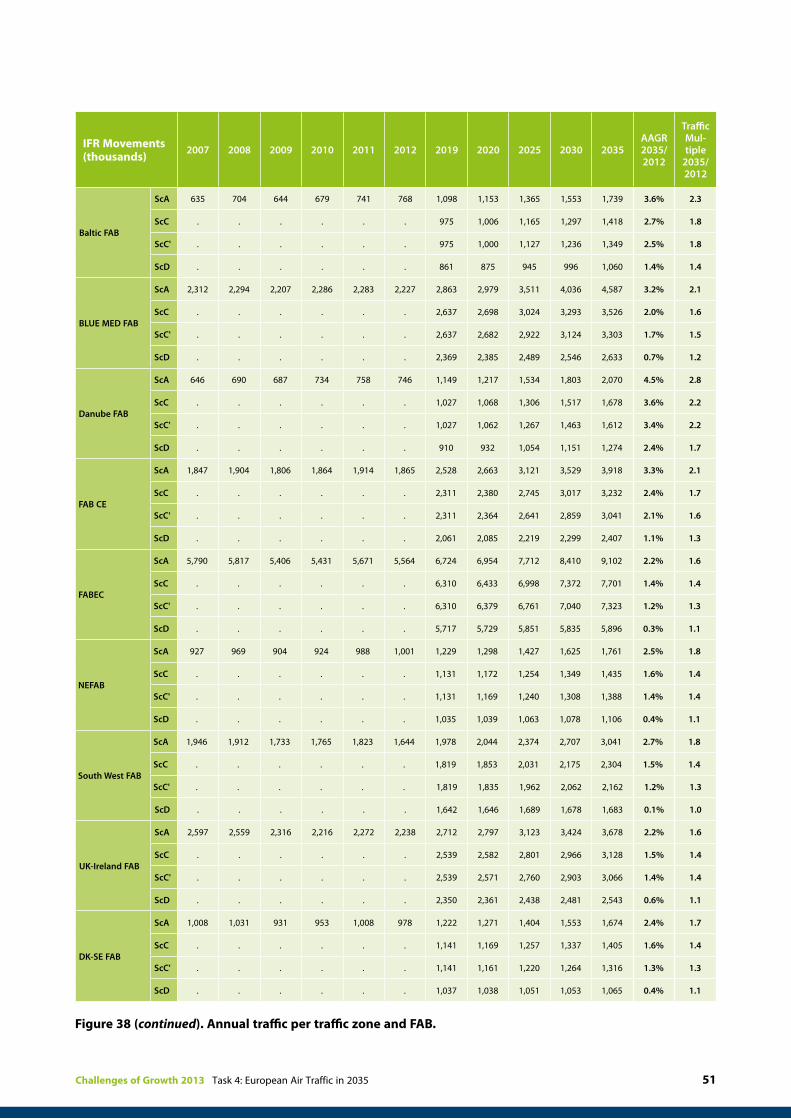
Challenges of Growth 2013 Task 4: European Air Traffic in 2035 51
IFR Movements (thousands)
2007 2008 2009 2010 2011 2012 2019 2020 2025 2030 2035AAGR 2035/ 2012
Traffic Mul-tiple
2035/ 2012
Baltic FAB
ScA 635 704 644 679 741 768 1,098 1,153 1,365 1,553 1,739 3.6% 2.3
ScC . . . . . . 975 1,006 1,165 1,297 1,418 2.7% 1.8
ScC' . . . . . . 975 1,000 1,127 1,236 1,349 2.5% 1.8
ScD . . . . . . 861 875 945 996 1,060 1.4% 1.4
BLUE MED FAB
ScA 2,312 2,294 2,207 2,286 2,283 2,227 2,863 2,979 3,511 4,036 4,587 3.2% 2.1
ScC . . . . . . 2,637 2,698 3,024 3,293 3,526 2.0% 1.6
ScC' . . . . . . 2,637 2,682 2,922 3,124 3,303 1.7% 1.5
ScD . . . . . . 2,369 2,385 2,489 2,546 2,633 0.7% 1.2
Danube FAB
ScA 646 690 687 734 758 746 1,149 1,217 1,534 1,803 2,070 4.5% 2.8
ScC . . . . . . 1,027 1,068 1,306 1,517 1,678 3.6% 2.2
ScC' . . . . . . 1,027 1,062 1,267 1,463 1,612 3.4% 2.2
ScD . . . . . . 910 932 1,054 1,151 1,274 2.4% 1.7
FAB CE
ScA 1,847 1,904 1,806 1,864 1,914 1,865 2,528 2,663 3,121 3,529 3,918 3.3% 2.1
ScC . . . . . . 2,311 2,380 2,745 3,017 3,232 2.4% 1.7
ScC' . . . . . . 2,311 2,364 2,641 2,859 3,041 2.1% 1.6
ScD . . . . . . 2,061 2,085 2,219 2,299 2,407 1.1% 1.3
FABEC
ScA 5,790 5,817 5,406 5,431 5,671 5,564 6,724 6,954 7,712 8,410 9,102 2.2% 1.6
ScC . . . . . . 6,310 6,433 6,998 7,372 7,701 1.4% 1.4
ScC' . . . . . . 6,310 6,379 6,761 7,040 7,323 1.2% 1.3
ScD . . . . . . 5,717 5,729 5,851 5,835 5,896 0.3% 1.1
NEFAB
ScA 927 969 904 924 988 1,001 1,229 1,298 1,427 1,625 1,761 2.5% 1.8
ScC . . . . . . 1,131 1,172 1,254 1,349 1,435 1.6% 1.4
ScC' . . . . . . 1,131 1,169 1,240 1,308 1,388 1.4% 1.4
ScD . . . . . . 1,035 1,039 1,063 1,078 1,106 0.4% 1.1
South West FAB
ScA 1,946 1,912 1,733 1,765 1,823 1,644 1,978 2,044 2,374 2,707 3,041 2.7% 1.8
ScC . . . . . . 1,819 1,853 2,031 2,175 2,304 1.5% 1.4
ScC' . . . . . . 1,819 1,835 1,962 2,062 2,162 1.2% 1.3
ScD . . . . . . 1,642 1,646 1,689 1,678 1,683 0.1% 1.0
UK-Ireland FAB
ScA 2,597 2,559 2,316 2,216 2,272 2,238 2,712 2,797 3,123 3,424 3,678 2.2% 1.6
ScC . . . . . . 2,539 2,582 2,801 2,966 3,128 1.5% 1.4
ScC' . . . . . . 2,539 2,571 2,760 2,903 3,066 1.4% 1.4
ScD . . . . . . 2,350 2,361 2,438 2,481 2,543 0.6% 1.1
DK-SE FAB
ScA 1,008 1,031 931 953 1,008 978 1,222 1,271 1,404 1,553 1,674 2.4% 1.7
ScC . . . . . . 1,141 1,169 1,257 1,337 1,405 1.6% 1.4
ScC' . . . . . . 1,141 1,161 1,220 1,264 1,316 1.3% 1.3
ScD . . . . . . 1,037 1,038 1,051 1,053 1,065 0.4% 1.1
Figure 38 (continued). Annual traffic per traffic zone and FAB.
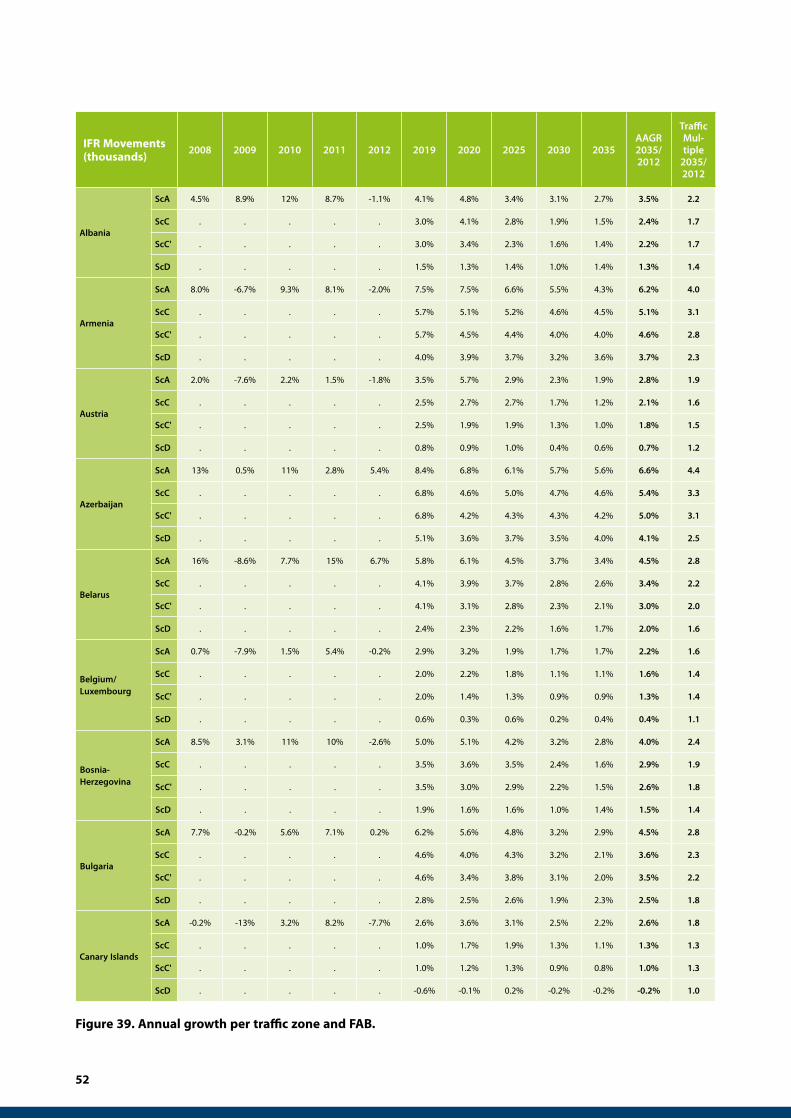
52
IFR Movements (thousands)
2008 2009 2010 2011 2012 2019 2020 2025 2030 2035AAGR 2035/ 2012
Traffic Mul-tiple
2035/ 2012
Albania
ScA 4.5% 8.9% 12% 8.7% -1.1% 4.1% 4.8% 3.4% 3.1% 2.7% 3.5% 2.2
ScC . . . . . 3.0% 4.1% 2.8% 1.9% 1.5% 2.4% 1.7
ScC' . . . . . 3.0% 3.4% 2.3% 1.6% 1.4% 2.2% 1.7
ScD . . . . . 1.5% 1.3% 1.4% 1.0% 1.4% 1.3% 1.4
Armenia
ScA 8.0% -6.7% 9.3% 8.1% -2.0% 7.5% 7.5% 6.6% 5.5% 4.3% 6.2% 4.0
ScC . . . . . 5.7% 5.1% 5.2% 4.6% 4.5% 5.1% 3.1
ScC' . . . . . 5.7% 4.5% 4.4% 4.0% 4.0% 4.6% 2.8
ScD . . . . . 4.0% 3.9% 3.7% 3.2% 3.6% 3.7% 2.3
Austria
ScA 2.0% -7.6% 2.2% 1.5% -1.8% 3.5% 5.7% 2.9% 2.3% 1.9% 2.8% 1.9
ScC . . . . . 2.5% 2.7% 2.7% 1.7% 1.2% 2.1% 1.6
ScC' . . . . . 2.5% 1.9% 1.9% 1.3% 1.0% 1.8% 1.5
ScD . . . . . 0.8% 0.9% 1.0% 0.4% 0.6% 0.7% 1.2
Azerbaijan
ScA 13% 0.5% 11% 2.8% 5.4% 8.4% 6.8% 6.1% 5.7% 5.6% 6.6% 4.4
ScC . . . . . 6.8% 4.6% 5.0% 4.7% 4.6% 5.4% 3.3
ScC' . . . . . 6.8% 4.2% 4.3% 4.3% 4.2% 5.0% 3.1
ScD . . . . . 5.1% 3.6% 3.7% 3.5% 4.0% 4.1% 2.5
Belarus
ScA 16% -8.6% 7.7% 15% 6.7% 5.8% 6.1% 4.5% 3.7% 3.4% 4.5% 2.8
ScC . . . . . 4.1% 3.9% 3.7% 2.8% 2.6% 3.4% 2.2
ScC' . . . . . 4.1% 3.1% 2.8% 2.3% 2.1% 3.0% 2.0
ScD . . . . . 2.4% 2.3% 2.2% 1.6% 1.7% 2.0% 1.6
Belgium/ Luxembourg
ScA 0.7% -7.9% 1.5% 5.4% -0.2% 2.9% 3.2% 1.9% 1.7% 1.7% 2.2% 1.6
ScC . . . . . 2.0% 2.2% 1.8% 1.1% 1.1% 1.6% 1.4
ScC' . . . . . 2.0% 1.4% 1.3% 0.9% 0.9% 1.3% 1.4
ScD . . . . . 0.6% 0.3% 0.6% 0.2% 0.4% 0.4% 1.1
Bosnia- Herzegovina
ScA 8.5% 3.1% 11% 10% -2.6% 5.0% 5.1% 4.2% 3.2% 2.8% 4.0% 2.4
ScC . . . . . 3.5% 3.6% 3.5% 2.4% 1.6% 2.9% 1.9
ScC' . . . . . 3.5% 3.0% 2.9% 2.2% 1.5% 2.6% 1.8
ScD . . . . . 1.9% 1.6% 1.6% 1.0% 1.4% 1.5% 1.4
Bulgaria
ScA 7.7% -0.2% 5.6% 7.1% 0.2% 6.2% 5.6% 4.8% 3.2% 2.9% 4.5% 2.8
ScC . . . . . 4.6% 4.0% 4.3% 3.2% 2.1% 3.6% 2.3
ScC' . . . . . 4.6% 3.4% 3.8% 3.1% 2.0% 3.5% 2.2
ScD . . . . . 2.8% 2.5% 2.6% 1.9% 2.3% 2.5% 1.8
Canary Islands
ScA -0.2% -13% 3.2% 8.2% -7.7% 2.6% 3.6% 3.1% 2.5% 2.2% 2.6% 1.8
ScC . . . . . 1.0% 1.7% 1.9% 1.3% 1.1% 1.3% 1.3
ScC' . . . . . 1.0% 1.2% 1.3% 0.9% 0.8% 1.0% 1.3
ScD . . . . . -0.6% -0.1% 0.2% -0.2% -0.2% -0.2% 1.0
Figure 39. Annual growth per traffic zone and FAB.
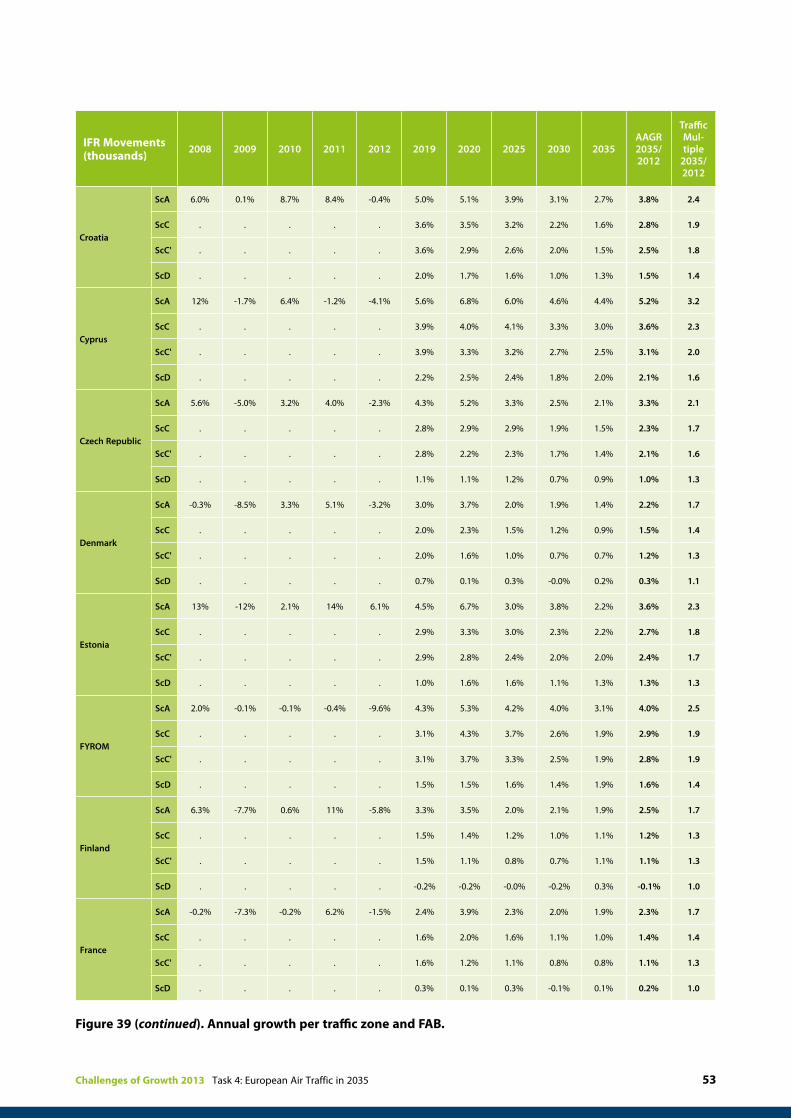
Challenges of Growth 2013 Task 4: European Air Traffic in 2035 53
IFR Movements (thousands)
2008 2009 2010 2011 2012 2019 2020 2025 2030 2035AAGR 2035/ 2012
Traffic Mul-tiple
2035/ 2012
Croatia
ScA 6.0% 0.1% 8.7% 8.4% -0.4% 5.0% 5.1% 3.9% 3.1% 2.7% 3.8% 2.4
ScC . . . . . 3.6% 3.5% 3.2% 2.2% 1.6% 2.8% 1.9
ScC' . . . . . 3.6% 2.9% 2.6% 2.0% 1.5% 2.5% 1.8
ScD . . . . . 2.0% 1.7% 1.6% 1.0% 1.3% 1.5% 1.4
Cyprus
ScA 12% -1.7% 6.4% -1.2% -4.1% 5.6% 6.8% 6.0% 4.6% 4.4% 5.2% 3.2
ScC . . . . . 3.9% 4.0% 4.1% 3.3% 3.0% 3.6% 2.3
ScC' . . . . . 3.9% 3.3% 3.2% 2.7% 2.5% 3.1% 2.0
ScD . . . . . 2.2% 2.5% 2.4% 1.8% 2.0% 2.1% 1.6
Czech Republic
ScA 5.6% -5.0% 3.2% 4.0% -2.3% 4.3% 5.2% 3.3% 2.5% 2.1% 3.3% 2.1
ScC . . . . . 2.8% 2.9% 2.9% 1.9% 1.5% 2.3% 1.7
ScC' . . . . . 2.8% 2.2% 2.3% 1.7% 1.4% 2.1% 1.6
ScD . . . . . 1.1% 1.1% 1.2% 0.7% 0.9% 1.0% 1.3
Denmark
ScA -0.3% -8.5% 3.3% 5.1% -3.2% 3.0% 3.7% 2.0% 1.9% 1.4% 2.2% 1.7
ScC . . . . . 2.0% 2.3% 1.5% 1.2% 0.9% 1.5% 1.4
ScC' . . . . . 2.0% 1.6% 1.0% 0.7% 0.7% 1.2% 1.3
ScD . . . . . 0.7% 0.1% 0.3% -0.0% 0.2% 0.3% 1.1
Estonia
ScA 13% -12% 2.1% 14% 6.1% 4.5% 6.7% 3.0% 3.8% 2.2% 3.6% 2.3
ScC . . . . . 2.9% 3.3% 3.0% 2.3% 2.2% 2.7% 1.8
ScC' . . . . . 2.9% 2.8% 2.4% 2.0% 2.0% 2.4% 1.7
ScD . . . . . 1.0% 1.6% 1.6% 1.1% 1.3% 1.3% 1.3
FYROM
ScA 2.0% -0.1% -0.1% -0.4% -9.6% 4.3% 5.3% 4.2% 4.0% 3.1% 4.0% 2.5
ScC . . . . . 3.1% 4.3% 3.7% 2.6% 1.9% 2.9% 1.9
ScC' . . . . . 3.1% 3.7% 3.3% 2.5% 1.9% 2.8% 1.9
ScD . . . . . 1.5% 1.5% 1.6% 1.4% 1.9% 1.6% 1.4
Finland
ScA 6.3% -7.7% 0.6% 11% -5.8% 3.3% 3.5% 2.0% 2.1% 1.9% 2.5% 1.7
ScC . . . . . 1.5% 1.4% 1.2% 1.0% 1.1% 1.2% 1.3
ScC' . . . . . 1.5% 1.1% 0.8% 0.7% 1.1% 1.1% 1.3
ScD . . . . . -0.2% -0.2% -0.0% -0.2% 0.3% -0.1% 1.0
France
ScA -0.2% -7.3% -0.2% 6.2% -1.5% 2.4% 3.9% 2.3% 2.0% 1.9% 2.3% 1.7
ScC . . . . . 1.6% 2.0% 1.6% 1.1% 1.0% 1.4% 1.4
ScC' . . . . . 1.6% 1.2% 1.1% 0.8% 0.8% 1.1% 1.3
ScD . . . . . 0.3% 0.1% 0.3% -0.1% 0.1% 0.2% 1.0
Figure 39 (continued). Annual growth per traffic zone and FAB.

54
IFR Movements (thousands)
2008 2009 2010 2011 2012 2019 2020 2025 2030 2035AAGR 2035/ 2012
Traffic Mul-tiple
2035/ 2012
Georgia
ScA 0.0% -3.6% 22% 16% -1.7% 8.5% 7.1% 6.2% 5.6% 5.0% 6.6% 4.3
ScC . . . . . 6.8% 5.0% 5.2% 4.7% 4.6% 5.4% 3.4
ScC' . . . . . 6.8% 4.6% 4.5% 4.3% 4.3% 5.1% 3.2
ScD . . . . . 5.2% 4.0% 4.0% 3.6% 4.1% 4.3% 2.6
Germany
ScA 1.4% -7.0% 1.7% 3.2% -1.9% 3.1% 3.5% 2.2% 1.7% 1.5% 2.2% 1.7
ScC . . . . . 2.0% 2.0% 1.9% 1.1% 0.8% 1.6% 1.4
ScC' . . . . . 2.0% 1.2% 1.3% 0.9% 0.8% 1.3% 1.4
ScD . . . . . 0.5% 0.3% 0.5% -0.0% 0.2% 0.3% 1.1
Greece
ScA 3.4% -0.8% 2.6% 0.2% -3.5% 3.7% 4.9% 4.3% 3.7% 3.4% 3.8% 2.4
ScC . . . . . 2.6% 3.2% 3.2% 2.7% 2.0% 2.6% 1.8
ScC' . . . . . 2.6% 2.6% 2.7% 2.4% 1.8% 2.4% 1.7
ScD . . . . . 1.2% 1.7% 1.7% 1.3% 1.4% 1.4% 1.4
Hungary
ScA 1.1% -2.3% 2.4% -0.8% -4.4% 5.5% 6.2% 3.7% 2.7% 2.3% 3.8% 2.4
ScC . . . . . 4.0% 3.6% 3.6% 2.3% 1.5% 3.0% 2.0
ScC' . . . . . 4.0% 3.0% 3.0% 2.2% 1.4% 2.8% 1.9
ScD . . . . . 2.3% 1.8% 1.9% 1.2% 1.4% 1.7% 1.5
Iceland
ScA 4.8% -7.8% 0.6% 9.0% 11% 5.3% 4.7% 3.0% 3.1% 3.1% 3.8% 2.3
ScC . . . . . 3.7% 2.1% 1.8% 1.7% 1.8% 2.4% 1.7
ScC' . . . . . 3.7% 1.1% 1.4% 1.4% 1.6% 2.1% 1.6
ScD . . . . . 2.3% 1.4% 0.8% 0.4% 0.7% 1.2% 1.3
Ireland
ScA 0.6% -12% -3.1% 1.9% -0.4% 3.5% 5.4% 3.0% 2.6% 1.5% 2.8% 1.9
ScC . . . . . 2.5% 1.8% 2.0% 1.4% 1.4% 1.9% 1.5
ScC' . . . . . 2.5% 0.9% 1.5% 1.2% 1.3% 1.7% 1.5
ScD . . . . . 1.2% 0.0% 0.6% 0.2% 0.4% 0.6% 1.2
Italy
ScA -2.4% -5.1% 3.9% 0.8% -2.3% 3.2% 3.5% 2.7% 2.3% 2.0% 2.6% 1.8
ScC . . . . . 2.0% 1.8% 1.8% 1.1% 0.9% 1.5% 1.4
ScC' . . . . . 2.0% 1.2% 1.2% 0.7% 0.6% 1.2% 1.3
ScD . . . . . 0.5% 0.2% 0.3% -0.1% 0.1% 0.2% 1.1
Latvia
ScA 11% -8.4% 4.0% 9.8% -1.0% 5.0% 5.9% 3.7% 3.3% 2.7% 3.9% 2.4
ScC . . . . . 2.8% 3.6% 3.2% 2.4% 2.1% 2.7% 1.8
ScC' . . . . . 2.8% 3.0% 2.6% 2.0% 2.0% 2.4% 1.7
ScD . . . . . 0.9% 1.9% 1.9% 1.2% 1.4% 1.3% 1.4
Figure 39 (continued). Annual growth per traffic zone and FAB.

Challenges of Growth 2013 Task 4: European Air Traffic in 2035 55
IFR Movements (thousands)
2008 2009 2010 2011 2012 2019 2020 2025 2030 2035AAGR 2035/ 2012
Traffic Mul-tiple
2035/ 2012
Lisbon FIR
ScA 2.7% -7.2% 5.6% 4.8% -2.7% 3.1% 3.5% 2.9% 2.4% 2.1% 2.7% 1.8
ScC . . . . . 1.6% 1.6% 1.8% 1.3% 1.0% 1.5% 1.4
ScC' . . . . . 1.6% 0.8% 1.1% 0.7% 0.8% 1.1% 1.3
ScD . . . . . 0.1% -0.4% 0.1% -0.3% -0.2% -0.1% 1.0
Lithuania
ScA 12% -12% 7.3% 13% 1.0% 5.3% 5.5% 3.6% 2.9% 2.5% 3.8% 2.4
ScC . . . . . 3.3% 3.4% 3.1% 2.2% 1.9% 2.7% 1.9
ScC' . . . . . 3.3% 2.7% 2.4% 1.8% 1.7% 2.4% 1.7
ScD . . . . . 1.5% 1.9% 1.8% 1.1% 1.2% 1.4% 1.4
Malta
ScA 3.5% 0.7% 12% -15% 20% 5.3% 6.1% 4.4% 3.9% 3.7% 4.5% 2.7
ScC . . . . . 4.2% 5.1% 3.3% 2.6% 2.5% 3.3% 2.1
ScC' . . . . . 4.2% 4.8% 3.1% 2.4% 2.4% 3.2% 2.1
ScD . . . . . 3.1% 3.6% 2.3% 1.9% 2.1% 2.5% 1.8
Moldova
ScA 18% 6.7% 24% 11% 5.7% 6.8% 7.1% 6.0% 4.0% 2.8% 5.1% 3.2
ScC . . . . . 5.1% 4.8% 4.7% 4.0% 2.3% 4.2% 2.6
ScC' . . . . . 5.1% 4.3% 4.1% 3.8% 2.0% 3.9% 2.4
ScD . . . . . 3.5% 3.4% 3.3% 2.8% 3.1% 3.2% 2.1
Morocco
ScA 2.5% -5.8% 8.6% 3.9% -8.1% 4.7% 5.2% 4.9% 4.5% 4.4% 4.7% 2.9
ScC . . . . . 2.9% 3.4% 3.3% 2.8% 2.6% 2.9% 1.9
ScC' . . . . . 2.9% 2.6% 2.7% 2.3% 2.4% 2.6% 1.8
ScD . . . . . 1.3% 1.3% 1.7% 1.3% 1.5% 1.4% 1.4
Netherlands
ScA -1.6% -8.6% 1.7% 7.2% -0.2% 2.9% 2.9% 1.7% 1.5% 1.1% 1.9% 1.6
ScC . . . . . 2.0% 2.0% 1.6% 1.1% 0.8% 1.4% 1.4
ScC' . . . . . 2.0% 1.2% 1.3% 0.9% 0.9% 1.3% 1.4
ScD . . . . . 0.5% 0.4% 0.6% 0.1% 0.3% 0.4% 1.1
Norway
ScA 2.6% -4.4% 2.2% 4.9% 4.2% 2.0% 6.3% 1.1% 2.4% 1.0% 1.9% 1.5
ScC . . . . . 1.4% 4.7% 0.6% 1.2% 0.8% 1.2% 1.3
ScC' . . . . . 1.4% 4.5% 0.7% 0.8% 0.8% 1.1% 1.3
ScD . . . . . 0.5% -0.0% 0.0% -0.0% 0.1% 0.2% 1.0
Poland
ScA 10% -7.6% 5.8% 9.4% 4.6% 5.0% 5.0% 3.3% 2.5% 2.2% 3.5% 2.2
ScC . . . . . 3.3% 3.1% 2.9% 2.1% 1.7% 2.6% 1.8
ScC' . . . . . 3.3% 2.5% 2.3% 1.8% 1.7% 2.4% 1.7
ScD . . . . . 1.5% 1.4% 1.5% 1.0% 1.2% 1.3% 1.3
Figure 39 (continued). Annual growth per traffic zone and FAB.

56
IFR Movements (thousands)
2008 2009 2010 2011 2012 2019 2020 2025 2030 2035AAGR 2035/ 2012
Traffic Mul-tiple
2035/ 2012
Romania
ScA 2.8% -2.3% 8.2% 3.8% -0.0% 6.3% 6.2% 4.8% 3.3% 2.8% 4.6% 2.8
ScC . . . . . 4.5% 4.0% 4.1% 3.0% 2.0% 3.5% 2.2
ScC' . . . . . 4.5% 3.4% 3.6% 2.9% 1.9% 3.3% 2.1
ScD . . . . . 2.7% 2.4% 2.5% 1.8% 1.9% 2.3% 1.7
Santa Maria FIR
ScA 6.5% -2.6% 4.5% 4.3% -3.9% 3.7% 3.3% 2.6% 2.5% 2.3% 2.9% 1.9
ScC . . . . . 2.6% 1.3% 1.5% 1.0% 0.9% 1.6% 1.4
ScC' . . . . . 2.6% 0.0% 0.6% 0.4% 0.5% 1.1% 1.3
ScD . . . . . 1.3% -1.0% -0.3% -0.6% -0.4% 0.1% 1.0
Serbia&Montenegro
ScA 8.6% 3.3% 5.9% 2.7% -4.1% 4.5% 5.3% 4.1% 3.4% 2.8% 3.9% 2.4
ScC . . . . . 3.2% 4.1% 3.6% 2.5% 1.8% 2.9% 1.9
ScC' . . . . . 3.2% 3.5% 3.1% 2.3% 1.6% 2.6% 1.8
ScD . . . . . 1.6% 1.6% 1.8% 1.3% 1.8% 1.6% 1.4
Slovakia
ScA 6.4% -2.4% 9.9% 3.1% -0.3% 5.3% 5.8% 3.8% 2.8% 2.3% 3.8% 2.4
ScC . . . . . 3.8% 3.3% 3.4% 2.3% 1.6% 2.9% 1.9
ScC' . . . . . 3.8% 2.7% 2.9% 2.2% 1.5% 2.7% 1.8
ScD . . . . . 2.2% 1.6% 1.8% 1.2% 1.3% 1.6% 1.5
Slovenia
ScA 6.8% -4.2% 4.8% 7.5% -2.0% 4.2% 5.5% 3.8% 3.0% 2.6% 3.6% 2.2
ScC . . . . . 3.0% 3.5% 3.3% 2.3% 1.6% 2.6% 1.8
ScC' . . . . . 3.0% 2.8% 2.7% 2.1% 1.5% 2.4% 1.7
ScD . . . . . 1.4% 1.5% 1.6% 1.0% 1.3% 1.3% 1.4
Spain
ScA -1.8% -9.5% 1.8% 3.6% -6.5% 2.6% 3.3% 3.0% 2.6% 2.3% 2.7% 1.8
ScC . . . . . 1.4% 1.9% 1.9% 1.4% 1.1% 1.5% 1.4
ScC' . . . . . 1.4% 0.9% 1.4% 1.0% 0.9% 1.2% 1.3
ScD . . . . . -0.0% 0.3% 0.5% -0.1% 0.0% 0.1% 1.0
Sweden
ScA 3.9% -11% 1.5% 9.1% -0.1% 3.3% 4.3% 2.2% 2.2% 1.7% 2.5% 1.8
ScC . . . . . 2.2% 2.6% 1.6% 1.4% 1.1% 1.7% 1.5
ScC' . . . . . 2.2% 2.0% 1.1% 0.8% 0.9% 1.4% 1.4
ScD . . . . . 0.8% 0.2% 0.3% 0.2% 0.3% 0.4% 1.1
Switzerland
ScA 0.3% -7.1% 0.7% 3.6% -1.7% 2.2% 3.8% 2.1% 1.4% 1.2% 1.9% 1.5
ScC . . . . . 1.6% 1.8% 1.9% 0.8% 0.6% 1.3% 1.3
ScC' . . . . . 1.6% 1.1% 1.2% 0.6% 0.6% 1.1% 1.3
ScD . . . . . 0.3% 0.0% 0.2% -0.1% 0.1% 0.1% 1.0
Figure 39 (continued). Annual growth per traffic zone and FAB.

Challenges of Growth 2013 Task 4: European Air Traffic in 2035 57
IFR Movements (thousands)
2008 2009 2010 2011 2012 2019 2020 2025 2030 2035AAGR 2035/ 2012
Traffic Mul-tiple
2035/ 2012
Turkey
ScA 8.6% 4.2% 13% 7.6% 2.6% 8.3% 4.8% 4.8% 3.4% 3.2% 5.2% 3.2
ScC . . . . . 6.8% 3.6% 4.2% 3.4% 2.4% 4.4% 2.7
ScC' . . . . . 6.8% 3.4% 3.9% 3.4% 2.3% 4.3% 2.6
ScD . . . . . 5.2% 2.8% 3.0% 2.4% 2.8% 3.5% 2.2
Ukraine
ScA 8.7% -6.9% 14% 5.5% 2.9% 6.2% 6.5% 5.3% 4.2% 4.0% 5.1% 3.1
ScC . . . . . 4.6% 4.3% 4.3% 3.5% 3.0% 3.9% 2.4
ScC' . . . . . 4.6% 3.7% 3.6% 3.2% 2.7% 3.6% 2.3
ScD . . . . . 3.0% 2.8% 2.8% 2.2% 2.6% 2.7% 1.8
UK
ScA -1.4% -9.4% -4.3% 2.8% -1.4% 2.8% 3.1% 2.2% 1.8% 1.4% 2.2% 1.6
ScC . . . . . 1.8% 1.7% 1.6% 1.1% 1.1% 1.5% 1.4
ScC' . . . . . 1.8% 1.3% 1.4% 1.0% 1.1% 1.4% 1.4
ScD . . . . . 0.7% 0.4% 0.6% 0.3% 0.5% 0.6% 1.1
ESRA02
ScA 0.4% -6.6% 0.7% 2.9% -2.6% 3.4% 3.6% 2.5% 2.2% 1.9% 2.6% 1.8
ScC . . . . . 2.3% 2.1% 1.9% 1.4% 1.2% 1.8% 1.5
ScC' . . . . . 2.3% 1.5% 1.5% 1.2% 1.1% 1.6% 1.4
ScD . . . . . 0.9% 0.6% 0.8% 0.4% 0.7% 0.7% 1.2
EU27
ScA 0.3% -7.2% 0.2% 2.6% -3.0% 3.0% 3.6% 2.4% 2.1% 1.8% 2.5% 1.8
ScC . . . . . 1.9% 2.0% 1.8% 1.3% 1.1% 1.6% 1.4
ScC' . . . . . 1.9% 1.3% 1.4% 1.0% 1.0% 1.4% 1.4
ScD . . . . . 0.5% 0.4% 0.6% 0.2% 0.5% 0.5% 1.1
ESRA08
ScA 0.4% -6.6% 0.8% 3.1% -2.4% 3.4% 3.7% 2.5% 2.2% 1.9% 2.6% 1.8
ScC . . . . . 2.3% 2.2% 1.9% 1.5% 1.2% 1.8% 1.5
ScC' . . . . . 2.3% 1.5% 1.5% 1.2% 1.1% 1.6% 1.4
ScD . . . . . 0.9% 0.6% 0.8% 0.4% 0.7% 0.7% 1.2
SES
ScA 0.4% -6.9% 0.2% 2.6% -2.6% 3.0% 3.7% 2.4% 2.1% 1.9% 2.5% 1.7
ScC . . . . . 1.9% 2.1% 1.8% 1.3% 1.1% 1.6% 1.4
ScC' . . . . . 1.9% 1.4% 1.4% 1.0% 1.0% 1.4% 1.4
ScD . . . . . 0.5% 0.4% 0.6% 0.2% 0.5% 0.5% 1.1
Baltic FAB
ScA 11% -8.6% 5.5% 9.2% 3.6% 5.2% 5.1% 3.4% 2.6% 2.3% 3.6% 2.3
ScC . . . . . 3.5% 3.2% 3.0% 2.2% 1.8% 2.7% 1.8
ScC' . . . . . 3.5% 2.6% 2.4% 1.9% 1.8% 2.5% 1.8
ScD . . . . . 1.6% 1.5% 1.6% 1.1% 1.2% 1.4% 1.4
Figure 39 (continued). Annual growth per traffic zone and FAB.

58
IFR Movements (thousands)
2008 2009 2010 2011 2012 2019 2020 2025 2030 2035AAGR 2035/ 2012
Traffic Mul-tiple
2035/ 2012
BLUE MED FAB
ScA -0.8% -3.8% 3.6% -0.1% -2.4% 3.7% 4.1% 3.3% 2.8% 2.6% 3.2% 2.1
ScC . . . . . 2.4% 2.3% 2.3% 1.7% 1.4% 2.0% 1.6
ScC' . . . . . 2.4% 1.7% 1.7% 1.3% 1.1% 1.7% 1.5
ScD . . . . . 0.9% 0.7% 0.8% 0.5% 0.7% 0.7% 1.2
Danube FAB
ScA 6.9% -0.4% 6.7% 3.3% -1.5% 6.4% 5.9% 4.7% 3.3% 2.8% 4.5% 2.8
ScC . . . . . 4.7% 4.0% 4.1% 3.0% 2.0% 3.6% 2.2
ScC' . . . . . 4.7% 3.4% 3.6% 2.9% 2.0% 3.4% 2.2
ScD . . . . . 2.9% 2.4% 2.5% 1.8% 2.1% 2.4% 1.7
FAB CE
ScA 3.1% -5.2% 3.2% 2.7% -2.6% 4.4% 5.4% 3.2% 2.5% 2.1% 3.3% 2.1
ScC . . . . . 3.1% 3.0% 2.9% 1.9% 1.4% 2.4% 1.7
ScC' . . . . . 3.1% 2.3% 2.2% 1.6% 1.2% 2.1% 1.6
ScD . . . . . 1.4% 1.2% 1.3% 0.7% 0.9% 1.1% 1.3
FABEC
ScA 0.5% -7.1% 0.5% 4.4% -1.9% 2.7% 3.4% 2.1% 1.7% 1.6% 2.2% 1.6
ScC . . . . . 1.8% 1.9% 1.7% 1.0% 0.9% 1.4% 1.4
ScC' . . . . . 1.8% 1.1% 1.2% 0.8% 0.8% 1.2% 1.3
ScD . . . . . 0.4% 0.2% 0.4% -0.1% 0.2% 0.3% 1.1
NEFAB
ScA 4.5% -6.6% 2.1% 7.0% 1.3% 3.0% 5.6% 1.9% 2.6% 1.6% 2.5% 1.8
ScC . . . . . 1.8% 3.7% 1.4% 1.5% 1.3% 1.6% 1.4
ScC' . . . . . 1.8% 3.4% 1.2% 1.1% 1.2% 1.4% 1.4
ScD . . . . . 0.5% 0.4% 0.5% 0.3% 0.5% 0.4% 1.1
South West FAB
ScA -1.8% -9.4% 1.8% 3.3% -9.8% 2.7% 3.3% 3.0% 2.7% 2.4% 2.7% 1.8
ScC . . . . . 1.5% 1.9% 1.9% 1.4% 1.2% 1.5% 1.4
ScC' . . . . . 1.5% 0.9% 1.3% 1.0% 1.0% 1.2% 1.3
ScD . . . . . -0.0% 0.2% 0.5% -0.1% 0.1% 0.1% 1.0
UK-Ireland FAB
ScA -1.5% -9.5% -4.3% 2.5% -1.5% 2.8% 3.1% 2.2% 1.9% 1.4% 2.2% 1.6
ScC . . . . . 1.8% 1.7% 1.6% 1.1% 1.1% 1.5% 1.4
ScC' . . . . . 1.8% 1.3% 1.4% 1.0% 1.1% 1.4% 1.4
ScD . . . . . 0.7% 0.5% 0.6% 0.4% 0.5% 0.6% 1.1
DK-SE FAB
ScA 2.2% -9.7% 2.4% 5.7% -3.0% 3.2% 4.0% 2.0% 2.0% 1.5% 2.4% 1.7
ScC . . . . . 2.2% 2.5% 1.5% 1.2% 1.0% 1.6% 1.4
ScC' . . . . . 2.2% 1.8% 1.0% 0.7% 0.8% 1.3% 1.3
ScD . . . . . 0.8% 0.1% 0.2% 0.0% 0.2% 0.4% 1.1
Figure 39 (continued). Annual growth per traffic zone and FAB.
Challenges of Growth 2013 Task 4: European Air Traffic in 2035 59
annex e alternatIVe fuelS
The development of sustainable biofuels is recognised as a key component of reducing aviation’s environmental impact. Technological feasibility is no longer considered to be a barrier: drop-in alternative fuels are now approved and being used in limited quantities by some commercial operators. However, current production capacity is limited and production costs are still too high for biofuels to be commercially viable, although some feedstocks and production techniques (e.g. agricultural or municipal wastes) do show potential to be able to reduce costs to a level comparative to conventional jet fuel. However, such cost reductions will be dependent on both technological learning curves and the evolution of the price of oil and carbon. Current analyses suggest that the breakeven point for biomass-to-liquid fuels may be achieved by around 2030 although this varies according to feedstock, production method and potential regulatory requirements. Higher oil prices will bring forward the breakeven point. Conversely, with lower oil prices, the incentive for biofuel production may be reduced. However, a high carbon price will also be a factor: biofuels are currently classed as having zero CO2 emissions under the EU ETS (see Ref. 24, 25, 26).
The 2010 EU Biofuels Flightpath document (see Ref. 25) suggests that jet kerosene prices would need to reach $3/gallon in order for biofuels to begin to breakeven. For scenario C this can be expected by 2030 but may be accelerated by a relatively high carbon price. A similar kerosene price is forecast slightly later for scenario A and won’t receive the same boost from the lower carbon price. This kerosene price is potentially reached much earlier in scenarios C’ and D, and the high projected cost of carbon in scenario D may be an additional incentive, although the development of the biofuels market may be less certain in a politically fragmented scenario.
Sustainability remains a challenge. Indirect Land Use Change (ILUC) where non-agricultural land is converted for food production is a concern, as are total life cycle emissions and the large quantities of water which are often required. Due to limitations in the availability of land and feedstock eventual demand for biofuel will not be met and decisions will need to be made about where in the economy it will be best used and how such distribution could be achieved, a concern for sectors such as aviation which have limited feasible alternatives to jet kerosene. The extent to which carbon capture and storage (CCS) technologies are successfully developed and implemented is also a factor: use of CCS may divert biofuel to power plants so that the carbon which is released can be captured, thus reducing availability for other sectors.
Estimates for the rate of uptake of biofuels by commercial aviation vary significantly. The EU Biofuels Flightpath Initiative is aiming for 2 million tonnes of biofuel use by 2020 (around 4% of total aviation fuel). However, the capacity to produce such quantities doesn’t currently exist so this is a challenging target. By 2030 it can be reasonably expected that the proportion of alternative fuel use will have increased although it is unlikely to be higher than around 10-15%. For 2050 there is a wider range of estimates. The UK Climate Change Committee has conservatively estimated 10%, whilst analysis by the Sustainable Aviation Group suggests 18% may be possible with the right incentives and structures. The 2011 European Commission Transport White Paper proposes an aspirational target of 40% by 2050.
Alternative fuels are not a panacea. However, if sustainably produced from a reliable and cost-effective supply, they will contribute to meeting emissions targets.
60
annex f PolItICal targetS
Challenging national and international political targets have now been established to reduce aviation CO2 emissions. International Civil Aviation Organisation (ICAO) has resolved “to achieve a global annual average fuel efficiency improvement of 2 per cent until 2020 and an aspirational global fuel efficiency improvement rate of 2 per cent per annum from 2021 to 2050, calculated on the basis of volume of fuel used per revenue tonne kilometre performed…[and] to achieve a collective medium term global aspirational goal of keeping the global net carbon emissions from international aviation from 2020 at the same level” (see Ref. 27)
This is reiterated by industry which has adopted a similar goal, although with a 1.5% per annum fuel efficiency target rather than 2%, with the aim of achieving carbon-neutral growth from 2020 and reducing aviation’s overall CO2 emissions by half by 2050 compared to 2005.
The European Union has set a more ambitious target of a 10% reduction in aviation CO2 emissions by 2020 compared to 2005 levels. Further challenging European targets have been set by the High Level Group on Aviation Research (Flightplan 2050) of 75% reduction in CO2 per passenger km, 90% reduction in NOx emissions, and a 65% reduction in perceived noise of aircraft in flight by 2050 (see Ref. 18). The path to achieve this is set out in the EU Advisory Council for Aeronautics Research in Europe (ACARE) Strategic Research and Innovation Agenda (SRiA).
Challenges of Growth 2013 Task 4: European Air Traffic in 2035 61
annex g referenCeS
Published reports from the current and previous Challenges of Growth studies are available at:www.eurocontrol.int/articles/challenges-growth.
1. Challenges of Growth 2013: Task 7: European Air Traffic in 2050, EUROCONTROL June 2013.
2. Challenges of Growth 2013: Task 5: Mitigation of the Challenges, EUROCONTROL June 2013.
3. Challenges of Growth 2013: Task 6: The effects of air traffic network congestion in 2035, EUROCONTROL June 2013.
4. Challenges of Growth 2013: Task 8: Climate Change Risk and Resilience, EUROCONTROL, March 2013.
5. EUROCONTROL 7-year Forecast, Flight Movements and Service Units 2013-2019, EUROCONTROL STATFOR, February 2013.
6. Challenges of Growth 2008, Environmental Update Study, EUROCONTROL/ Omega/ Manchester Metropolitan University/ MetOffice, January 2009.
7. EUROCONTROL Long-Term Forecast 2010: Flight Movements 2010-2030, EUROCONTROL, December 2010.
8. Challenges of Growth 2013: Task 3: Scope, Scenarios and Challenges, EUROCONTROL 2012.
9. EUROCONTROL 7-year Forecast, Flight Movements and Service Units 2013-2019, EUROCONTROL STATFOR, February 2013.
10. High-speed Europe, a sustainable link between citizens, EC Directorate General for Mobility and Transport, 2010.
11. EUROCONTROL 7-year Forecast Update, Flight Movements 2010-2016, EUROCONTROL STATFOR, September 2010.
12. Challenges to Growth Environmental Update Study, EUROCONTROL, Thomas, C., McCarthy, R., Lewis, K., Boucher, O., Hayward, J., Owen, B., and Liggins, F, 2009.
13. Aviation’s Envrionmental Challenges, EASA (European Aviation Safety Agency), 2013 http://www.easa.europa.eu/environment/environmental-challenges.php (Accessed 29/04/2013).
14. Estimated Specific Emissions of CO2 by Transport mode (EEA 30), European Environment Agency, 2011, http://www.eea.europa.eu/data-and-maps/figures/estimated-specific-emissions-of-co2 (Accessed 29/04/2013).
15. Performance Review Report EUROCONTROL, 2011 https://www.eurocontrol.int/sites/default/files/content/documents/single-sky/pru/publications/prr/prr-2011 (Accessed 29/04/2013).
16. Strategic Research and Innovation Agenda Volume 1, ACARE (Advisory Council for Aeronautical Research), Brussels, 2012.
17. The Right Flightpath to Reduce Aviation Emissions, ATAG, Position Paper, UNFCCC Climate Talks, November 2011.
18. Flightpath 2050: Europe’s Vision for Aviation, Report of the High Level Group on Aviation Research, European Commission, 2011, http://ec.europa.eu/research/transport/pdf/flightpath2050_final.pdf (Accessed 29/04/2013)
19. Bridging the Aviation CO2 Emissions Gap: Why Emissions Trading is Needed, Manchester Metropolitan University, Lee; D. S., Lim, L. L. and Owen, B, 2013.
20. A comparison of recent surveys to aircraft noise exposure relationships, TNO report TNO-034-DTM_2009_01799, TNO, Delft, Janssen, S.A. & Vos, H. (2009).
21. Meeting the UK Aviation Target: Options for Reducing Emissions to 2050, UK Comittee on Climate Changes 2009, http://downloads.theccc.org.uk/Aviation%20Report%2009/21667B%20CCC%20Aviation%20AW%20COMP%20v8.pdf (Accessed 29/04/2013).
22. EUROCONTROL Glossary for Flight Statistics & Forecasts, January 2005.
23. www.eurocontrol.int/STATFOR/SID
24. Sustainable Way for Alternative Fuels and Energy in Aviation (SWAFEA): final report to the European Commission, April 2011.
25. EC Biofuels Flightplan Initiative (2010) 2 Million Tonnes per Year: A performing biofuels supply chain for EU Aviation, European Commission, Brussels.
26. Review of the Potential for Biofuels in Aviation: Final Report to the Committee on Climate Change, E4Tech, August 2009.
27. Assembly Resolution A37-19, International Civil Aviation Organisation, 2010, Montreal.


EUROCONTROL
June 2013 - © European Organisation for the Safety of Air Navigation (EUROCONTROL)
This document is published by EUROCONTROL for information purposes. It may be copied in whole or in part, provided that EUROCONTROL is mentioned as the
source and it is not used for commercial purposes (i.e. for financial gain). The information in this document may not be modified without prior written permission
from EUROCONTROL.
www.eurocontrol.int
For further information please contact:
STATFOR, the EUROCONTROL Statistics and Forecast Service
http://www.eurocontrol.int/statfor
STATFOR, the EUROCONTROL Statistics and Forecast Service is ISO 9001:2008 certified.