Small-Scale Sanitation in Egypt: Challenges and Ways Forward

Environmental Management and Sustainable Development
ISSN 2164-7682
2017, Vol. 6, No. 1
http://emsd.macrothink.org 220
Challenges of access to water and sanitation for
sustaining health: A case study from South 24 Parganas,
West Bengal, India
Meena Sehgal
The Energy and Resources Institute (TERI), Darbari Seth Block
IHC Complex, Lodhi Road, New Delhi, 110 003, India
Sumit Kumar Gautam (Corresponding author)
The Energy and Resources Institute (TERI), 4th
Main, 2nd
Cross
Domlur 2nd
stage, Bangalore, 560071, India
Tel: 91-80-2535-6590 E-mail: [email protected]
Priyanka Bajaj
The Energy and Resources Institute (TERI), Darbari Seth Block
IHC Complex, Lodhi Road, New Delhi, 110 003, India
57/34 Nehru Road, Dehra Dun, Uttarakhand, India
Mayukhmala Guha
Child in Need Institute (CINI), Village Daulatpur, P.O.-Pailan
Via- Joka, 24 Parganas (S) - 700104, India
Suneel Pandey
The Energy and Resources Institute (TERI), Darbari Seth Block
IHC Complex, Lodhi Road, New Delhi, 110 003, India
Received: January 10, 2014 Accepted: February 2, 2014
doi:10.5296/emsd.v6i1.11091 URL: https://doi.org/10.5296/emsd.v6i1.11091

Environmental Management and Sustainable Development
ISSN 2164-7682
2017, Vol. 6, No. 1
http://emsd.macrothink.org 221
Abstract
The present study attempts to determine the access to clean water and sanitation essential for
sustaining health. It attempts to identify socio-economic factors which influence access to
clean water within the community. The absence of water-on- premises in a water abundant
area of West Bengal, India showcases some of the challenges in progressing on Sustainable
Development Goal-3.
Eight villages were included in the study and a total of 597 households were enrolled for the
study from 8000 households in the villages. The study includes descriptive analysis of water
access and sanitation parameters, and regression analysis of socio-economic determinants of
exposure. The results reveal that nearly half of the respondents belonged to Above Poverty
Line (APL) while 42.71% were under Below Poverty Line (BPL). Although majority of the
household had access to an improved source of water for drinking, 77.89 % of the
households were using pond water for bathing, washing clothes, utensils and toilet and nearly
37% of households did not have any toilet facility. Regression analysis of use of pond water
indicates that people living in mud huts (kutcha houses) and from religious minority groups
were more likely to use ponds for washing utensils, clothes, bathing and defecated in open
fields and use unimproved sources for drinking water.
The study asserts the need to develop community level preventive measures such as access to
clean water for personal and domestic use and sanitation facilities to protect health.
Keywords: Clean water, Disease prevention, Sustaining health, Open defecation
1. Introduction
According to the Organization for Economic Co-operation and Development (OECD),
financial expenditure on the water supply and sanitation has been 1.01% of the global GDP
during 2000-2010 and this is expected to rise to 1.03% during 2020-2030 (OECD, 2009). As
per estimations, 54% of the people globally had access to piped water in their premises in
2010 as compared to 45% in 1990 (WHO and UNICEF, 2012). World-wide, a total of 2.3
billion people attained access to improved source of potable water during 1990-2012. With
this, the target of halving the proportion of people without access to improved sources of
water was achieved (WHO and UNICEF, 2014). It was also predicted that globally, 2.5
billion people would still be lacking access to improved source of water and around 784
million individuals would be short of access to safe drinking water by the year 2012.
Collectively, ten countries are the home for two-third of the global population without an
improved source of drinking water. China had the maximum number of such people (119
million) followed by India (97 million) (WHO and UNICEF, 2012). Thus, there is a need for
commitment to raise the financial expenditure both locally as well as globally.
India houses about 16% of the world’s population but holds only 4% of global water resource
(NIH, 2010). However, rapidly growing population coupled with scarcity of resources and
impacts of climate change has resulted in serious challenges related to the sustainable
management of the water resources including ensuring the adequate quantity and quality to
meet various needs.

Environmental Management and Sustainable Development
ISSN 2164-7682
2017, Vol. 6, No. 1
http://emsd.macrothink.org 222
According to Millennium Development Goals India Country Report (2014), India witnesses
the significant improvement in drinking water indicator but the progress is relatively slow for
indicators of sanitation practices. National Sample Survey (2012) reported that 88.5% rural
household and 95% urban households in India were getting drinking water from an improved
source; out of this, 46.1% rural and 76.8% urban households had drinking facilities within
their premises. Apart from dichotomy that exists in the sanitation and drinking water facilities
in rural and urban India, inter-state disparity has also been noticed and widely acknowledged.
For instance, the state of Himachal Pradesh reports the highest (94.4%) proportion of
households getting water within premises while this figure stands at 49% for the state of West
Bengal (NSSO, 2012). This statistics is of immense relevance in the light of earlier analysis
of global database from 193 countries which suggests that increasing the number of people
having access to improved water is significantly associated with reduced under five mortality
rate, odds of under-five mortality due to diarrhoea, infant mortality rate, and decreased odds
of maternal mortality ratio (Cheng et al., 2012).
Further, there are strong evidences which demonstrate that open defecation has a strong
positive correlation with stunting (Spears, 2013a, 2013b). A total of 82% of the people
practicing open defecation belongs to developing countries. To address the issue of open
defecation, India launched the Total Sanitation Campaign (TSC) in the year 1999 with an
objective of improving the quality of life of rural people by impacting upon individual health
and providing privacy and dignity to women. However, recent sanitation statistics from India
reveals that 59.4% rural households and 8.8% urban households had no latrine facilities
(Ministry of Statistics and Programme Implementation, 2014). Tripura et al. (2013)
concluded that improved saniation (use of latrine; hand washing) and hygiene condition are
instrumental in reducing the cases of intestinal helminthiasis in under-five children. Similarly,
positive correlation was also reported between having no latrines in households and average
incident rate (per 1000) of diarrhea, enteric fever and viral hepatitis in West Bengal (Nath,
2006). National level government programs such as Total Sanitation Campaign, have
highlighted that six-year-olds who had been exposed to India’s sanitation programme during
their first year of life were more likely to recognize letters and simple numbers on learning
tests than those who were not (Spears and Lambha, 2011).
Health indicators particularly nutrition status reported in national as well district level health
surveys depicts that the population in our study area is vulnerable to water borne diseases due
to reliability on unsafe water and poor sanitation practices at large and needs multi-sectoral
interventions for improving health parameters. Three rounds of District Level Household
Survey [DLHS] have been undertaken by the Ministry of Health and Family Welfare,
Government of India, in the past conducted with periodicity of five years (Round-I in
1998–99, Round-II in 2002–04, Round-III in 2007–08, and DLHS-4 in 2011–12) with the
main objective of providing reproductive- and child health-related database at district level in
India. DLHS (2013) has reported that 28.2%, 37.4% and 37.4% of the under five children in
West Bengal are wasted, stunted and underweight respectively. The anemia levels in West
Bengal are also extremely high with 87.7% of the under five children and 79.2% of pregnant
women respectively suffering from anemia (DLHS, 2013). In addition to drinking water,

Environmental Management and Sustainable Development
ISSN 2164-7682
2017, Vol. 6, No. 1
http://emsd.macrothink.org 223
access to clean water to meet various domestic needs along with sanitary defecation options,
are needed to sustain health for the masses. Thus, the present study determines the access to
clean water and sanitation for sustaining health and to identify socio-economic factors which
influence access to clean water within the community in the absence of water-on- premises in
the water abundant rural communities of the state of West Bengal. The map of the study
region is shown in Figure 1.
Figure 1. The map of the study region
2. Methodology
The study was conducted in eight villages in Bishnupur-I, and Bishnupur-II blocks
(administrative units in a district) of coastal district of South 24 Parganas in the state of West
Bengal. The trained Accredited Social Health Activists (ASHA workers) were engaged in
identifying the various localities suitable to the study’s objectives of interest within these
villages. The health workers, after an extensive field study, prepared the social maps of the
locality, which aided in selecting the households. Out of 8000 existing households, a total of
597 households were enrolled in this study. Systematic random sample of every 10th house in
the locality was selected for the study. When the 10th household was not available for any
reason, then the 11th household was approached for participation in the study. The
questionnaire was administered in each of these households. The questionnaire created for
data collection was translated in local language (Bangla), pilot tested and administered.
Through the questionnaire survey, detailed information pertaining to socio-economic status,

Environmental Management and Sustainable Development
ISSN 2164-7682
2017, Vol. 6, No. 1
http://emsd.macrothink.org 224
sanitation practices, availability and utilization of different water sources, and over-all
awareness level on Water and Sanitation was sought. The collected information was
synthesized and regression analysis was carried out. The used questionnaire is annexed to the
manuscript [Annex 1].
3. Results
The baseline data collected from the surveys illustrates that the majority of the families
(83.42%) were headed by a male member. Three forth (74.37%) of the population were of
Hindu religion. Approximately one fourth of the families belonged to Islam religion and less
than a percent (0.34%) of the population practiced Christianity. Half of the population
belonged to schedule caste, schedule tribes or other backward classes. Approximately 70% of
the respondents and majority of the household heads had attended primary school.
Nearly half (46.23%) of the respondents belonged to Above Poverty Line (APL) category,
42.71% of the respondents were Below Poverty Line (BPL) and 4.86% respondents had
Antyodaya Ration Cards (food subsidy card given to poorest of the poor). Apart from this
6.20% respondents did not have any ration card issued to them. The majority of the
respondents (90.02%) possessed their own land (area less than one acre) while 5.08% of
respondents did not have any land holding. More than half (56.78%) of the respondents were
staying in kutcha houses (wall and roof constructed with mud and straw). Only 22.45% of
respondents had pucca (wall and/or roof constructed with bricks, cement and tiles) house.
Respondents also reported of staying in huts (14.74%) and a small percent (5.03%) had no
house. Nearly 60% of the respondents reported staying in a nuclear family and rest 21.94%
and 21.78% lived in joint and extended families respectively. As high as 91.02% of the
households (91.02%) used electricity as a source of light and 8.17% used kerosene lamps.
Wood (75%), crop residue (30%) and dunk cake (21%) have been reported to be the most
commonly used cooking fuel in the households while kerosene, biogas and charcoal were not
the fuel of choice.
Majority (67%) of the household has access to an improved source of drinking water; these
households fetched water from the community/municipality tap or had a tap in their premises
or used tube well for drinking. Table 1 illustrates the sources of water used for drinking and
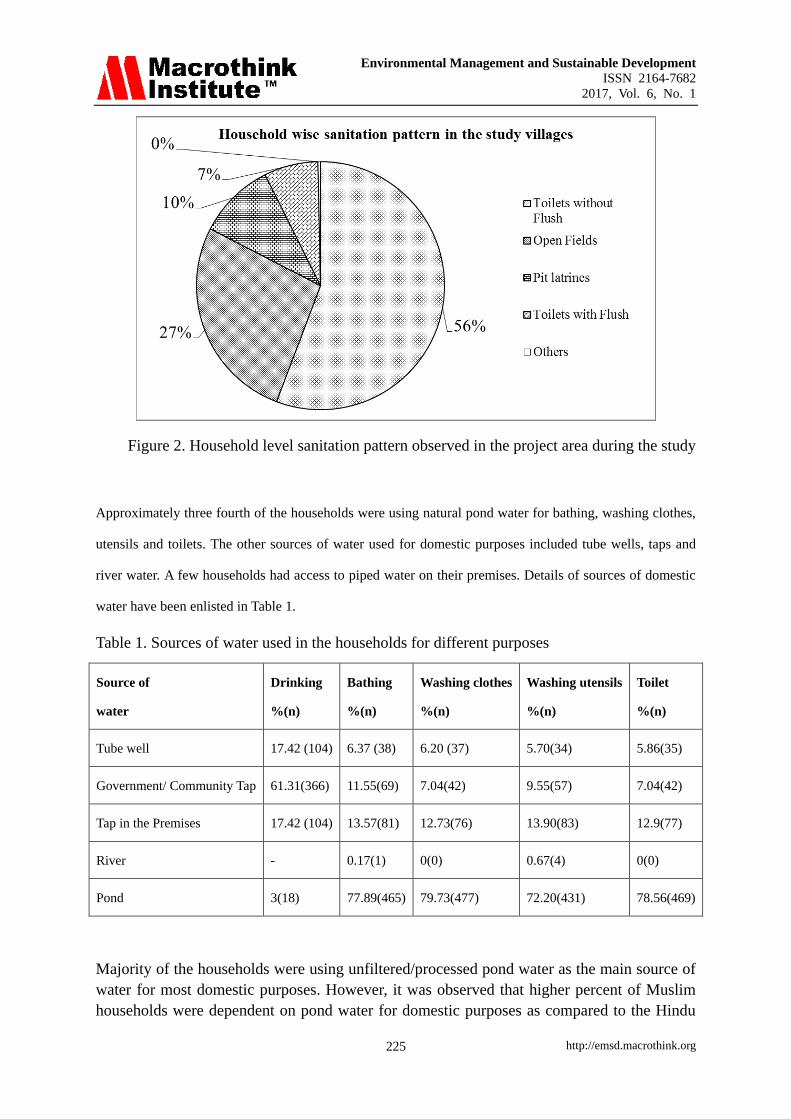
other domestic purposes by the households. Nearly half of the households had toilets without
flush. Only 7.04% of the households reported to have toilets with flushes. However, one in
four of the households practiced open defecation. The sanitation patterns followed in the
household is detailed in Figure 2.
Environmental Management and Sustainable Development
ISSN 2164-7682
2017, Vol. 6, No. 1
http://emsd.macrothink.org 225
Figure 2. Household level sanitation pattern observed in the project area during the study
Approximately three fourth of the households were using natural pond water for bathing, washing clothes,
utensils and toilets. The other sources of water used for domestic purposes included tube wells, taps and
river water. A few households had access to piped water on their premises. Details of sources of domestic
water have been enlisted in Table 1.
Table 1. Sources of water used in the households for different purposes
Source of
water
Drinking
%(n)
Bathing
%(n)
Washing clothes
%(n)
Washing utensils
%(n)
Toilet
%(n)
Tube well 17.42 (104) 6.37 (38) 6.20 (37) 5.70(34) 5.86(35)
Government/ Community Tap 61.31(366) 11.55(69) 7.04(42) 9.55(57) 7.04(42)
Tap in the Premises 17.42 (104) 13.57(81) 12.73(76) 13.90(83) 12.9(77)
River - 0.17(1) 0(0) 0.67(4) 0(0)
Pond 3(18) 77.89(465) 79.73(477) 72.20(431) 78.56(469)
Majority of the households were using unfiltered/processed pond water as the main source of
water for most domestic purposes. However, it was observed that higher percent of Muslim
households were dependent on pond water for domestic purposes as compared to the Hindu

Environmental Management and Sustainable Development
ISSN 2164-7682
2017, Vol. 6, No. 1
http://emsd.macrothink.org 226
households. Almost three quarters of the APL card holding household were also using pond
water for domestic purpose with even higher percentage among below poverty line
households (Table 2).
Table 2. Sanitation and water usage for domestic purpose by religion and economic class of
the households [APL – Above Poverty Line; BPL – Below Poverty Line]
Purpose Religion Ration Card Type Housing
Hindu
% (n)
Islam
%(n)
APL
%(n)
BPL
% (n)
Antyodyoy
%(n)
No Ration
Card %(n)
No house
%(n)
Hut
%(n)
Kutcha
%(n)
Pucca
%(n)
Mansion
%(n)
Not drinking
improved water
96
(428)
90
(136)
92.7
(256)
92.7
(255)
89.66
(29)
100 (37) 1 (3.3) 9
(10.23)
22
(6.49)
1
(0.75)
0
Pond water
for Bathing
73.87
(328)
89.40
(135)
71.17
(213)
80.78
(206)
93.10
(27)
51.35
(19)
96
(29)
87.50
(77)
79.94
(271)
62.69
(84)
4
(66.67)
Pond water for
Washing Clothes
76.58
(340)
88.74
(134)
77.54
(412)
83.14
(212)
93.10
(27)
62.16
(23)
96.67
(29)
85.23
(75)
81.71
(277)
68.66
(92)
50
(3)
Pond water for
Washing Utensils
67.12
(298)
88.08
(133)
67.03
(185)
79.61
(203)
72.41
(21)
59.46
(22)
90
(27)
75
(66)
75.22
(255)
58.96
(79)
66.67
(4)
Toilet 76.07
(337)
86.09
(130)
77.90
(215)
83.07
(211)
83.76
(24)
51.35
(19)
Open Defecation 21
(96)
41.72
(63)
23.55
(65)
30.59
(78)
41.38
(12)
13.8
(5)
70 (21) 54.55
(48)
24.63
(83)
5.97
(8)
0
Table 3 demonstrates the results of regression analysis of use of natural ponds for different
purposes to identify significant social determinants of usage. Multivariate regression analyses
showed use of pond for bathing by religious group (estimate of 0.8512, p value 0.0064, odds
ratio 2.34); by type of housing (estimate -.7004, p value <0.0001, odds ratio 0.496). Another
popular use of pond water was for washing clothes significant differences were noted for type
of housing (estimate -0.5546, p value0.0012, odds ratio 0.574); and by religious group
(estimate 0.6564, p value 0.0313 , odds ratio 1.928). Similarly use of pond for washing
utensils/dishes showed significant association for type of housing, estimate -0.333, p value
0.0262, odds ratio 0.717); and for washing utensils/dishes by religious group (estimate 1.0704,
p value 0.0003, odds ratio 2.917). For other multivariate regression outputs reader is advised
to refer to Table 3.
It was observed that the use of pond water for washing utensils, clothing and bathing was
significantly associated with economic status (represented by type of housing), and religion.
People living in mud huts/ kutcha houses and belonging to minority population (Muslims)
were more likely to use natural pond for washing utensils, clothes, bathing, and defecate in
the open field and less likely to have access to improved sources of water after adjusting for
caste.

Environmental Management and Sustainable Development
ISSN 2164-7682
2017, Vol. 6, No. 1
http://emsd.macrothink.org 227
Table 3. Regression analysis of socio-economic indicators on use of water sources for
personal use and sanitation [APL – Above Poverty Line; BPL – Below Poverty Line]
Variable Model 1:
Use of pond
for bathing
Estimate
(p value)
Odds ratio
95% CI
Model 2:
Use of pond for
washing clothes
Estimate
(p value)
Odds ratio
95% CI
Model 3 :
Use of pond for
washing utensils
Estimate
(p value)
Odds ratio
95% CI
Model 4 :
Defecation in the
open field
Estimate
(p value)
Odds ratio
95% CI
Model 5 :
Not Drinking from
improved sources
Estimate
(p value)
Odds ratio
95% CI
1= Yes
2= No
416
111
423
104
387
140
140
386
28
499
R square 0.05 0.06 0.06 0.16 0.095
P value <.0001 .0003 <.0001 <.0001 0.0016
Ration card:
1-BPL
2-APL
-0.0696
(0.7625)
0.933
(0.594, 1.465)
0.1219
(0.6015)
1.130
(0.715, 1.785)
0.4807*
(0.0240)
1.617
(1.065, 2.455)
0.0336
(0.8785)
1.034
(0.672, 1.592)
-0.7419
(0.0757)
0.476
(0.210, 1.080)
Religion:
1-Hindu
2-Islam
0.8512*
(0.0064)
2.342
(1.27, 4.321)
0.6564*
(0.0313)
1.928
(1.061, 3.504)
1.0704*
(0.0003)
2.917
(1.64, 5.174)
0.7609*
(0.0012)
2.140
(1.349, 3.394)
-0.7419*
(0.0757)
2.85
(1.27, 6.38)
Caste:
General
SC/ ST/OBC
-0.3486
(0.1173)
0.706
(0.456, 1.092)
-0.1103
(0.6243)
0.896
(0.576, 1.393)
-0.3286
(0.1107)
0.720
(0.481, 1.078)
-0.0841
(0.7004)
0.919
(0.599, 1.411)
-0.7038
(0.0960)
0.495
(0.216, 1.133)
Housing:
0- no house
1- hut
2-kutcha
3-pucca
4-mansion
-0.7004*
(<.0001)
0.496
(0.354, 0.697)
-0.5546*
(0.0012)
0.574
(0.411, 0.803)
-0.333*
(0.0262)
0.717
(0.534, 0.961)
-1.2139* (<.0001)
0.297
(0.215, 0.410)
-0.4822
(0.0566)
0.617
(0.376, 1.014)
* significant at pvalue <0.05.
4. Discussion
Analysis of the data highlights that the basic need of water for domestic purposes including
drinking has not been adequately met in the study villages of West Bengal. The occurrence
and spread of several tropical diseases particularly those caused by soil transmitted intestinal
helminths (STHs) are inextricably associated to water, sanitation facilities and hygiene
practices or the lack thereof. STH infections are transmitted by eggs present in human faeces
which in turn contaminate the soil and water in areas where sanitation is poor. World Health
Organization (WHO, 2001) passed a resolution aimed at the "deworming" of 75 percent of all
at-risk school-age through distribution of the medications albendazole or mebendazole to

Environmental Management and Sustainable Development
ISSN 2164-7682
2017, Vol. 6, No. 1
http://emsd.macrothink.org 228
control Soil-Transmitted Helminths (STH). The program has been able to achieve some
success in reducing the severity of worm infections in some areas. This is an important
progress, as infection with STH can lead to anaemia, vitamin A deficiency, stunting,
malnutrition, impaired development, and intestinal obstruction (Donald, 2011). Further,
report on Status of Water Quality in India (2011) states that total coliform and fecal coliform
exceed the set maximum permissible limit for the ponds of West Bengal thereby making the
pond water unfit for drinking or domestic purposes. The Natonal Family health Survey
[NFHS] is a large-scale, multi-round survey conducted in a representative sample of
households throughout India. It is undertaken every six years. Four rounds of the survey have
been conducted since the first survey in 1992–93.
In the study population, 96% of the households were reported to have been using an
improved source of water for drinking; these rates are similar to those reported in NFHS-4
(2015-16) which presented 98% for South 24 Parganas, West Bengal. More than three-fourth
(79.73%) of the rural households use pond water for domestic purposes, putting a large
section of community at risk of preventable diseases which are waterborne, water-based,
water-related, and water-washed such as cholera, typhoid etc. The access to cleaner water for
domestic use is determined by economic status and religion in our study area showcasing
inequity in access to available resources.
Further, in our study area, nearly 37% of households did not have any toilet facility which is
also comparable to rates reported in NFHS-3 data (40%) for West Bengal and DLHS-4 data
(42.3%) for rural West Bengal. Similar evidence has been reported in other studies across the
country. Prasad (2014) reported that one third of the households do not have separate toilets
with flush and one fourth of the population practice open defecation.
Improved water, sanitation and education efforts aimed at prevention through hand washing
and food preparation are critical to reducing spread of the diseases including diarrhea,
intestinal helminthic disease, stunting and infant mortality. Recognizing these linkages,
Government of India launched the National Rural Drinking Water Quality Monitoring and
Surveillance Programme in 2006. The programme focuses on the monitoring and surveillance
of all drinking water sources, decentralization of water quality monitoring, generation of
awareness and building capacity of village institutions. Some of the challenges faced by the
programme are limited trained manpower, infrastructure, data sharing and analysis (Srikanth,
2008).
According to Pacific Institute Research Report (Gleick, 2002) as many as 76 million would
die across the globe, between 2000 and 2020 because of water borne diseases like cholera,
water wash illnesses such as tick and lice, water based like schistosmaiasis or water related
diseases like malaria. The failure to meet basic human needs for water affect the poor
population directly and indirectly as the poor suffer in terms of sickness, lost education,
employment and a massive number of early deaths (Gleick, 2002).
To address inadequate access to clean water for domestic use, and to reduce inequity in
access, there is an urgent need for intervention and development of water smart villages.
These could include a) Building and promoting of simple and safe local technologies/

Environmental Management and Sustainable Development
ISSN 2164-7682
2017, Vol. 6, No. 1
http://emsd.macrothink.org 229
mechanisms such as installation of community based pond water filtration system, water
quality testing kits, water kiosks for providing clean water b) Larger network of water testing
laboratories and lavatories in the community could bring substantial improvements c)
Establishing and maintaining a village based waste water disposal system d) Further
enhancements could be accrued through use of smart IT applications such as Instant
Messaging to improve information flow and timely technical support for non-functioning
technologies, or delivery of anti-helminthic drug supply to vulnerable communities. In the
long term, tracking and indexing villages which provide clean water to meet the wide range
of human needs including drinking, washing, bathing, and rinsing, increasing awareness
among panchayat members to act as demand drivers for improving clean water access,
quality maintenance and empowering of the local administrative units to identify need based
approach to address the local challenges of domestic water and sanitation.
5. Conclusion and Way Forward
The data from the study, field observations and review of literature for nutrition and health
statistics of the study area clearly warrants for investing in improving access to clean water
for personal and domestic purposes and in sanitation facilities (see Figure 1) to sustain health
and build the resilience of the community to associated vulnerability.
Figure 1. Domestic and personal use of untreated pond water in the study region
Low rate of in-premises source of drinking water, limited duration of water supply from
community level tap (stand-post), abundance of shallow natural ponds, accompanied with
widely prevalent practice of open defecation and subsequent dependence on other sources of
water for domestic use indeed increases the risks of preventable diseases. Furthermore, an
association of socio economic factors with access to clean water and availability of laterines
within this water abundant community of West Bengal was observed; showcasing that water
availability is not merely the amalgamation of factors such as infrastructure, availability and
accessibility but is significantly associated with equity within the community.
Our study highlights some of the gaps in preventive and protective measures which are
fundamental for protection of human health at large along with the treatment and curative
approach of the health care system. Prevention partners harnessed from the corporates, the IT,
Environmental Management and Sustainable Development
ISSN 2164-7682
2017, Vol. 6, No. 1
http://emsd.macrothink.org 230
the government, the academia and the community would bring about rich dividends. Future
work may involve understanding the challenges to using municipality water for purposes
other than drinking, determining quality of municipality water supply and at point of use,
prevalence of disease potentially associated with poor quality of water for domestic purposes.
Acknowledgement
The authors sincerely thank Ministry of Health and Family Welfare (MOHFW), Government
of India for providing financial assistance in conducting this survey under the collaborative
research project to assess adverse health outcomes of exposure to household level air
pollutants in rural community. The authors are also thankful to Dr Aditi Roychowdhury,
Division of Women and Child Health and Development (DWCHD), Child in Need Institute
(CINI) for reviewing the paper, health workers at CINI and villagers of Bishnupur I and II
blocks for their cooperation in participating in the survey. Finally, we sincerely acknowledge
the anonymous reviewers for their valuable time.
References
Cheng, J. J., Schuster-Wallace, C. J., Watt, S., Newbold, B. K., & Mente, A. (2012). An
ecological quantification of the relationships between water, sanitation and infant, child, and
maternal mortality. Environmental Health. 11, 4. https://doi.org/10.1186/1476-069X-11-4
District Level Household and Facility Survey (DLHFS). (2012-2013). State Fact Sheet-West
Bengal. Ministry of Health and Family Welfare, Government of India, New Delhi.
Donald, B. (2011). New Reasons Why School-Based Deworming is Smart Developing Policy.
[www.worldbank.org., Accessed on December 02,2014.]
Gleick, P. H. (2002). Dirty Water: Estimated Deaths from Water-Related Diseases 2000-2020.
Pacific Institute for Studies in Development. Environment and Security. Oakland.
Millennium Development Goals India Country Report., (2014). Social Statistics Division,
Ministry of Statistics and Programme Implementation. Government of India. New Delhi,
India.
Nath, K. (2006). Study on Disease Burden Due to Inadequate Water and Sanitation Facilities
in India. Kolkata. Sulabh International Academy of Environmental Sanitation. India.
[www.indiasanitationportal.org, Accessed on March 28, 2015].
National Family Health Survey (NFHS) 3. (2005-2006). Health and Living Condition in
Eight Indian Cities -NFHS-3. Ministry of Health and Family Welfare, Government of India,
New Delhi.
National Sample Survey Office (NSSO). (2012). Ministry of Statistics and Programme
Implementation. Government of India, New Delhi.
OECD. (2009). Strategic financial planning for water supply and sanitation.
[www.oecd.org/env/eap, Accessed on March 18, 2015]
Prasad, R. (2014). New approach needed to curb open defecation? The Hindu.

Environmental Management and Sustainable Development
ISSN 2164-7682
2017, Vol. 6, No. 1
http://emsd.macrothink.org 231
[www.thehindu.com, Accessed on 17 August, 2014]
Spears, D. (2013a). The nutritional value of toilets, “How much international variation in
child height can sanitation explain? Rice [www.riceinstitute.org, Accessed on January 7,
2015]
Spears, D. (2013b). The Long and Short of Open Defecation, The Hindu. 14 March 2013.
Spears, D., & Lambha, S. (2011). Effects of Early-Life Exposure to Sanitation on Childhood
Cognitive Skills: Evidence from India's Total Sanitation Campaign.
[http://elibrary.worldbank.org, Accessed on April 30th
2015]
Srikanth, R. (2009). Challenges of sustainable water quality management in rural India.
Current Science. 97, 317-325.
Status of Water Quality in India. (2011). Ministry of Environment and Forests, Government
of India, Central Pollution Control Board, New Delhi.
Tripura, A., Reang, T., Tripura, K., & Roy, A. (2013). A study of knowledge and practice on
intestinal helminthiasis among rural tribal mothers of under five children in Mohanpur block,
west district of Tripura: a north eastern state of India. Journal of Evolution of Medical and
Dental Sciences. 2, 9081-9087. https://doi.org/10.14260/jemds/1575
Water Resources of India. (2010). National Institute of Hydrology (NIH), Roorkee,
Uttarakhand. India.
WHO and UNICEF. (2012). Progress on drinking water and Sanitation 2012 update.
[www.unicef.org/media/files/JMPreport2012.pdf, Accessed on April 28, 2015]
WHO and UNICEF. (2014). Progress on drinking water and Sanitation 2014 update.
Annex 1: The questionnaire used in the study
1. Number of eligible women (planning pregnancy/ currently pregnant ) in the HH: _______________
Does she smoke beedi/cigarettes regularly?
Level of education (of the women being interviewed):
(1) No formal schooling (2) Primary school (3) Secondary or higher school
(4) Graduation (5) No response
2. Level of education (of the head of the HH):
(1) No formal schooling (2) Primary school (3) Secondary or higher school (4)
Graduation (5) No response
3. Which colour (category) of ration card does your family have?
(1) Above Poverty Line (2) Below Poverty Line (3) Below Poverty Line (Antyodaya Anna
Yojana) (4) No response
4. What is your occupation?
(1) Household work (2) Agriculture (3) Labour (4) Service (5) Business (6)
Others (7) No response (8) Any others, please specify________________
Environmental Management and Sustainable Development
ISSN 2164-7682
2017, Vol. 6, No. 1
http://emsd.macrothink.org 232
5. What is the occupation of the head of the household?
(1) Agriculture (2) Labour (3) Business (4) Service (5) Household work (6)
Others (7) No response (8) Any others, please specify________________
II. Housing characteristics
6. Type of house (Observation by the interviewer)
(1) Pucca (2) Semi- pucca (3) Kutcha (4) Others
(specify)___________
7. Total number of rooms: __________
8. How many meals do you cook in a day? _______________
(1) One (2) Two (3) Three
Energy Sources
What is the primary energy for lighting
1. Kerosene
2. Solar Power
3. Electricity
9. Type of fuel used for cooking and / or water heating (tick mark in the appropriate column)
S.No. Type of fuel Primary fuel Secondary fuel
1. Wood
2. Twigs/branches/crop residues
3. Dung cake
4. Kerosene
5. LPG
6. Biogas (gobar)
7. Charcoal
8. Coal/coke/lignite
9. Any others
Sanitation and Washing facilities
What are you currently using for the following
Hand pump Municipality tap Household level tap River water Pond
bathing
washing clothes
washing dishes
toilet

Environmental Management and Sustainable Development
ISSN 2164-7682
2017, Vol. 6, No. 1
http://emsd.macrothink.org 233
Health related
How many
members
Yes No Yes No
9.1 Do you or other family members consider yourself healthy at present?
9.2 Have you or other family members have ever had any disease
requiring long term treatment?
9.3 Have you or other family members have ever had any disease
requiring long treatment?
9.4 Have you or other family members been on any kind of regular
medication in the past?
If yes, please list:…………………………………………
9.5 Are you or other family members taking any medication at present?
If yes, please list:…………………………………………
9.6 Have you or other family members visited a doctor/ health care
provider in the past 12 month?
Thank you for your participation!
Copyright Disclaimer
Copyright for this article is retained by the author(s), with first publication rights granted to
the journal.
This is an open-access article distributed under the terms and conditions of the Creative
Commons Attribution license (http://creativecommons.org/licenses/by/3.0/).