Challenges for Marine LNG Import to Unlock Gas · This boosted China’s LNG imports in 2016 to 27...
45
www.advisian.com Challenges for Marine LNG Import to Unlock Gas to Power+ across Africa Gary Mocke Prepared for the: AGM of the 2017 South African Maritime Law Association (MLA) Selborne Golf Estate, Hotel and Spa September 1-3, 2017
Transcript of Challenges for Marine LNG Import to Unlock Gas · This boosted China’s LNG imports in 2016 to 27...

www.advisian.com
INSTRUCTIONS FOR CHANGING
COVER IMAGES:
1. Select both images by holding down
the ‘Ctrl’ button
2. Go to DRAWING TOOLS
3. Click the arrow next to SHAPE FILL
4. Click PICTURE
5. Locate the folder that contains the picture you
want to use and click INSERT
INSTRUCTIONS TO RESIZE AND REPOSITION
YOUR IMAGE:
1. Click the image you want to edit
2. Go to PICTURE TOOLS
3. To maintain the original size and format
of the image, click the arrow under CROP and click
FIT
4. To reposition or resize your image, click CROP,
and use the circles on the edge of the image
Challenges for Marine LNG Import to Unlock Gas to Power+ across Africa
Gary Mocke
Prepared for the:
AGM of the 2017 South African Maritime Law Association (MLA)
Selborne Golf Estate, Hotel and Spa
September 1-3, 2017

Outline
Advisian LNG Experience
Africa LNG Market
LNG Terminal Infrastructure
Terminal Performance Indicators
Terminal Siting & Design Approach
Case Studies

www.advisian.com
Advisian LNG Experience
Africa LNG Market
LNG Terminal Infrastructure
Terminal Performance Indicators
Terminal Siting & Design Approach
Case Studies

4
Capability Overview
Specific areas of expertise include: • LNG regasification technology studies
• Hull integration of topside process equipment
• Selection of candidate LNG carriers for conversion into FSRUs,
FSUs
• Vessel hydrodynamic analysis for design of mooring systems
• Nearshore mooring design and breakwater design
• Coastal modelling, including sediment transportation dredging
and
• Side-by-side and tandem offloading technology selection
• Hydrodynamic analysis of vessel interaction between floating
LNG
• Regasification vessel and LNG carriers in side-by-side/tandem
configuration
• Contracting strategy evaluations
• LNG supply logistics and planning
• Offshore and Onshore pipeline design including shore crossing
• Scoping and supervision of geotechnical, geophysical and
metocean studies
• Regasification facility uptime/availability evaluation
• Gas demand and supply studies
• FSRU conversion and new build engineering
Advisian
World-class capabilities
Advisian/WorleyParsons has executed more than 50% of the world-wide nearshore Liquefied
Natural Gas (LNG) regasification projects (planned and in operation), making it the world leader as
an independent engineering service provider to the FSRU and nearshore regasification market.

Advisian
World Leader in Near Shore LNG Regasification
Development
5 Advisian
Houston
London
Melbourne
Centres of Excellence
Project locations
1,2
3
4
5
7
8
9
6
10
11 12
13
14,15,16 27
17,18,20
Singapore
21,22
23,24
19
25,26
1. Cabrillo Port FSRU
2. Oceanway
3. Jamaica LNG Storage and
Regasification
4. FSRU Due Dilligence
5. Mejillones Bay GNL
6. WorleyParsons Marinised Regas
Module
7. Quantum LNG Metocean Study
8. PetroSA FSRU
9. Mozambique Nearshore Regas
10. Malta FSRU Project
11. Egypt FSRU Project
12. Cyprus FSRU Project
13. Bahrain LNG Import Terminal
Project
14. India East Coast Floating LNG
Regas
15. Kakinada FSRU
16. FSRU Economics India
17. Pre-Feasibility 1MDB
18. Melaka Jetty Island Regas Terminal
(Lekas)
19. LNG Import and Regasification
Facility with Power Generation
20. Bumi Armada FSRU
21. Jakarta West Java Bay FRSU
22. West Java LNG Import Terminal
and Power Plant Feasibility Study
23. Bangladesh FSRU
24. LNG Import Terminal Feasibility
Study
25. Philippines FSRU
26. LNG Regasification and Storage
Study
27. Pre-Feasibility Study for
Regasification Terminal
London
Cape
Town

www.advisian.com
Advisian LNG Experience
Africa LNG Market
LNG Terminal Infrastructure
Terminal Performance Indicators
Terminal Siting & Design Approach
Case Studies

7
Global LNG Outlook
Global demand for gas is expected to increase by 2% a year between 2015 and 2030 while LNG demand is set to rise at twice that rate at 4 to 5%. China and India were two of the fastest growing buyers, increasing their imports by a combined 11.9 million tones of LNG in 2016. This boosted China’s LNG imports in 2016 to 27 MT and India’s to 20 MT.
Total global LNG demand increased following the addition of six new importing countries since 2015: Colombia, Egypt, Jamaica, Jordan, Pakistan and Poland. They brought the number of LNG importers to 35, up from around 10 at the start of this century.
The growth of LNG trade has evolved into helping meet demand when domestic gas markets face supply shortages.
LNG trade also is changing to meet the needs of buyers , including shorter-term and lower-volume contracts with greater degrees of flexibility. Some emerging LNG buyers have more challenging credit ratings than traditional buyers, the report noted.
From 2020 to 2030 most new LNG demand growth will be driven by: policy, floating storage regasification units (FSRUs), replacing declining domestic gas production, small scale LNG and transport.
Source: “LNG Outlook: an assessment of the global liquefied natural gas (LNG) market.” Shell (2017)
Natural gas is the fastest growing fossil fuel globally, benefiting from its flexibility of use in multiple demand segments, its competitive economics and its relatively lower emissions profile. LNG is well positioned to account for a substantial share of this growth, as many markets do not have indigenous or adjacent natural gas resources which can be delivered by pipeline.
Increased action around the world to reduce the carbon intensity of economic activity provides additional support for the long-term prospects for LNG.
LNG players will have to adapt to new and different customer expectations and more short-term and flexible commercial arrangements.
More complex market, moving away from high volume, long-term, point-to-point supply arrangements of the past toward more flexible physical supply and commercial arrangements
Evolving new external parameters will likely drive the emergence of new types of participants, such as financial intermediaries, traders, hub operators and more. These are expected to generate new business models to unlock profit down the value chain.
Source: “Navigating the new world of LNG.” Deloitte’s (2017)

Source: Standard Bank – NOC Skills Transfer Workshop (2016)
8
LNG Landed Prices
Landed Price: 2014 Landed Price: 2016
Price in Million BTU

Source: Monetizing Gas Africa (MGA)
Population without access to Electricity (million) X
9
Delivering Gas to Power – LNG Terminal Requirement

African Ports & Terminals – Planned Investments Note: Project info extracted from multiple opportunity databases
TIC relates to marine terminal values only
Source: Mocke. Keynote for Ports & Logistics
Seminar, Bowmans, Oct, 2016
Commodity TIC (m
USD)
Container 31,500
LNG/LPG 14,600
Dry Bulk 11,400
Hydrocarbons 10,700
Other 9,000
Multi Purpose 7,700
Ship/Rig Repair 5,000
Total 89,800

Market Value: Eastern Africa
Source: Mocke. Keynote for Ports & Logistics
Seminar, Bowmans, Oct, 2016
TIC (m USD)
Hydrocarbons
LNG
Multi Purpose
Other
Ship Repair
Dry Bulk
Containers
9,00
0
300
4,50
0

IPP Office: LNG Terminal Port of Richards Bay
Source: Information Memorandum, IPP Programme (Oct 2016) Source: Base image Google Earth

LNG Terminal Siting– Port of Ngqura (Coega)
Source: Information Memorandum IPP Programme (Oct 2016)
LNG terminal LNGC-FSRU
Source: Google Earth

Current LNG Terminal Opportunities (SSA) Client Project Location Stage Comments Start
IPP Office Richards Bay LNG Terminal Richards Bay
Port
Pre-RFQ Gas to Power (G2P) IPP will be
implemented in 2 locations, Coega
(1000MW), Richards Bay (2000MW)
Q2 2018
IPP Office Coega LNG Import Terminal Coega Port Pre-RFQ Q2 2018
TRANSNET Richards Bay LNG Terminal Richards Bay
Port
Transaction
Advisory (TA)
LNG Terminal & Gas pipelines Q4 2017
Ministry of Energy
Mauritius
Port Louis LNG import
Terminal Mauritius Feasibility
Study (FS)
Q4 2017
Central Energy Board
Mauritius
Port Louis Small Scale LNG
Terminal Mauritius RFI Possible BOT for gas supply to CEB Q4 2017
Ghana Ports & Harbour
Authority (GHPA)
Tema & Takoradi Ports LNG
import Terminals Ghana EOI BOT model Q2 2018
Ministry of Energy
(MEEM)
Benin LNG Technical
Advisory Benin TA Q4 2017
West Africa LNG Terminal Developments
Source: Standard Bank – NOC Skills Transfer Workshop (2016)

www.advisian.com
Advisian LNG Experience
Africa LNG Market
LNG Terminal Infrastructure
Terminal Performance Indicators
Terminal Siting & Design Approach
Case Studies
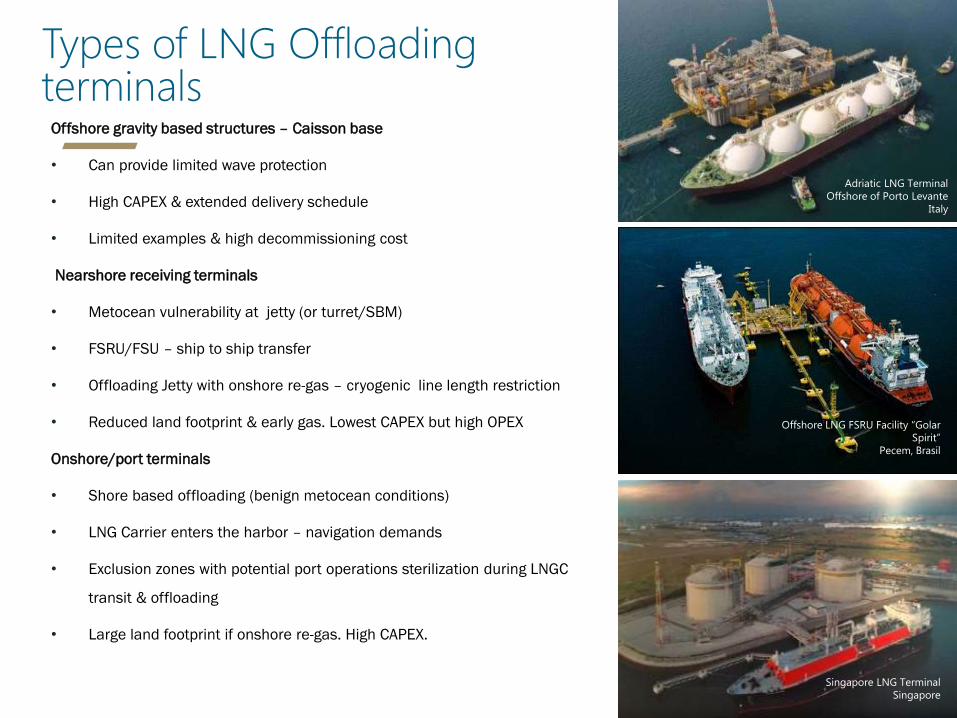
Types of LNG Offloading terminals Offshore gravity based structures – Caisson base
• Can provide limited wave protection
• High CAPEX & extended delivery schedule
• Limited examples & high decommissioning cost
Nearshore receiving terminals
• Metocean vulnerability at jetty (or turret/SBM)
• FSRU/FSU – ship to ship transfer
• Offloading Jetty with onshore re-gas – cryogenic line length restriction
• Reduced land footprint & early gas. Lowest CAPEX but high OPEX
Onshore/port terminals
• Shore based offloading (benign metocean conditions)
• LNG Carrier enters the harbor – navigation demands
• Exclusion zones with potential port operations sterilization during LNGC
transit & offloading
• Large land footprint if onshore re-gas. High CAPEX.
Adriatic LNG Terminal
Offshore of Porto Levante
Italy
Offshore LNG FSRU Facility “Golar
Spirit”
Pecem, Brasil
Singapore LNG Terminal
Singapore

Offloading Configurations
Side-by-Side Tandem
Offloading Configuration
Shuttle tanker loading method
Shuttle tanker requirements
Approach / Mooring (Hs) Offloading /
Disconnecting (Hs)
Side-by-Side Mid-ship manifold Any tanker 1.5 – 2.0 m 2.5 – 3.0 m
Tandem Bow Non-DP Shuttle Tanker 3.5 – 4.5 m 4.5 – 5.0 m
Bow DP Shuttle Tanker 4.5 – 5.5 m 5.5 – 6.0 m

Offshore Mooring Configurations
Berthing Island Mooring
Mooring Type Permanent/Instant-Port
Typical Water Depth Shallow water: up to 20m
Limit environmental conditions Mild Environment (< 2m)
Offloading SBS
Examples in AFRICA -

Spread Mooring
Mooring Type Permanent
Typical Water Depth Very Shallow (15m) to ultra-deep water (3000m)
Limit environmental conditions Moderate to Harsh Environment (Hs=3m-4m)
Offloading SBS possible
Examples in AFRICA ANGOLA: Girassol FPSO / Kizomba B/ Ghana Quantum
Offshore Mooring Configurations
❶ Floating Storage and Regasification Unit (FSRU)
❷ “Spread” mooring
❸ Visiting LNG carrier moored side- by-side for ship-to-ship transfer
❹ Riser
❺ Pipeline End Manifold (PLEM)
❻ Subsea pipeline to shore, 24 inch diameter, 12 km length
❼ Landfall and metering station
❽ 1,200 MW of existing generation
Source: Quantum Power – Ghana LNG

20
Trends: Small Scale LNG and LNG Bunkering
Small LNG Carriers
While conventional LNG carriers are designed to load, transfer and unload full cargoes between two terminal points, small scale vessels have been designed to distribute partial loads to coastal areas in regions such as Africa, the Indian subcontinent, Southeast Asia, the Caribbean, and Northern Europe.
Designed to operate at shallow drafts less than 5m, such carriers can deliver cargoes in areas where conventional LNG carriers cannot access.
LNG Bunkering
Following the establishment of the emissions control areas (ECAs), ship owners are looking for solutions to meet new legislation. LNG is a preferred method to reduce not only SOx and NOx, but also a substantial amount of CO2 emissions.
There is a growing number of European LNG bunkering projects that have been initiated by oil and gas majors.
liquefied gas carriers which designs meet a variety of capacity requirements for the small-scale market, from 500-cbm to 7,500-cbm capacity
Source: Wison Source: Damen

www.advisian.com
Advisian LNG Experience
Africa LNG Market
LNG Terminal Infrastructure
Terminal Performance Indicators
Terminal Siting & Design Approach
Case Studies

Key Parameters Determine FSRU Terminal Viability
Offloading
Availability • To determine the period of time in which offloading
from an LNGC to the FSU/FSRU can take place.
Gas Export
Availability
• To determine the period of time where gas can be
exported from the FSRU to the shore via a pipeline.
LNG Supply
Agreement • e.g. take or pay agreements and their limitations
Terminal Performance
Offloading
Availability
Gas Export
Availability
LNG
Supply
Agreement
Can LNGCs berth and
offload at scheduled times?
Is there enough LNG to be regasified
and sent to shore at all times? Can gas
export be performed at all times?
Fixed offloading schedule? How does
it affect demurrage and cargo
cancellation?

Wave Operability Limit Curves – LNG Terminals
Wave period
Wave height

Sea State Conditions Mean Significant Wave Height - July
Source: ERA-40 1971-2000

Historical Cyclone Tracks

Key Performance Parameters
• The period where berthing/offloading/de-berthing operations can be
completed. Offloading Availability
• The period when there is gas demand and gas is exported. Uptime/Throughput
• The period when there is gas demand and no gas is exported. Downtime
• The period when the charterer remains in possession of an LNGC after the
period agreed to offload LNG. Demurrage
• The event when an LNGC can only offload part of its LNG parcel due to
insufficient storage space in an FSRU to receive the full LNG parcel. Partial Offloading
• Cancelled shipments due to terminal unavailability, critical to take or pay
agreements. Cancelled Cargoes

What is the cost of underperformance?
Levelled cost of energy (LCOE) is a singular value to represent the indicative cost that, if assigned to every unit of gas produced (in mmBtu),
will equal to the total net present cost (NPC) of the project.
Depending on the throughput, typical LCOE of a 25 year project is in the range of 80-290 cents/mmBtu
Gives indication of expected operational cost implications due to:
Downtime at 250mmSCFD, 5% downtime
≈ USD 46-83M per year (loss of opportunity)
Demurrage for ≈30 days demurrage per year
≈ USD 1.2-2.4M per year (possible cost)
Cancelled
Cargoes
for 140,000m3 LNGC, 1 cancelled cargo per year
≈ USD 30-54M per year (possible cost)
Partial
Offloading
for 140,000m3 LNGC, 5% loss cargo from 5 offloads per year
≈ USD 7.5- 13.5M per year (possible cost)
This underperformance amounts to LCOE of 34-61 cents/mmBtu
Total:
USD85M to
USD150M/yr

Simulation Critical Input Data
Metocean
Time
Series
• Historical hindcast
metocean time
series transformed
to site location
Mooring
Analysis
• Offloading
operability limit
curves
• Gas export
operability limit
curves
Navigation
Study • Tugs operability limits
LNG
Supply and
Sales
Agreement
conditions
• LNGC schedule
• Laytime
• Demurrage
• Laydays
• Laycan
UPTIME
ASSESSMENT

Simulation Critical Parameters
UPTIME
FSRU &
LNGC
Capacities
Buffer
Storage LNG/Gas
Demand
Tugs
Capabilities
Night
Time
Restriction
Offloading
Equipment
Capacity
Regas
Unit
Capacity
Gas Export
Equipment
Capacity
Equipment
RAM Operability
Limits
LNGC
Offloading
Schedule
LNG
Supplies
Agreement
Demurrage
Management
Downturn
Partial
Offloadin
g

Example: Good vs Bad Performing Terminal
Offloading Availability
Uptime
Downtime
Offloading Availability
Uptime
Downtime
VS

Example: Good vs Bad Performing Terminal Demurrage
Cancelled Cargoes
Partial Offloads
Demurrage
Cancelled Cargoes
Partial Offloads
VS

www.advisian.com
Advisian LNG Experience
Africa LNG Market
LNG Terminal Infrastructure
Terminal Performance Indicators
Terminal Siting & Design Approach
Case Studies

Value of early site & project concept selection
Important to Select the “project” appropriately in early phases
After Selection … the project maintains value by keeping to cost & schedule (or erodes value through poor execution)

Marine Infrastructure Scope
LNG storage and regasification facilities (using Floating Storage and Regasification Unit (“FSRU”) technology or equivalent facilities such as Floating Storage Units plus shore-based or barge-based regasification facilities);
Supporting port infrastructure including:
• the LNG berth, including the loading platform, with associated topside infrastructure, and mooring and berthing dolphins;
• dredged modifications necessary to the berth pocket;
• terminal access and services trestle; and
• gas transmission pipelines.
Supporting Studies:
• Coastal Modeling for metocean (sea-state) & meteorological quantification – Uptime Analysis
• Mooring & navigations studies (numerical & physical modeling)
• Environmental, including outfall dispersion modeling
• Safety (ie exclusion zone) & risk

35
Siting Optimization - Numerical Modelling
Numerical models are efficient tools to assist in projet siting & understanding, forecasting and managing LNG berthing facility development and operations.
Employing a range of software, one can undertake the following critical studies:
SWAN offshore wave transformation
Simulation of Waves • Design Wave • Wave disturbance • Navigation
Sediment Modelling • Impact on the coastline • Sediment transport • Dredged channel
sedimentation • Evaluation of dredging
plans and sediment spoils
Hydrodynamic Simulation • Current and water
level fields • Navigation
Other models • Oil spills • Dredging spills
Berthing jetty & breakwater orientations

Climate Change Resiliency
36
•Sea Level Rise (SLR)
•Frequency & intensity of Storms/ Cyclones
•Increased Inundation and flooding of coastal land
•Increased shore line erosion and damage to coastal infrastructure
•Increased Coastal Water Temperatures & Ocean Acidification
‒ Project Risks
‒ EIA Complexity
‒ Infrastructure Requirements
‒ Capital Costs
‒ Operating Costs
Imp
act
s Siting is critical
SLR. Source: IPCC (2013) Cyclone Gonu Waves.
Source: Viera, Mocke et al, 2012
Increase
s
Hurricane Matthew.
Source: www.porttechnology.org

www.advisian.com
Advisian LNG Experience
Africa LNG Market
LNG Terminal Infrastructure
Terminal Performance Indicators
Terminal Siting & Design Approach
Case Studies

Nearshore wave conditions – Project 1
Project 1: PetroSA LNG Terminal Mossel Bay

Simulated wave heights for LNG berthing
(source: Mocke et al. FLNG, London, 2014)
LNGC & FSRU
moored at
offshore trestle
LNG Import Unfeasible – Sea State Conditions
39
Background: Offshore LNG carrier (LNGC) transfer to
floating re-gassification unit (FSRU). Transfer of gas
via marine & land pipelines to several offtakers.
Project Suspended as requires wave breakwater to
achieve target operability due to sea state conditions
Possible Alternative: Smaller scale LNGC – FSRU
transfer in vicinity of wave sheltered harbour.
• Dredging requirement
• Reduced LNG carrier size & LNG throughputs
Wave h
eig
ht (m
)

Project 2: IPP Programme (RSA) Richards Bay key site challenges – Exclusion zones
Area Extent of Exclusion Zone
LNG carrier 500m ahead, 250m abeam and astern
while transiting along shipping channels
Load-out
berth
250m radius safety zone while
unoccupied by LNG carrier
250m radius commercial shipping safety
zone during loading operations
1 000m public exclusion safety zone
during loading operations
Cryogenic
pipeline 50m each side of the pipeline
Storage
facility Site perimeter boundary to be located
500m from storage facility
LNG
processing
plant
250m clearance zone to other hazardous
industry inventory
1 000m clearance to residential areas

Simulated surface elevations due to
long waves Source: Msc Thesis, D Stuart, (2013)
LNG terminal LNGC-FSRU
Source: Information Memorandum IPP
Programme (Oct 2016)
Coega Port LNG Terminal challenges – Long waves

Government Support
No cross boarder impact
Local Community acceptance
Balance between reliability and cost
Well defined option assesment
Robust data for option analysis
Cost Competitiveness
Economic Return
Acceptable level of risk
Project 3: LNG Import Terminal Success Story
General Location – area defined
FRSU approach
Schedule First gas 2019
Availability
Cost Effective
Local pipeline
Gas Delivery Conditions
Additional regulatory approval
requirements
Bunker operations
User constraints in the area
Pipeline tie in location and
requirements
Additional sales
Concept Study timing
Community
Engagement
On schedule first gas
Within defined area
Reliability consistent with a
system having Diesel back-up
Givens
Opportunities
LNG Import
Terminal
Success
Unknown
Information
Aligned to existing
infrastructure
Objectives
Achieve Safety and
Environmental
Perfomance
FSRU and facilities interfaces
well aligned
Reliability Consistent with Supply Contracts
Demostrated
Financial Model
Success
Factors
Schedule

Closing
Ramp up of LNG across Africa, combination of lower pricing, alternative power & transport fuel source &
even new gas producing countries turning to LNG to increase gas supply security whilst ramping up gas
production
New LNG supply & contracting models (ie. Small scale LNGC)
For terminal developments ensure that more is done to mitigate risk and improve certainty. Critical
initiatives include:
• Conducting robust technical and financial feasibility studies up front;
• Carry out comprehensive terminal siting & layout optimisation studies early in the process;
Fully explore latest LNG technologies (Terminal, carriers, etc)


DISCLAIMER
This presentation has been prepared by a representative of Advisian.
The presentation contains the professional and personal opinions of the presenter, which are given in good faith. As such, opinions presented
herein may not always necessarily reflect the position of Advisian as a whole, its officers or executive.
Any forward-looking statements included in this presentation will involve subjective judgment and analysis and are subject to uncertainties, risks and
contingencies—many of which are outside the control of, and may be unknown to, Advisian.
Advisian and all associated entities and representatives make no representation or warranty as to the accuracy, reliability or completeness of
information in this document and do not take responsibility for updating any information or correcting any error or omission that may become
apparent after this document has been issued.
To the extent permitted by law, Advisian and its officers, employees, related bodies and agents disclaim all liability—direct, indirect or consequential
(and whether or not arising out of the negligence, default or lack of care of Advisian and/or any of its agents)—for any loss or damage suffered by a
recipient or other persons arising out of, or in connection with, any use or reliance on this presentation or information.