Challenges and successes at the Nkomati Nickel JV: pit-to ... · Challenges and successes at the...
18
The Southern African Institute of Mining and Metallurgy Base Metals Conference 2013 G. Cockburn 151 Challenges and successes at the Nkomati Nickel JV: pit-to-product process improvements G. Cockburn Nkomati Nickel JV Nkomati Nickel JV exploits the Main Mineralized Zone (MMZ) and Peridotitic, Chromatitic Mineralized Zone (PCMZ) ores of the Uitkomst Complex near Machadodorp in the Waterval Boven district of South Africa’s, Mpumalanga Province. Due to factors such as the remote location, stellar growth in production, opencast mining methods, and ore characteristics, a number of innovative processing options were selected. Nkomati has undertaken numerous initiatives over the past few years to improve plant running times, metallurgical performance, and operational profitability. Great emphasis has been placed on effectiveness of management control systems. A number of initiatives such as short interval control and time in state metrics have been implemented. A focus on improvement in availability and asset utilization of key items of equipment has been particularly effective. While these ores are remarkably similar to the Merensky and UG2 reefs, the relatively high base metal sulphide content and mineralogy makes metallurgical treatment somewhat different to the PGM ores of the Bushveld Complex. The low head grades and flotation kinetics distinguishes Nkomati from other base metal operations. Numerous milling and flotation optimization initiatives have resulted in dramatic improvements in throughput, recoveries, and concentrate grades. This paper discusses the metallurgical, operational, and management challenges and the outcomes obtained. Introduction Nkomati Nickel JV has experienced a phenomenal growth rate over the past few years, from a 10 kt/month operation in 2006 to a 700 kt/month complex in 2013. This growth required the re-engineering of virtually every aspect of the operation, from mining new ore types with new methods, ore preparation and processing, to tailings deposition. This expansion occurred against the backdrop of the ongoing global economic crisis. This paper discusses many of the efforts that contributed the turnaround of Nkomati Nickel, with particular emphasis on the challenges and successes at the Main Mineralized Zone (MMZ) plant. The Uitkomst deposit Nkomati Nickel JV exploits the Uitkomst deposit in South Africa’s Mpumalanga Province, in the mountains between Waterval Boven, Machadodorp, and Badplaas (Figure 1).
Transcript of Challenges and successes at the Nkomati Nickel JV: pit-to ... · Challenges and successes at the...

The Southern African Institute of Mining and Metallurgy Base Metals Conference 2013 G. Cockburn
151
Challenges and successes at the Nkomati Nickel JV: pit-to-product process improvements
G. Cockburn Nkomati Nickel JV
Nkomati Nickel JV exploits the Main Mineralized Zone (MMZ) and Peridotitic, Chromatitic Mineralized Zone (PCMZ) ores of the Uitkomst Complex near Machadodorp in the Waterval Boven district of South Africa’s, Mpumalanga Province.
Due to factors such as the remote location, stellar growth in production, opencast mining methods, and ore characteristics, a number of innovative processing options were selected.
Nkomati has undertaken numerous initiatives over the past few years to improve plant running times, metallurgical performance, and operational profitability. Great emphasis has been placed on effectiveness of management control systems. A number of initiatives such as short interval control and time in state metrics have been implemented. A focus on improvement in availability and asset utilization of key items of equipment has been particularly effective.
While these ores are remarkably similar to the Merensky and UG2 reefs, the relatively high base metal sulphide content and mineralogy makes metallurgical treatment somewhat different to the PGM ores of the Bushveld Complex. The low head grades and flotation kinetics distinguishes Nkomati from other base metal operations. Numerous milling and flotation optimization initiatives have resulted in dramatic improvements in throughput, recoveries, and concentrate grades.
This paper discusses the metallurgical, operational, and management challenges and the outcomes obtained.
Introduction
Nkomati Nickel JV has experienced a phenomenal growth rate over the past few years, from a 10 kt/month operation in 2006 to a 700 kt/month complex in 2013. This growth required the re-engineering of virtually every aspect of the operation, from mining new ore types with new methods, ore preparation and processing, to tailings deposition.
This expansion occurred against the backdrop of the ongoing global economic crisis. This paper discusses many of the efforts that contributed the turnaround of Nkomati Nickel, with particular emphasis on the challenges and successes at the Main Mineralized Zone (MMZ) plant.
The Uitkomst deposit
Nkomati Nickel JV exploits the Uitkomst deposit in South Africa’s Mpumalanga Province, in the mountains between Waterval Boven, Machadodorp, and Badplaas (Figure 1).

Base Metals Conference 2013
152
Figure 1. Location of Nkomati Nickel JV
The orebody (Figure 2) is an early age Bushveld layered lenticular mafic-ultramafic intrusion into the basal sediments
of the Transvaal Sequence, approximately 9 km long, and 1500 m wide. The deposit dips north-east at about 4 degrees. This deposit has been exploited by AngloVaal with various partners since the early 1990s. Nkomati Nickel JV is a 50/50 partnership between African Rainbow Minerals and Norilsk Nickel Africa.
The orebody has multiple zones of sulphide mineralization: • MSB: Massive Sulphide Body with Ni grades in excess of 2%. Mined since 1997, now mined out • MMZ: Main Mineralized Zone. Head grades 0.3-0.7% Ni, averaging approximately 0.37% Ni • PCMZ: Peridotitic Chromititic Mineralized zone. Chrome-rich ore with grades of 0.2-1% Ni, 0.23 % Ni average,
chrome grades of 10-15% Cr2O3 • Massive chromitite (often called PCR): stockpiled for a separate chrome washing plant, currently mothballed • Basal Mineralized Zone: unexploited at present.

Challenges and successes at the Nkomati Nickel JV
153
Figure 2. Idealized cross-section of the Uitkomst deposit
Ore production
Currently only the MMZ and PCMZ ores are mined. Current open pit ore production is approximately 650 kt/month, approximately 300 kt of which is from the PCMZ and 350 kt from the MMZ. The MMZ is also mined in the underground mining section, producing approximately 50 kt/ month. Bord and pillar and longhole open stoping methods are utilized.
Figure 3. Life–of-mine ore production profile
It must be noted that the production profile (Figure 3) is periodically optimized and updated as models are tuned and
improved based on the outcomes of the reverse-circulation drilling programme discussed below.
Mineralogy
The primary minerals originally constituting the pyroxenites and peridotites of the Lower Pyroxenite that hosts the MMZ are mainly clinopyroxene, olivine, and plagioclase. Hydrothermal alteration has resulted in extensive alteration of these minerals to amphibole, serpentine, biotite, and talc. Contamination of the ultramafic suite by country rocks

Base Metals Conference 2013
154
accounts for the presence of most of the calcite, dolomite quartz, and plagioclase. Talc content is highly variable within the deposit and irregular (Brits, 2008).
Severely altered talc-rich zones are often associated with pyrite-rich zones, and due to their fast flotation kinetics, flotation of either mineral complicates the flotation process, resulting in lower pentlandite recoveries, dilution of the concentrate with pyrite, and reduced concentrate quality due to higher MgO levels.
Nickel is mainly contained within pentlandite, although a significant proportion (as much as 15%) occurs in solid solution within pyrrhotite, and 1-2% within chlorite. Copper occurs almost exclusively within chalcopyrite, with some occurring as bornite (1-2%).
The MMZ in many ways resembles the Merensky Reef, though having substantially lower PGMs but higher base metal sulphides (typically 5-8 %) with traces of PGMs (predominantly merenskyite). The PCMZ resembles the UG2 Reef, with chrome grades of 7-15% Cr2O3. From the geologist’s perspective, the ores are effectively the same with the exception of the chrome grades. The boundaries of the two ore types are not clearly delineated, making segregation of ore and prevention of cross-contamination challenging.
From a processing perspective, however, the ores are significantly different. Target liberation grind for MMZ ore is 67% -75μm, although recoveries are relatively insensitive to grind. PCMZ ore is extremely sensitive to grind, with target grind of 80% -75 μm, and drastic losses in recovery at lower grind values. Misplaced ore thus directly affects plant performance.
Grade control
An extensive reverse circulation (RC) drilling programme with 25 m x 25 m and subsequently 12 m x 12 m hole spacing has greatly enhanced the ability to model the ore body and so allow far better head grade control. This is critical, considering the variability of grades within the orebody, and the fact a substantial amount of PCMZ ore in particular is below economical viable grade. Management of the resource is thus a vital aspect of maximising the value of the mine. RC drilling data and the resource models derived from it are extensively used in mine to mill reconciliations as well.
Processing challenges
Primary gyratory crusher
With the open pit supplying the vast bulk of the ore, a primary gyratory crusher at the pit was selected with transport by overland conveyors to the two plants. Loading and crushing is alternated between the two ore types, with crushed ore transported by conveyors approximately 3 km to the respective conical stockpiles locates at the plants.
The Metso 54 x 75 Mk2 gyratory crusher was initially viewed as something of the Achilles heel of the operation. The crusher suffered numerous breakdowns and trips and became the major process bottleneck. Although designed with a F80 of 450 mm and a F100 of 1000 mm and a feed rate of 1600-1800 t/h, rocks substantially larger than design were routinely crushed, resulting in trips and mechanical failures. Tramp steel was a major contributor to downtime as well.
Great focus was placed and preventing large rocks from entering the crusher. The ’SPLIT’ camera and image analysis system was introduced to monitor and record the size of rocks on trucks prior to tipping. Unfortunately, this system does not provide automated online estimation of rock sizes. However, it still provides a vital service in monitoring crusher feed PSD (Figure 4). Prevention of large rocks entering the crusher was achieved largely through visual observation by control room operators.

Challenges and successes at the Nkomati Nickel JV
155
Figure 4. PSD analysis of crusher feed using the SPLIT camera system
Interestingly, analysis of the data indicated that high-amperage trips (and damage) on the crusher were not caused by
large rocks alone. Correlation of SPLIT rock size images, vibration, and ampere readings indicated that smaller football-sized rocks, mostly from re-broken boulders fed to the crusher in the absence of fines, were as much of a challenge as very large rocks. This was exacerbated by wear on the liners, where the crusher cavity would wear to a ‘hockey stick’ shaped form, trapping critical-sized rocks, akin to bearings in a race.
Key to improving availability throughput was implementation of strict planned maintenance systems. Key performance indicators such as overall equipment efficiency (OEE) were introduced and proved very effective in monitoring the actual crusher performance. OEE is calculated from actual tons processed divided by the theoretical maximum the equipment can process over the period of consideration. This measure cuts out all the clutter and confusion of allocation of downtime, and provides a ‘bottom line’ performance value.

Base Metals Conference 2013
156
Figure 5. Complex milled throughput.
The overland conveyor system capacity was increased to accommodate the higher crushed tonnages from 1300 t/h to
2000 t/h. This necessitated the installation of larger head pulleys, shallower troughing angles on belts, and faster belt speeds to reduce persistent belt splice failures. Attention to best practices in splicing the steel-cored belts was vital to increase .availability.
Figure 5 clearly indicates the step change in total monthly milled tons for the complex, subsequent to the resolution of throughput constrains around the primary crusher in July/August 2012.
Ore fragmentation
Fragmentation pattern improvements within the pit were realized through redesigned drilling patterns, and changes to the blast timing and blast direction. Interestingly, improved fragmentation was achieved at reduced hole spacing and much reduced powder factors. Production hole spacing was increased from 3.0 m x 3.5 m to 3.5 m x 3.5 m, while maintaining the 10.7 m hole depth and 3 m stemming material depth. Powder factor reduced from 1.9 kg/m2 to 1.4 kg/m2.
Analysis of blasted material indicated that the majority of large rocks originated from the collar, close to the surface. The introduction of 3.0 m stab holes (with a relatively light charge) between production holes resolved this problem.
Further fragmentation improvements were achieved through changing the direction of the blast from north to south (up-dip) to west to east (cross-dip). Substantially slower blast timing was also introduced. The introduction of hole depth counters to ensure consistent hole depths, as well as rigorous quality assurance inspections, contributed to consistency in fragmentation as well as increased production.
MMZ comminution circuit
The MMZ flow circuit design employed a fully autogenous (FAG) primary mill in closed circuit with a vibrating screen and pebble crushers. A secondary ball mill in closed circuit with cyclones supplies feed to the flotation circuit at SG 1.3-1.34, 70% -75 μm at 620 t/h. Design considerations and alternative comminution options considered were discussed by Wolmarans and Morgan (2009).

Challenges and successes at the Nkomati Nickel JV
157
The choice of this circuit caused extensive debate, as the FAG mill was viewed by some as a ‘stone washer’, which would result in excessive metal losses through the sliming of softer nickel minerals. The proponents of the technology advocated that the reduced operating cost far outweighed potential recovery losses.
Figure 6. MMZ milling circuit flow sheet with sampling and monitoring points
MMZ FAG circuit pebble crushers
Optimization of the MMZ milling circuit highlighted the critical importance of the gap setting of the pebble crushers. While the process design criteria specified a closed side setting of 10-13 mm, realistically 19-21 mm was the best that could be achieved without causing frequent mechanical failures to the crushers.
Bypassing the pebble crushers or running with excessive gap setting would increase milling power from 24 kwh/t to 30 kwh/t, with the mill feed rate cut back from 600 t/h to approximately 450 t/h due to overloading of the primary mill with pebbles. In addition, recoveries are affected by as much as 5-10%. While crusher comminution energy contributes just 400 kW of an average total of 16 MW for the FAG/ball mill/pebble crusher circuit (less than 2.5%), the pebble crusher is vital in removing critical-sized material from the circuit.
Extensive re-engineering of the crusher bushes and rigorous attention to planned maintenance, which was contracted to the OEM, allowed the crusher gap to be reduced gradually to 13 mm. The correct running in of the liners over a 4 week period was vitally important to prevent metal–on-metal contact and bush damage. Redesigned liners that do not need the extended running-in period are under development and are expected shortly.
A direct result of the higher-than-design crusher gap setting is the increased crusher throughput, which exceeded the pebble production rate from the FAG mill. This resulted in stop/start operation of the crushers, which propagated ripples through the primary mill, mill discharge sump, and the cyclone circuits. Cyclical changes in froth stability were regularly observed, attributed to shifting grind as the milling circuit flows changed.
Data analysis has indicated that stop/start operation of the crusher increases milling circuit power requirements by approximately 1 kWh/t, or R2.5 million per year at current power costs. Lost recovery costs are substantially higher (Van der Merwe, 2013).
Solving crusher circuit instability was thus vitally important. Various initiatives have been tested to balance crusher rate feed with capacity. While manipulating the screen panel size on the primary mill discharge was effective, knock-on effects on secondary mill performance resulted in less than optimum secondary mill performance.
A novel approach was to increase the crusher speed by approximately 15%. While it may sound counterintuitive to increase a crusher speed to reduce capacity, this encourages choke conditions and reduces throughput, though the exact change in capacity has yet to be quantified. Further refinements have been to re-set pebble bin low and high levels to encourage more frequent (but shorter) stops and starts. Downstream surge bins and other options are currently under consideration.

Base Metals Conference 2013
158
Milling circuit expert system tuning
Tuning of the PxP mill expert control system and other control loops has assisted in improving stability. Assistance from the OEM, FL Smidth, was essential in understanding and optimizing the mill circuit control system in particular. An important philosophy change was the fixing of the number of operating cyclones and varying sump water addition, rather than allowing the control system to open and close cyclones to maintain constant pressure. The effect of varied density of the cyclone feed appears to be less disruptive than opening and closing cyclones.
MMZ comminution circuit operating costs
While detailed modelling of the milling circuit is yet to be done, indications are that milling efficiency on the FAG/ball mill circuit is close to what would be expected in a crushing and ball milling circuit. Comminution circuit operating costs are lower on the MMZ plant than the PCMZ (which utilises conventional crushing and 2 stages of ball milling) plant by approximately R10/t. MMZ plant recoveries are close to or in excess of design figures. The selection of this circuit design over others considered by DRA appears to have been justified.
MMZ flotation Circuit
The MMZ flotation circuit is a relatively standard rougher-cleaner-recleaner configuration (Figure 7). A combined nickel-copper-cobalt and PGM concentrate is collected from the recleaner. Currently the pyrrhotite scavengers function as extended rougher capacity.
Figure 7. MMZ flotation circuit flow diagram
One of the immense challenges on the flotation circuit has been to achieve operational stability, and the resolution of
a number of issues has contributed to the current relatively smooth operation.
Flotation cell level control
Analysis of the cumulative level control valve outputs of the cells in the two parallel rougher banks indicated that the one bank received more flow than the other. In addition, the cell discharge valves would saturate at 100% output more regularly on the one bank, resulting in excessive rougher concentrate volumetric flow to the cleaner circuit. The unequal flow split was attributed to an inherent flaw in the design of the splitter between the two banks.
Excellent results were obtained with the implementation of the Gipronickel mass pull control algorithm. This relatively simple loop adjusts air to the flotation bank based on volumetric concentrate flow. While not being as advanced as some concentrate mass pull control models, this system has been very effective in breaking the cyclical swings in re-circulating load that characterized the circuit.
Flotation cell level control issues were exacerbated by the piping arrangement of the tailings from the rougher and scavenger banks. The gooseneck discharge pipes collect grit unable to be carried over with the tailings. Insufficient head on the gravity flow arrangement to the tailings thickener restricts further easy solutions, and alternative solutions are being considered.

Challenges and successes at the Nkomati Nickel JV
159
Reagent optimization
Talc and serpentine are the main contributors to high MgO levels in the concentrate, which incur severe smelter treatment penalties. Both these minerals have fast flotation kinetics and a strong froth stabilizing action. Under-depression results in vastly increased mass pulls, increased circulating loads and lowing concentrate grades while resulting in recovery losses to boot.
Extensive tuning of the flotation circuit reagents has improved concentrate grades dramatically. Depressant allocation within the circuit has largely been shifted to the cleaners and recleaners. Careful control of collector has limited the over-collection of gangue.
The main value minerals recovered from the MMZ ore are pentlandite and chalcopyrite, while substantial (and variable) amounts of pyrite and pyrrhotite occur. Pyrite and chalcopyrite have substantially faster flotation kinetics than pentlandite, and mass pull control during periods of abnormal ore conditions is critical in maintaining recoveries.
Operator training
It is an easy mistake for inexperienced operators to produce, for example, a high-grade pyrite concentrate, at the expense of nickel recovery. While many operators have extensive exposure to PGM flotation, fewer had base metals flotation experience. Training of operators, control room operators, and metallurgists has paid off very well in terms of reducing and largely eliminating poor plant performance due to misdiagnosis or incorrect response to operational upset conditions. In combination with the ’process recipes’ discussed below, this has vastly improved operation of the MMZ plant.
Plant operational management
Process recipes
Of all the improvements implement at the MMZ plant, the introduction of ’process recipes’ has to rank among the most successful in ensuring consistent operation.
Process recipes stipulate the ranges within which key process variables must be run. These include froth depths, air addition rates, mill power draw, cyclone feed pressures, and SGs and other metallurgical variables. These have added immensely to the stability of the operation of the plant, and have prevented operator-induced instability due to incorrect or excessive corrections of perceived process upsets. Process recipes are adjusted infrequently, and only in consultation with senior management, metallurgists, and production staff, and are signed off at senior level.
SIC or ‘short interval control’ was introduced as a way of guiding operators into checking the key process variables to assess the plant performance on a regular routine basis. This consisted of a set of focused log sheets that required routine checks and monitoring, as well as monitoring of 2-hourly quality control assay results. These consisted of a set of calculations attached to the 2-hourly quality control assay reporting sheets. Flotation circuit recoveries and upgrade ratios across flotation banks, and ratios between Fe/MgO, Ni, and Fe and other indicators of concentrate quality or ore quality warn operators of current or looming plant performance issues.
SIC is being extended with the introduction of TIS (‘time in state’) monitoring. TIS presents the operator with a ‘dial’ dedicated to each section of the plant. Data analysis has been used to assess the key parameters that influence the performance of a specific section, as well at the whole plant. An algorithm monitors multiple contributing factors, such as froth depths, aeration rate, concentrate sump levels, flotation cell feed, and product grades in the case of the flotation circuit

Base Metals Conference 2013
160
Figure 8. Time in state performance indication dials
The operator is presented with an easy-to-read dial, with a bar chart indicating what factor is out of range, and
comments as to what ‘lever’ to pull to correct the situation. Essential to the deployment of the TIS system has been the development and implementation of valid models that underlie the ‘ideal state’ index.
Performance mapping
Extensive analysis of data using ‘performance mapping’ is used. Historical data pertaining to key variables considered by plant operational and metallurgical staff to be the main drivers and indicators of ideal operating performance is analysed, and the correlations are plotted in 2-dimensional space.
These performance maps have been extremely useful in indicating the correlations between various operational variables and process performance. They also indicate how often the process is in various ‘states’, which are often not the ‘ideal state’. The technique has been very useful in indicating appropriate process recipe set-points.
It is important to note that this method is used in conjunction with the plotting of trends and conventional metallurgical evaluation methods.
Figure 9. Performance maps
Challenges and successes at the Nkomati Nickel JV
161
Graphics such as those in (Figure 9) were generated for all major variables deemed to potentially impact plant performance, or to be indicators of conditions that would affect plant performance.
The example in Figure 9 correlates the rougher bank flotation performance with key parameters such as mill power, as well as other indicators such as the rougher motor power draw. While rougher cell power draw is not considered to be a key variable, it is an indicator of cell aeration, flotation feed densities, or wear on the flotation cell mechanism that requires scrutiny. These indicators are used along with the TIS dials to advise operators on what actions should be taken to rectify operating in sub-optimum conditions.
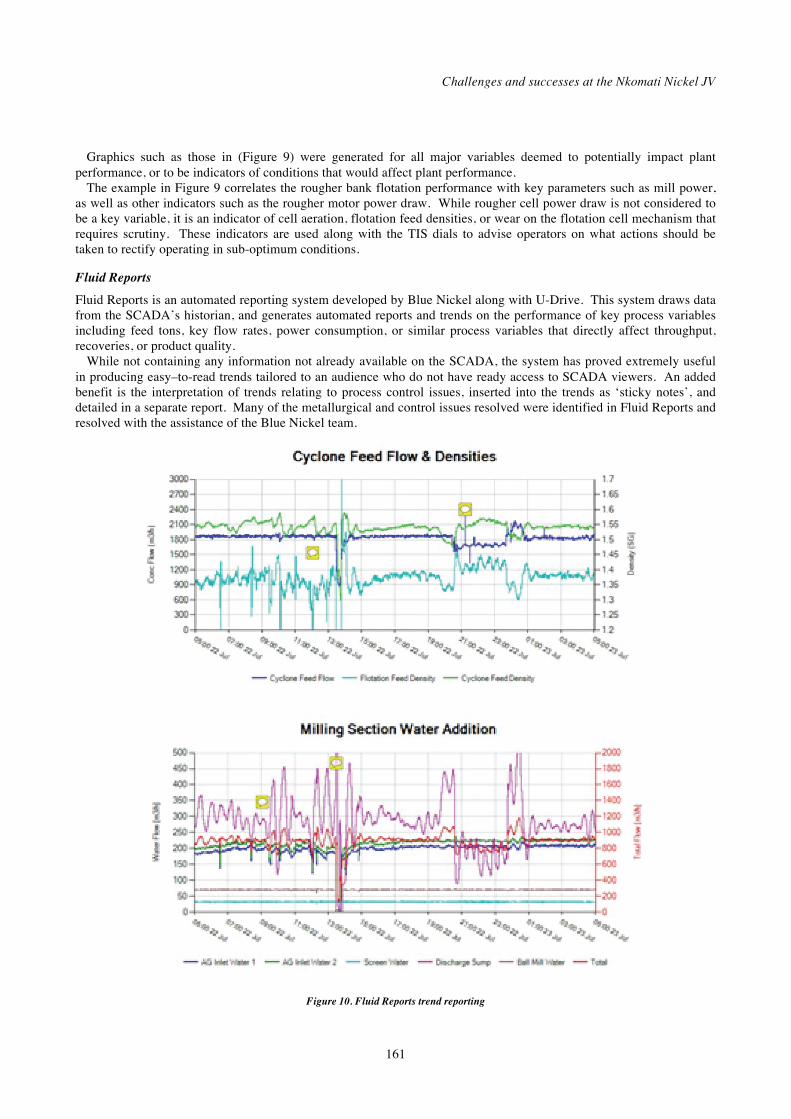
Fluid Reports
Fluid Reports is an automated reporting system developed by Blue Nickel along with U-Drive. This system draws data from the SCADA’s historian, and generates automated reports and trends on the performance of key process variables including feed tons, key flow rates, power consumption, or similar process variables that directly affect throughput, recoveries, or product quality.
While not containing any information not already available on the SCADA, the system has proved extremely useful in producing easy–to-read trends tailored to an audience who do not have ready access to SCADA viewers. An added benefit is the interpretation of trends relating to process control issues, inserted into the trends as ‘sticky notes’, and detailed in a separate report. Many of the metallurgical and control issues resolved were identified in Fluid Reports and resolved with the assistance of the Blue Nickel team.
Figure 10. Fluid Reports trend reporting

Base Metals Conference 2013
162
A similar user-configurable web-based application allows real-time trends to be viewed from any computer or smartphone. These features are aimed at providing better support to operational staff outside of office hours without the need for engineering, instrumentation, or metallurgical staff to be called out in the case of upset conditions.
Management systems
Lastly, the benefits of strong focused leadership have to be recognized. Recent management changes, bringing fresh ideas and methods, have had a very positive influence on productivity.
Some of the most effective tools implemented were the ‘Gap’ list and ‘5 Why’ problem-solving methodologies. This contributed to a halving of the monthly mill trip rate in one month, from approximately 60 trips to less than 30. Current efforts are aimed at dropping this figure to below 10 trips per month.
The importance of housekeeping for morale and discipline cannot be understated. The mills (Figure 11) are arguably the largest, most expensive, and most visible items on a plant.
Figures 11. The mills in the MMZ circuit

Challenges and successes at the Nkomati Nickel JV
163
Figure 12. Lube rooms
The condition and maintenance standards on the mills provide immediate visual reference for the housekeeping and
maintenance standards set for the rest of the operation.
Plant performance improvements
Numerous efforts were conducted simultaneously to resolve the metallurgical, operational, and management issues discussed above. Isolation of the contribution of individual process changes is thus difficult.
The impact of the introduction of new management techniques can probably best be seen in the reduction in mill trips. A step change in mill trips coincided with new management appointments in the middle of 2012 (Figure 13).

Base Metals Conference 2013
164
Figure 13. MMZ mill breakdown analysis
It can be seen that mill stoppages due to instrumentation issues persisted for the duration of the period ending June
2013. It must stressed that this is not due to a failing of the management systems implemented, but rather to the time taken to resolve systemic instrumentation issues.
Reduced mill breakdowns, as well as the resolution of maintenance and process throughput issues at the primary crusher, can largely be credited with the improved MMZ plant throughput, as can be seen in Figure 14. Step change improvements in milled tons can be seen from mid-July 2012.

Challenges and successes at the Nkomati Nickel JV
165
Figure 14. MMZ plant thoughput
Poor mill throughput in July 2012 was due to downtime attributed to pre-existing damage to FAG mill bearings and
the lube system. Throughput on the MMZ plant has exceeded nameplate tonnages regularly since, and is expected to do so more consistently on the conclusion of current improvement projects.
The metallurgical impact of the efforts to improve milling circuit stability, as well resolve the issues concerning the pebble crushers, are difficult to isolate from the impact of efforts to optimize the flotation circuit control.
While step change improvements in throughput are apparent the case of crusher and milled tonnes, gradual improvements in recovery are apparent. Figure 15 shows the monthly nickel recovery figures.

Base Metals Conference 2013
166
Figure 15. MMZ plant nickel recovery
Conclusions
Despite a number of challenges, the Nkomati Nickel JV has achieved very strong growth in production over the past year.
A number of major equipment reliability and throughput issues at the mills and primary crusher were resolved, allowing for increased concentrate production. This has been achieved by the optimization of the existing equipment, without major capital investment.
The successful introduction of problem solving methodologies such Gap lists and 5 Whys played a significant role in identifying and addressing equipment and operational issues.
Close cooperation with OEMs was crucial in resolving the issues around both the Metso primary crusher, and FLS pebble crushers.
Improved fragmentation was achieved at lower powder factors, allowing increased primary crusher capacity and less downtime on the primary crusher.
Improved mill throughput and more stable milling circuit operation were achieved, together with increased milling energy efficiency, through resolution of maintenance and operational issues around the pebble crushers. The importance of achieving design operational set-points on key equipment such as pebble crushers in a FAG circuit is clear. The operating cost of the FAG mill is approximately R10 per ton cheaper than the conventional crushing and ball milling circuit of the PCMZ plant.
Numerous flotation circuit optimization projects, including the implementation of ‘process recipes’, Gipronickel mass pull control, IME’s time in state monitoring and performance mapping, as well as the use of Blue Nickel’s Fluid Reports, have collectively contributed to recovery improvements of 13.1% year–on-year (62.3% in 2011/2012 to 75.4% in 2012/2013).
Production trends indicate that the improvements are sustainable and that figures for the year ahead should surpass the previous year’s performance.

Challenges and successes at the Nkomati Nickel JV
167
This effort cannot be attributed to a single department, but is rather the culmination of the combined efforts of mining, engineering, production, and metallurgy. The input of various consultants, in the development of analytical and information systems tools as well as in equipment and throughput issues, has been invaluable, as has been that of the engineering consultants and head office advisors.
References
Britz, J. 2008. High level review on the mineralogical variability of the Main Mineralized Zone at Nkomati Mine.
Internal Memorandum, Norilsk Nickel Africa, 18 July 2008.
Van der Merwe, K. 2012. Primary crusher report dd12Jul2012. Report, IME, 12 July 2012.
Van der Merwe, K. 2013. Pebble crusher performance March 2013. Report, IME, 13 March 2013.
Wolmarans, E. and Morgan, P. 2009. Milling circuit selection for Nkomati 375ktpm concentrator. 5th Southern African
Base Metals Conference, Kasane, Botswana. Southern African Institute of Mining and Metallurgy, Johannesburg.
pp. 269-290.

Base Metals Conference 2013
168