Ch7 Section 3: Confidence Intervals and Sample Size for...
12
CH7: Confidence Intervals and Sample Size Santorico - Page 242 Ch7 Section 3: Confidence Intervals and Sample Size for Proportions Belief in Haunted Places A random sample of 205 college students was asked if they believed that places could be haunted, and 65 of them responded yes. In this section we’ll learn how to estimate the true proportion of college students who believe in the possibility of haunted places. According to Time magazine, 37% of Americans believe that places can be haunted. Source: Time magazine, Oct. 2006.
Transcript of Ch7 Section 3: Confidence Intervals and Sample Size for...

CH7: Confidence Intervals and Sample Size Santorico - Page 242
Ch7 Section 3: Confidence Intervals and Sample Size for Proportions
Belief in Haunted Places
A random sample of 205 college students was asked if they believed that places could be haunted, and 65 of them responded yes. In this section we’ll learn how to estimate the true proportion of college students who believe in the possibility of haunted places.
According to Time magazine, 37% of Americans believe that places can be haunted. Source: Time magazine, Oct. 2006.
CH7: Confidence Intervals and Sample Size Santorico - Page 243
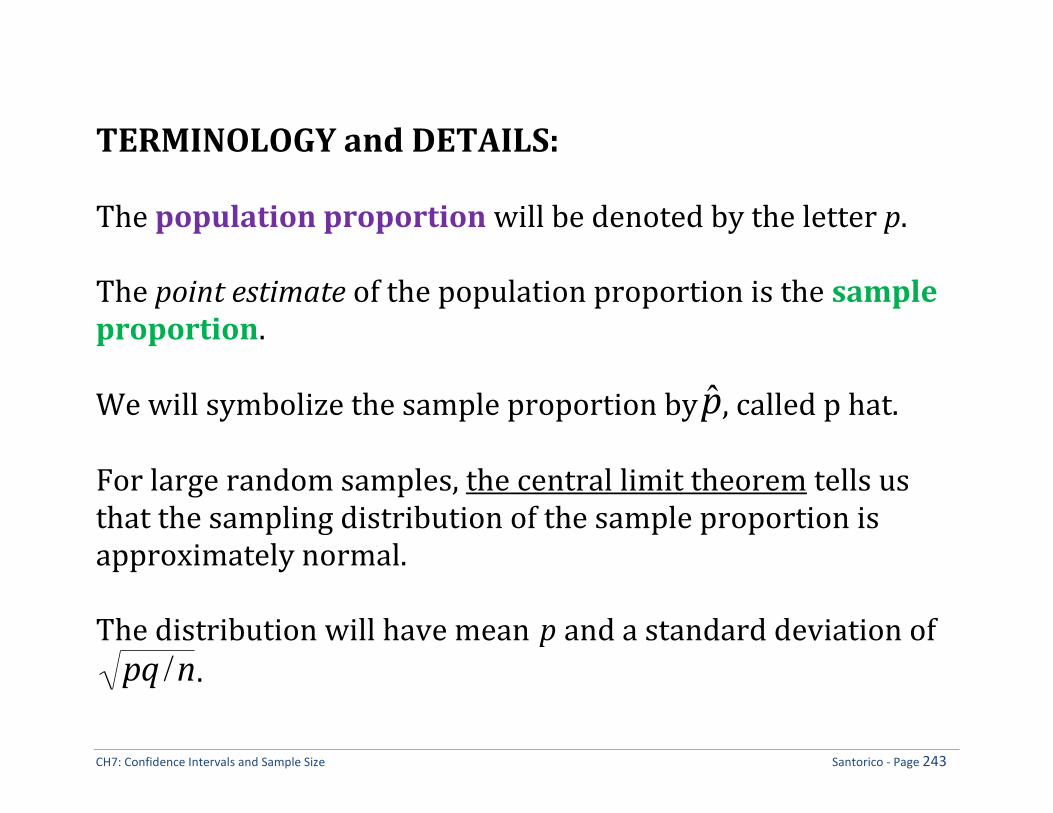
TERMINOLOGY and DETAILS:
The population proportion will be denoted by the letter p. The point estimate of the population proportion is the sample proportion. We will symbolize the sample proportion by
ˆ p , called p hat. For large random samples, the central limit theorem tells us that the sampling distribution of the sample proportion is approximately normal. The distribution will have mean
p and a standard deviation of
pq /n.
CH7: Confidence Intervals and Sample Size Santorico - Page 244
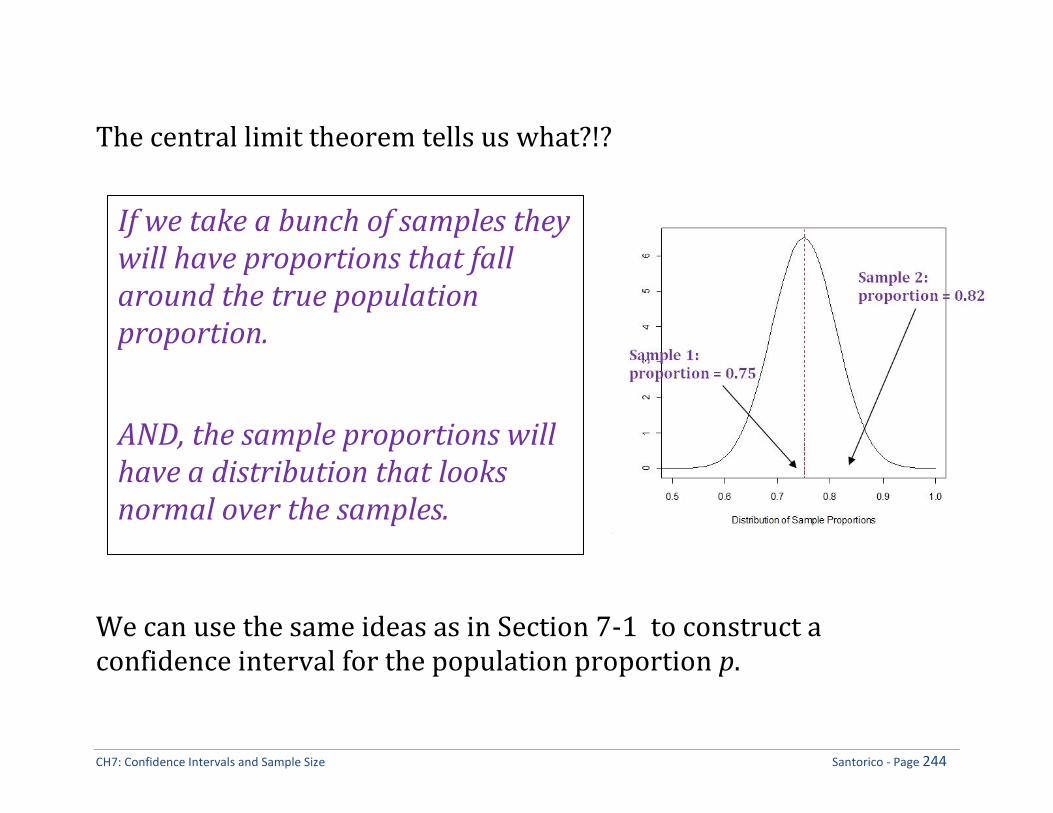
The central limit theorem tells us what?!?
We can use the same ideas as in Section 7-1 to construct a confidence interval for the population proportion p.
If we take a bunch of samples they will have proportions that fall around the true population proportion.
AND, the sample proportions will have a distribution that looks normal over the samples.

CH7: Confidence Intervals and Sample Size Santorico - Page 245
Let’s look at a simulation experiment to reinforce this concept: The main website for the simulation is
http://socr.ucla.edu/htmls/SOCR_Experiments.html You will want to select “Binomial Coin Experiment” in the
drop down menu on the right Here the coin represents the binomial event that
corresponds to the proportion. You can change the sample size, n, and the population, p. And, create samples! Try different combinations and see what the sampling
distribution for the sample proportion looks like. This is the Central Limit Theorem!

CH7: Confidence Intervals and Sample Size Santorico - Page 246
Formula for a Confidence Interval for a Proportion Assumptions:
1. The data are a random sample from the population. 2. Both
n ˆ p and
n ˆ q are each greater than or equal to 5.
Formula:
ˆ p z /2
ˆ p ̂ q
n
Rounding Rule for a confidence interval for a proportion: round to 3 decimal places.
Concept: Once we construct a confidence interval for a population proportion, what’s the probability our interval contains the true population proportion?
CH7: Confidence Intervals and Sample Size Santorico - Page 247
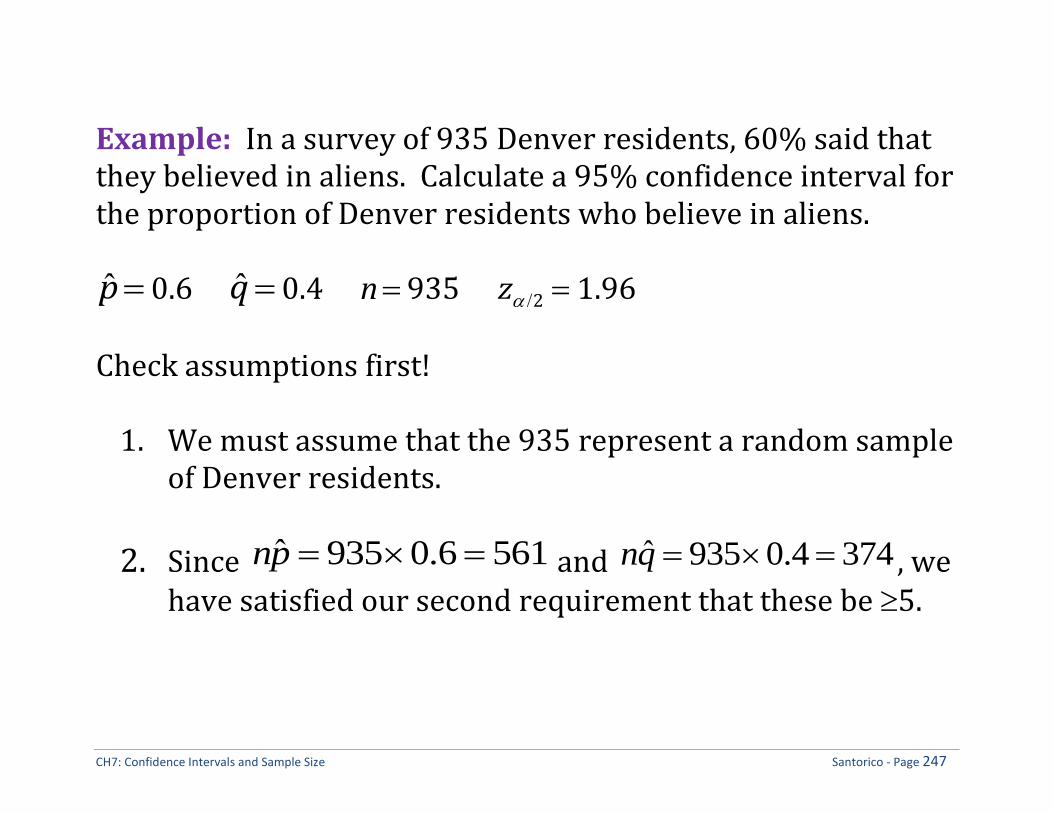
Example: In a survey of 935 Denver residents, 60% said that they believed in aliens. Calculate a 95% confidence interval for the proportion of Denver residents who believe in aliens.
ˆ p 0.6
ˆ q 0.4
n 935
z /2 1.96 Check assumptions first!
1. We must assume that the 935 represent a random sample of Denver residents.
2. Since ˆ 935 0.6 561np and ˆ 935 0.4 374nq , we have satisfied our second requirement that these be 5.

CH7: Confidence Intervals and Sample Size Santorico - Page 248
Next compute the interval:
/2
ˆ ˆ 0.6 0.4ˆ 0.6 1.96
935
0.6 0.0314019
(0.569,0.631)
pqp z
n
Finally, interpret: We are 95% confident that the proportion of Denver residents that believe in aliens is between 0.569 and 0.631.

CH7: Confidence Intervals and Sample Size Santorico - Page 249
Back to our motivating example: A random sample of 205 college students was asked if they believed that places could be haunted, and 65 of them responded yes. Estimate the true proportion of college students who believe in the possibility of haunted places with 99% confidence.
ˆ p
ˆ q
n
z /2 Check assumptions:

CH7: Confidence Intervals and Sample Size Santorico - Page 250
Compute interval:
ˆ p z /2
ˆ p ̂ q
n
Interpret!

CH7: Confidence Intervals and Sample Size Santorico - Page 251
Sample Size for Proportions
Similar to Section 7-1, we can determine the sample size necessary to achieve the desired precision of a confidence interval.
Formula for Minimum Sample Size Needed for Interval Estimate of a Population Proportion:
n ˆ p ̂ q z /2
E
2
, where E is the desired level of precision. If
necessary, round up to obtain a whole number.
If an estimate of the proportion isn’t given, use
ˆ p 0.5 since this is the worst case scenario (you will have to sample the most subjects to obtain the desired precision).

CH7: Confidence Intervals and Sample Size Santorico - Page 252
Example: How large a sample should be surveyed to estimate the true proportion of college students who do laundry once a week within 3.5% with 99% confidence? A previous study placed the proportion around 75%.
2 2
/2 2.575ˆ ˆ 0.75 0.25 1014.892 1015
0.035
zn pq
E

CH7: Confidence Intervals and Sample Size Santorico - Page 253
Example: A research wishes to estimate the proportion of executives who own a car phone. She wants to be 90% confident and be accurate within 5% of the true proportion. Find the minimum sample size necessary.
n ˆ p ̂ q z /2
E
2