Ch41 The Price System, Demand and Supply, and Elasticity Chapter 4.
58
ch4 1 The Price System, Demand and Supply, and Elasticity Chapter 4
-
Upload
jeffry-warren -
Category
Documents
-
view
217 -
download
1
Transcript of Ch41 The Price System, Demand and Supply, and Elasticity Chapter 4.
ch4 1
The Price System, Demand and Supply, and
Elasticity Chapter 4
ch4 2
The Price System:Rationing and Allocating Resources
• The market system, also called the price system, performs two important and closely related functions:
1. Resource allocation: the market system determines the allocation of resources among produces and the final mix of outputs.
2. Price rationing: the market system, an automatic mechanism, distributes scarce goods and services to consumers when quantity demanded exceeds the quantity supplied on the basis of willingness and ability to pay.

ch4 3
Price Rationing • The price system eliminates a shortage as shown in the figure on the left.
• A decrease in supply creates a shortage at the original price.
• The lower supply is rationed to those who are willing and able to pay the higher price

ch4 4
Price Rationing • Suppose in 2003 that 15.000 square miles of lobstering waters off the coast of Maine are closed. The supply curve shifts to the left.
• Before the waters are closed, the lobster market is in equilibrium at the price of $3.27 and a quantity of 81 million pounds.
• The decreased supply of lobster leads to higher prices, and a new equilibrium is reached at $4.50 and 60 million pounds (point B) so the shortage is automatically eliminated by price mechanism.

ch4 5
Price Rationing
• The adjustment of price is the rationing mechanism in free market.
• Price rationing means that whenever there is need to ration a good-that is, when a shortage exist- in a free market, the price of the good will rice until quantity supplied equals quantity demanded- that is, until the market clears.
ch4 6
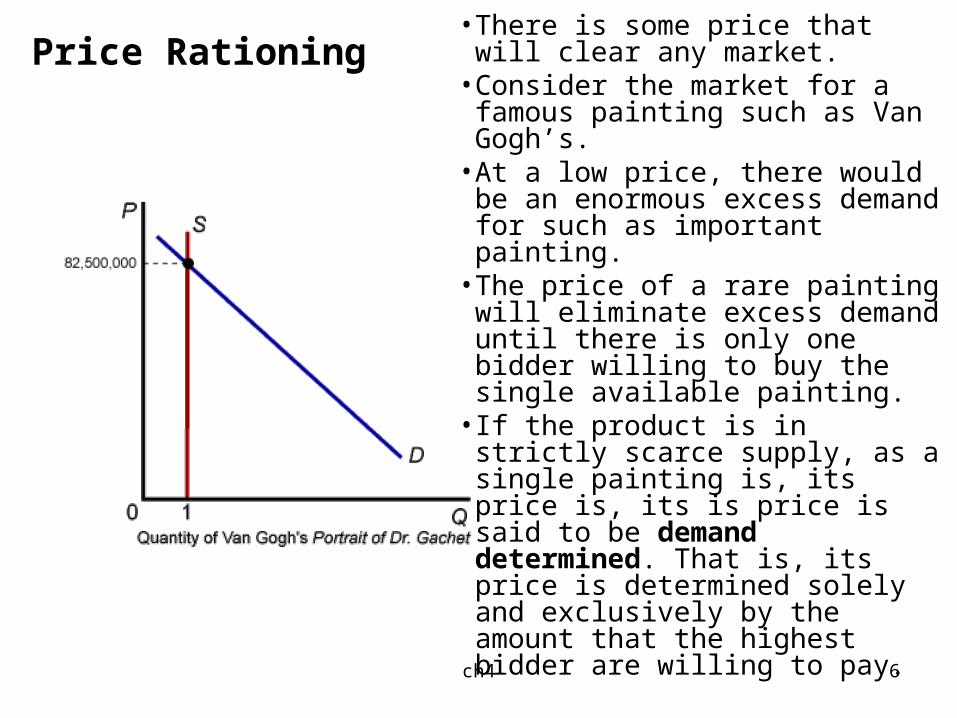
Price Rationing• There is some price that will
clear any market. • Consider the market for a
famous painting such as Van Gogh’s.
• At a low price, there would be an enormous excess demand for such as important painting.
• The price of a rare painting will eliminate excess demand until there is only one bidder willing to buy the single available painting.
• If the product is in strictly scarce supply, as a single painting is, its price is, its is price is said to be demand determined. That is, its price is determined solely and exclusively by the amount that the highest bidder are willing to pay.

ch4 7
Constraints on the Market
• On occasion, both governments and private firms decided to use some mechanism other than the market system to ration an item for which there is excess demand at the current price.
• Policies designed to stop price rationing are commonly justified in a number of ways.
• Various schemes to keep price from rising to equilibrium are based on several perceptions of injustice, among them:– that price-gouging is bad,
– that income is unfairly distributed, and
– that some items are necessities, and everyone should be able to buy them at a “reasonable” price.

ch4 8
Constraints on the Market
• Regardless of the rationale, the following examples will make two things clear:
1. Attempts to by pass rationing in the market and to use alternative rationing devices are much more difficult and costly than they would seem first glance.
2. Very often, such attempts distribute costs and benefit among households in unintended ways.

ch4 9
Constraints on the Market
• A price ceiling is a maximum price that sellers may charge for a good, usually set by government.
• In 1974, the government set a price ceiling to distribute the available supply of gasoline.
• At an imposed price of 57 cents per gallon, the result was excess demand or supply shortage.
ch4 10
Alternative Rationing Mechanisms• Because the price system was not allowed to function,
an alternative rationing system had been found to distribute the available supply of gasoline. Several devices were tried that are:
– Queuing is a nonprice rationing system that uses waiting in line as a means of distributing goods and services.
– Favored customers are those who receive special treatment from dealers during situations when there is excess demand.
– Ration coupons are tickets or coupons that entitle individuals to purchase a certain amount of a given product per month or a given period.

ch4 11
Alternative Rationing Mechanisms
• Attempts to restrict prices often result in the evolution of a black market.
• A black market is a market in which illegal trading takes place at market-determined prices.
• Thus the “real” price of the good will rise to the market-clearing price that is higher than restricted price.

ch4 12
Alternative Rationing Mechanisms
• Even it is illegal, it is virtually impossible to stop black market from developing.
• The problem with rationing systems is that excess demand is created but not eliminated.
• No matter how good the intentions of private organizations and governments, it is very difficult to prevent the price system from operating and to stop the willingness to pay from asserting itself.
• Every time an alternative is tried, the price system seams to sneak in the back door. With favored consumers and black markets, the final distribution may be even more unfair than that which would result from simple price rationing.
ch4 13
Prices and the Allocation of Resources
• Thinking of the market system as a mechanism for allocating scarce goods and services among competing demanders is very revealing, but the market determines much more than just the distribution of final outputs.
• It also determines what gets produced and how resources are allocated among competing uses.
• Consider a change in consumer preferences that leads to a shift in demand for a specific good or service and also a change in price.
• Price changes resulting from shifts of demand cause profits to rise or fall.
ch4 14
Prices and the Allocation of Resources
• The price changes leads to changes in profits.• Profits attract capital; losses lead to disinvestment.• Higher wages attract labor and encourage workers
to acquire skills.• At the core of the system, supply, demand, and prices
in input and output markets determine the allocation of resources and the ultimate combinations of things produced.

ch4 15
Price Floors
• A price floor is a minimum price below which exchange is not permitted.– The most common example of a price floor is
the minimum wage, which is a floor set under the price of labor.
• Whenever a price floor is set above equilibrium, an excess supply or higher quantity supplied than quantity demanded will be on the market.

ch4 16
Supply and Demand Analysis: An Oil Import FeeThe basic logic of supply and demand is a powerful tool of analysis. As an extended example of the power of this logic, we will consider a case to impose a tax on imported oil.
• At a world price of $18, imports are 5.9 million barrels per day.
• The tax on imports causes an increase in domestic production, quantity imported falls and a tax revenue for the government is generated ($x3.2=$19.2).

ch4 17
Supply and Demand and Market Efficiency
• Clearly, supply and demand curves help explain the way that markets and market price work to allocate scarce resources. Recall that when we try to understand “how the system works,” we are doing “positive economics.”
• Supply and demand curves can be used to illustrate the idea of market efficiency, an important aspect of “normative economics.”
• To understand the ideas we first must understand the concepts of consumer and producer surplus.
ch4 18
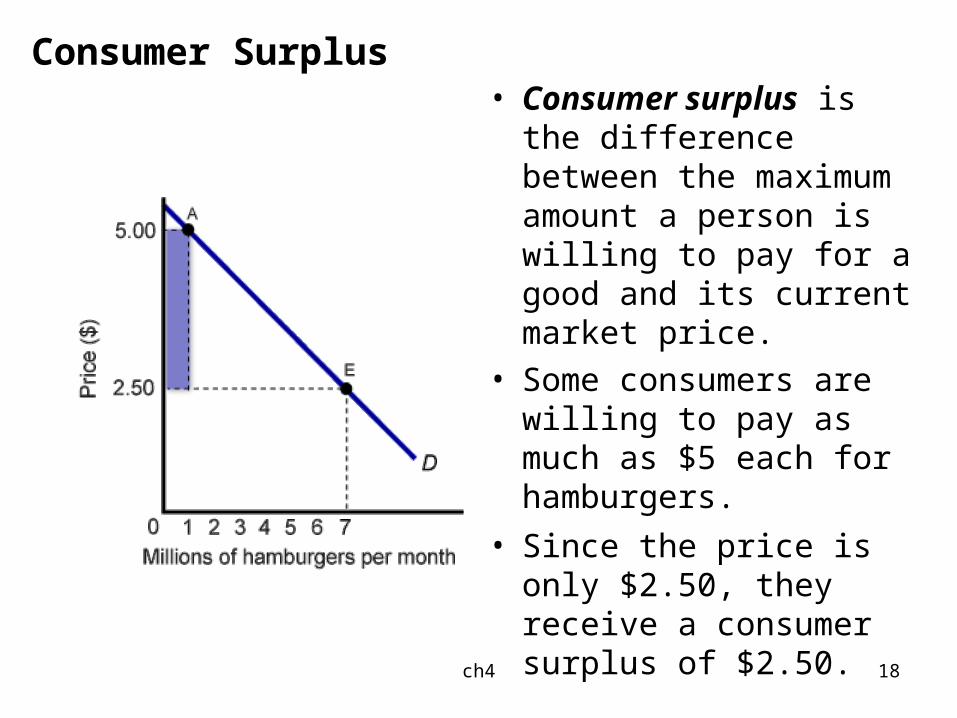
Consumer Surplus• Consumer surplus is
the difference between the maximum amount a person is willing to pay for a good and its current market price.
• Some consumers are willing to pay as much as $5 each for hamburgers.
• Since the price is only $2.50, they receive a consumer surplus of $2.50.

ch4 19
Consumer Surplus • Others (all from point B to E) are willing to pay something less than $5.00 but more than $2.50. They also receive surplus as the difference between they are willing to pay and the market price.
• Those at point E who are willing to pay as much market price receive no surplus.
• Consumer surplus is the area below the demand curve and above the market price level (the blue triangle in the figure on the left).

ch4 20
Producer Surplus • Producer surplus is the difference between the maximum amount a producer is willing to accept to supply a good and its current market price.
• Some producers are willing to accept as little as 75 cents each for hamburgers.
• Since the price is $2.50, they receive a producer surplus of $1.75 per hamburger.
ch4 21
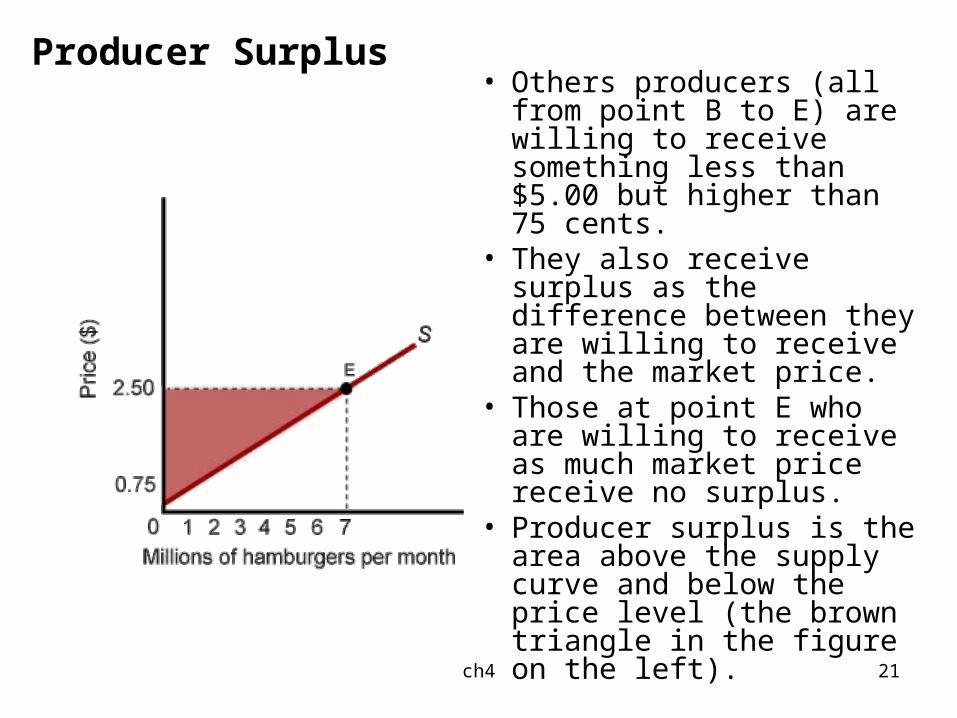
Producer Surplus• Others producers (all from
point B to E) are willing to receive something less than $5.00 but higher than 75 cents.
• They also receive surplus as the difference between they are willing to receive and the market price.
• Those at point E who are willing to receive as much market price receive no surplus.
• Producer surplus is the area above the supply curve and below the price level (the brown triangle in the figure on the left).

ch4 22
Markets Maximize the Sum of Producer and Consumer Surplus • The quantity of supplied and
demanded are equal at market equilibrium (point C in the figure on the left).
• The total net benefit (or total surplus) that is the sum of producer surplus (the brown area) and consumer surplus (the blue area) is highest/maximized where supply and demand curves intersect at equilibrium.
• Consumers receive benefits in excess of what they pay and producers receive compensation in excess of costs.

ch4 23
Markets Maximize the Sum of Producer and Consumer Surplus
• If the market produces too little, say 4 million instead of 7 million hamburgers per month, total producer and consumer surplus is reduced. This reduction (triangle ABC) is called a deadweight loss.
• The under production of hamburger (less production than equilibrium quantity) leads to loss in total benefit.
ch4 24
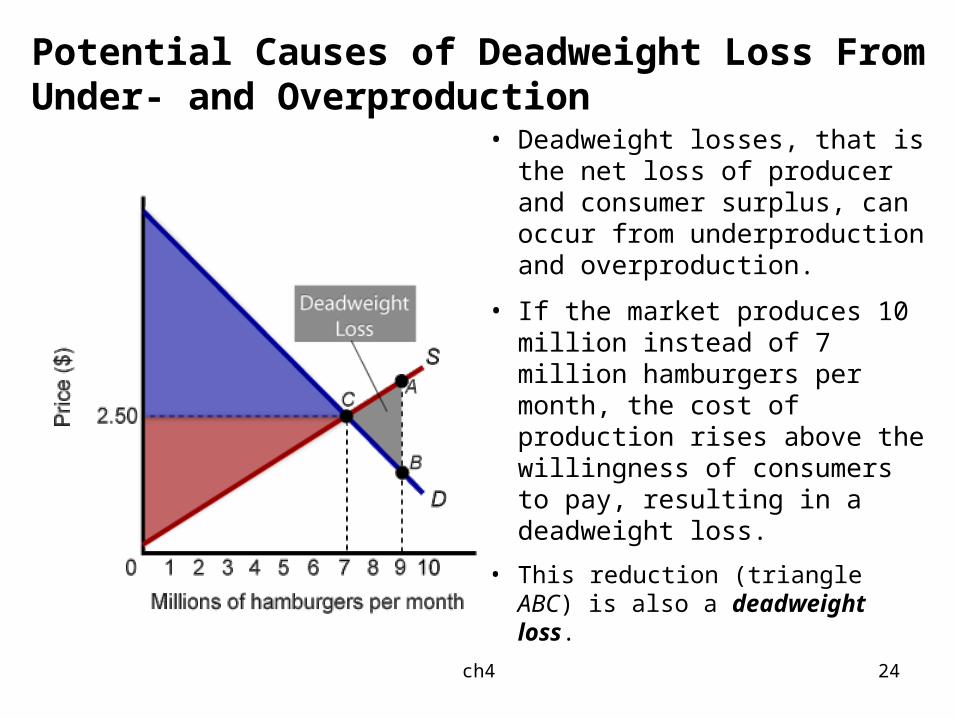
Potential Causes of Deadweight Loss From Under- and Overproduction
• Deadweight losses, that is the net loss of producer and consumer surplus, can occur from underproduction and overproduction.
• If the market produces 10 million instead of 7 million hamburgers per month, the cost of production rises above the willingness of consumers to pay, resulting in a deadweight loss.
• This reduction (triangle ABC) is also a deadweight loss.
ch4 25
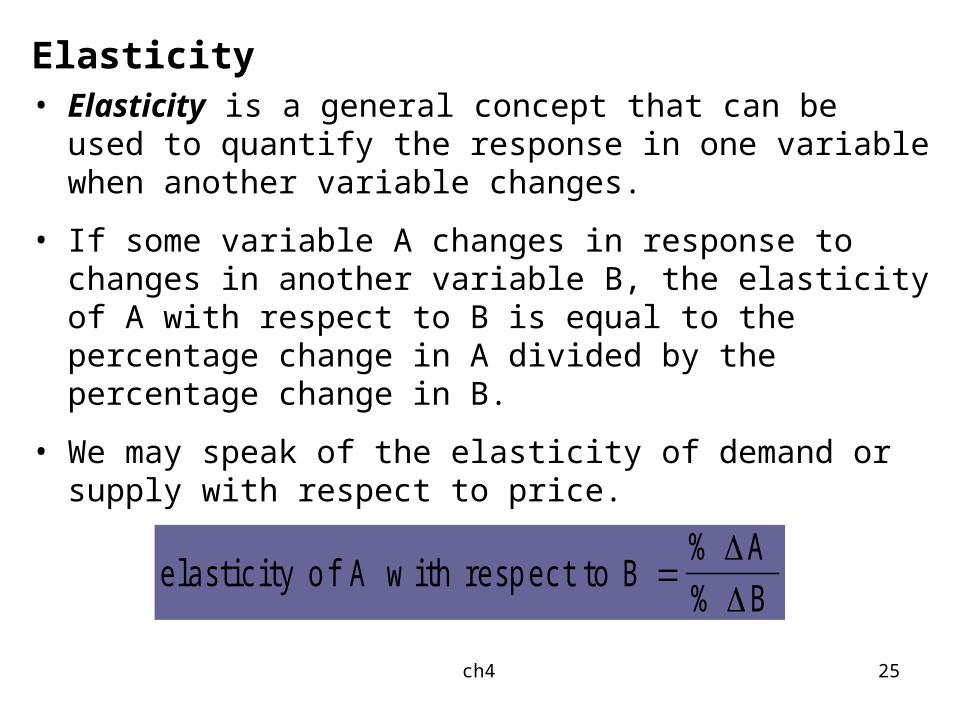
Elasticity• Elasticity is a general concept that can be used to quantify
the response in one variable when another variable changes.
• If some variable A changes in response to changes in another variable B, the elasticity of A with respect to B is equal to the percentage change in A divided by the percentage change in B.
• We may speak of the elasticity of demand or supply with respect to price.
e lastic ity o f A w ith resp ec t to BA
B
%
%
ch4 26
Price Elasticity of Demand
• Recall that, ceteris paribus, when price rise, Recall that, ceteris paribus, when price rise, quantity demanded can be expected to decline. quantity demanded can be expected to decline. When prices fall, quantity demanded can be When prices fall, quantity demanded can be expected to rise. The normal negative relationship expected to rise. The normal negative relationship between price and quantity demanded is reflected between price and quantity demanded is reflected in the downward slope of demand curves.in the downward slope of demand curves.
• The slope of a demand curve may in a rough way The slope of a demand curve may in a rough way reveal the responsiveness of the quantity reveal the responsiveness of the quantity demanded to price changes, but slope can be quite demanded to price changes, but slope can be quite misleading. In fact, it is not a good formal measure misleading. In fact, it is not a good formal measure of responsiveness.of responsiveness.
ch4 27
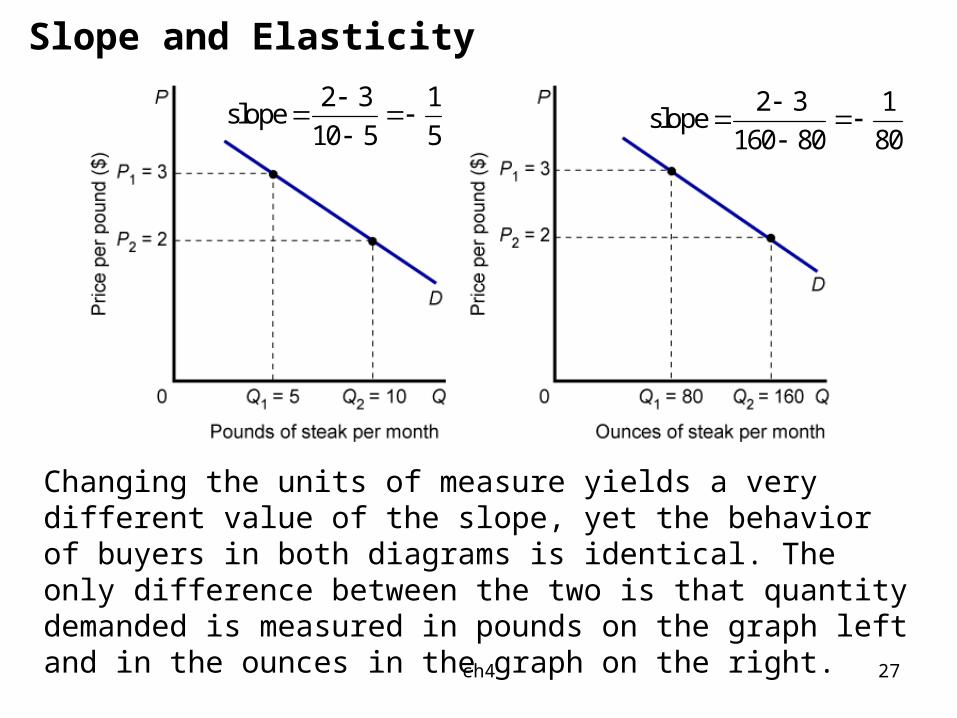
Slope and Elasticity
Changing the units of measure yields a very different value of the slope, yet the behavior of buyers in both diagrams is identical. The only difference between the two is that quantity demanded is measured in pounds on the graph left and in the ounces in the graph on the right.
2 3 1slope
10 5 5
2 3 1
slope160 80 80

ch4 28
Slope and Elasticity
• When we calculate the numerical value of each slope, however, we get very different answers.
• The curve on the left has a slope of -1/5, and the curve on the right has a slope of -1/80, yet the two curves represent the exact same behavior. If we had changed dollars to cents on the Y axis, the two slopes would be -20 and -1.25, respectively.
• The problem is that numerical value of slope depends on the unit used to measure the variables on the axes. To correct this problem, we must convert the changes in price and quantity to percentage.
• We define price elasticity of demand simply as the ratio of the percentage of change in quantity demanded to percentage change in price.

ch4 29
Price Elasticity of Demand
• A popular measure of elasticity isA popular measure of elasticity is price elasticity price elasticity of demand of demand measures how responsive consumers measures how responsive consumers are to changes in the price of a product.are to changes in the price of a product.
p rice e las tic ity o f d em an d % ch an g e in q u an tity d em an d ed
ch an g e in p rice
%
• The value of demand elasticity is always negative, but it is stated in absolute terms.
• The value of the slope of the demand curve and the value of elasticity are not the same.
• Unlike the value of the slope, the value of elasticity is a useful measure of responsiveness.
ch4 30
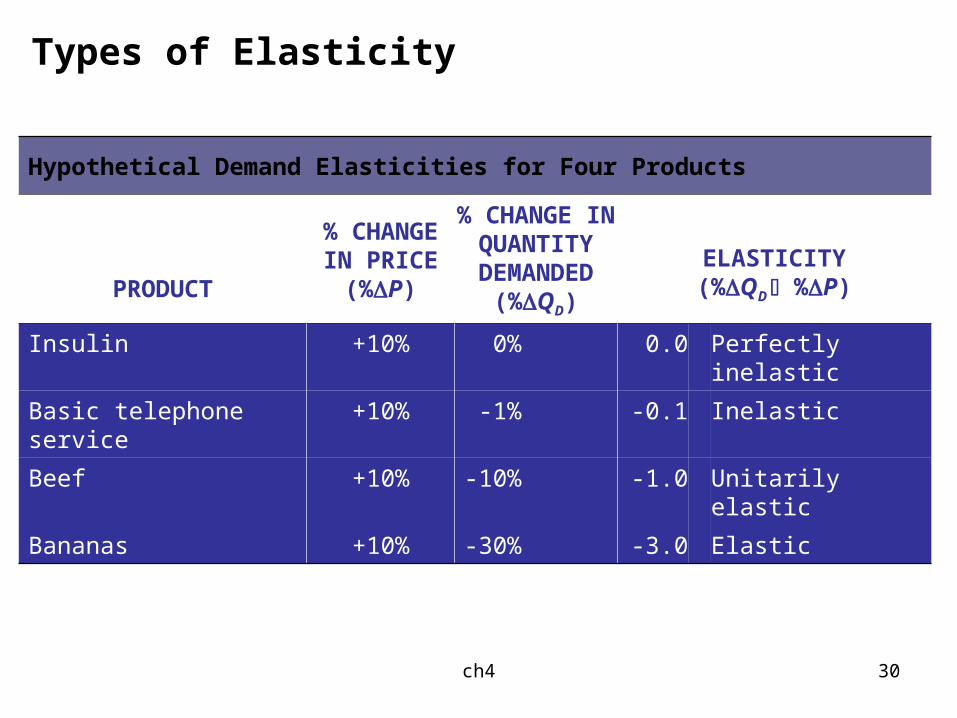
Types of Elasticity
Hypothetical Demand Elasticities for Four Products
PRODUCT
% CHANGE IN PRICE
(%P)
% CHANGE IN QUANTITY
DEMANDED (%QD)
ELASTICITY(%QD %P)
Insulin +10% 0% 0.0 Perfectly inelastic
Basic telephone service +10% -1% -0.1 Inelastic
Beef +10% -10% -1.0 Unitarily elastic
Bananas +10% -30% -3.0 Elastic

ch4 31
Types of Elasticity
• Perfectly inelastic demand: Demand in which quantity demanded does not respond at all to a change in price.
• Inelastic Demand: Demand that responds somewhat, but not a great deal, to change in price. Inelastic demand always has a numerical value between zero and -1.
• Unitary Elasticity: A demand relationship in which the percentage change in quantity of a product demanded is the same as the percentage change in price in absolute value (a demand elasticity of -1).
• Elastic Demand: A demand relationship in which the percentage change in quantity demanded is larger in absolute value than the percentage change in price (a demand elasticity with an absolute value greater than 1).
• Perfectly Elastic Demand: Demand in which quantity drops to zero at the slightest increase in price.
ch4 32
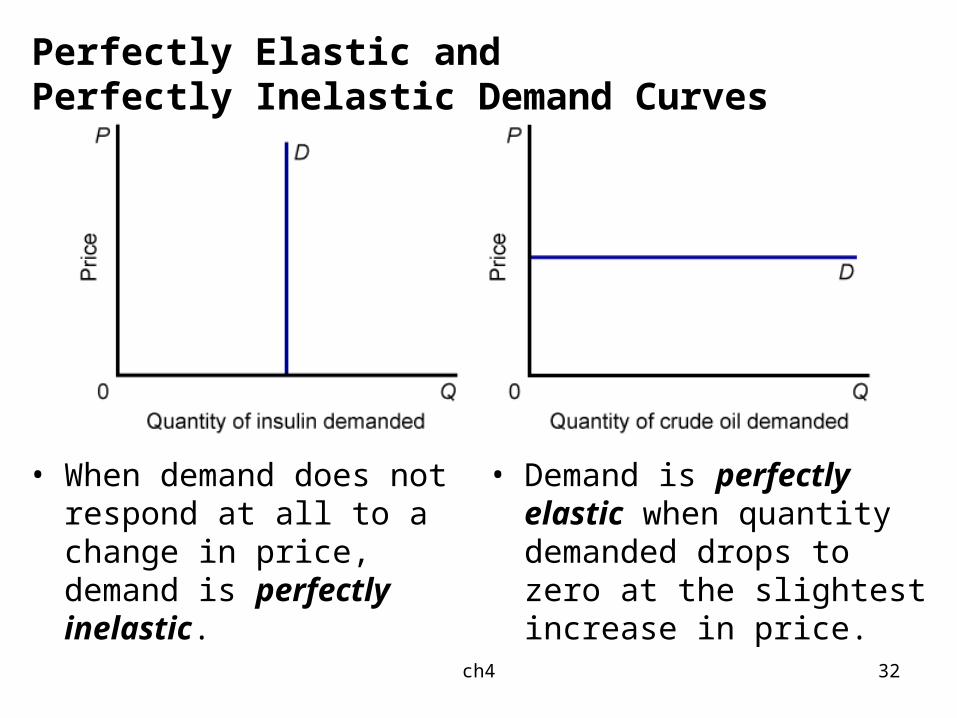
Perfectly Elastic andPerfectly Inelastic Demand Curves
• When demand does not respond at all to a change in price, demand is perfectly inelastic.
• Demand is perfectly elastic when quantity demanded drops to zero at the slightest increase in price.
ch4 33
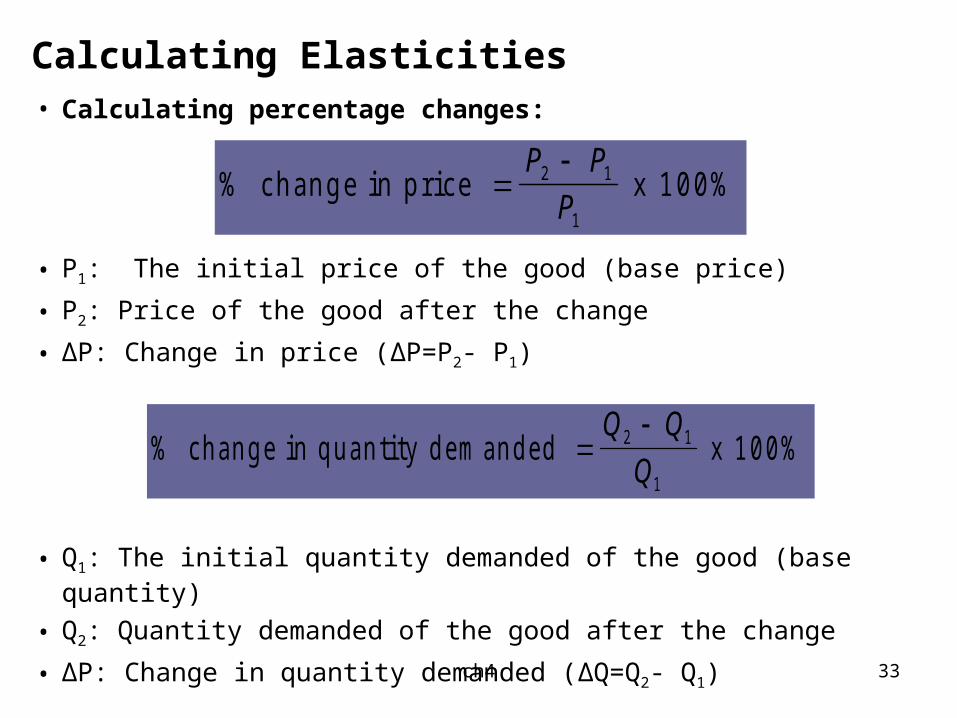
Calculating Elasticities• Calculating percentage changes:
• P1: The initial price of the good (base price)
• P2: Price of the good after the change
• ΔP: Change in price (ΔP=P2- P1)
• Q1: The initial quantity demanded of the good (base quantity)
• Q2: Quantity demanded of the good after the change
• ΔP: Change in quantity demanded (ΔQ=Q2- Q1)
% ch an g e in q u an tity d em an d ed x 1 0 0 %2Q Q
Q1
1
% ch an g e in p rice x 1 0 0 %2P P
P1
1

ch4 34
Calculating Elasticities• Elasticity is a ratio of
percentages.• Using the values on the
graph to compute elasticity, using percentage changes yields the following result:
% 100 % 100 x 5
5 % 100 x
5
5-10 x100%
Q
ΔQ x100%
Q
QQ demandedquantity in change %
11
12
% 33- % 100 x 3
1- % 100 x
3
3-2 x100%
P
P x100%
P
PP pricein change %
1
12
Note that we will arrive at exactly the same result if we change the unit of price (as cents) and/or quantity (as ounces).
Pri
ce p
er p
ou
nd
($)
P
P1=3 A
P2=2 B
D
0 Q1=5 Q2=10 Q
Pounds of steak per month

ch4 35
Calculating Elasticities• Recall the formal definition of elasticity:
• Substituting the preceding percentages, we see that a 33.3 percent decrease in price (from $3 to $2) leads to 100 percent increase in quantity demanded (from 5 ponds to 10 pounds) thus:
• According to these calculations, the demand for steak is elastic.
p rice e las tic ity o f d em an d
1 0 0 %
3 3 3 %3 0
..
p rice e las tic ity o f d em an d % ch an g e in q u an tity d em an d ed
ch an g e in p rice
%

ch4 36
Calculating Elasticities • The use of the initial values of P and Q as the bases for calculating percentage changes may be misleading.
• The values in the figure are the same, but only initial values are substituted. So, price increases from 2 to 3 and quantity decreases from 10 to 5.
• With the same formula we used earlier, we get:
% 50- % 100 x 10
5- % 100 x
10
10-5 x100%
Q
ΔQ demandedquantity in change %
1
% 50 % 100 x 2
1 % 100 x
2
2-3 x100%
P
ΔP pricein change %
Pri
ce p
er p
ou
nd
($)
P
P2=3 B
P1=2 A
D
0 Q2=5 Q1=10 Q
Pounds of steak per month
1- 50%
50%- )( demand of elasticity Price
ch4 37
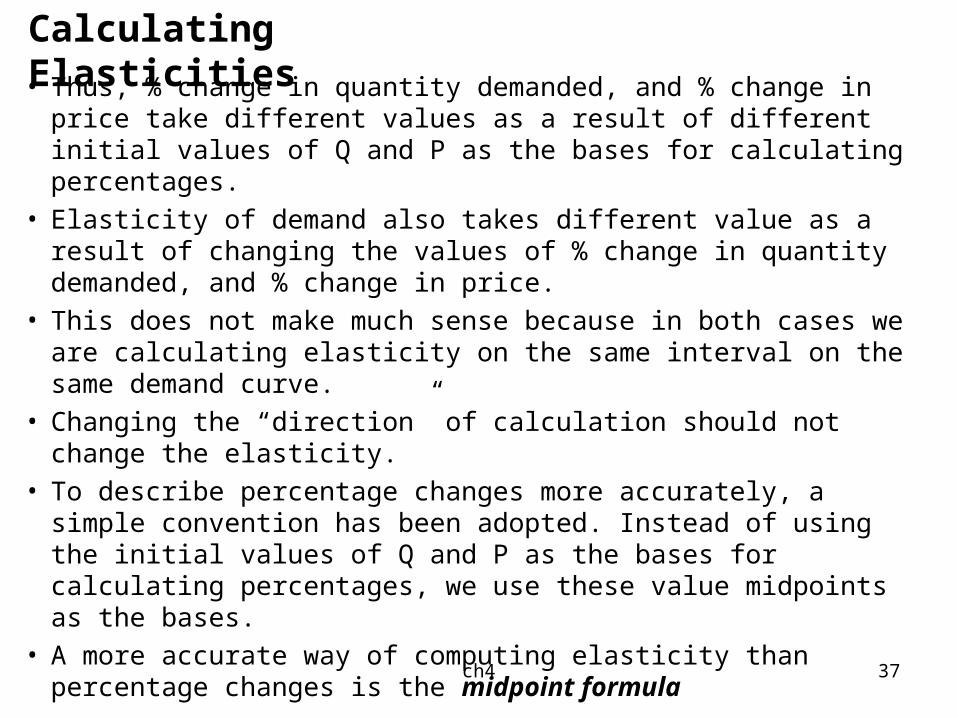
Calculating Elasticities• Thus, % change in quantity demanded, and % change in price take
different values as a result of different initial values of Q and P as the bases for calculating percentages.
• Elasticity of demand also takes different value as a result of changing the values of % change in quantity demanded, and % change in price.
• This does not make much sense because in both cases we are calculating elasticity on the same interval on the same demand curve.
• Changing the “direction” of calculation should not change the elasticity.
• To describe percentage changes more accurately, a simple convention has been adopted. Instead of using the initial values of Q and P as the bases for calculating percentages, we use these value midpoints as the bases.
• A more accurate way of computing elasticity than percentage changes is the midpoint formula

ch4 38
Calculating Elasticities• Midpoint formula: It is more
precise way of calculating the percentages using the value halfway between P1 and P2 for the base in calculating the percentage change in price, and the value halfway between Q1 and Q2 as the base for calculating the percentage change in quantity demanded.
• Changing the “direction” of calculation does not change the value of elasticity.
%
%
( ) /
( ) /
Q
P
Q QQ QP PP P
d
2 1
1 2
2 1
1 2
21 0 0 %
2
x
x 1 0 0 %
%
%( ) /
( ) /
. .Q
Pd
1 0 55 1 0 2
1 0 0 %
2 33 2 2
57 5 1 6 7
x
x 1 0 0 %
x 1 0 0 %
-12 .5
x 1 0 0 % =
6 6 .7 %
-4 0 .0 %

ch4 39
Calculating Elasticities
• Here is how to interpret two different values of elasticity:
– When = 0.2, a 10% increase in price leads to a 2% decrease in quantity demanded.
– When = 2.0, a 10% increase in price leads to a 20% decrease in quantity demanded.

ch4 40
Elasticity Changes along aStraight-Line Demand Curve
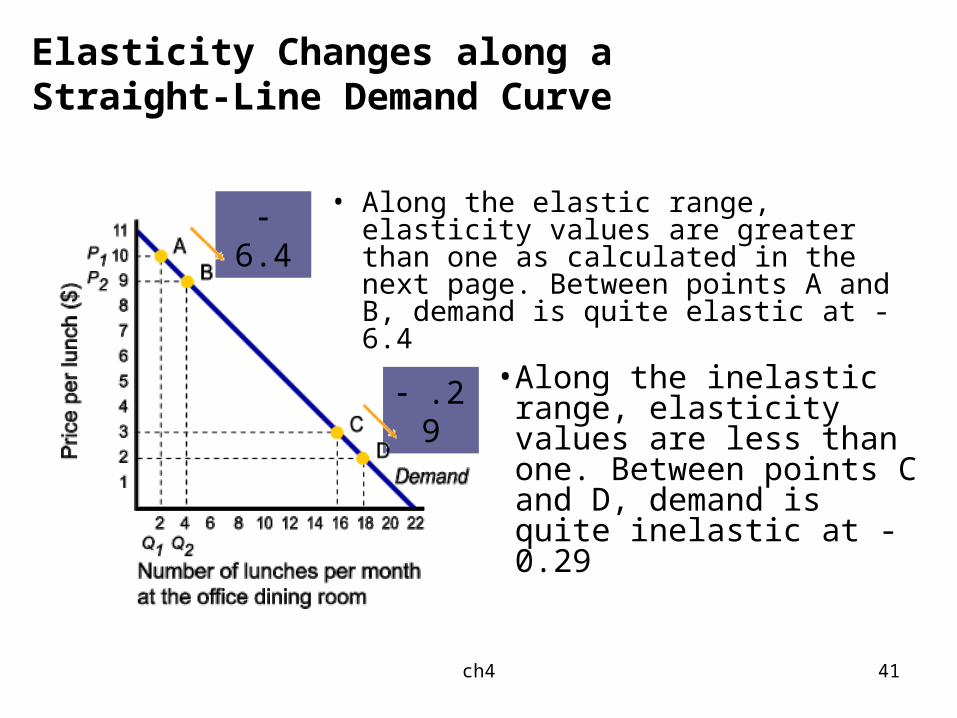
• Price elasticity of demand decreases as we move downward along a straight line demand curve.
• Demand is elastic in the upper range and inelastic in the lower range of the line.
ch4 41
Elasticity Changes along a Straight-Line Demand Curve
• Along the elastic range, elasticity values are greater than one as calculated in the next page. Between points A and B, demand is quite elastic at -6.4
6.4
.29 • Along the inelastic range, elasticity values are less than one. Between points C and D, demand is quite inelastic at -0.29

ch4 42
Calculating Elasticities• Along the elastic range, for example between points A and B in
the figure in the preceding page, elasticity values are greater than one as calculated down:
• Along the inelastic range, for example between points C and D in the figure in the preceding page, elasticity values are less than one that can be seen when it is calculated in the same way above.
% 66.7 % 100 x 3
2 % 100 x
2
422-4
x100%
2
demandedquantity in change %21
12
% 10.5- % 100 x 9.5
1- % 100 x
2
91010-9
x100%
2
PPPP
pricein change %21
12
6.4- 10.5%-
66.7% )( demand of elasticity Price

ch4 43
Elasticity and Total Revenue• In any market:
Total Revenue = Price x Quantity
TR = P x Q
• When price increases in a market, quantity demanded declines, vice versa.
P↑→ QD↓
P↓→ QD↑
• Because TR is the product of P and Q, whether TR rises or fall in response to a price increase depends on which is bigger, the percentage increase in price or the percentage decrease in quantity demanded. If the percentage decrease in quantity demanded is smaller than the percentage increase in price, TR will rise. This occurs when demand is inelastic. In this case, the percentage price rice simply outweighs the percentage quantity decline, and PxQ rises:
(Inelastic demand: ε>1): ↑ PxQ ↓=TR ↑
Pri
ce p
er p
ou
nd
($)
P
P A
TR = P x Q D
0 Q Q
Pounds of steak per month

ch4 44
Elasticity and Total Revenue
• If however, the percentage decline in quantity demanded fallowing a price increase is larger than the percentage increase in price, total revenue will fall. This occurs when demand is elastic. The percentage price increase is outweighed by the percentage quantity decline:
(elastic demand ε>1): ↑ PxQ ↓=TR ↓
Pri
ce p
er p
ou
nd
($)
P
P4 D elastic range ε>1: ↑PxQ↓=TR↓ (P4DQ40<P3CQ30)
P3 C
P2 B inelastic range ε<1: ↑PxQ↓=TR↑ (P2BQ20>P1AQ10)
P1 A
0 Q4 Q3 Q2 Q1 Q
Pounds of steak per month
ch4 45
Elasticity and Total Revenue
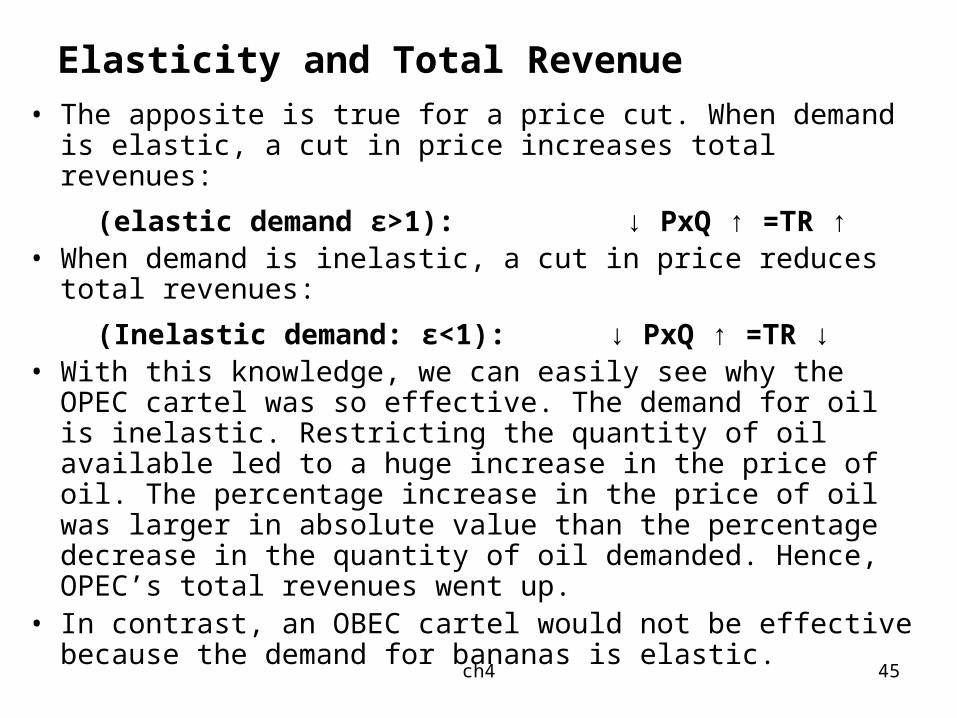
• The apposite is true for a price cut. When demand is elastic, a cut in price increases total revenues:
(elastic demand ε>1): ↓ PxQ ↑ =TR ↑ • When demand is inelastic, a cut in price reduces total
revenues:
(Inelastic demand: ε<1): ↓ PxQ ↑ =TR ↓ • With this knowledge, we can easily see why the OPEC
cartel was so effective. The demand for oil is inelastic. Restricting the quantity of oil available led to a huge increase in the price of oil. The percentage increase in the price of oil was larger in absolute value than the percentage decrease in the quantity of oil demanded. Hence, OPEC’s total revenues went up.
• In contrast, an OBEC cartel would not be effective because the demand for bananas is elastic.
ch4 46
Elasticity and Total Revenue
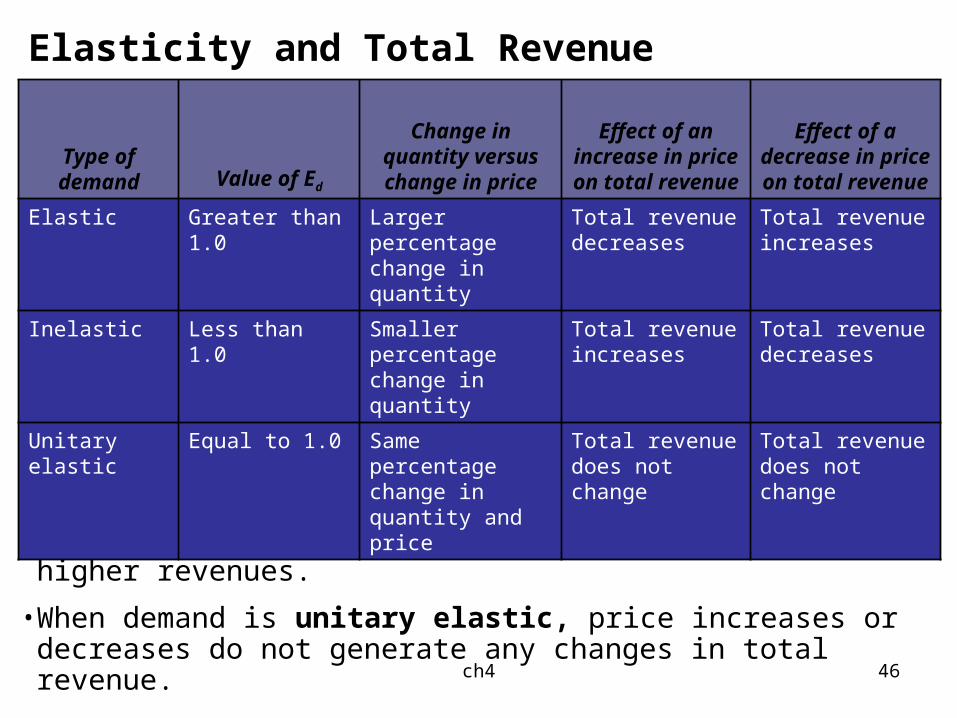
• When demand is elastic, price increases generate lower revenues.
• When demand is inelastic, price increases generate higher revenues.
• When demand is unitary elastic, price increases or decreases do not generate any changes in total revenue.
Type of demand Value of Ed
Change in quantity versus change in price
Effect of an increase in price on total revenue
Effect of a decrease in
price on total revenue
Elastic Greater than 1.0 Larger percentage change in quantity
Total revenue decreases
Total revenue increases
Inelastic Less than 1.0 Smaller percentage change in quantity
Total revenue increases
Total revenue decreases
Unitary elastic Equal to 1.0 Same percentage change in quantity and price
Total revenue does not change
Total revenue does not change

ch4 47
The Determinants of Demand Elasticity
• Availability of substitutes -- demand is more elastic when there are more substitutes for the product. For example, demand for insulin is less elastic than demand for chocolate due to availability of their substitutes.
• Importance of the item in the budget -- demand is more elastic when the item is a more significant portion of the consumer’s budget. For example, demand for a car are more elastic than demand for bicycle due to importance of these items in the budget.
• Time dimension -- demand becomes more elastic over time. In the longer run, demand is likely to become more elastic, or responsive, simply because households make adjustment over time and producers develop substitute goods.
ch4 48
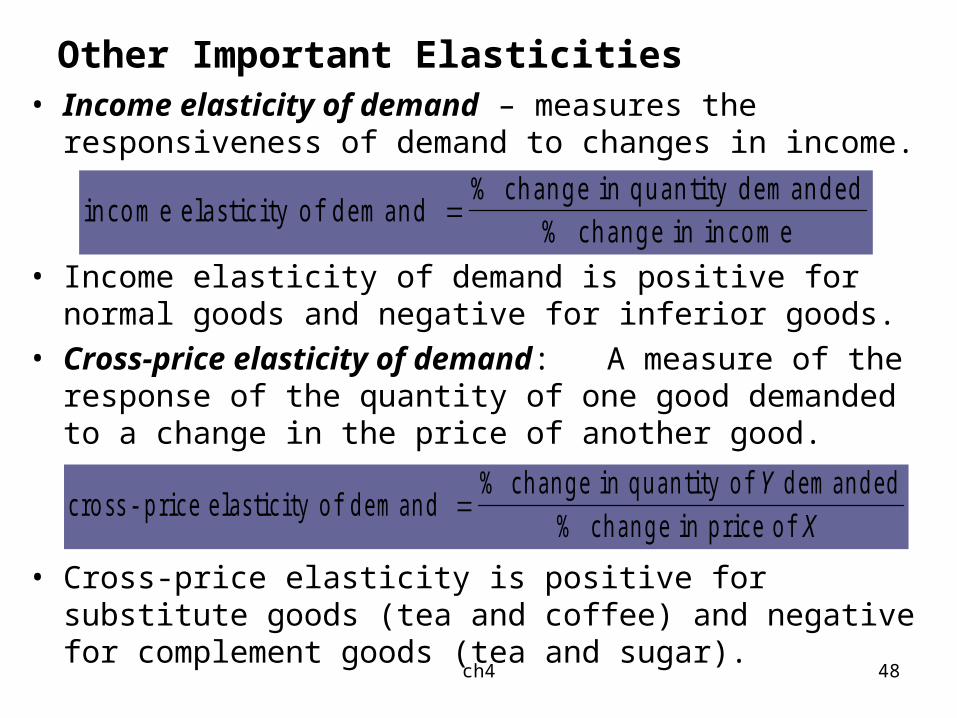
Other Important Elasticities• Income elasticity of demand – measures the
responsiveness of demand to changes in income.
• Income elasticity of demand is positive for normal goods and negative for inferior goods.
• Cross-price elasticity of demand: A measure of the response of the quantity of one good demanded to a change in the price of another good.
• Cross-price elasticity is positive for substitute goods (tea and coffee) and negative for complement goods (tea and sugar).
in co m e e la stic ity o f d em an d % ch an g e in q u an tity d em an d ed
ch an g e in in co m e
%
cro ss - p rice e las tic ity o f d em an d % ch an g e in q u an tity o f d em an d ed
ch an g e in p rice o f
Y
X%

ch4 49
Other Important Elasticities
• Elasticity of supply: A measure of the response of quantity of a good supplied to a change in price of that good. Likely to be positive in output markets. Higher price leads to an increase in quantity supplied, ceteris paribus.
• Elasticity of labor supply: A measure of the response of labor supplied to a change in the price of labor. Likely to be positive in the most of labor markets. However, it is quite possible that an increase in the wages to some groups and above some level will lead to a reduction in the quantity of labor supplied since they may need more leisure time instead of working. Thus, it may be negative in the higher wages.
e lastic ity o f su p p ly % ch an g e in q u an tity su p p lied
ch an g e in p rice
%
e lastic ity o f lab o r su p p ly% ch an g e in q u an tity o f lab o r su p p lied
ch an g e in th e w ag e ra te
%
ch4 50
Terms and Concepts
black market: karaborsa, yasa dışı alım/satım işlemlericonsumer surplus: üretici fazlası-artığı-rantıcross-price elasticity of demand: talebin çapraz fiyat
esnekliğideadweight loss: dara kaybı, toplumsal kayıpelastic demand: esnek talepElasticity: esneklikelasticity of labor supply: emek-işgücü arzı esnekliğielasticity of supply: arz esnekliğifavored customers: ayrıcalıklı-tercihli müşteriler-alıcılarincome elasticity of demand: talebin gelir esnekliğiinelastic demand: esnek olmayan talep

ch4 51
Terms and Concepts:
midpoint formula: orta nokta formülüminimum wage: asgari-en düşük ücretperfectly elastic demand : tam esnek talepperfectly inelastic demand: tam esnek olmayan talepprice ceiling: tavan fiyatprice elasticity of demand: talebin fiyat esnekliği price floor: taban fiyatprice rationing: fiyat yoluyla dağıtım-bölüşüm-tahsisat-tayın
vermerationing function of price: fiyatların dağıtım fonksiyonuproducer surplus: üretici fazlası-artığı-rantıQueuing: kuyruk-sıra yöntemiration coupons: yiyecek-benzin-vs karnesi-kuponu-vesikasıunitary elasticity: birim elastikiyet
ch4 52
Problems:1) Use supply and demand curves to explain why "scalping" occurs for tickets to major sporting events when the ticket price is set below the market equilibrium.
2) In 1973 and 1974 OPEC imposed an embargo on shipments of crude oil to the United States. This resulted in a drastic reduction in the quantity of gasoline available, and in response Congress imposed a price ceiling, which restored equilibrium in the market.
3) On those occasions when both governments and private firms decide to use some mechanism other than the market system to ration an item, the rationale most often is
A) price gouging. B) willingness to pay. C) queuing. D) fairness. E) None of the above
4) The market system serves as a price rationing device because it A) provides an automatic mechanism for distributing scarce goods and services.
B) results in the most "fair" distribution of goods and services. C) determines the allocation of resources among producers. D) determines the final mix of outputs. E) All of the above
ch4 53
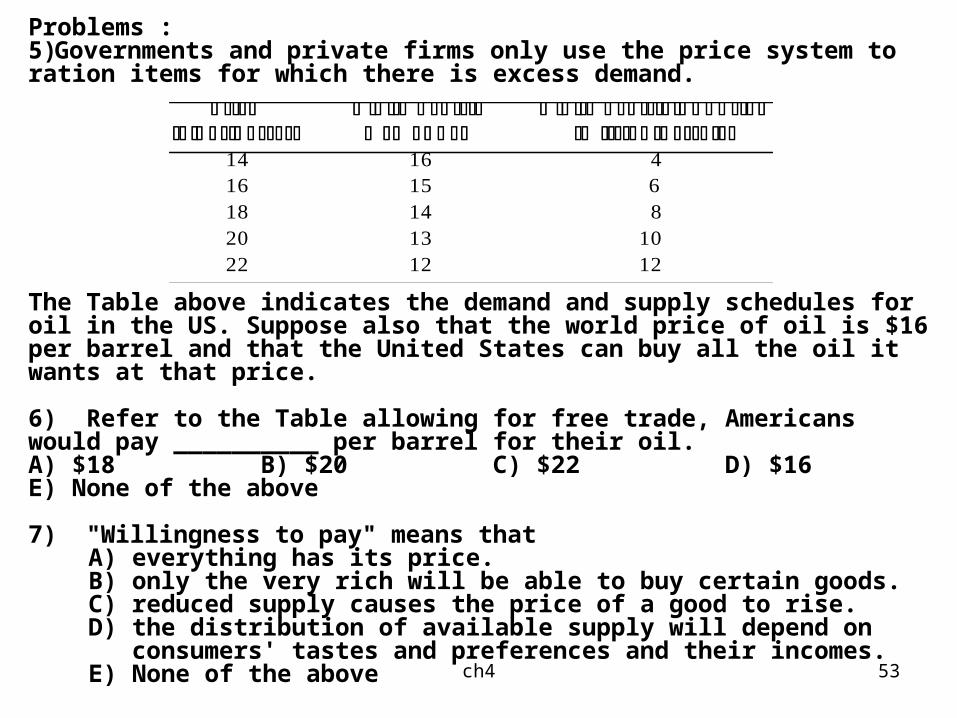
Problems :5)Governments and private firms only use the price system to ration items for which there is excess demand.
The Table above indicates the demand and supply schedules for oil in the US. Suppose also that the world price of oil is $16 per barrel and that the United States can buy all the oil it wants at that price.
6) Refer to the Table allowing for free trade, Americans would pay __________ per barrel for their oil. A) $18 B) $20 C) $22 D) $16 E) None of the above
7) "Willingness to pay" means that A) everything has its price. B) only the very rich will be able to buy certain goods. C) reduced supply causes the price of a good to rise. D) the distribution of available supply will depend on consumers'
tastes and preferences and their incomes. E) None of the above

ch4 54
Problems :
8) Supply, demand, and prices in input and output markets determine the allocation of resources and the ultimate combination of things produced.
9) Which of the following statements is TRUE?
A) "Willingness to pay" means that only the very rich will continue to buy some goods when their prices rise.
B) One example in which the market does not work is the case of items with sentimental value.
C) If a product is in fixed supply changes in its price will be determined solely and exclusively by demand.
D) To say that there is some price that will clear any market is to say that everything has its price.
E) None of the above

ch4 55
Problems :
The Table indicates the demand and supply schedules for oil in the United States.
Suppose also that the world price of oil is $16 per barrel and that the United States can buy all the oil it wants at that price.
10) Refer to the Table. Which of the following statements is TRUE about the impact of an oil import tax?
A) The U.S. government gains additional tax revenue. B) Domestic producers benefit from the tax because they can
charge a higher price and sell more. C) It reduces U.S. dependence on foreign oil. D) Consumers pay higher prices for oil than they would under free
trade. E) All of the above

ch4 56
Problems :11) The most common of all nonprice rationing systems is
A) ration coupons. B) the black market. C) favored customers. D) queuing. E) a price ceiling.
Refer to the information provided in the Figure below to answer the question that follow.
12) Refer to the Figure which of the following areas represents deadweight loss?
A) A B) B C) C D) There is no deadweight loss in this market.
ch4 57
Problems :13) Every year during the holidays one toy seems to become extremely popular and hard to find. Parents have been known to attempt to bribe toy store employees to call them as soon as a new shipment arrives. This is an example of
A) queuing. B) a surplus. C) ration coupons. D) favored customers. E) the price rationing function at work.
14) A strategy to raise the price of an item by cutting its production is more likely to be successful if the demand for that item is elastic.
15) A "black market" is a market in which A) illegal trading takes place at market-determined prices. B) coupons entitle individuals to purchase a certain amount of a
given product per month. C) some customers receive special treatment from dealers in
times of excess demand. D) the price is not based on willingness to pay. E) None of the above

ch4 58
Answers:1) The graph should show that with the equilibrium price above the stated one, consumers are willing to pay more than the set price for a ticket. This price may be more than a ticket holder is willing to pay; she, therefore, sells her ticket at the higher price. 2) FALSE 3) D 4) A 5) FALSE 6) D 7) D 8) TRUE 9) C 10) E 11) D 12) D 13) D 14) FALSE 15) A