Ch.4. Broad Line Region broad lines are important to understand AGN structure for at least two...
33
Ch.4
-
Upload
rosalyn-holland -
Category
Documents
-
view
221 -
download
0
Transcript of Ch.4. Broad Line Region broad lines are important to understand AGN structure for at least two...
Ch.4
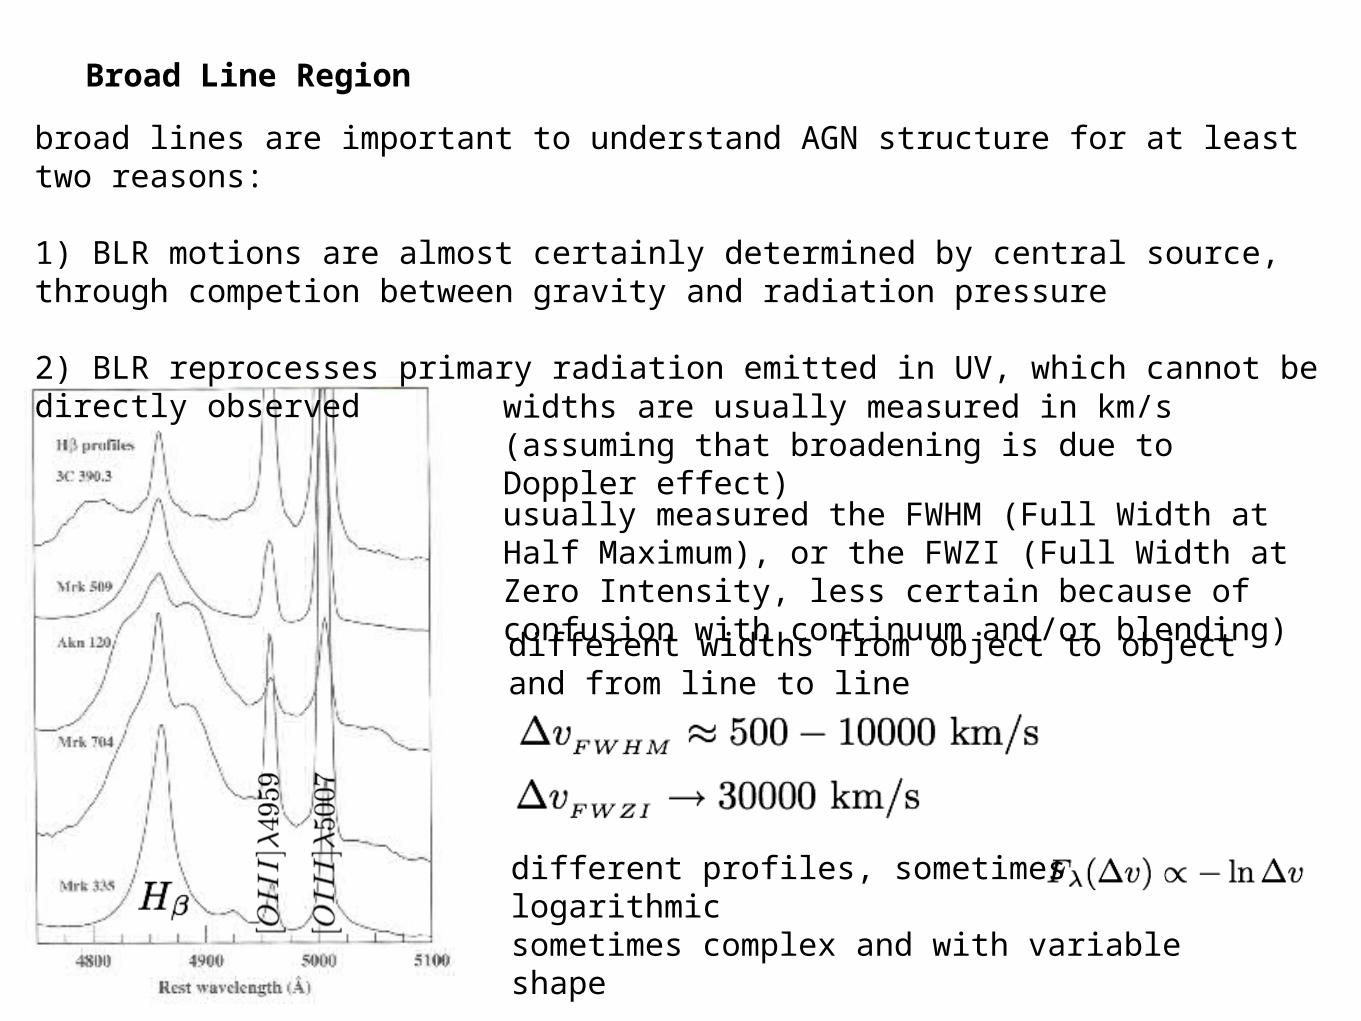
Broad Line Region
broad lines are important to understand AGN structure for at least two reasons:
1) BLR motions are almost certainly determined by central source, through competion between gravity and radiation pressure
2) BLR reprocesses primary radiation emitted in UV, which cannot be directly observed
usually measured the FWHM (Full Width at Half Maximum), or the FWZI (Full Width at Zero Intensity, less certain because of confusion with continuum and/or blending)
widths are usually measured in km/s (assuming that broadening is due to Doppler effect)
different widths from object to object and from line to line
different profiles, sometimes logarithmicsometimes complex and with variable shape
FWHM
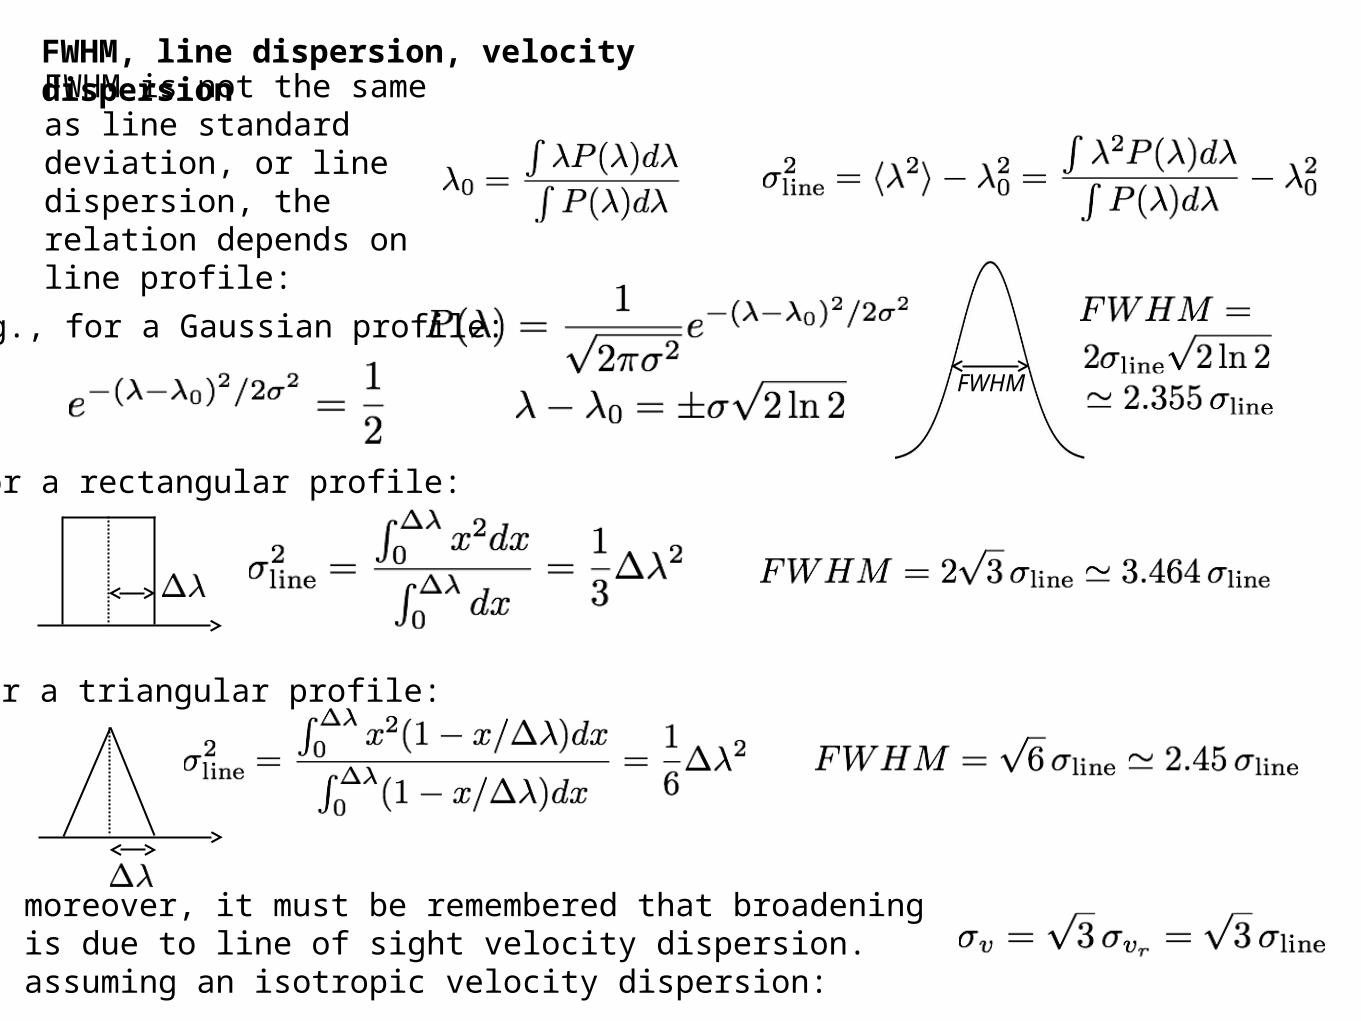
FWHM, line dispersion, velocity dispersionFWHM is not the same as line standard deviation, or line dispersion, the relation depends on line profile:
e.g., for a Gaussian profile:
for a rectangular profile:
for a triangular profile:
moreover, it must be remembered that broadening is due to line of sight velocity dispersion. assuming an isotropic velocity dispersion:
Broad Line Region
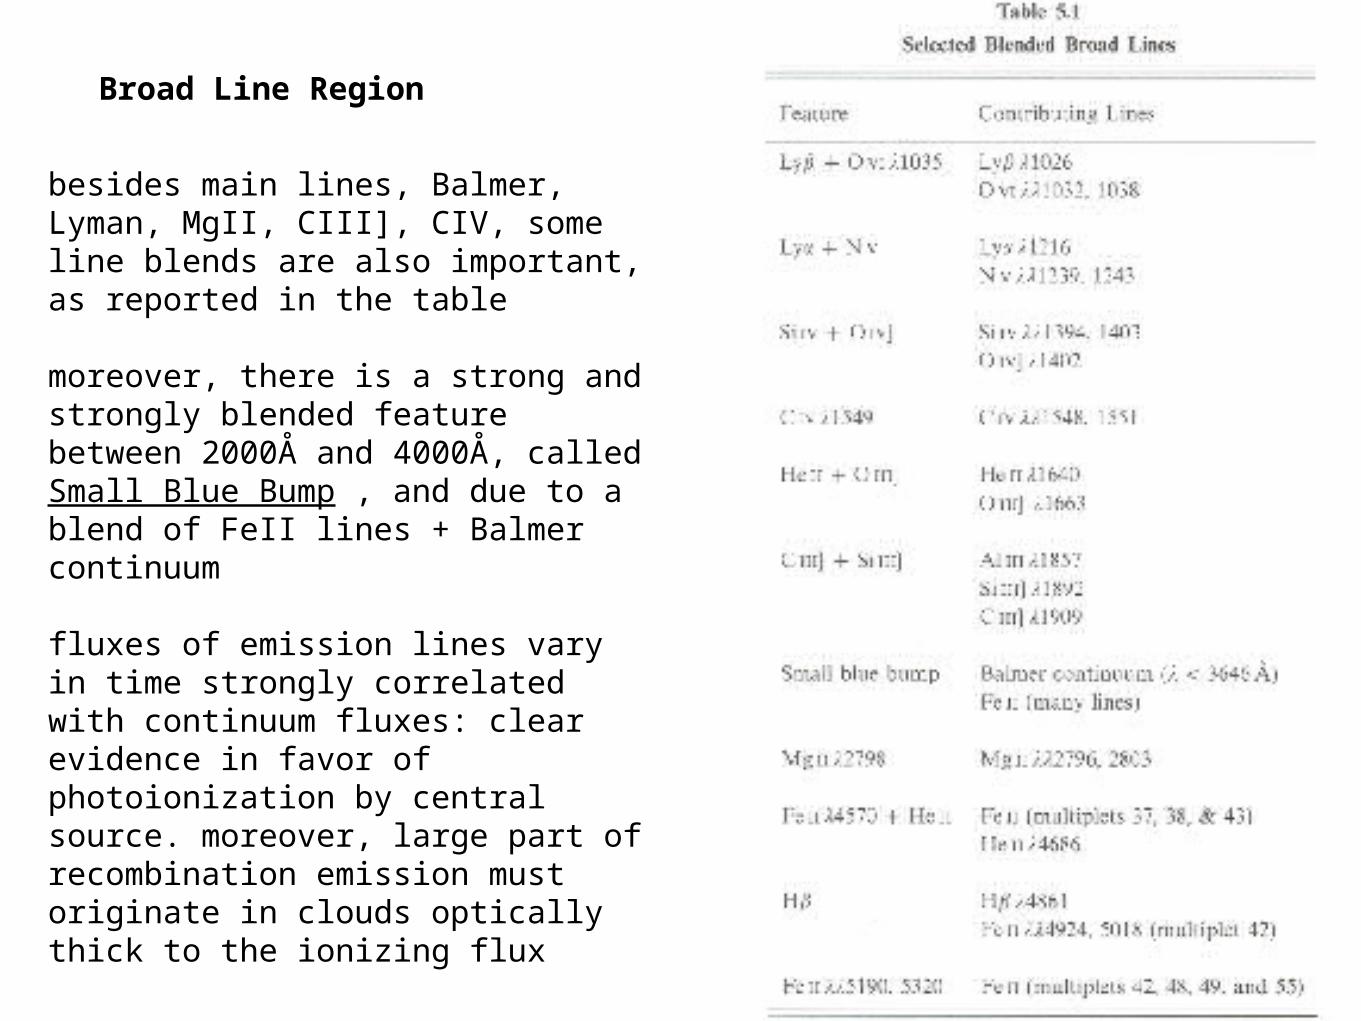
besides main lines, Balmer, Lyman, MgII, CIII], CIV, some line blends are also important, as reported in the table
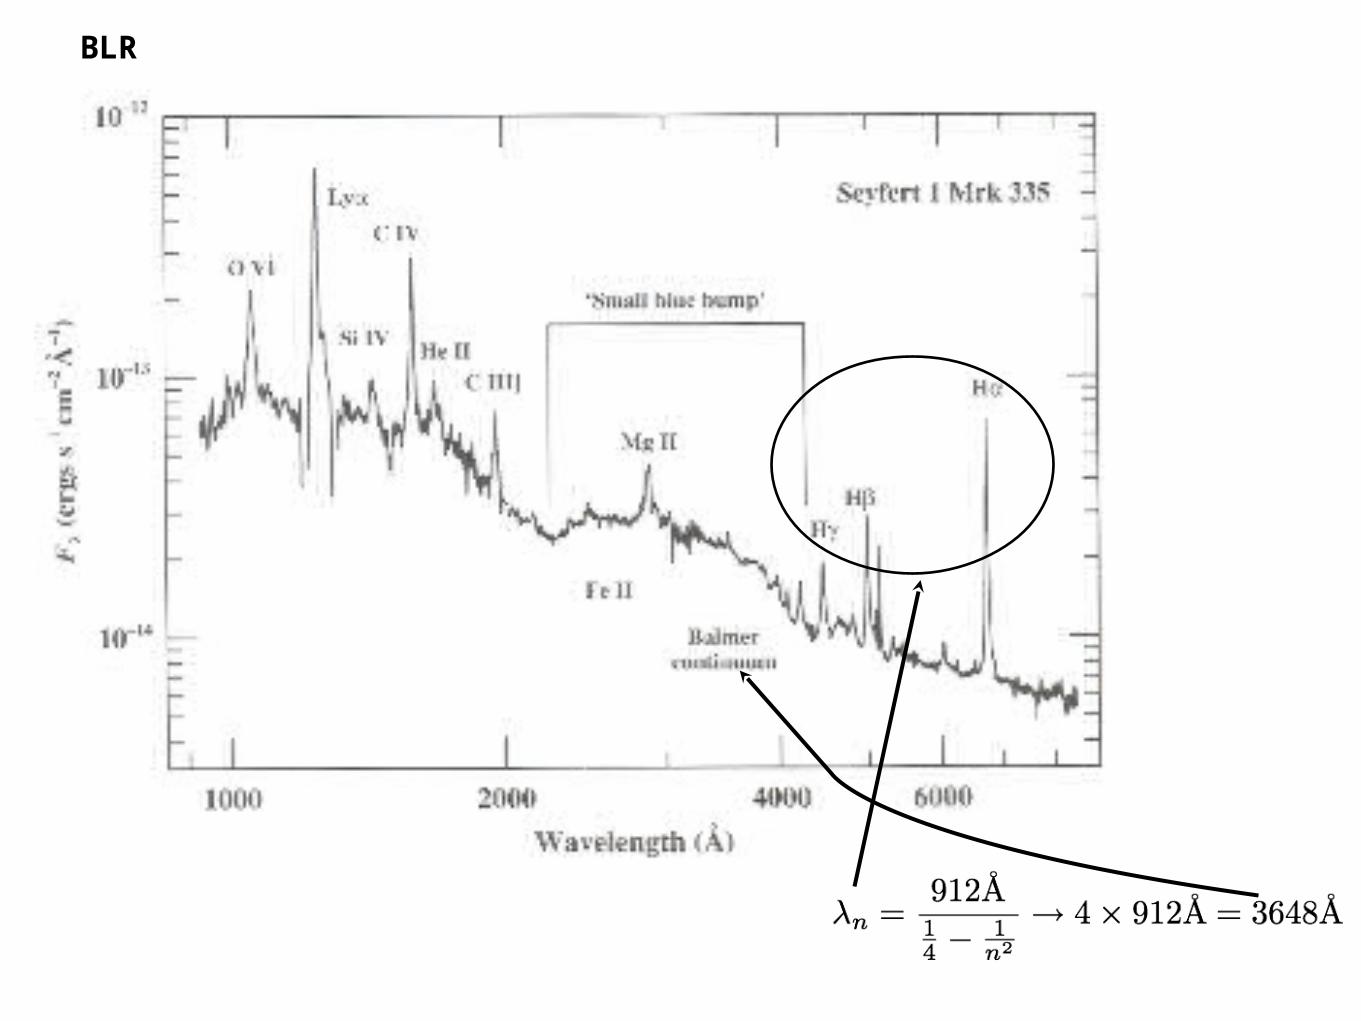
moreover, there is a strong and strongly blended feature between 2000Å and 4000Å, called Small Blue Bump , and due to a blend of FeII lines + Balmer continuum
fluxes of emission lines vary in time strongly correlated with continuum fluxes: clear evidence in favor of photoionization by central source. moreover, large part of recombination emission must originate in clouds optically thick to the ionizing flux
BLR
BLR
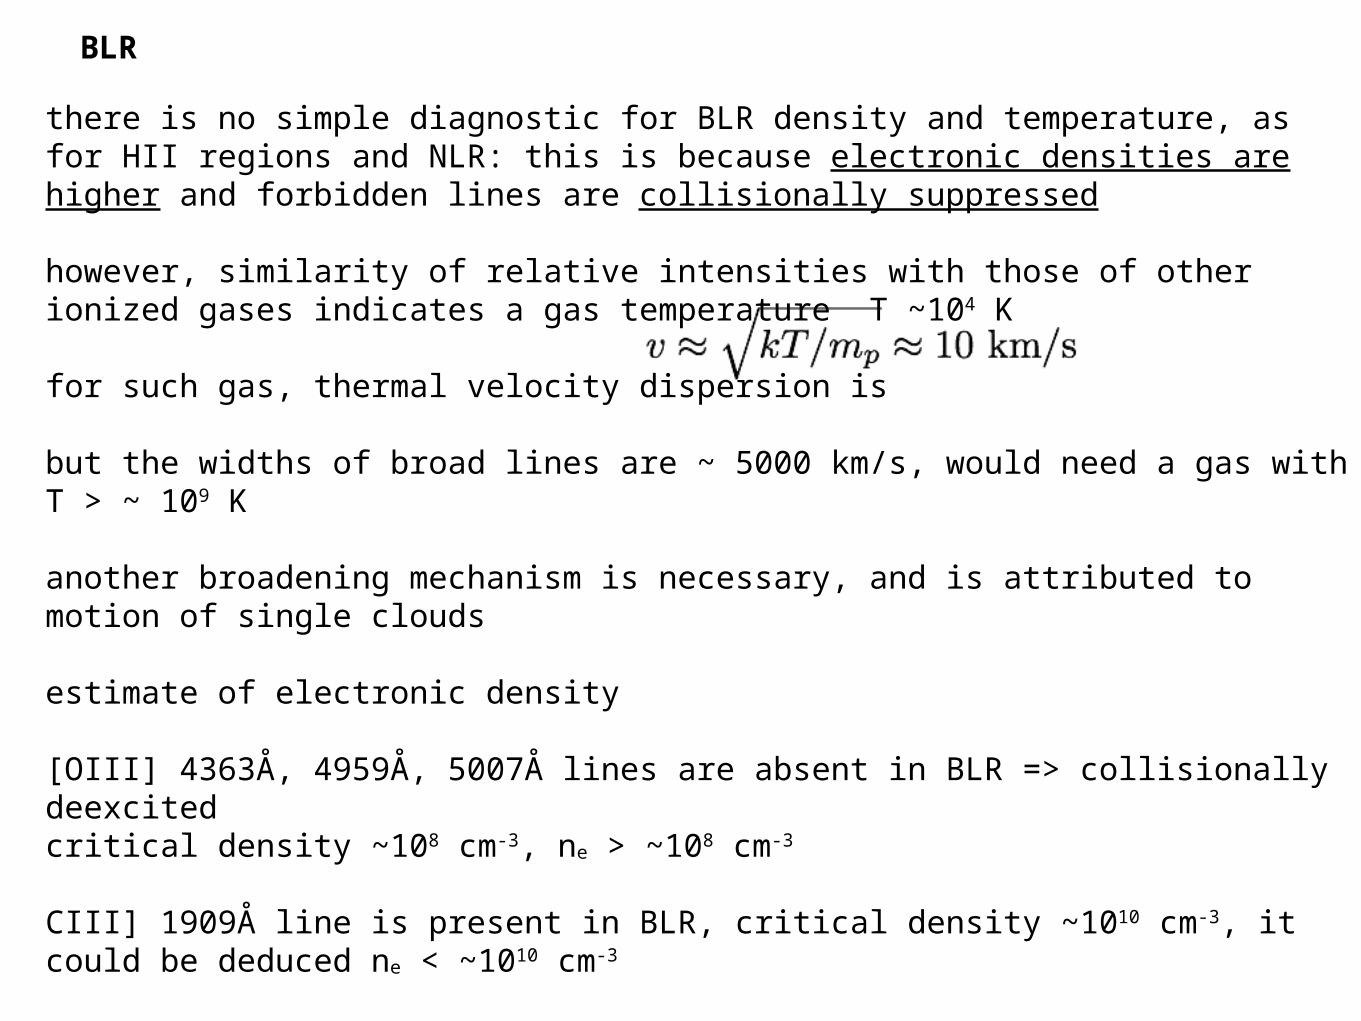
there is no simple diagnostic for BLR density and temperature, as for HII regions and NLR: this is because electronic densities are higher and forbidden lines are collisionally suppressed
however, similarity of relative intensities with those of other ionized gases indicates a gas temperature T ~104 K
for such gas, thermal velocity dispersion is
but the widths of broad lines are ~ 5000 km/s, would need a gas with T > ~ 109 K
another broadening mechanism is necessary, and is attributed to motion of single clouds
estimate of electronic density
[OIII] 4363Å, 4959Å, 5007Å lines are absent in BLR => collisionally deexcitedcritical density ~108 cm-3, ne > ~108 cm-3
CIII] 1909Å line is present in BLR, critical density ~1010 cm-3, it could be deduced ne < ~1010 cm-3
however, there is evidence of stratification, CIII] comes from a different region than other lines like CIV, Lyalpha etc. density in the region producing CIV 1549Å is probably ne ~1011 cm-3
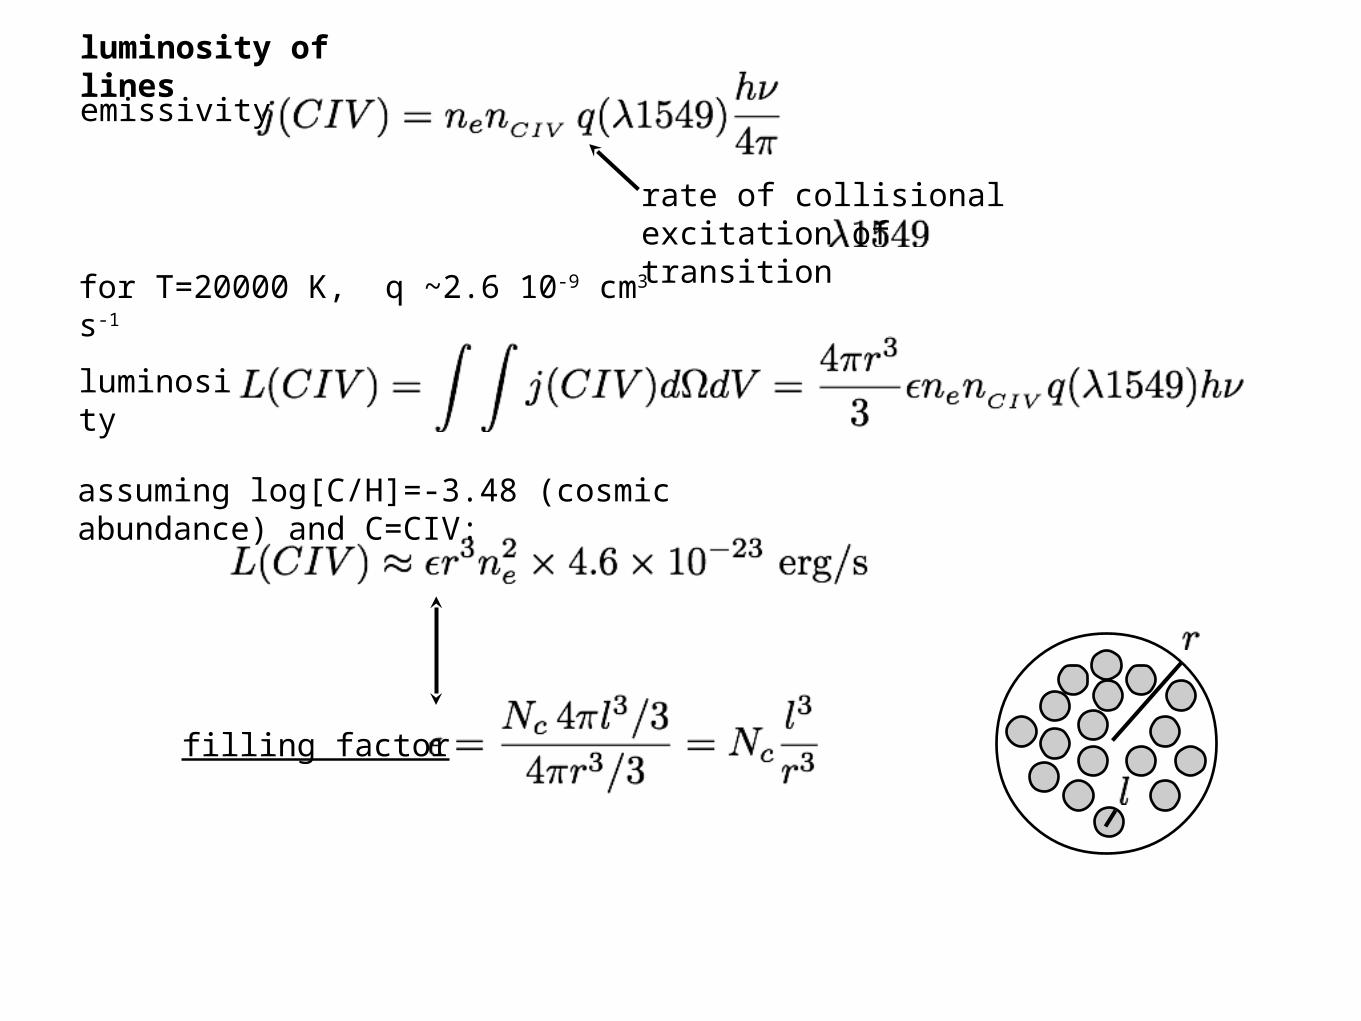
luminosity of lines
emissivity
rate of collisional excitation of transition
for T=20000 K, q ~2.6 10-9 cm3 s-1
luminosity
assuming log[C/H]=-3.48 (cosmic abundance) and C=CIV:
filling factor
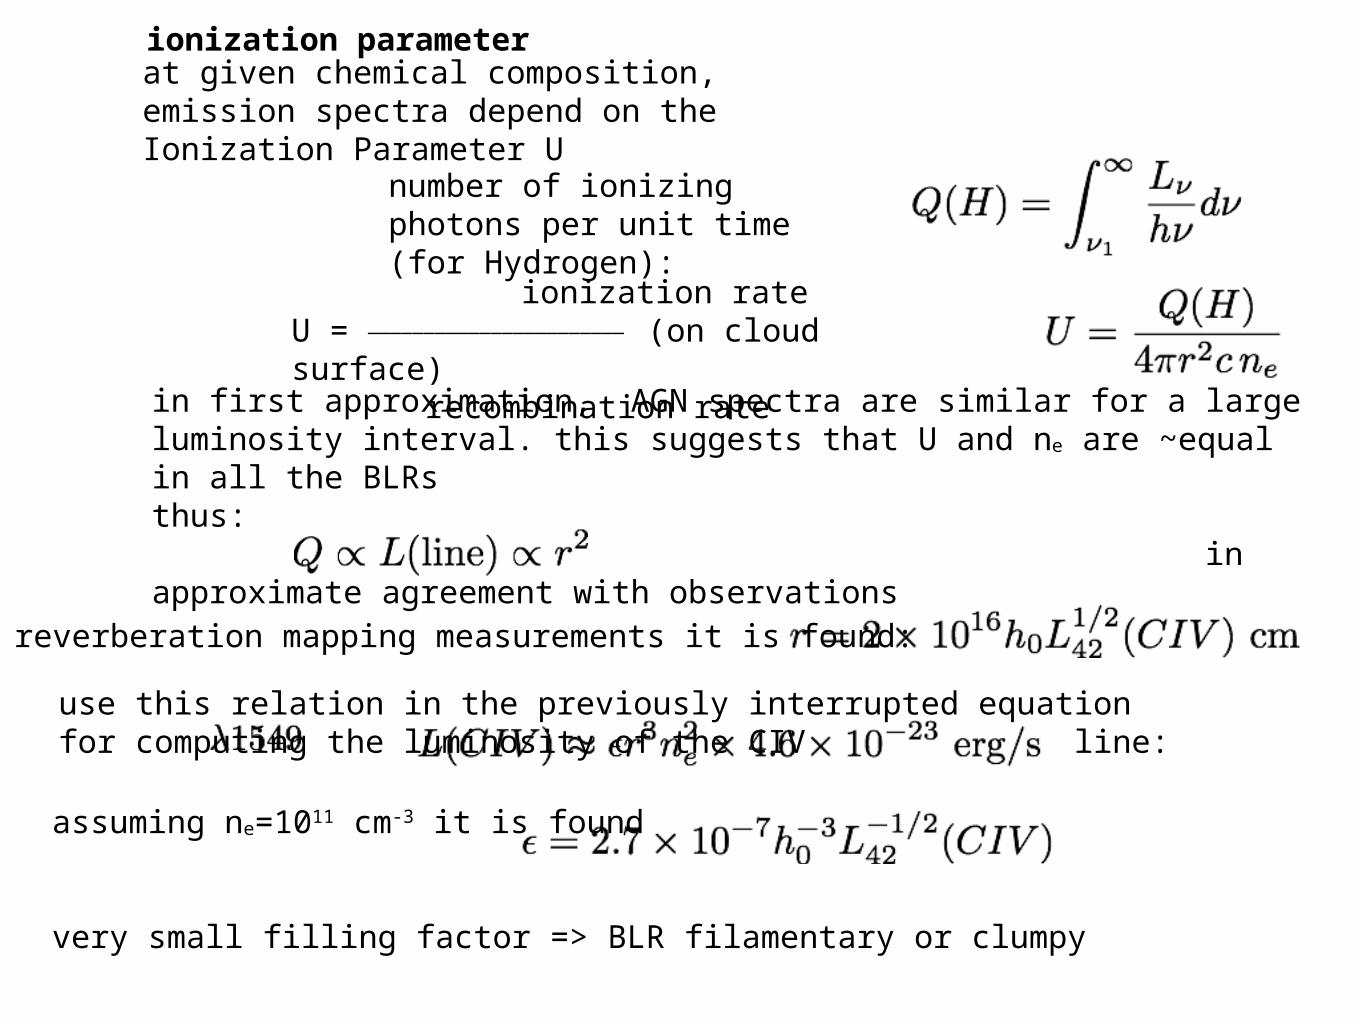
ionization parameter
assuming ne=1011 cm-3 it is found
very small filling factor => BLR filamentary or clumpy
number of ionizing photons per unit time (for Hydrogen):
ionization rateU = _______________________ (on cloud surface) recombination rate
at given chemical composition, emission spectra depend on the Ionization Parameter U
in first approximation, AGN spectra are similar for a large luminosity interval. this suggests that U and ne are ~equal in all the BLRsthus: in approximate agreement with observations
use this relation in the previously interrupted equation for computing the luminosity of the CIV line:
from reverberation mapping measurements it is found:
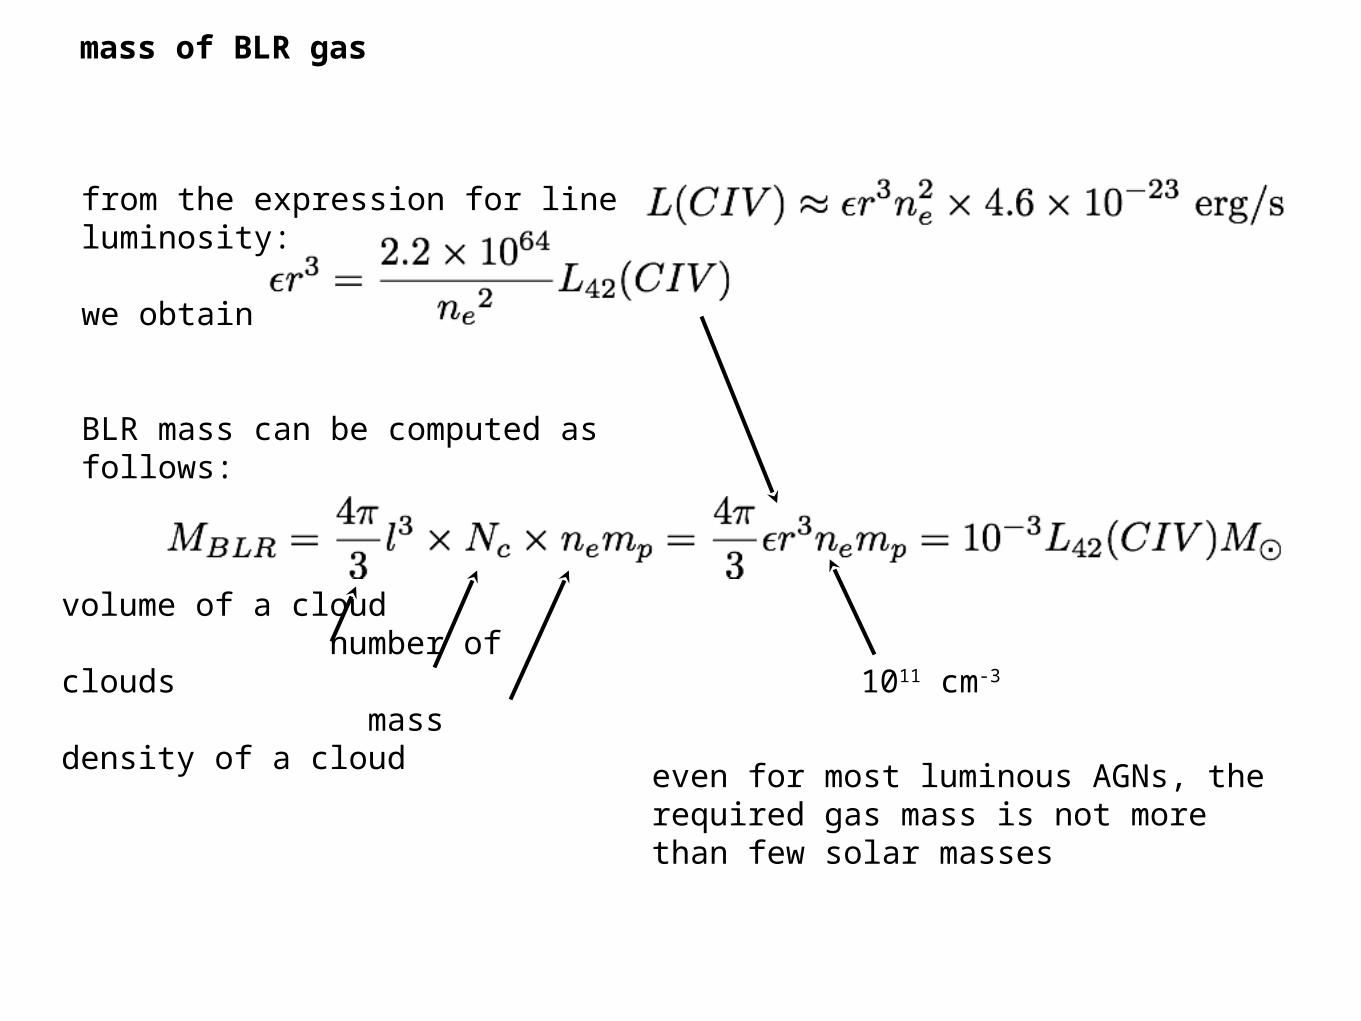
mass of BLR gas
from the expression for line luminosity:
we obtain
BLR mass can be computed as follows:
volume of a cloud number of clouds mass density of a cloud
1011 cm-3
even for most luminous AGNs, the required gas mass is not more than few solar masses
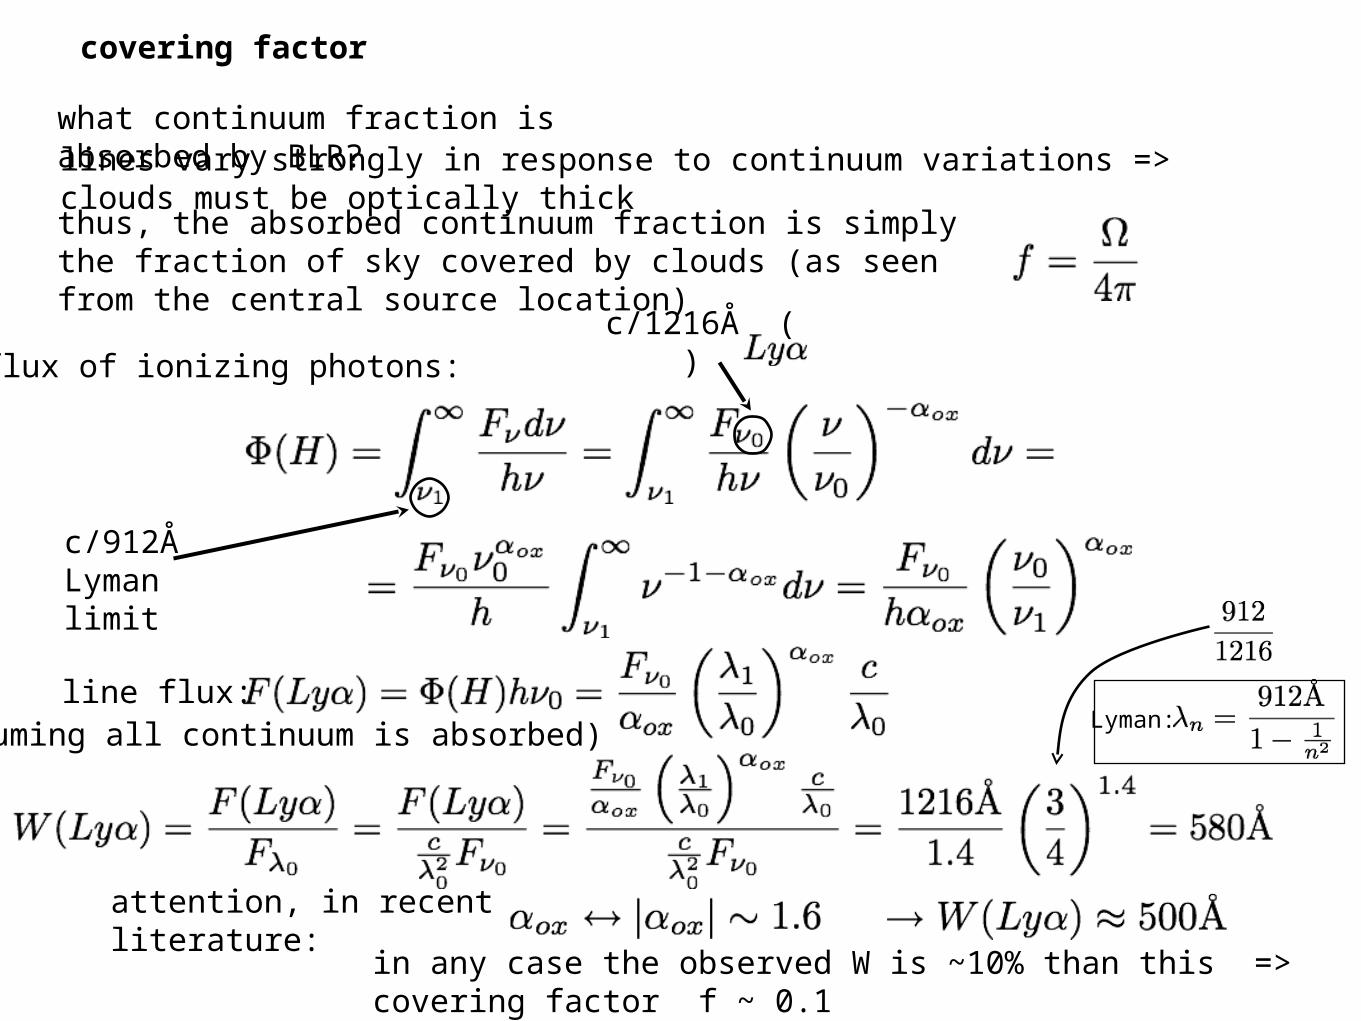
covering factor
what continuum fraction is absorbed by BLR?
c/1216Å ( )
c/912ÅLyman limit
line flux:
lines vary strongly in response to continuum variations => clouds must be optically thickthus, the absorbed continuum fraction is simply the fraction of sky covered by clouds (as seen from the central source location)
flux of ionizing photons:
(assuming all continuum is absorbed)
in any case the observed W is ~10% than this => covering factor f ~ 0.1
attention, in recent literature:
Lyman:
[ ]
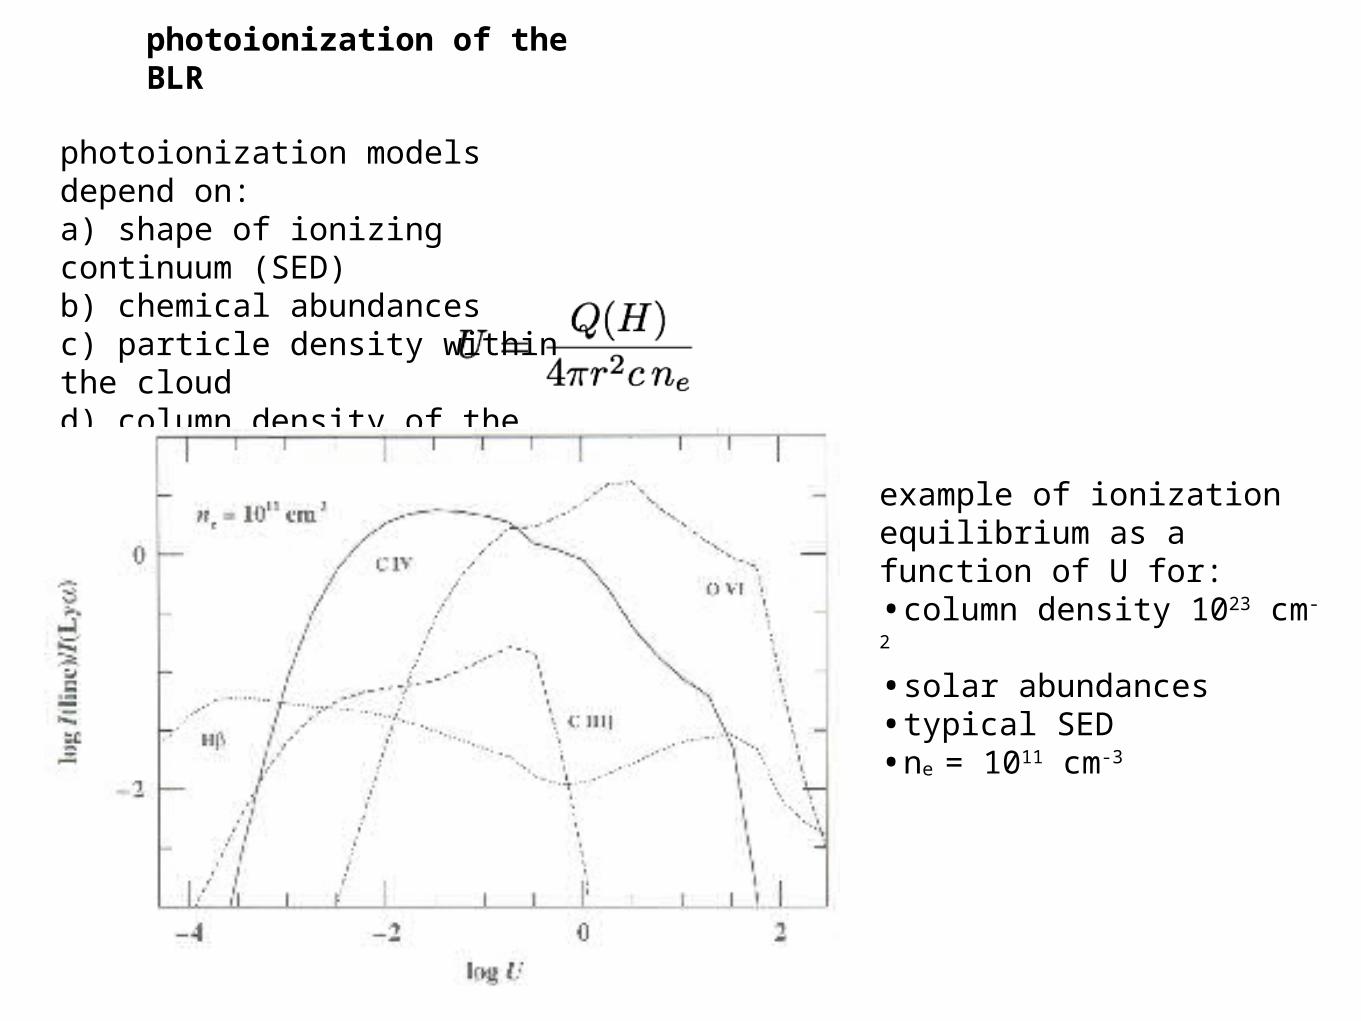
photoionization of the BLR
photoionization models depend on:a) shape of ionizing continuum (SED)b) chemical abundancesc) particle density within the cloudd) column density of the cloude) ionization parameter
example of ionization equilibrium as a function of U for:•column density 1023 cm-2
•solar abundances•typical SED•ne = 1011 cm-3
photoionization of the BLR
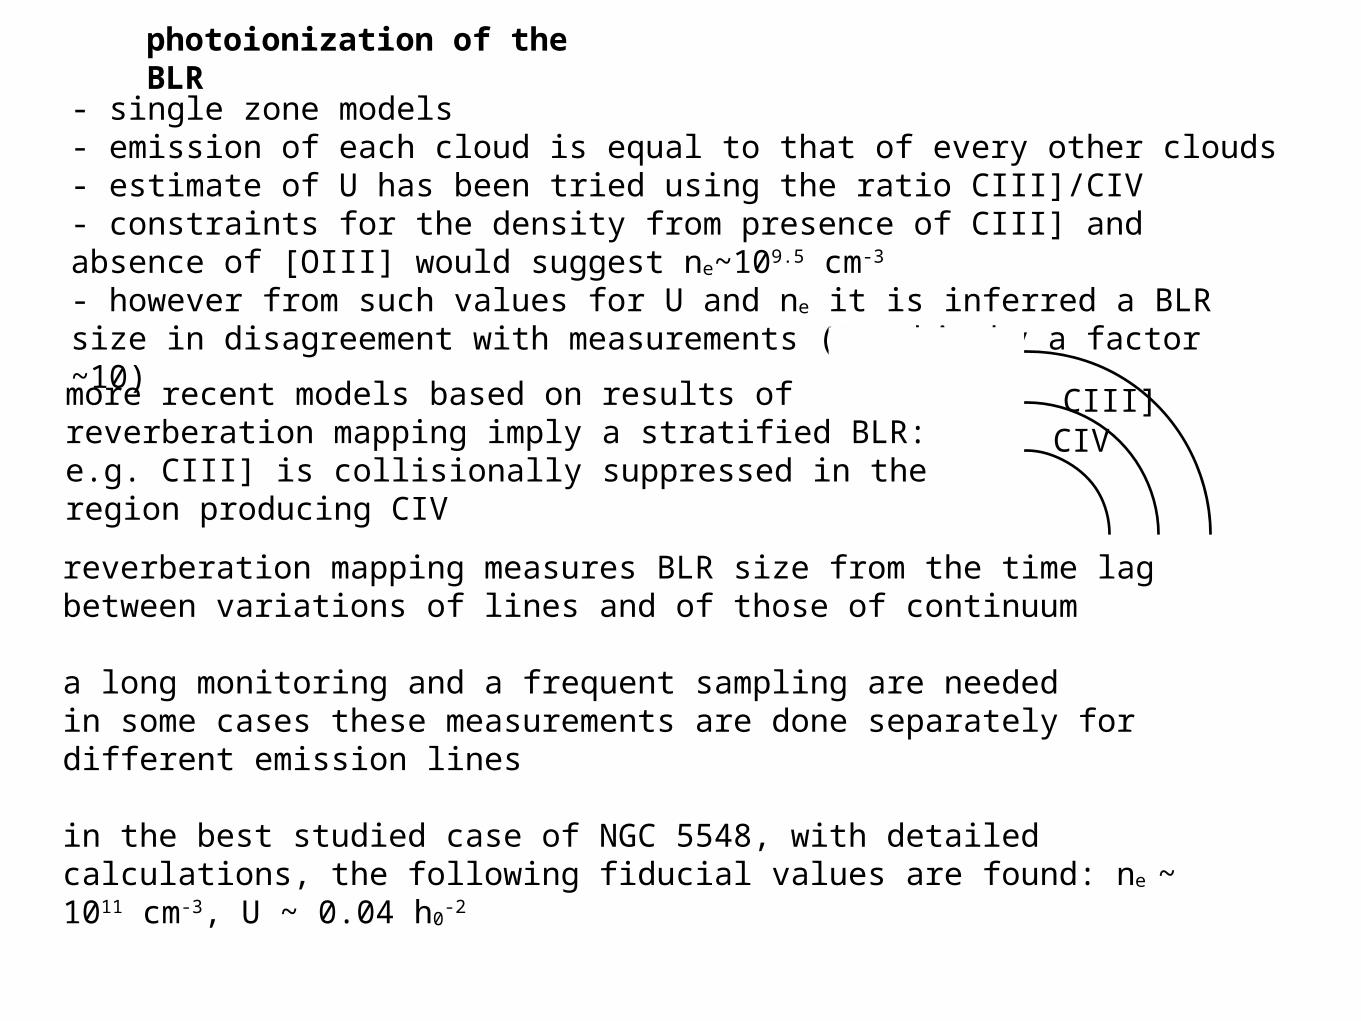
- single zone models- emission of each cloud is equal to that of every other clouds- estimate of U has been tried using the ratio CIII]/CIV - constraints for the density from presence of CIII] and absence of [OIII] would suggest ne~109.5 cm-3
- however from such values for U and ne it is inferred a BLR size in disagreement with measurements (too big by a factor ~10)
CIVCIII]more recent models based on results of reverberation
mapping imply a stratified BLR: e.g. CIII] is collisionally suppressed in the region producing CIV
reverberation mapping measures BLR size from the time lag between variations of lines and of those of continuum
a long monitoring and a frequent sampling are neededin some cases these measurements are done separately for different emission lines
in the best studied case of NGC 5548, with detailed calculations, the following fiducial values are found: ne ~ 1011 cm-3, U ~ 0.04 h0
-2
line profiles
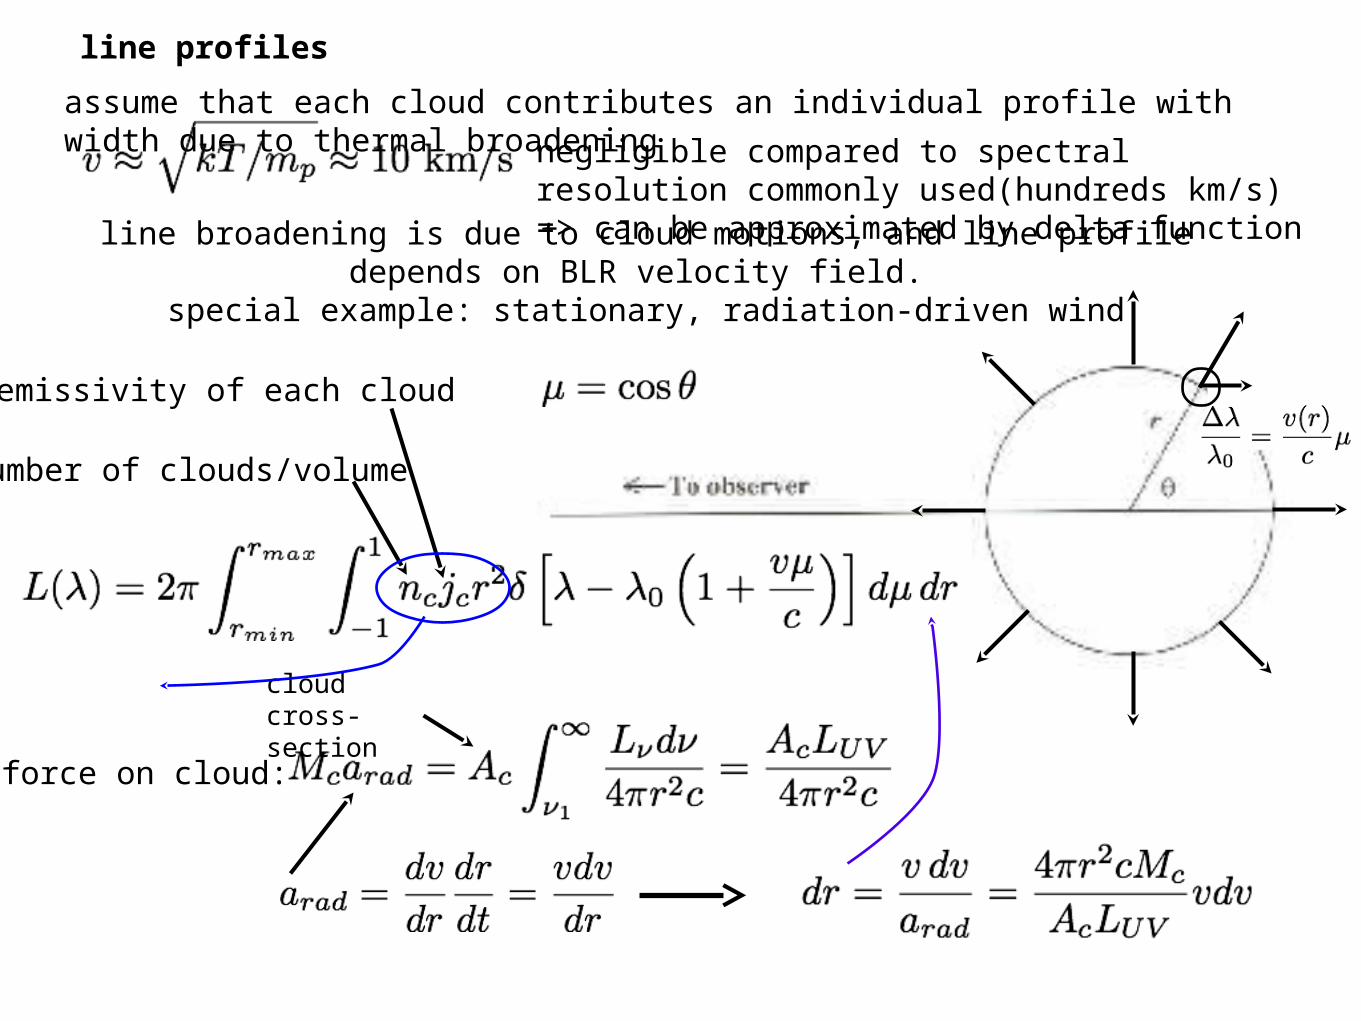
assume that each cloud contributes an individual profile with width due to thermal broadening negligible compared to spectral resolution
commonly used(hundreds km/s) => can be approximated by delta functionline broadening is due to cloud motions, and line profile depends on BLR velocity field.
special example: stationary, radiation-driven wind
number of clouds/volume
emissivity of each cloud
force on cloud:
cloud cross-section
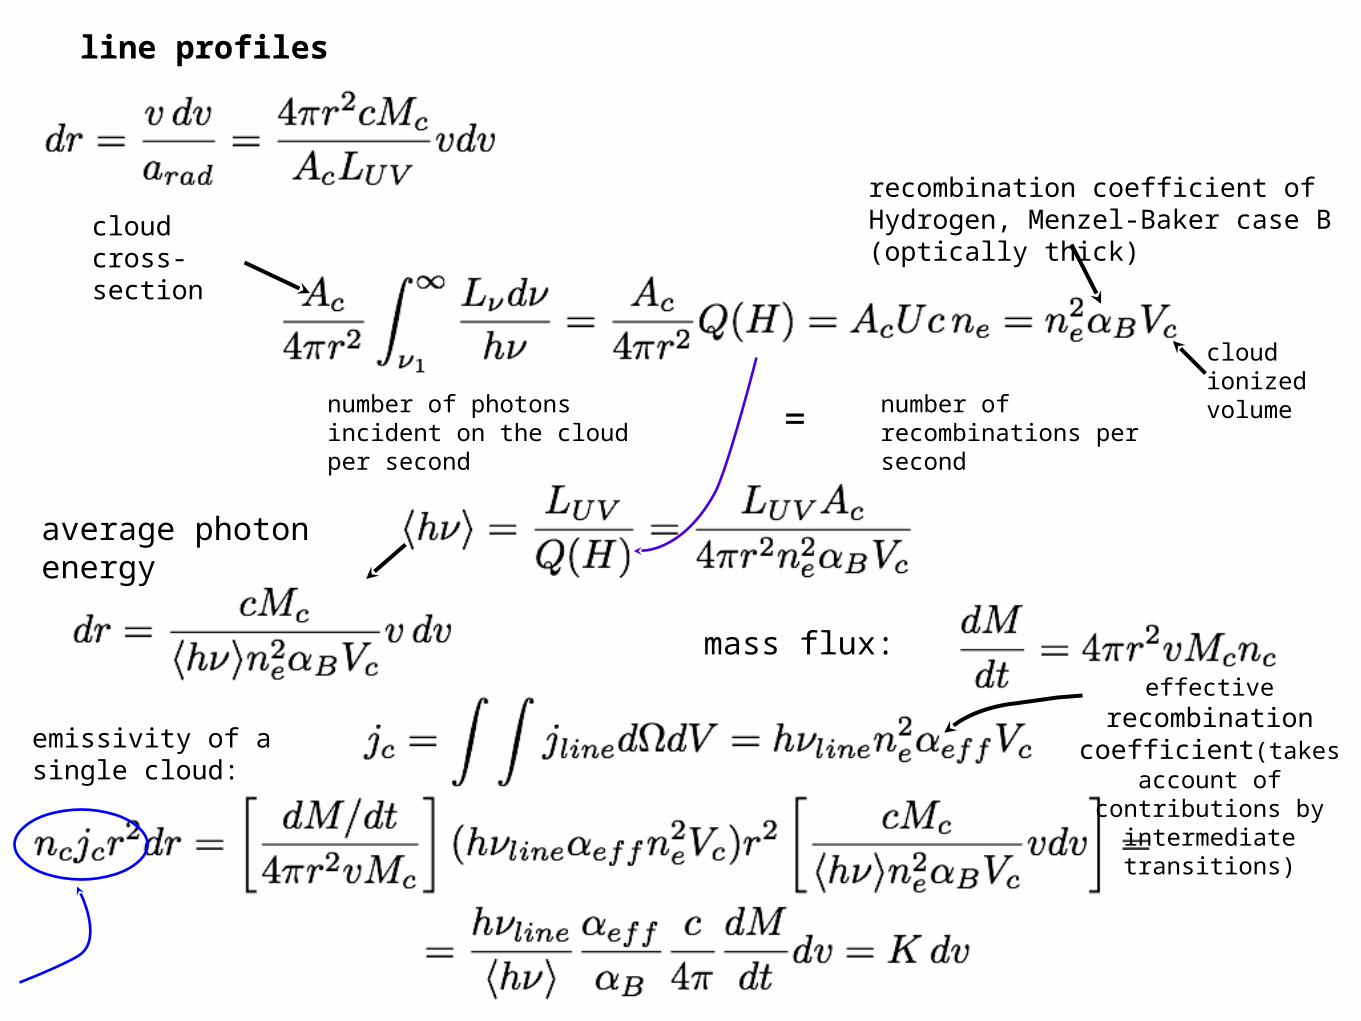
line profiles
cloud cross-section
number of photons incident on the cloud per second
= number of recombinations per second
recombination coefficient of Hydrogen, Menzel-Baker case B (optically thick)
average photon energy
mass flux:
emissivity of a single cloud:
cloud ionized volume
effective recombination coefficient(takes
account of contributions by intermediate
transitions)
line profiles
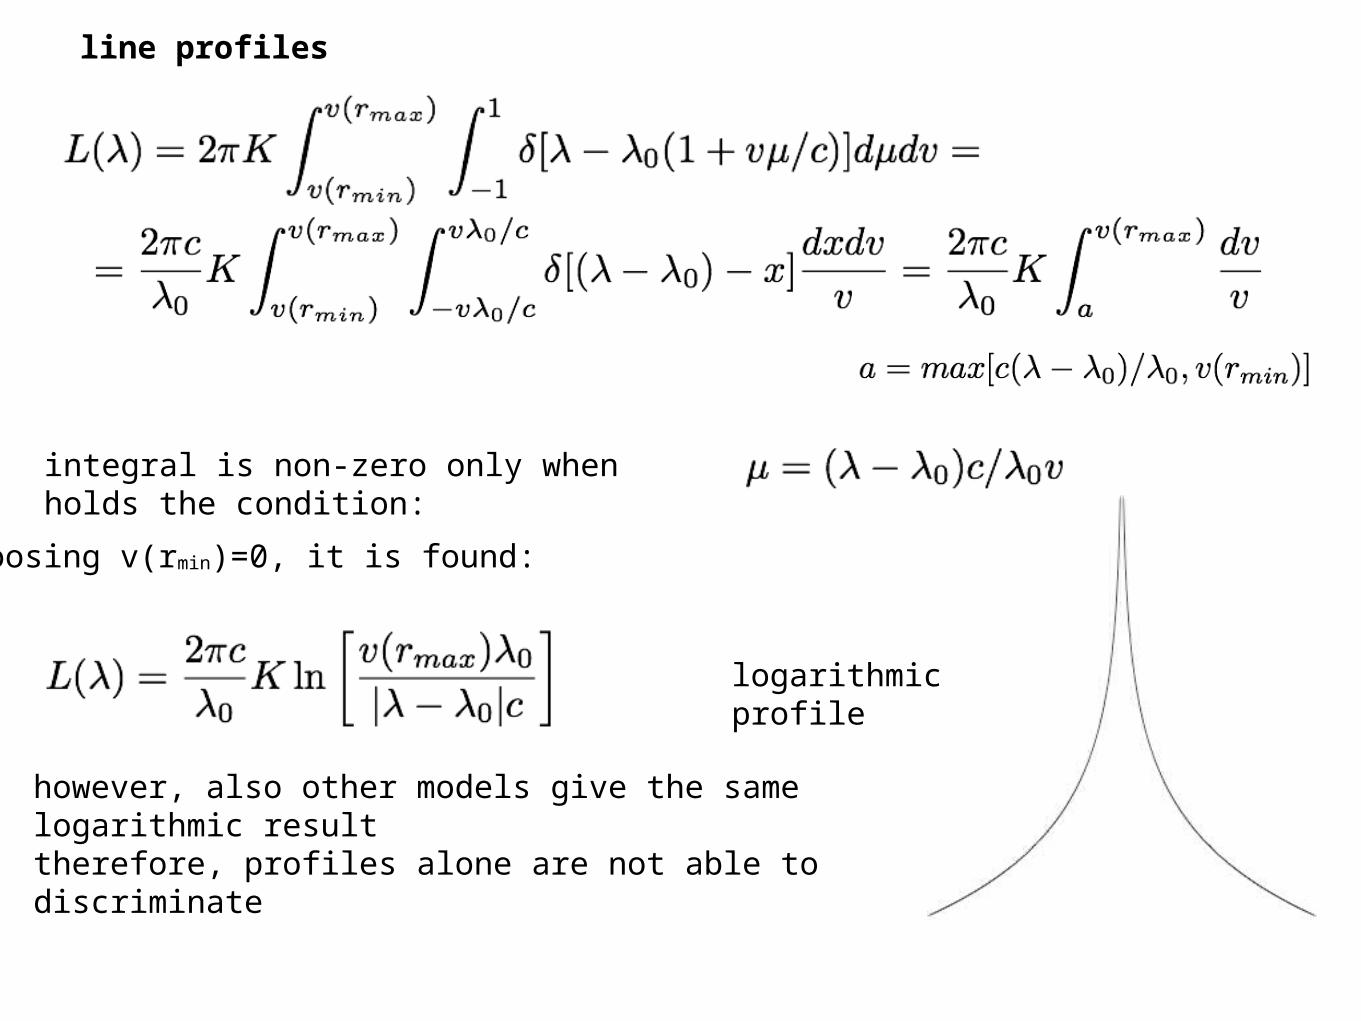
integral is non-zero only when holds the condition:
logarithmic profile
however, also other models give the same logarithmic resulttherefore, profiles alone are not able to discriminate
choosing v(rmin)=0, it is found:
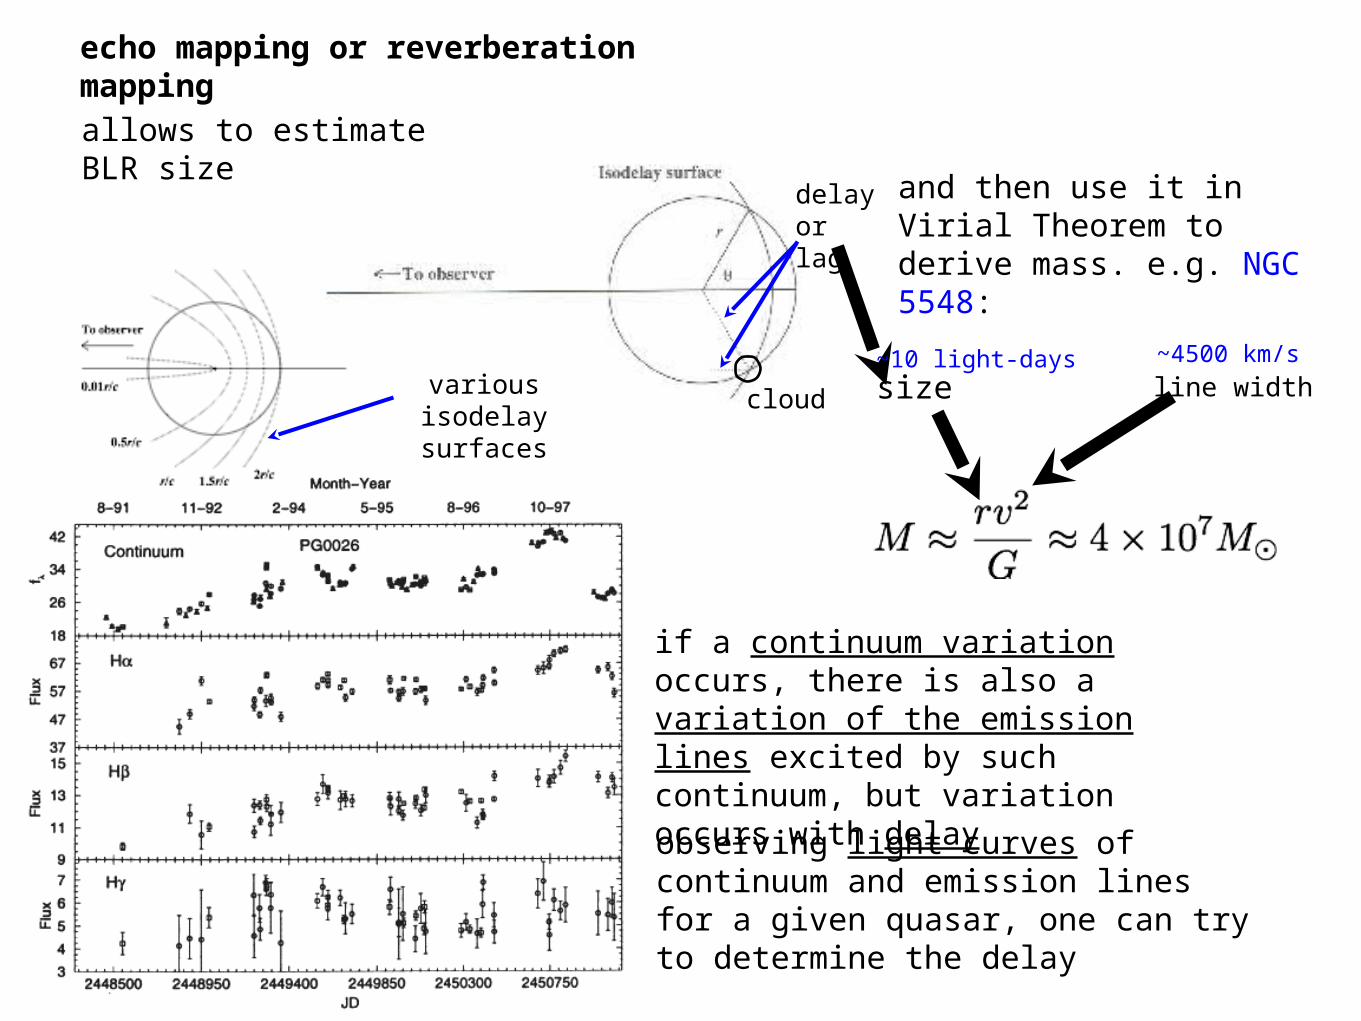
allows to estimate BLR size
echo mapping or reverberation mapping
and then use it in Virial Theorem to derive mass. e.g. NGC 5548:
size line width
observing light curves of continuum and emission lines for a given quasar, one can try to determine the delay
if a continuum variation occurs, there is also a variation of the emission lines excited by such continuum, but variation occurs with delay
~10 light-days ~4500 km/s
cloud
delay or lag
various isodelay surfaces
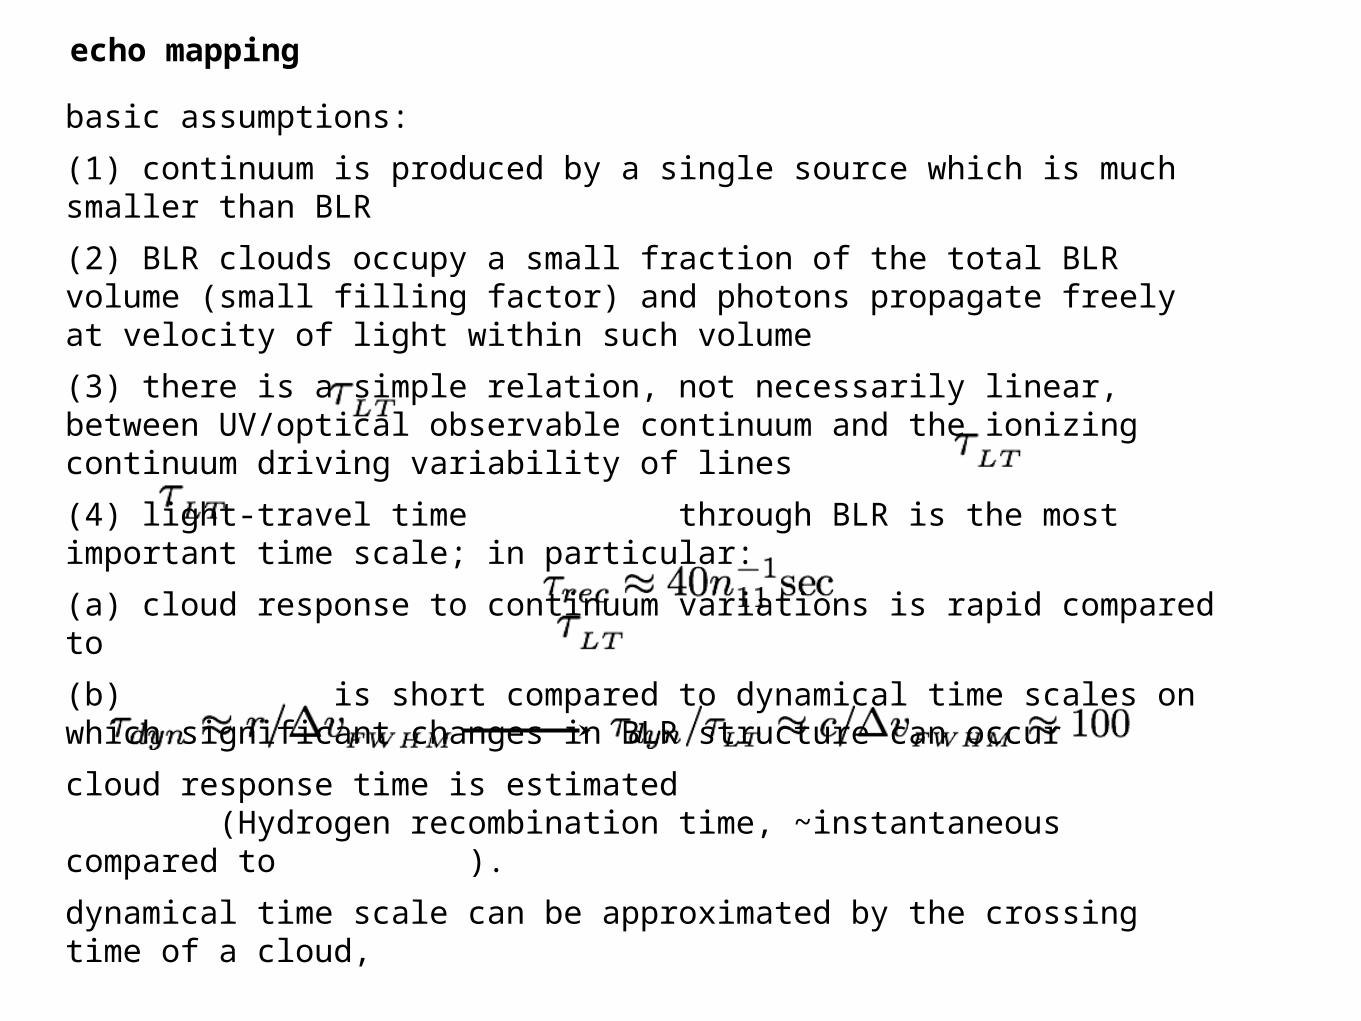
echo mapping
basic assumptions:
(1) continuum is produced by a single source which is much smaller than BLR
(2) BLR clouds occupy a small fraction of the total BLR volume (small filling factor) and photons propagate freely at velocity of light within such volume
(3) there is a simple relation, not necessarily linear, between UV/optical observable continuum and the ionizing continuum driving variability of lines
(4) light-travel time through BLR is the most important time scale; in particular:
(a) cloud response to continuum variations is rapid compared to
(b) is short compared to dynamical time scales on which significant changes in BLR structure can occur
cloud response time is estimated (Hydrogen recombination time, ~instantaneous compared to ).
dynamical time scale can be approximated by the crossing time of a cloud,
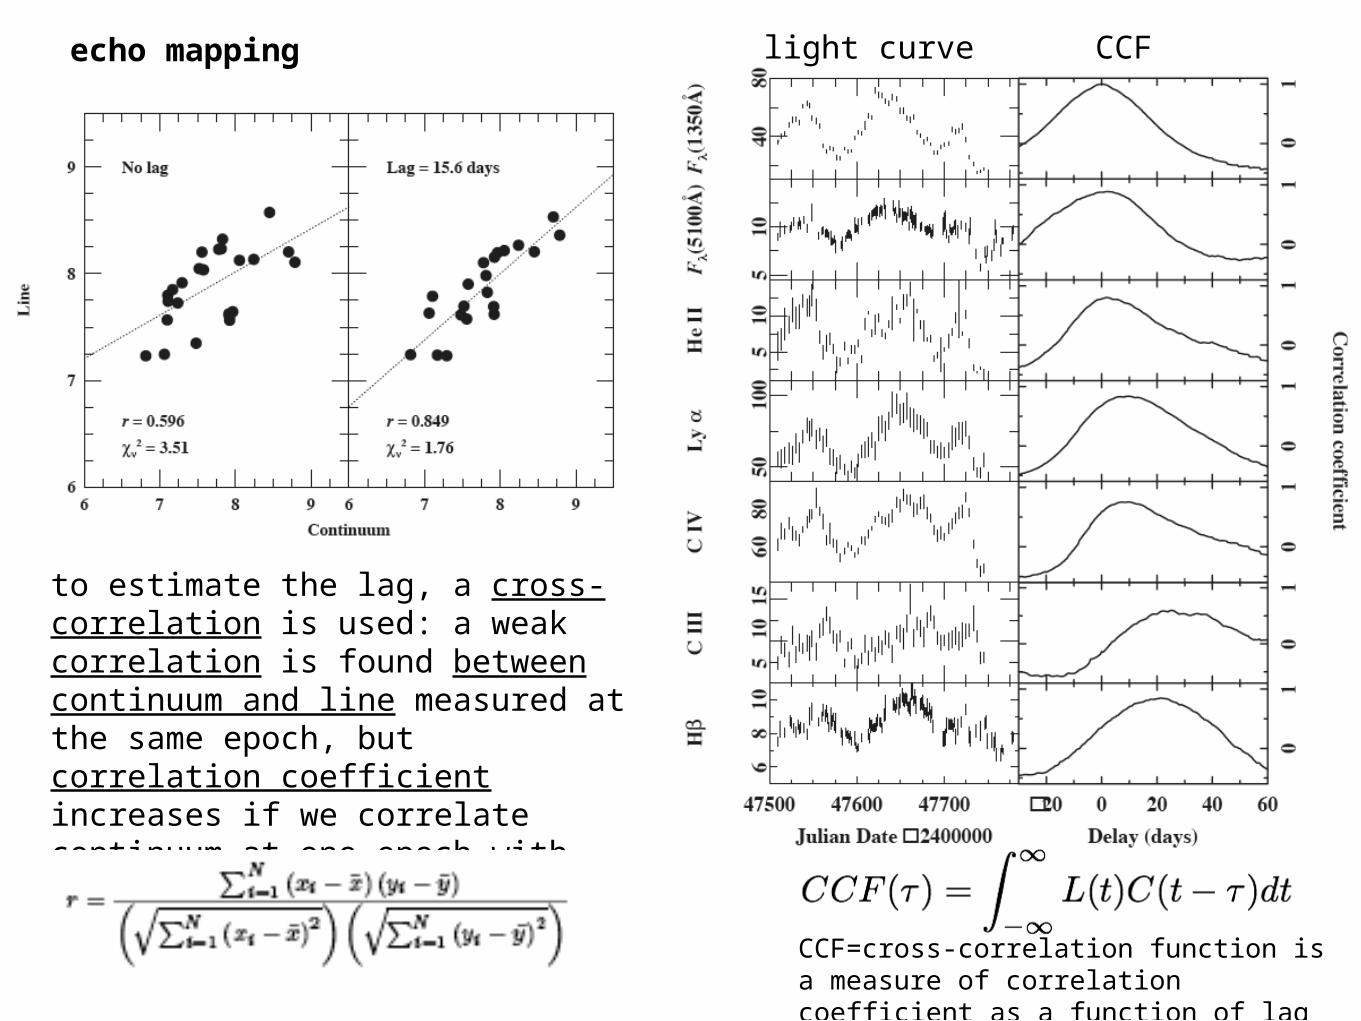
echo mapping
to estimate the lag, a cross-correlation is used: a weak correlation is found between continuum and line measured at the same epoch, but correlation coefficient increases if we correlate continuum at one epoch with emission line at a delayed epoch
light curve CCF
CCF=cross-correlation function is a measure of correlation coefficient as a function of lag
Seyfe
rt
gala
xie
sq
uasa
rs
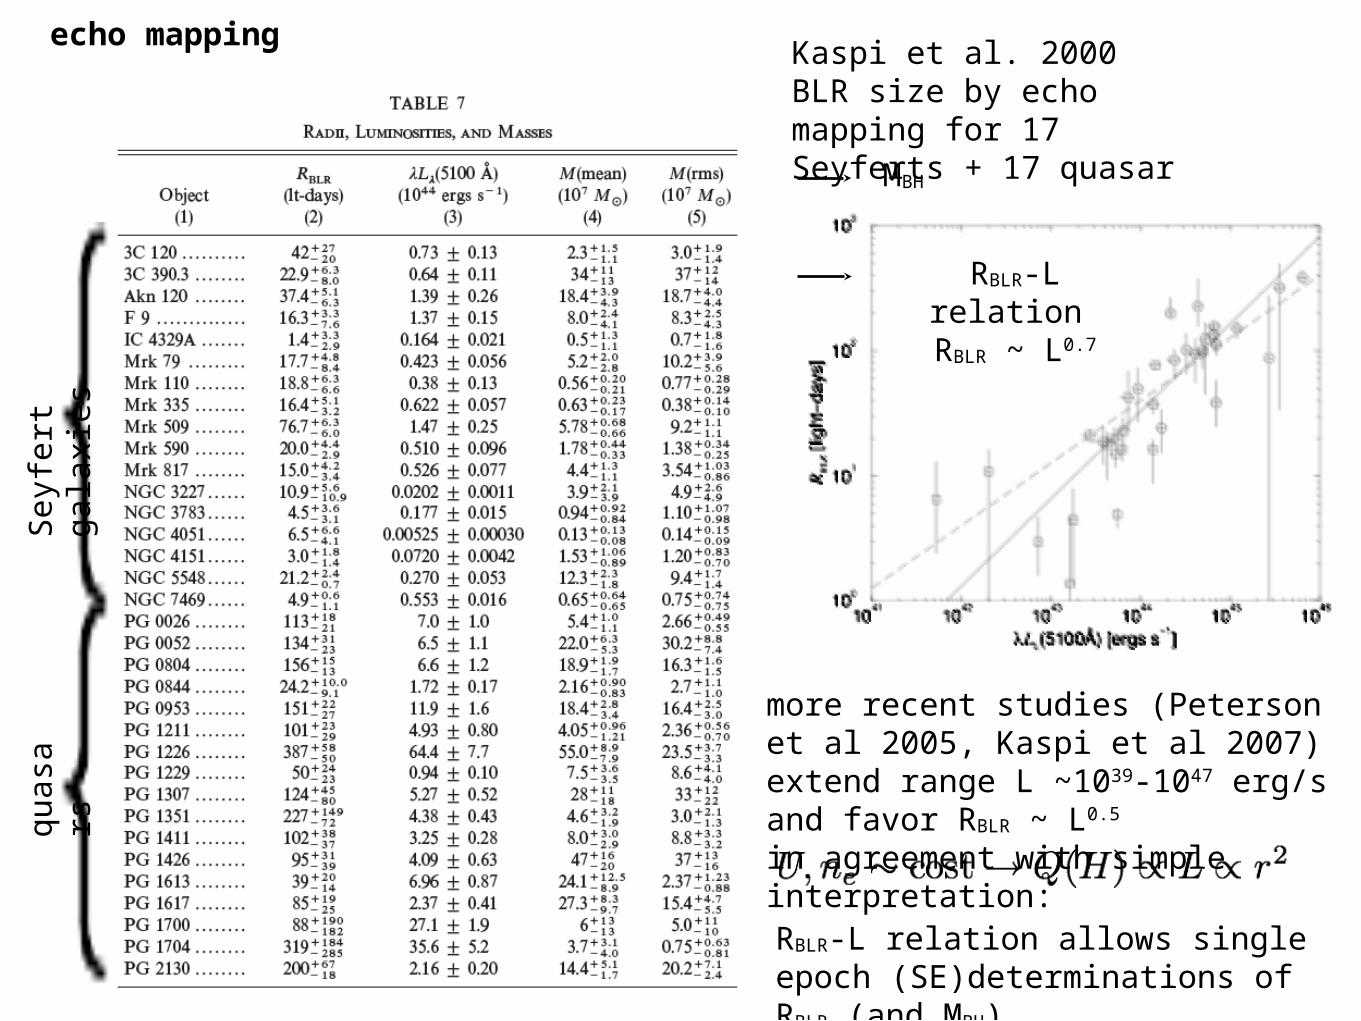
echo mappingKaspi et al. 2000BLR size by echo mapping for 17 Seyferts + 17 quasarMBH
RBLR-L relation RBLR ~ L0.7
RBLR-L relation allows single epoch (SE)determinations of RBLR (and MBH)
more recent studies (Peterson et al 2005, Kaspi et al 2007) extend range L ~1039-1047 erg/s and favor RBLR ~ L0.5
in agreement with simple interpretation:
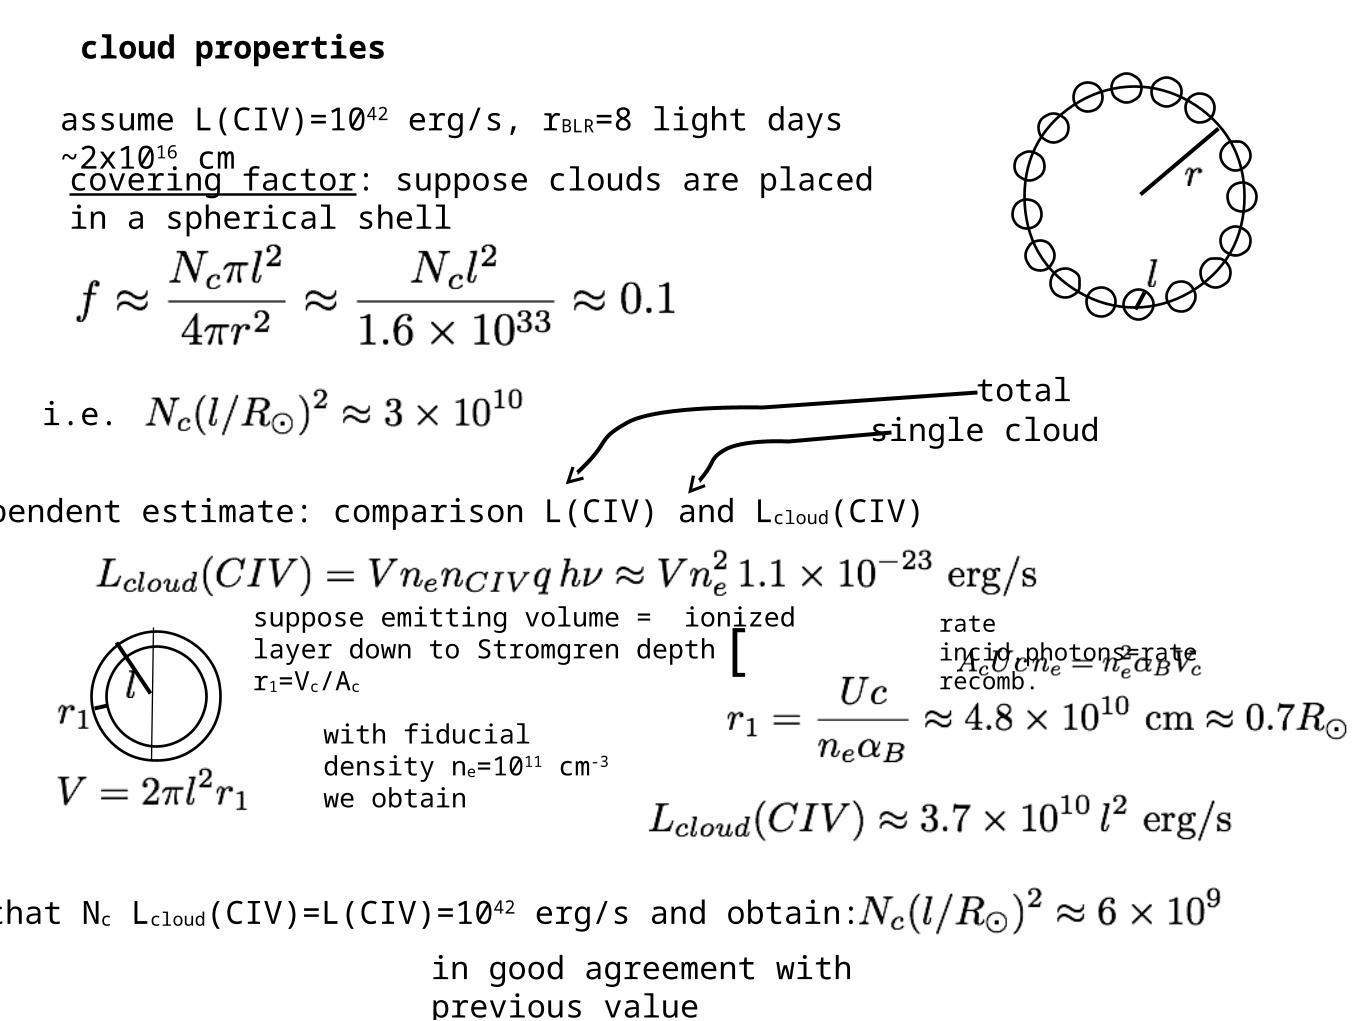
cloud properties
assume L(CIV)=1042 erg/s, rBLR=8 light days ~2x10¹⁶ cmcovering factor: suppose clouds are placed in a spherical shell
i.e.
independent estimate: comparison L(CIV) and Lcloud(CIV)
suppose emitting volume = ionized layer down to Stromgren depth r1=Vc/Ac
with fiducial density ne=1011 cm-3 we obtain
ask that Nc Lcloud(CIV)=L(CIV)=1042 erg/s and obtain:
in good agreement with previous value
totalsingle cloud
[ ]rate incid.photons=rate recomb.
cloud properties
line profiles are smooth and do not show any structure if observed at high resolution, therefore statistical fluctuations in the number of clouds per resolution element must be lower than S/N ratio. numerical simulations indicate Nc > ~ 5x10⁴
some hypotheses on the nature of clouds:
- dense condensations in pressure equilibrium with an external thinner and hotter medium able to confine them. some confining medium is needed because clouds are too small to be self-gravitating. indeed, Jeans mass is:
- also magnetic confinment has been proposed
- stellar athmospheres, but works only with low surface gravity giants. moreover, large number, e.g. Nc~106, and the small fraction of giants on the stellar population (~10-4) would require a total stellar mass ~ within the BLR
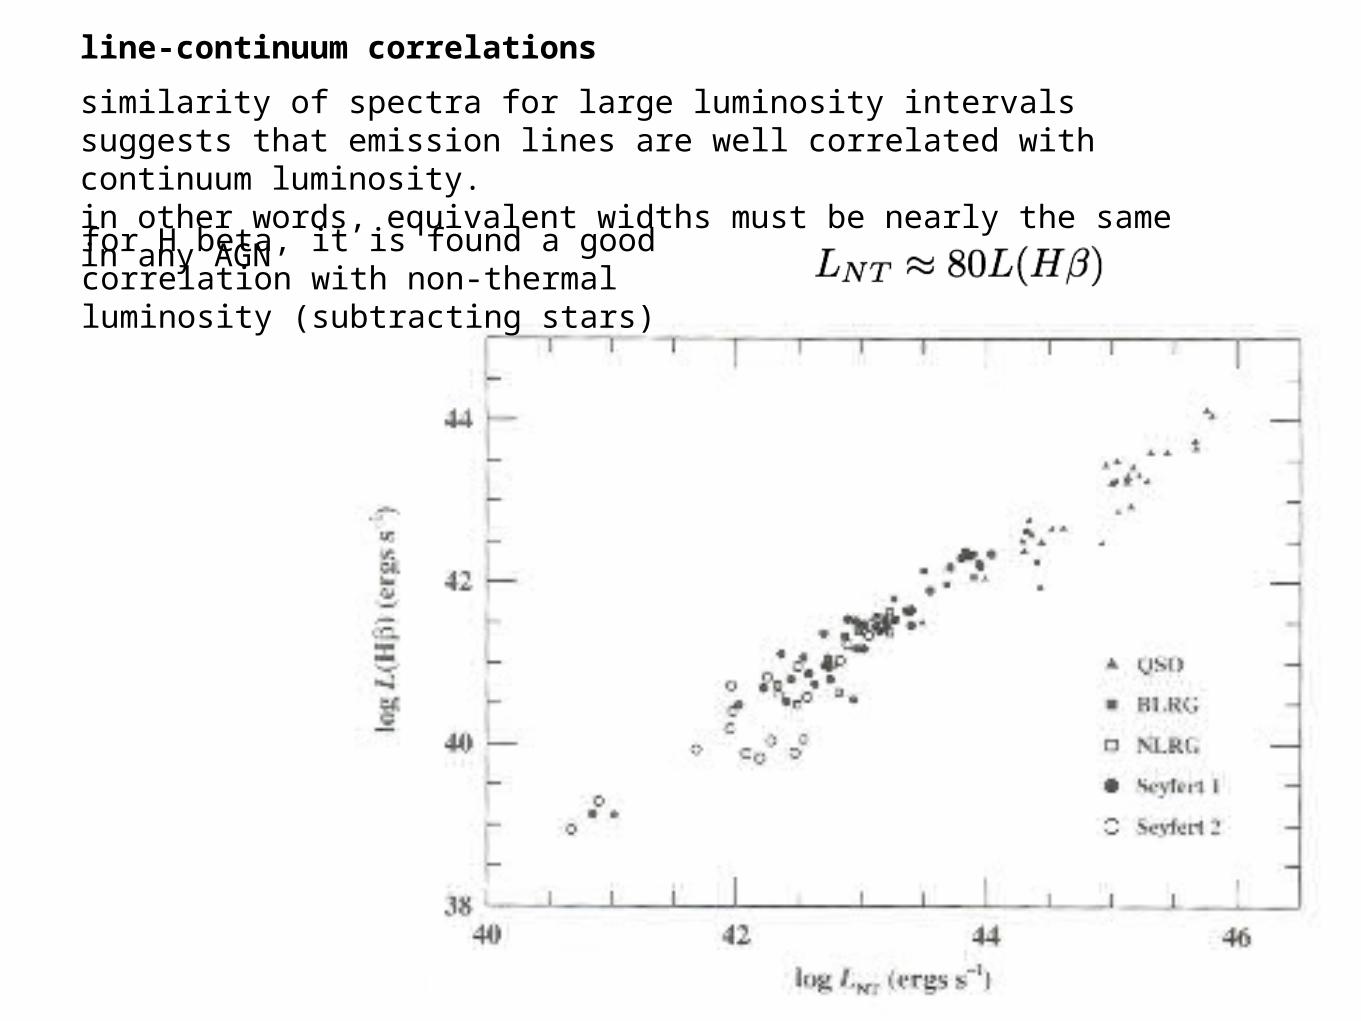
line-continuum correlations
similarity of spectra for large luminosity intervals suggests that emission lines are well correlated with continuum luminosity.in other words, equivalent widths must be nearly the same in any AGNfor H beta, it is found a good correlation with non-thermal luminosity (subtracting stars)
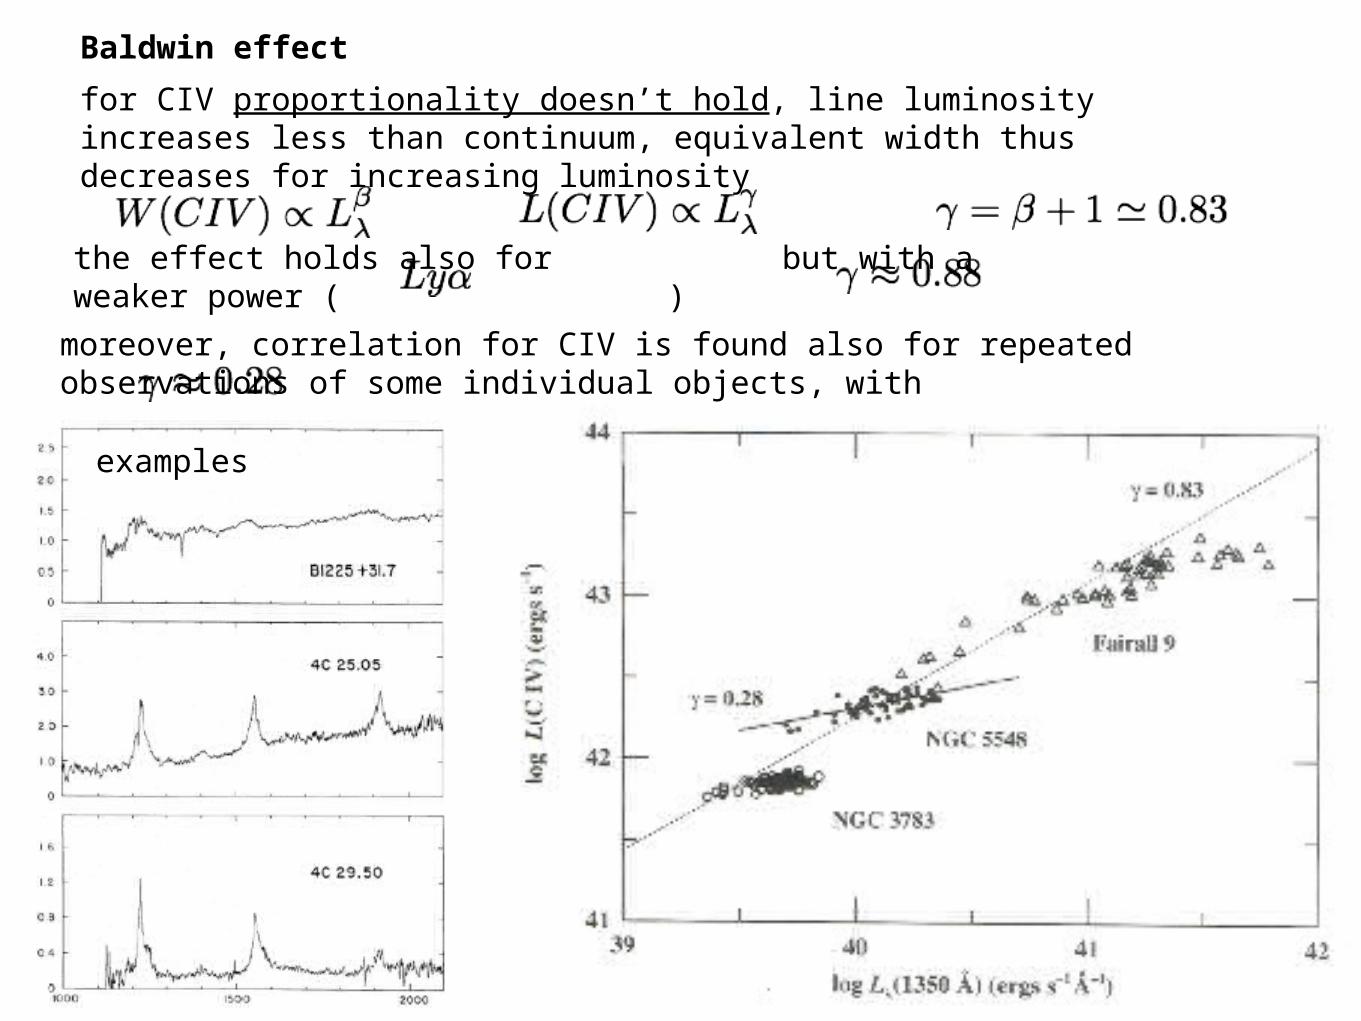
Baldwin effect
for CIV proportionality doesn’t hold, line luminosity increases less than continuum, equivalent width thus decreases for increasing luminosity
the effect holds also for but with a weaker power ( )
moreover, correlation for CIV is found also for repeated observations of some individual objects, with
examples
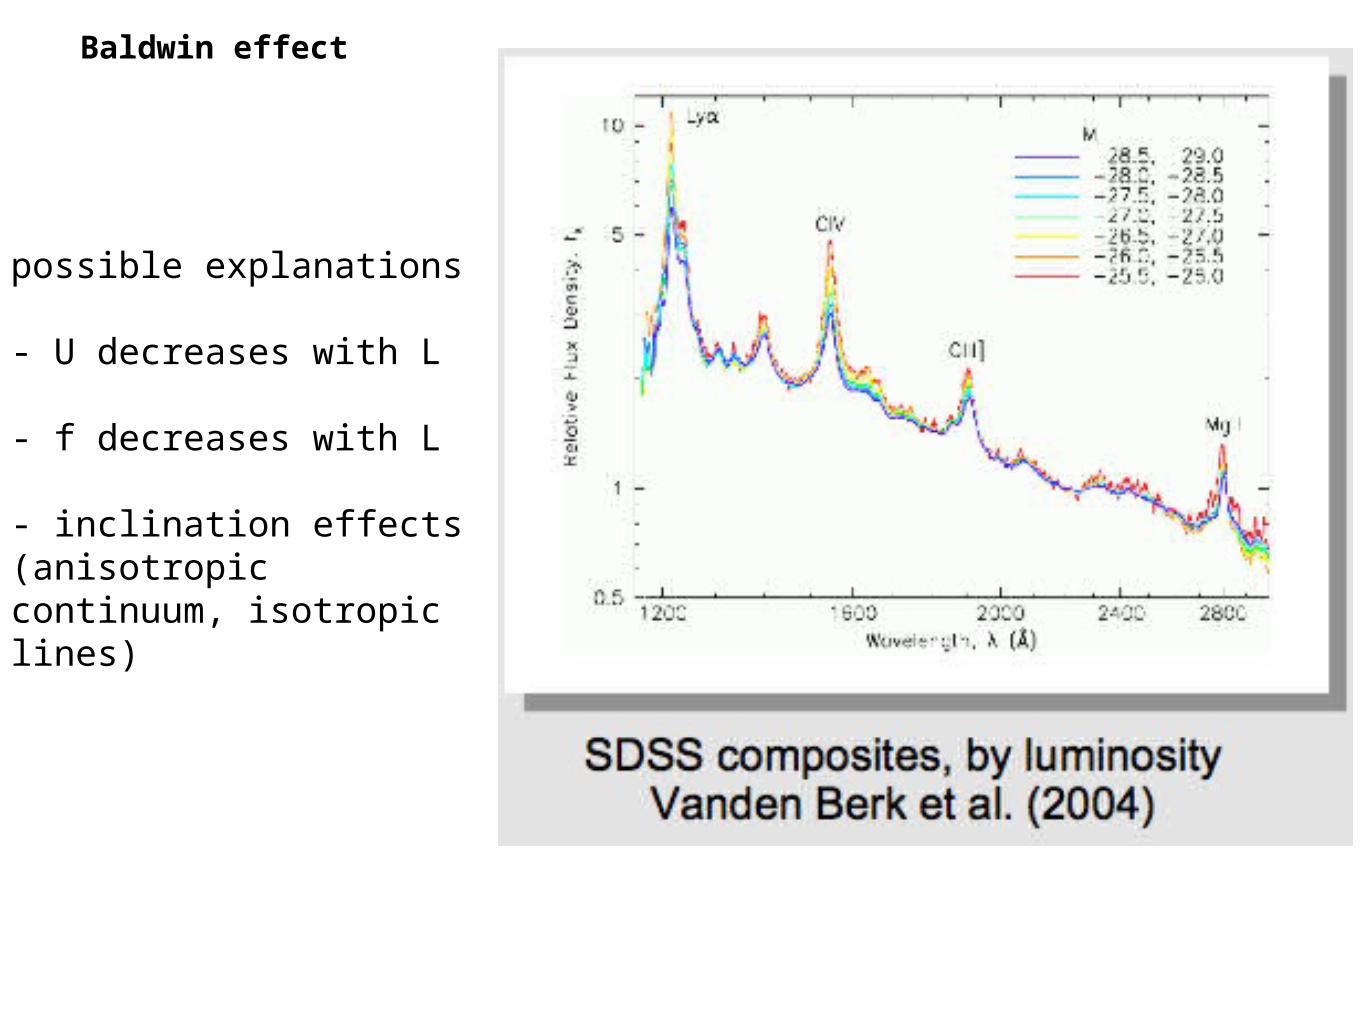
Baldwin effect
possible explanations
- U decreases with L
- f decreases with L
- inclination effects (anisotropic continuum, isotropic lines)
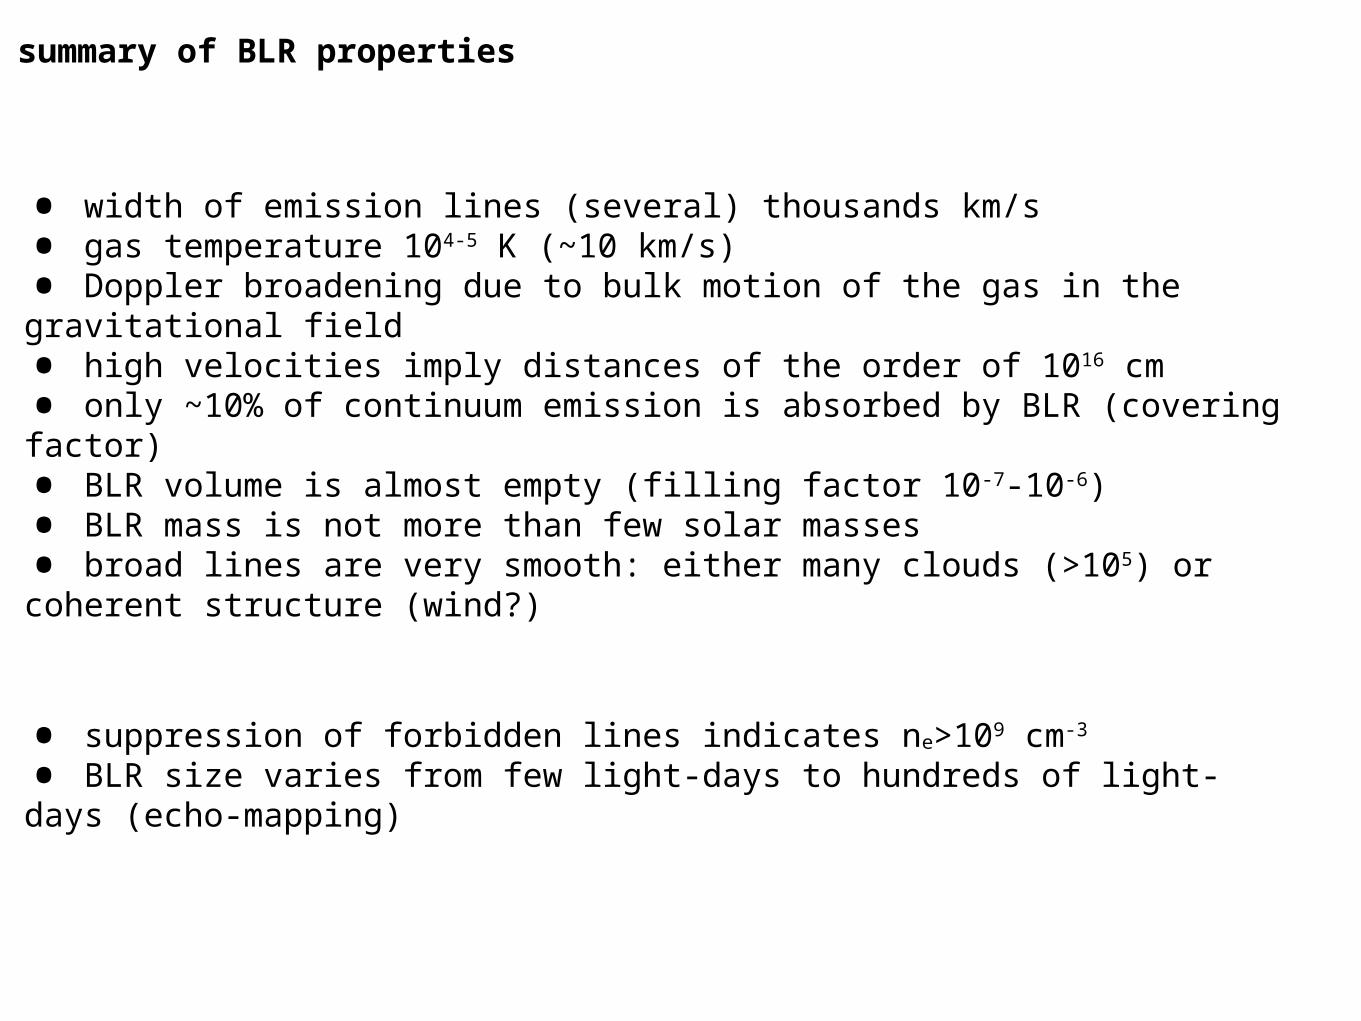
• width of emission lines (several) thousands km/s
• gas temperature 104-5 K (~10 km/s)
• Doppler broadening due to bulk motion of the gas in the gravitational field
• high velocities imply distances of the order of 1016 cm
• only ~10% of continuum emission is absorbed by BLR (covering factor)
• BLR volume is almost empty (filling factor 10-7-10-6)
• BLR mass is not more than few solar masses
• broad lines are very smooth: either many clouds (>105) or coherent structure (wind?)
• suppression of forbidden lines indicates ne>109 cm-3
• BLR size varies from few light-days to hundreds of light-days (echo-mapping)
summary of BLR properties
Narrow Line Region
it is interesting for at least 3 reasons:
1) it is the largest-scale region where ionizing radiation from central source dominates on other sources
2) it is the only AGN component spatially resolved in the optical
3) NLR dynamics can provide information on the way AGNs are fed
differently from BLR, electronic densities are low enough that many forbidden transitions are not collisionally suppressed. this allows to use line intensity ratios to measure densities and temperatures of the gas
a complication is constituted by dust, because NLR is external to sublimation radius
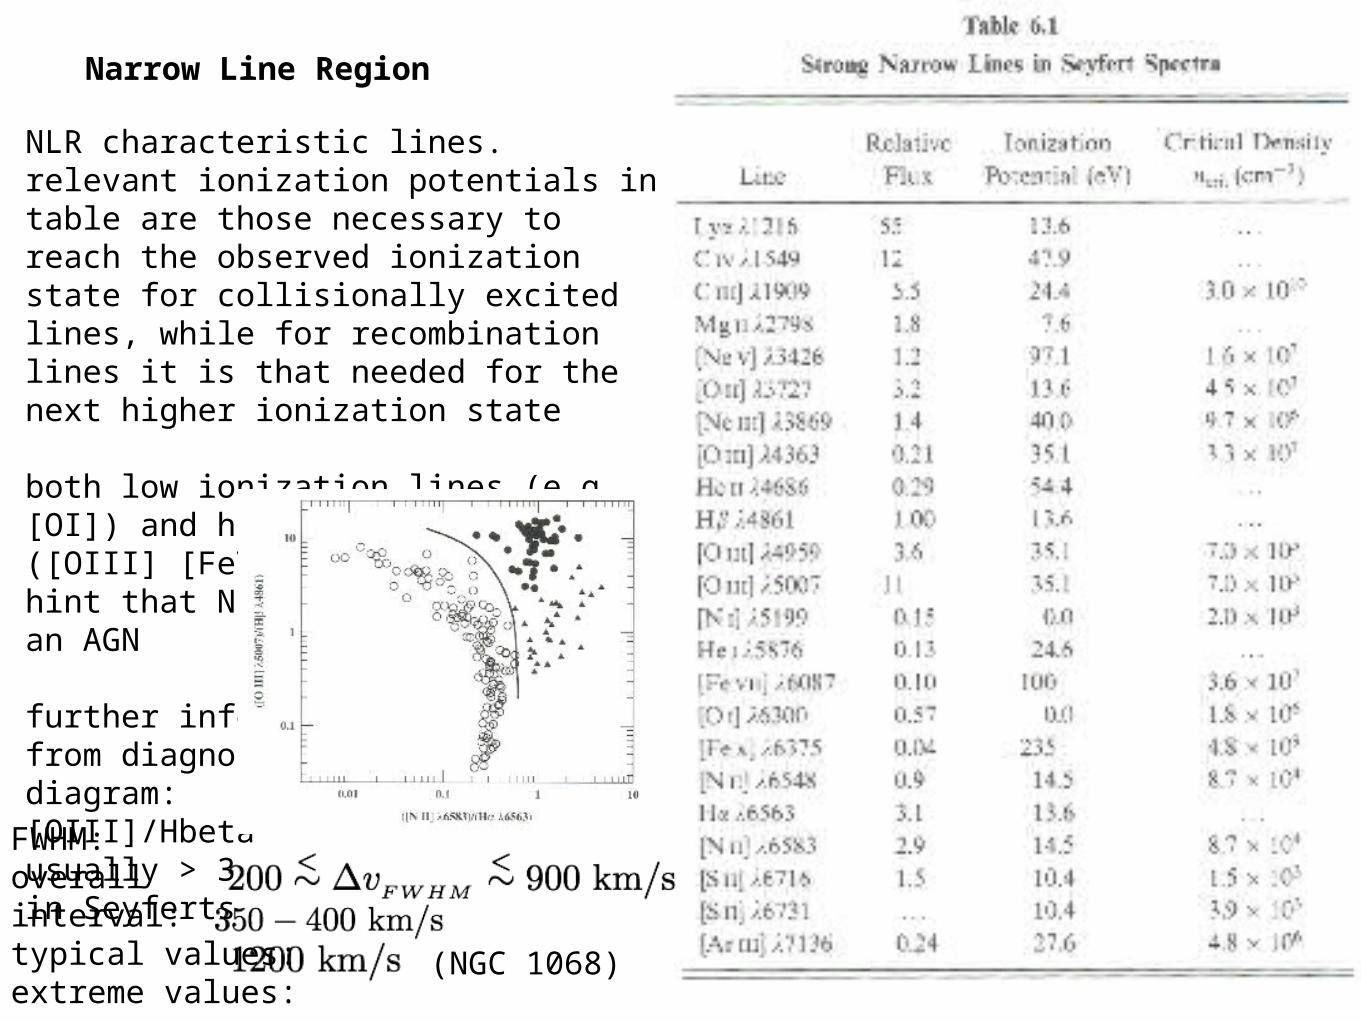
Narrow Line Region
NLR characteristic lines. relevant ionization potentials in table are those necessary to reach the observed ionization state for collisionally excited lines, while for recombination lines it is that needed for the next higher ionization state
both low ionization lines (e.g. [OI]) and high ionization lines ([OIII] [FeVII] etc) are present:hint that NLR is photoionized by an AGN
further infofrom diagnostic diagram: [OIII]/Hbetausually > 3in SeyfertsFWHM:
overall interval:typical values:extreme values:
(NGC 1068)
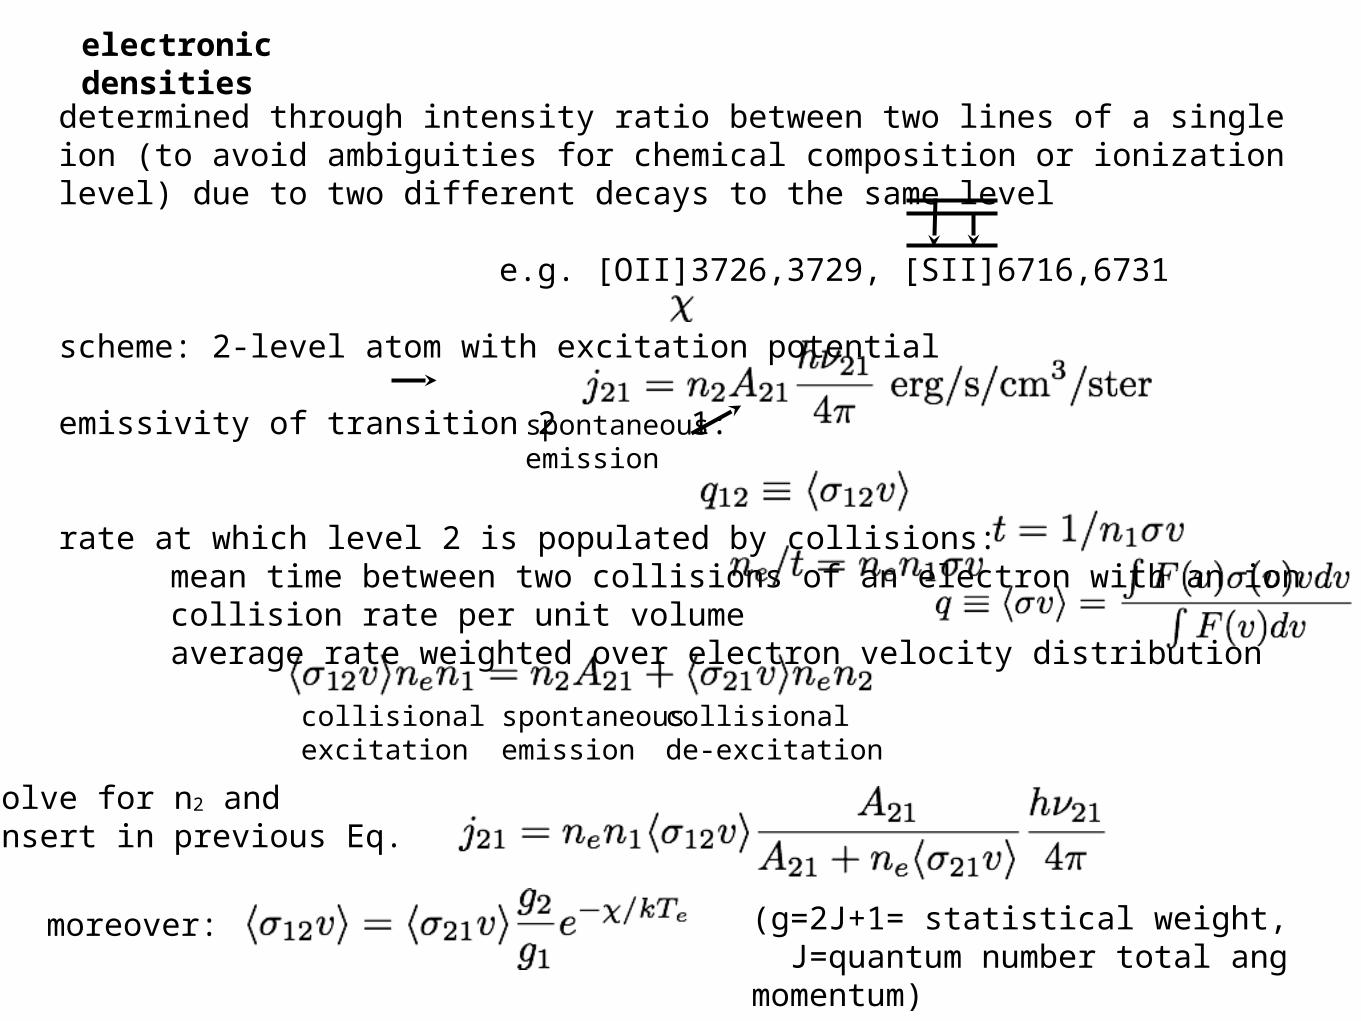
electronic densities
determined through intensity ratio between two lines of a single ion (to avoid ambiguities for chemical composition or ionization level) due to two different decays to the same level
e.g. [OII]3726,3729, [SII]6716,6731
scheme: 2-level atom with excitation potential
emissivity of transition 2 1:
rate at which level 2 is populated by collisions: mean time between two collisions of an electron with an ioncollision rate per unit volumeaverage rate weighted over electron velocity distribution
spontaneousemission
collisionalexcitation
collisionalde-excitation
spontaneousemission
solve for n2 andinsert in previous Eq.
moreover: (g=2J+1= statistical weight, J=quantum number total ang momentum)
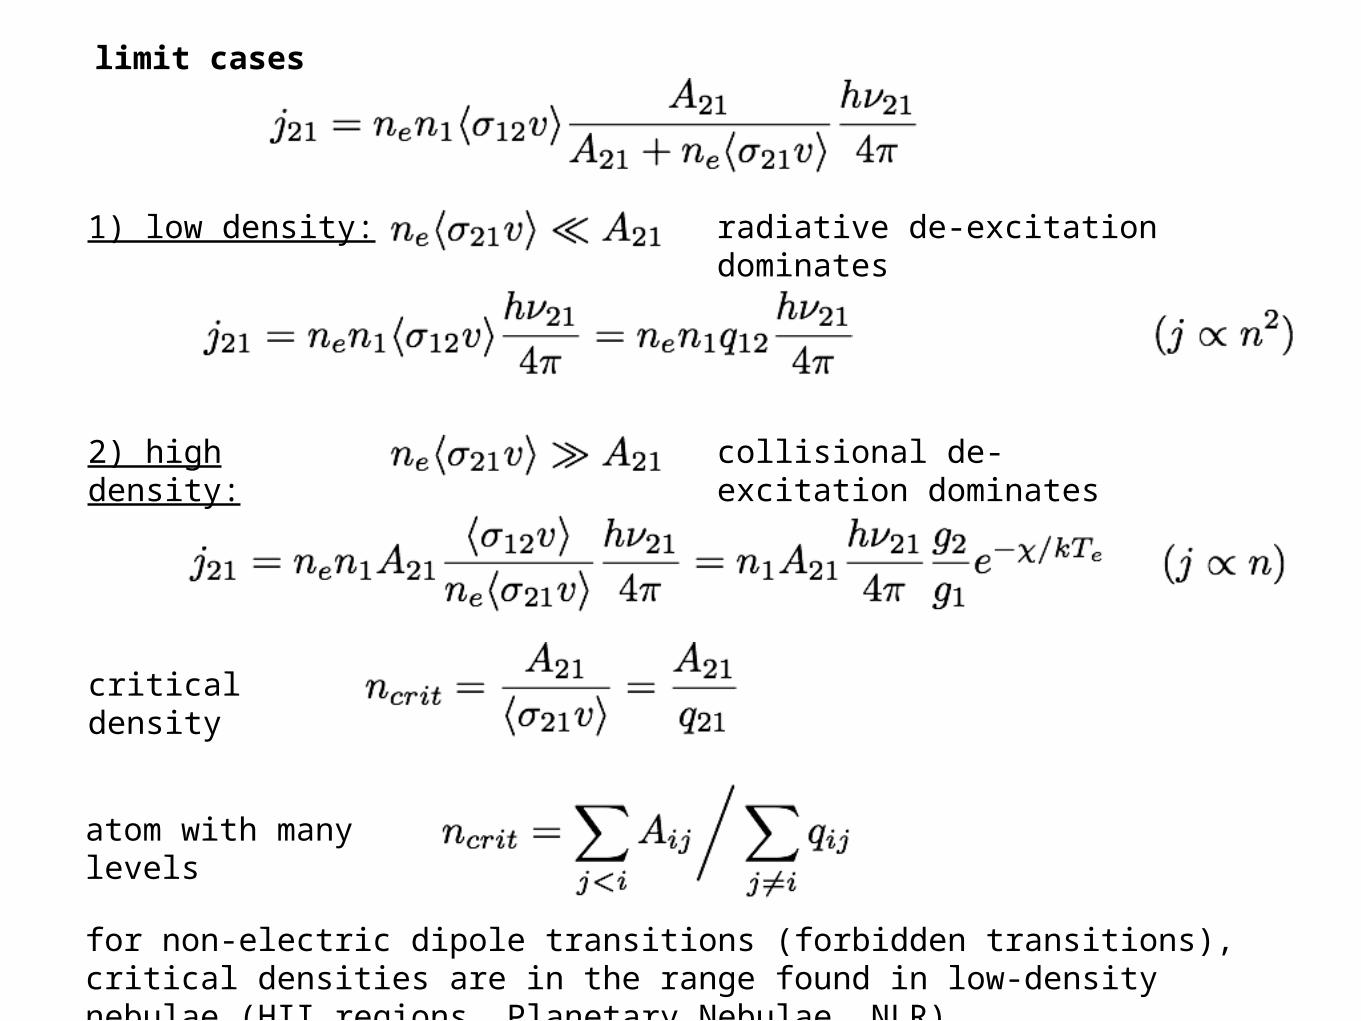
limit cases
1) low density: radiative de-excitation dominates
2) high density: collisional de-excitation dominates
critical density
atom with many levels
for non-electric dipole transitions (forbidden transitions), critical densities are in the range found in low-density nebulae (HII regions, Planetary Nebulae, NLR)
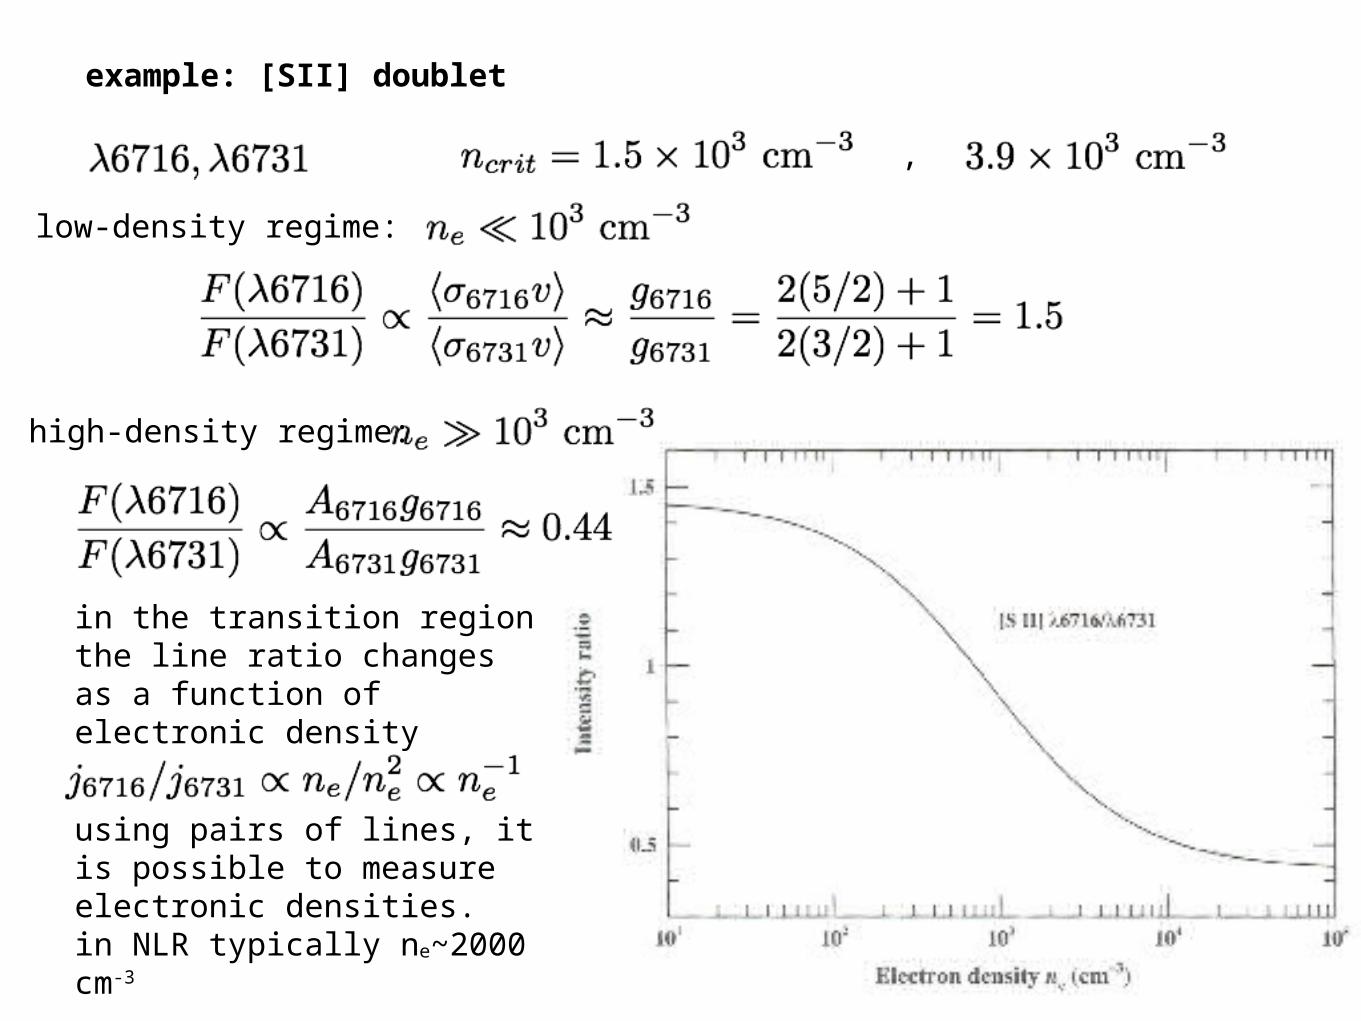
example: [SII] doublet
low-density regime:
high-density regime:
in the transition region the line ratio changes as a function of electronic density
using pairs of lines, it is possible to measure electronic densities.in NLR typically ne~2000 cm-3
,
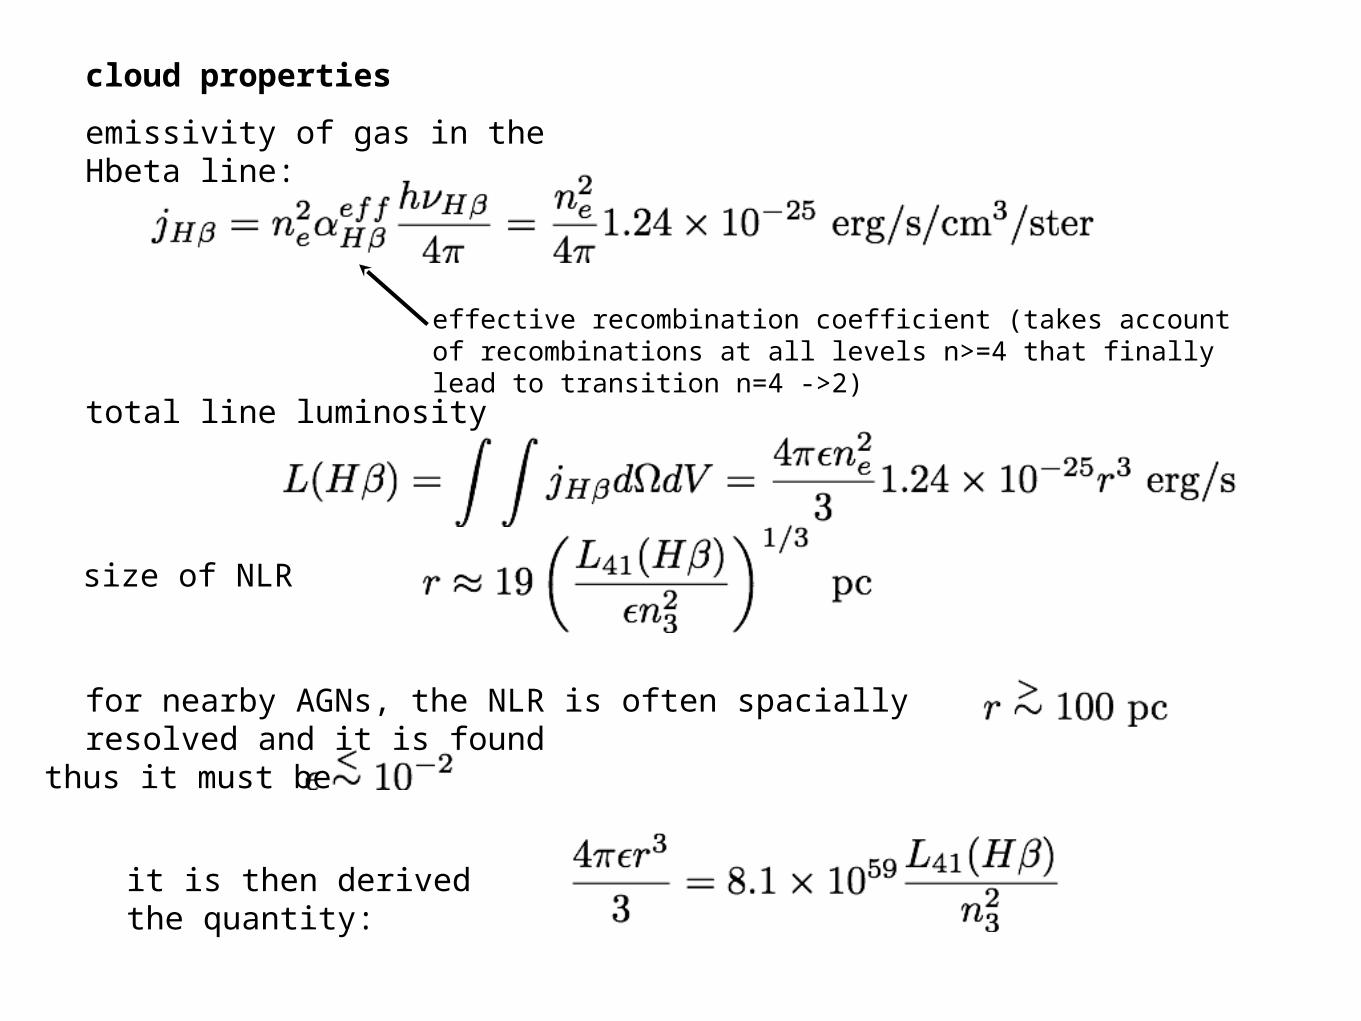
cloud properties
emissivity of gas in the Hbeta line:
effective recombination coefficient (takes account of recombinations at all levels n>=4 that finally lead to transition n=4 ->2)
total line luminosity
size of NLR
for nearby AGNs, the NLR is often spacially resolved and it is found
thus it must be
it is then derived the quantity:
remembering that
it is found
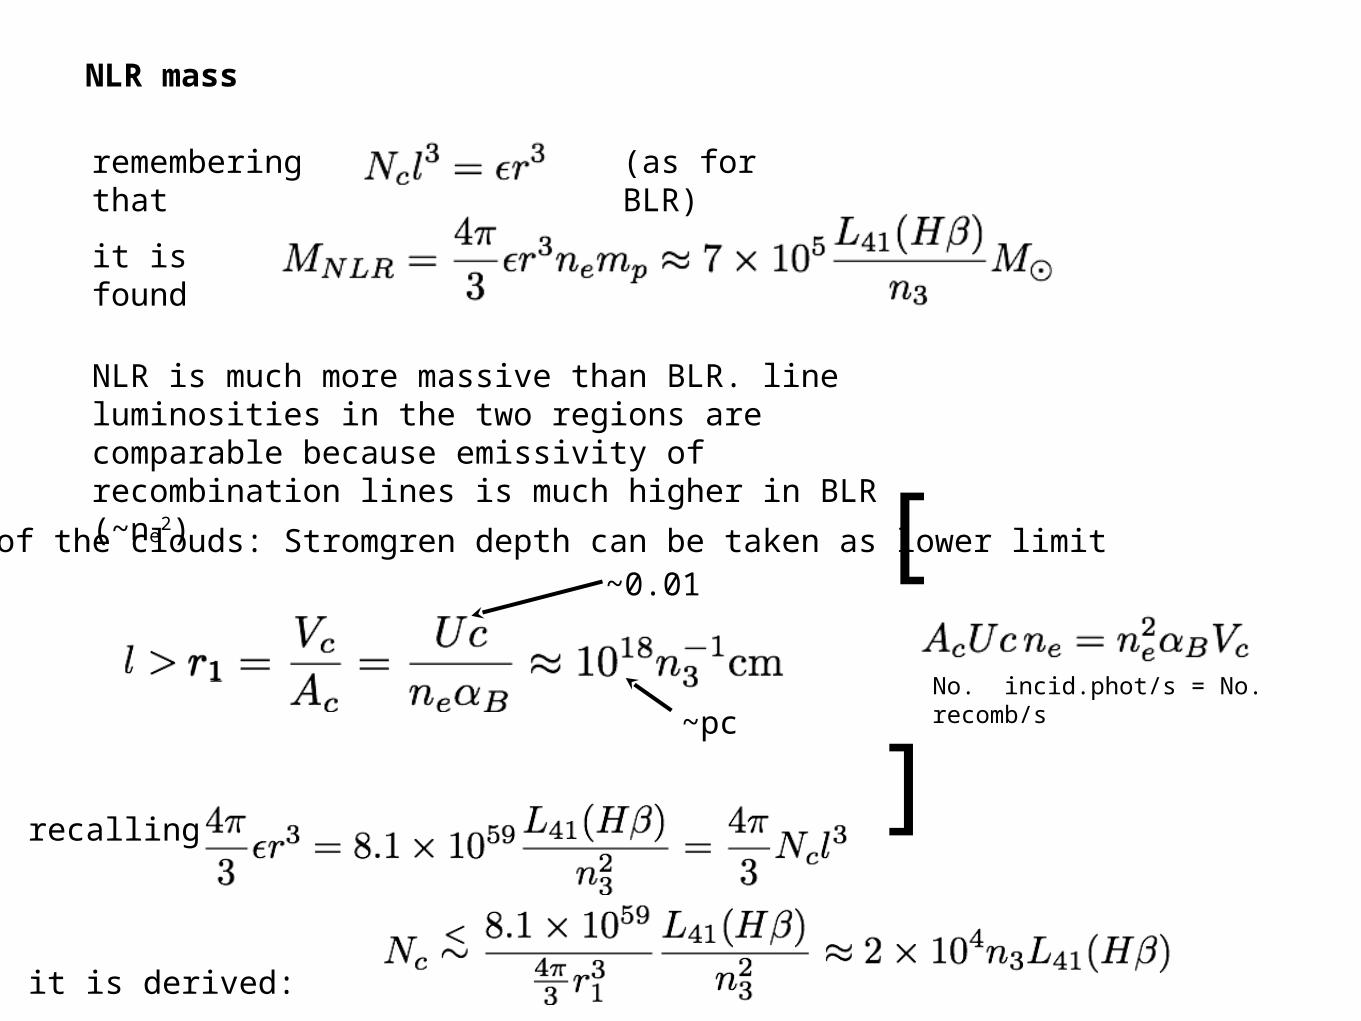
NLR mass
NLR is much more massive than BLR. line luminosities in the two regions are comparable because emissivity of recombination lines is much higher in BLR (~ne
2)
(as for BLR)
size of the clouds: Stromgren depth can be taken as lower limit
[ ]
No. incid.phot/s = No. recomb/s
recalling
it is derived:
~0.01
~pc
• width of emission lines ~ hundreds km/s Doppler broadening due to bulk motion of the gas in the gravitational field
• filling factor ~10-2
• mass of NLR millions of solar masses
• presence of forbidden lines requires ne ~ 103-4 cm-3
• size of NLR > 100 pc (spacially resolved in many Seyferts)
summary of NLR properties