Ch1. A Decade of Debt - PIIE€¦ · A Decade of Debt CARMEN M. REINHART AND KENNETH S. ROGOFF I....
38
1 1 A Decade of Debt CARMEN M. REINHART AND KENNETH S. ROGOFF I. Introduction Public debts in the advanced economies have surged in recent years to levels that have not been recorded since the end of World War II. Through 2010, the average public debt/GDP ratio for all the advanced economies has surpassed the pre-World War II peaks reached during the World War I and subsequently during the Great Depression. 1 Private debt levels, particularly those of financial institutions and households, are similarly in uncharted territory and represent (in varying degrees) potential contingent liability of the public sector in many countries, including the United States. As documented in Reinhart, Rogoff, and Savastano (2003) for emerging- market countries, large public debt overhangs do not unwind quickly and seldom painlessly. In particular, debt-to-GDP ratios are seldom reduced entirely through consistent robust economic growth. More commonly, reducing debt levels significantly has relied on fiscal austerity, debt restructuring (sometimes outright default), or a combination of these. 1. Unless otherwise noted, public debt in this Policy Analysis refers to gross central government debt. As such, it does not include other levels of government indebtedness (for example, state and local debt in the United States), nor does it encompass public enterprise debt, or debt that carries an explicit (let alone implicit) government guarantee. Contingent liabilities of the government associated with Social Security benefits are not incorporated in our long (a century or, for some countries, more) of government debt data and its analysis. Domestic public debt is government debt issued under domestic legal jurisdiction. Public debt does not include obligations carrying a government guarantee. Total gross external debt includes the external debts of all branches of government as well as private debt issued by domestic private entities under a foreign jurisdiction. 3HWHUVRQ ,QVWLWXWH IRU ,QWHUQDWLRQDO (FRQRPLFV _ ZZZSLLHFRP
Transcript of Ch1. A Decade of Debt - PIIE€¦ · A Decade of Debt CARMEN M. REINHART AND KENNETH S. ROGOFF I....
1
1A Decade of Debt
CARMEN M. REINHART AND KENNETH S. ROGOFF
I. Introduction
Public debts in the advanced economies have surged in recent years to levels
that have not been recorded since the end of World War II. Through 2010, the
average public debt/GDP ratio for all the advanced economies has surpassed
the pre-World War II peaks reached during the World War I and subsequently
during the Great Depression.1 Private debt levels, particularly those of financial
institutions and households, are similarly in uncharted territory and represent
(in varying degrees) potential contingent liability of the public sector in many
countries, including the United States.
As documented in Reinhart, Rogoff, and Savastano (2003) for emerging-
market countries, large public debt overhangs do not unwind quickly and
seldom painlessly. In particular, debt-to-GDP ratios are seldom reduced entirely
through consistent robust economic growth. More commonly, reducing debt
levels significantly has relied on fiscal austerity, debt restructuring (sometimes
outright default), or a combination of these.
1. Unless otherwise noted, public debt in this Policy Analysis refers to gross central government
debt. As such, it does not include other levels of government indebtedness (for example, state and
local debt in the United States), nor does it encompass public enterprise debt, or debt that carries
an explicit (let alone implicit) government guarantee. Contingent liabilities of the government
associated with Social Security benefits are not incorporated in our long (a century or, for some
countries, more) of government debt data and its analysis. Domestic public debt is government
debt issued under domestic legal jurisdiction. Public debt does not include obligations carrying
a government guarantee. Total gross external debt includes the external debts of all branches of
government as well as private debt issued by domestic private entities under a foreign jurisdiction.

2
In a complementary analysis of private debt deleveraging episodes
following systemic financial crises, Reinhart and Reinhart (2011) show that
the debt reduction process goes on for an average of about seven years. Also,
because of declining output and accumulating arrears on existing debts,
private debt ratios usually continue to climb even until two or three years
after the height of the financial crisis—delaying the effective reduction of debt
ratios.2
The combination of high and climbing public debts (a rising share of
which is held by major central banks) and the protracted process of private
deleveraging makes it likely that the ten years from 2008 to 2017 will be
aptly described as a decade of debt. As such, the issues we raise in this
Policy Analysis will weigh heavily on the public policy agenda of numerous
advanced economies and global financial markets for some time to come. The
following summarizes key aspects of our recent body of work on public debt
and financial crises. Of course, if global real interest rates remain very low for
an extended period, carrying costs of debt will be correspondingly low, and
exceptionally high leverage ratios can persist longer than usual. However, as
we emphasize in Reinhart and Rogoff (2009), interest rates can turn far faster
than debt levels, so if deleveraging does not occur, debt will be a continuing
vulnerability. The analysis that follows draws on and expands various strands
of our earlier work.3
Historically, high leverage episodes have been associated with slower
economic growth. This observation applies to the high-debt episodes that
follow on the heels of wars as well as to their peacetime counterparts. It also
characterizes episodes where high debt levels were not associated with mark-
edly higher interest rates.4
Surges in private debt lead to private defaults (which most often become
manifest in the form of banking crises).5 Banking crises are associated with
mounting public debt, which ultimately lead to a higher incidence of sover-
eign default or, more generally, restructuring of public and private debts.
2. Private deleveraging, as measured by new borrowing (see Fostel and Geanokoplos 2008 and
Geanokoplos 2009) usually begins to slow down markedly or decline during the crisis and, in some
cases, just before the onset of crisis.
3. Specifically, this Policy Analysis draws on Reinhart and Rogoff (2008, 2009, 2010a, 2010b,
2011a, 2011b). Although much of this Policy Analysis is devoted to synthesizing earlier work,
there is important new material here, including the discussion of how World War I and Great
Depression debt were largely resolved through outright default and restructuring, whereas World
War II debts were often resolved through financial repression. We argue that financial repression
is likely to play a big role in the exit strategy from the current buildup. We also highlight here the
extraordinary external debt levels of Ireland and Iceland compared with all historical norms in
our database.
4. See Gagnon and Hinterschweiger (2011) for an analysis of the links between debt and interest
rates.
5. See Kaminsky and Reinhart (1999).

A DECADE OF DEBT 3
Specifically, banking crises and surges in public debt help to “predict” sover-
eign debt crises. Of course, this historical pattern had been dominant prior to
the era of mega bailouts ushered in with the 1992 Japanese domestic banking
crisis, followed by (on an international scale) the 1994–95 Mexican peso crises,
reinforced during the Asian crisis with the Korean package, and reaching ever-
escalating historic highs on both domestic and international dimensions at
the time of this writing. The “bailout approach” in the current episode began
in the summer of 2007 in the United States in response to the subprime mort-
gage crisis and morphed into the most serious advanced-economy debt crisis
since the 1930s.
A more subtle form of debt restructuring takes the form of “financial
repression” (which had its heyday during the tightly regulated Bretton Woods
system). Limiting investment choices of the private sector importantly facili-
tated sharper and more rapid debt reduction from the late 1940s to the 1970s
than would have otherwise been the case (Reinhart and Sbrancia 2011). We
conjecture here that the pressing needs of governments to reduce debt roll-
over risks and curb rising interest expenditures in light of the substantial debt
overhang, combined with an aversion to more explicit restructuring, may lead
to a revival of financial repression. This includes more directed lending to
government by captive domestic audiences (such as pension funds), explicit or
implicit caps on interest rates, and tighter regulation on cross-border capital
movements.6 A less generous depiction of financial repression (see definition
in box 1.1) would include the savaging of pension funds.
Section II places the recent surge in government debt in the advanced
economies in historical perspective, distinguishing the timing and magni-
tudes of earlier high-debt episodes. Section III summarizes our findings on
the temporal causal links between financial crises, rapid surges in public debt,
and subsequent sovereign restructuring or outright default. In section IV we
document that high debt is associated with slower growth—a relationship that
is robust across advanced and emerging markets since World War II, as well
an earlier era. The last large wave of sovereign defaults or restructurings in the
advanced economies during the early 1930s (outright defaults were confined
to the handful of countries on the losing side of World War II) is discussed in
section V, which also describes the heavy-handed financial regulation (often
referred to as financial repression) that helped rapidly reduce the World War
II debt overhang. The concluding section suggests many of the elements of
financial repression have already begun to resurface (a trend that is likely to
gather momentum in coming years), as governments simultaneously grapple
with the difficult choices associated with substantial debt reduction.
6. There is a literature on financial repression in emerging-market economies (see Easterly 1989
and Giovannini and Di Melo 1993, for example). However, the Bretton Woods system embraced
in 1946 established a system of tightly regulated financial markets based on the three pillars of
(1) directed credit; (2) interest rate ceilings; and (3) foreign exchange controls (see box 1.1).

4
II. Surges in Public Debt
Throughout the ages and across continents, war has been a recurrent causal
force behind rapid deteriorations in government finances and surges in public
indebtedness. This pattern shows through in world debt aggregates and indi-
vidual country histories. Thus, it is not surprising to see that, particularly for
the advanced economies, two spikes in debt aggregates correspond to the two
world wars (figure 1.1). The smaller set of independent (largely European)
economies that populated the globe in the early 1800s experienced a similar
sharp run-up in debt during the Napoleonic Wars.
Box 1.1 Financial repression defined
The term financial repression was introduced in the literature by the works of
Edward Shaw (1973) and Ronald McKinnon (1973). Subsequently, the term be-
came a way of describing emerging-market financial systems prior to the wide-
spread financial liberalization that began in the 1980 (see Agenor and Montiel
2008 for an excellent discussion of the role of inflation and Giovannini and de
Melo 1993 and Easterly 1989 for country-specific estimates). However, as we
document in this paper, financial repression was also the norm for advanced
economies during the post–World War II period and in varying degrees up
through the 1980s. We describe here some of its main features.
Pillars of financial repression
1. Explicit or indirect caps or ceilings on interest rates, particularly (but not ex-
clusively) those on government debts. These interest rate ceilings could be
effected through various means, including (1) explicit government regula-
tion (for instance, Regulation Q in the United States prohibited banks from
paying interest on demand deposits and capped interest rates on saving
deposits); (2) ceilings on banks’ lending rates, which were a direct subsidy
to the government in cases where it borrowed directly from the banks (via
loans rather than securitized debt); and (3) interest rate cap in the context
of fixed coupon rate nonmarketable debt or (4) maintained through central
bank interest rate targets (often at the directive of the Treasury or Ministry
of Finance when central bank independence was limited or nonexistent).
Allan Meltzer’s (2003) monumental history of the Federal Reserve (volume I)
documents the US experience in this regard; Alex Cukierman’s (1992) classic
on central bank independence provides a broader international context.
(continued on next page)

A DECADE OF DEBT 5
During peacetime, a leading factor behind rapid surges in public debt has
been severe or systemic financial crises. With the growing tendency toward
increasing government involvement in rescue operations, the link between
public debt and financial crashes has become more pronounced in the past
two decades or so. More general and chronic fiscal problems (because govern-
ments systematically overspend, do not have the political will or ability to tax
effectively, or a combination of the two) tend to produce more gradual debt
buildups.
As figure 1.1 illustrates, public debts in the advanced economies have surged
in recent years to levels not recorded since the end of World War II, surpassing
previous peaks reached during World War I and the Great Depression. At the
same time, private debt levels, particularly those of households, are simply in
uncharted territory and are (in varying degrees) a contingent liability of the
public sector in many countries, including the United States. As we emphasize
in Reinhart and Rogoff (2009, 2011b) and discuss further below, most govern-
ments find it difficult to avoid backstopping significant amounts of private
credit during a financial crisis.
Box 1.1 Financial repression defined (continued)
2. Creation and maintenance of a captive domestic audience that facilitated di-
rected credit to the government. This was achieved through multiple layers
of regulations from very blunt to more subtle measures. (1) Capital account
restrictions and exchange controls orchestrated a “forced home bias” in the
portfolio of financial institutions and individuals under the Bretton Woods
arrangements. (2) High reserve requirements (usually nonremunerated) as a
tax levy on banks (see Brock 1989 for an insightful international comparison).
Among more subtle measures, (3) “prudential” regulatory measures requiring
that institutions (almost exclusively domestic ones) hold government debts
in their portfolios (pension funds have historically been a primary target), (4)
transaction taxes on equities (see Campbell and Froot 1994) also act to direct
investors toward government (and other) types of debt instruments, and (5)
prohibitions on gold transactions.
3. Other common measures associated with financial repression aside from
the ones discussed above are (1) direct ownership (e.g., in China or India)
of banks or extensive management of banks and other financial institu-
tions (e.g., in Japan) and (2) restricting entry into the financial industry
and directing credit to certain industries (see Beim and Calomiris 2000).
Source: Reinhart and Sbrancia (2011) and sources cited therein.

6
Financial Crises and Debt
Figure 1.2 takes advantage of newly unearthed historical data on domestic
debt to show the rise in real government debt in the three years following severe
banking crises of the 20th century.7 A buildup in government debt has been a
defining characteristic of the aftermath of banking crises for over a century,
with government finances deteriorating to produce an average debt rise of
86 percent. This comparative exercise focuses on the percentage increase in
debt, rather than the debt-to-GDP ratio, because steep output drops sometimes
complicate the interpretation of debt/GDP ratios. As we note in Reinhart and
Rogoff (2008), the characteristic huge buildups in government debt are driven
mainly by sharp falloffs in tax revenue, owing to the severe and protracted
nature of postcrisis recessions. In some famous cases (notably Japan in the
1990s), this deterioration in fiscal balances also owes to surges in government
spending to fight the recession. The much ballyhooed bank bailout costs are,
in several cases, only a relatively minor contributor to post–financial crisis debt
burdens.
7. This analysis was first introduced in Reinhart and Rogoff (2008).
Figure 1.1 Gross central government debt as a percent of GDP:
Advanced and emerging-market economies, 1860–2010
120
100
80
60
40
20
0
1860 1870 1880 1890 1900 1910 1920 1930 1940 1950 1960 1970 1980 1990 2000 2010
percent
Sources: Reinhart and Rogoff (2011a) and sources cited therein.
World War I
Great Depression
World War II
Emerging
markets
Advanced
economies

A D
ECA
DE O
F DEB
T
7
Figure 1.2 Cumulative increase in public debt in the three years following systemic banking crisis:
Selected post–World War II episodes
Malaysia, 1997
Mexico, 1994
Japan, 1992
Norway, 1987
Philippines
Korea, 1997
Sweden, 1991
Thailand, 1997
Historical
Spain, 1977
Indonesia, 1997
Chile, 1980
Finland, 1991
Colombia, 1998
100 120 140 160 180 200 220 240 260 280 300
index = 100 in year of crisis
Notes: Each banking crisis episode is identified by country and the beginning year of the crisis. Only major (systemic) banking crisis episodes are included,
subject to data limitations. The historical average reported does not include ongoing crisis episodes, which are omitted altogether, as these crises begin
in 2007 or later, and debt stock comparison shown is three years after the beginning of the banking crisis.
Source: Reinhart and Rogoff (2008 and 2009) and sources cited therein.
186.3 (an 86 percent increase)

8
More broadly, an examination of the aftermath of severe financial crises
shows deep and lasting effects on asset prices, output, and employment.
Unemployment rises and housing price declines extend out for five and six
years, respectively. Even recessions sparked by financial crises do eventually end,
albeit almost invariably accompanied by massive increases in government debt.
Figure 1.3 Cumulative increase in real public debt since 2007,
selected countries
Iceland
Ireland
Spain
United Kingdom
United States
Greece
Portugal
Crisis country average
Australia
Norway
Chile
Mexico
Thailand
Brazil
Austria
Germany
Belgium
Japan
India
Average for others
Notes: Unless otherwise noted these figures are for central government debt deflated by consumer
prices.
Sources: Prices and nominal GDP from International Monetary Fund, World Economic Outlook. For
a complete listing of sources for government debt, see Reinhart and Rogoff (2009) and chapter 2.
100 150 200 250 300 350
116
94
64
76
93
144
86
88
22
27
6
28
46
67
70
79
98
189
37
65
2007 = 100
234 (increase of
134 percent)
136 (increase of
36 percent)
debt/GDP,
2010 (percent)

A DECADE OF DEBT 9
The 2007–10 Global Buildup in Public Debt
Figure 1.3 illustrates the increase in (inflation adjusted) public debt since 2007.
For the countries with systemic financial crises and/or sovereign debt prob-
lems (Greece, Iceland, Ireland, Portugal, Spain, the United Kingdom, and the
United States), average debt levels are up by about 134 percent, surpassing by
a sizable margin the three-year 86 percent benchmark that we find (Reinhart
and Rogoff 2009) for earlier deep postwar financial crises. The larger debt
buildups in Iceland and Ireland are importantly associated not only with the
sheer magnitude of the recessions/depressions in those countries but also
with the scale of the bank debt buildup prior to the crisis—which is, as far
as we are aware—without parallel in the long history of financial crises. Nor
will 2010 (the third year of crisis for Iceland, Ireland, the United Kingdom,
and the United States and the second year for the others) be the last year in
which rising debt will be recorded. At present, forecasts for the United States
show rising debt levels in the foreseeable future; for several others, austerity
programs notwithstanding, debts are likely to continue to mount as economic
conditions remain subpar and debt servicing costs climb.
Even in countries that did not experience a major financial crisis, debt
rose by an average of about 36 percent in real terms between 2007 and 2010.8
Many economies adopted stimulus packages to deal with the global reces-
sion in 2008–09 and were hit by marked declines in government revenues.
Moreover, some of the larger increases in debt loads of noncrisis countries
(such as Norway, Australia, and Chile) relate to the cyclical downdraft in world
commodity prices that accompanied the global recession.
III. The Financial Crash–Sovereign Debt Crisis Sequence
In this section, we summarize the main findings in Reinhart and Rogoff
(2011b). Our approach in that paper was to illustrate each main result with
both a “big picture” based on cross-country aggregation and a “representa-
tive country case study (or studies)” from country histories. Each of the main
points highlighted in the figures is complemented by the pertinent debt/
GDP-crisis indicator regressions reported at the bottom of each figure. We
begin by discussing sovereign default on external debt (that is, when a govern-
ment defaults on its own external or private-sector debts that were publicly
guaranteed).
8. Our focus on gross central government debt owes to the fact that time series of broader measures
of government debt are not available for many countries. Of course, the true runup in debt is
significantly larger than stated here, at least on a present value actuarial basis, due to the extensive
government guarantees that have been conferred on the financial sector in the crisis countries and
elsewhere, where for example deposit guarantees were raised in 2008.
10
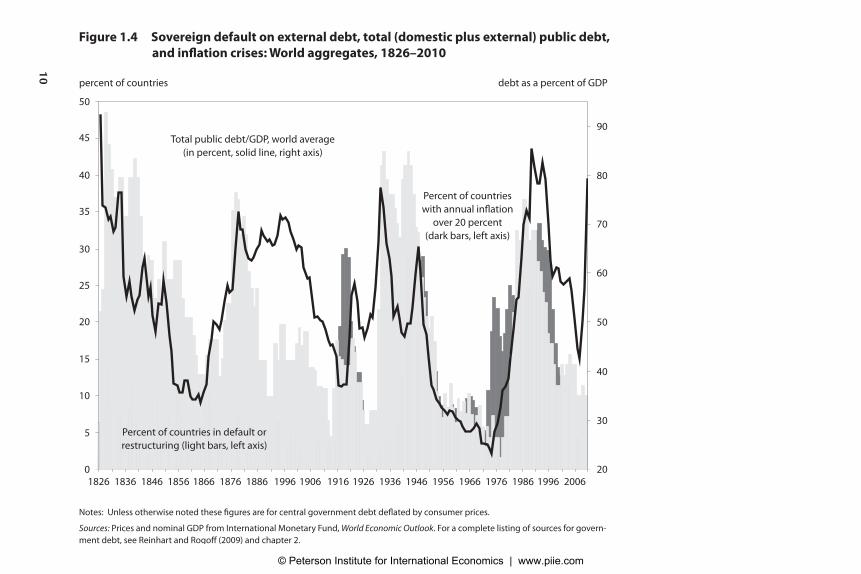
Figure 1.4 Sovereign default on external debt, total (domestic plus external) public debt,
and inflation crises: World aggregates, 1826–2010
Total public debt/GDP, world average
(in percent, solid line, right axis)
50
45
40
35
30
25
20
15
10
5
0
Notes: Unless otherwise noted these figures are for central government debt deflated by consumer prices.
Sources: Prices and nominal GDP from International Monetary Fund, World Economic Outlook. For a complete listing of sources for govern-
ment debt, see Reinhart and Rogoff (2009) and chapter 2.
1826 1836 1846 1856 1866 1876 1886 1996 1906 1916 1926 1936 1946 1956 1966 1976 1986 1996 2006
90
80
70
60
50
40
30
20
Percent of countries
with annual inflation
over 20 percent
(dark bars, left axis)
Percent of countries in default or
restructuring (light bars, left axis)
percent of countries debt as a percent of GDP

A DECADE OF DEBT 11
Public Debt Surges and Sovereign Default and Restructuring
Public debt follows a lengthy and repeated boom-bust cycle; the bust phase
involves a markedly higher incidence of sovereign debt crises. Public-sector
borrowing surges as the crisis nears. In the aggregate, debts continue to rise
after default, as arrears accumulate and GDP contracts markedly.9 Figure 1.4
plots the incidence of external default (lighter bars) from 1826, when the newly
independent Latin American economies first entered the global capital market,
through 2010 against an unweighted average debt/GDP ratio for all the coun-
tries for which such data are available. Upturns in the debt ratio usually precede
the rise in default rates, as the regressions (shown in table 1.1) for the world
aggregates confirm. Periods of higher indebtedness are also associated with
a higher incidence of inflation crises (a more indirect form of default, high-
lighted as darker bars where the incidence of inflation exceeds that of default).
Default through inflation has been more prevalent since World War I, as fiat
money became the norm and links to gold severed.
Serial default is a widespread phenomenon across emerging markets and
several advanced economies. The most compelling evidence on serial default
comes from the individual country histories, shown here for Greece in figure
1.5. The 70 country histories presented in chapter 2 provide broad-based
evidence that serial default cut across regions and across time.
9. See Reinhart and Rogoff (2009, 2011a) for evidence on output behavior before, during, and
after debt crises.
Table 1.1 Public debt and sovereign default and restructuring:
All countries, 1824–2009
Dependent variable World: Share of countries
in default or restructuring
Sample 1824–2009
Independent variables OLS (robust errors) Logit (robust errors)
World: Public debt/GDP (t-1) 0.346 0.008
p-value 0 0
Number of observations 184 184
R2 0.224 0.246
OLS = ordinary least squares
Logit = logistic regression
Notes: The debt aggregate for the world is a simple arithmetic average of individual countries’ debt/
GDP ratios. For a few countries the time series on debt and exports are much longer dating back to
the first half of the 19th century than for nominal GDP. In these cases (Brazil, Canada, Egypt, India,
Nicaragua, Thailand, Turkey, and Uruguay) the debt/GDP series was spliced (with appropriate scal-
ing) with the to the available debt/GDP data. The split between advanced and emerging economies
is made along the present-day IMF classification.
Sources: Reinhart and Rogoff (2011b), sources cited therein and authors’ calculations.

12
The “hallmark” surge in debt on the eve of a debt crisis, banking crisis,
or both is quite evident in Greece’s last two defaults in 1894 and in 1932—the
latter default spell lasted about 33 years from beginning to its eventual resolu-
tion in 1964.
Hidden Debts—Private Debts that Become Public
The drama that has most notably engulfed Iceland and Ireland is novel only
in the orders of magnitude of the debts, not in the causes and patterns of the
crisis.10 Writing about Chile’s crises in the early 1980s, Carlos Diaz-Alejandro
(1985) asks us to consider a country that had liberalized its domestic financial
sector and was fully integrated into world capital markets.
The recorded public sector deficit was nonexistent, minuscule, or moderate;
the declining importance of ostensible public debt in the national balance
sheet was celebrated by some observers.
10. Gross external debts ten times the size of GDP (as the cases of Iceland and Ireland) are histori-
cally off the charts for both advanced and emerging-market economies. In effect, Reinhart, Rogoff,
and Savastano (2003) calculate that more than half of all emerging-market defaults or restruc-
turing episodes since World War II occurred at debt levels of 60 percent or less (which would satisfy
the Maastricht criteria).
Source:

A DECADE OF DEBT 13
The private sector was a different matter. Their spending persistently
exceeded their income, giving rise to large current account deficits. The current
account deficit was financed by large and persistent capital inflows, which is a
different way of saying that the domestic largesse was supported by borrowing
heavily from the rest of the world. This abundance of foreign capital made it
easy for domestic banks to lend liberally to businesses and households. During
the credit boom, real estate and equity prices soared—so did debts. Growth
seemed inevitable.
However, as Diaz-Alejandro explains, the pity of the boom is that
little effort was spent on investigating the credentials of new entrants to the
ever-growing pool of lenders and borrowers…practically no inspection or
supervision of bank portfolios existed…. One may conjecture, however, that
most depositors felt fully insured and foreign lenders felt that their loans to
the private sector were guaranteed by the State.
The two panels of figure 1.6, which plot the public debt/GDP ratios (top
panel) and total gross external (public and private) debt (bottom panel) for
Iceland and Ireland, faithfully mimic the pattern described by Diaz-Alejandro
of “apparent” sound fiscal finances at the outset of the financial crisis.11 The
most onerous sign of future sovereign debt difficulties is shown in the bottom
panel of figure 1.6, which highlights the scale of the buildup in mostly private
external debts that carried implicit (or explicit) government guarantees.
After more than three years since the onset of the crisis, banking sectors
remain riddled with high debts (of which a sizable share are nonperforming)
and low levels of capitalization, while the household sector has significant
exposures to a depressed real estate market. Under such conditions, the migra-
tion of private debts to the public sector and central bank balance sheets is
likely to continue, especially in the prevalent environment of indiscriminate,
massive bailouts.
Banking Crises as Predictors of Sovereign Debt Problems
Banking crises most often either precede or coincide with sovereign debt crises.
The reasons for this temporal sequence may be the contingent liability story
emphasized by Diaz-Alejandro (1985) and formalized in Velasco (1987), in
which the government takes on massive debts from the private banks, thus
undermining its own solvency.12 The currency crashes that are an integral part
of the “twin crisis” phenomenon documented by Kaminsky and Reinhart
(1999) would also be consistent with this temporal pattern. If, as they suggest,
banking crises precede currency crashes, the collapsing value of the domestic
11. We would note that Iceland and Ireland (and also Spain), so often in the news for their present
debt difficulties, were exemplary cases of successful public debt reduction up until the eve of the
current crisis.
12. See Arellano and Kocherlakota (2008) for a framework that is consistent with these dynamics.

14
Figure 1.6 Iceland and Ireland: Public debt/GDP and external debt
a. General government (domestic plus external) debt, 1925–2010
140
120
100
80
60
40
20
0
1925 1930 1935 1940 1945 1950 1955 1960 1965 1970 1975 1980 1985 1990 1995 2000 2005 2010
Iceland peak of
crisis, 2007
Ireland
debt as a percent of GDP

A D
ECA
DE O
F DEB
T
15
Source: Chapter 2.
1,200
1,000
800
600
400
200
0
1970 1975 1980 1985 1995 1990 2000 2005 2010
Ireland
Iceland
b. External (public plus private) debt, 1970–2010
debt as a percent of GDP
16
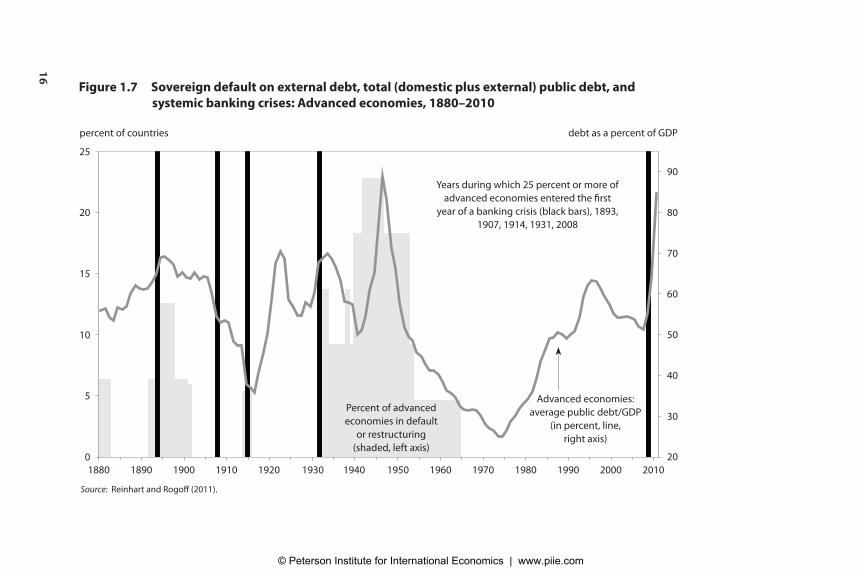
Figure 1.7 Sovereign default on external debt, total (domestic plus external) public debt, and
systemic banking crises: Advanced economies, 1880–2010
25
20
15
10
5
0
1880 1890 1900 1910 1920 1930 1940 1950 1960 1970 1980 1990 2000 2010
Years during which 25 percent or more of
advanced economies entered the first
year of a banking crisis (black bars), 1893,
1907, 1914, 1931, 2008
90
80
70
60
50
40
30
20
Percent of advanced
economies in default
or restructuring
(shaded, left axis)
Advanced economies:
average public debt/GDP
(in percent, line,
right axis)
percent of countries debt as a percent of GDP
Source: Reinhart and Rogoff (2011).

A DECADE OF DEBT 17
currency that comes after the banking crisis begins may undermine the
solvency of both private and sovereign borrowers who are unfortunate enough
to have important amounts of foreign-currency debts. As figure 1.7 and table
1.2 highlight, this is not exclusively an “emerging-market issue,” as a higher
incidence of sovereign default has followed the major financial crises.
Even absent large-scale bailouts (and without counting postcrisis new
government guarantees), we show that largely owing to collapsing revenues,
government debts typically rise about 86 percent in the three years following
a systemic financial crisis, setting the stage for rating downgrades and, in the
worst scenario, default.
Table 1.2 Public debt and sovereign default and
restructuring: Advanced economies, 1880–2009
Dependent variable Advanced economies: Share of countries
in default or restructuring
Sample 1880–2009
Independent variables OLS (robust errors) Logit (robust errors)
Advanced economies
Public debt/GDP (t-1) 0.209 0.002
p-value 0 0
Number of observations 130 130
R2 0.176 0.167
Dependent variable Advanced economies: Share of countries
in systemic banking crises
Sample 1880–2009
Independent variables OLS (robust errors) Logit (robust errors)
Advanced economies
Public debt/GDP (t-1) 0.057 0.002
p-value 0.002 0.006
Number of observations 130 130
R2 0.047 0.05
OLS = ordinary least squares
Logit = logistic regression
Notes: The debt aggregates for the advanced economies and the world are simple arithmetic av-
erages (not weighted by a country’s share in world GDP) of individual countries’ debt/GDP ratios.
For a few countries the time series on debt and exports are much longer dating back to the first
half of the 19th century than for nominal GDP. In these cases (Brazil, Canada, Egypt, India, Nicara-
gua, Thailand, Turkey, and Uruguay) the debt/GDP series was spliced (with appropriate scaling)
with the available debt/GDP data. The split between advanced and emerging economies is made
along the present-day IMF classification, even though several countries, such as New Zealand,
were “emerging markets” during most of the pre-World War I period.
Sources: Chapter 2; Reinhart and Rogoff (2011b), sources cited therein; and authors’ calculations.

18
A causal chain from sovereign debt crisis to banking crisis, perhaps
obscured in these simple graphs, cannot be dismissed lightly. Financial repres-
sion and international capital controls may give the government scope to
coerce otherwise healthy banks to buy government debt in significant quan-
tities. A government default, in those circumstances, would directly impact
the banks’ balance sheets. The two crises may be more or less simultaneous.
But even if banks are not overly exposed to government paper, the “sovereign
ceiling” in which corporate borrowers are rated no higher than their national
governments may make banks’ offshore borrowing very costly or altogether
impossible. The result would be a sudden stop that could give rise to bank
insolvencies either immediately or subsequently.
Common Fundamentals, Contagion, or Both?
In this subsection, we emphasize the fundamental distinction between inter-
national transmission that occurs due to common shocks (e.g., the collapse of
the technology boom in 2001 or the collapse of housing prices in the crisis of
the late 2000s) to transmission that occurs primarily due to mechanisms that
are really the result of cross-border contagion emanating from the epicenter of
the crisis. We offer a rationale for understanding which factors make it more
likely that a primarily domestic crisis fuels fast and furious contagion (see box 1.2).
We use these concepts to discuss the basis for contagion scenarios in Europe
and elsewhere. The bunching of banking crises and sovereign debt difficulties
across countries is so striking in the late-2000s crisis, where both common
shocks and cross-country linkages are evident.
As we discussed in Reinhart and Rogoff (2009), the conjuncture of
elements related to the current crisis is illustrative of the two channels of
contagion: cross-linkages and common shocks. Without doubt, the US finan-
cial crisis of 2007 spilled over into other markets through direct linkages. For
example, German and Japanese financial institutions (and others ranging as
far as Kazakhstan) sought more attractive returns in the US subprime market,
perhaps owing to the fact that profit opportunities in domestic real estate were
limited at best and dismal at worst. Indeed, after the fact, it became evident
that many financial institutions outside the United States had nontrivial expo-
sure to the US subprime market.13 This is a classic channel of transmission or
contagion through which a crisis in one country spreads across international
borders. In the present context, however, contagion or spillovers are only part
of the story.
The global nature of the crisisalso owes significantly to the fact that many
of the features that characterized the run-up to the subprime crisis in the
United States were present in many other advanced economies as well. Two
common elements stand out. First, many countries in Europe and elsewhere
13. Owing to the opaqueness of balance sheets in many financial institutions in these countries,
the full extent of exposure is, as yet, unknown.

A DECADE OF DEBT 19
Box 1.2 Contagion concepts
In defining contagion here, we follow Kaminsky, Reinhart, and Vegh (2003),
who distinguish between two types: (1) the “slow-burn” spillover and (2) the
kind of fast burn marked by rapid cross-border transmission that Kaminsky, Re-
inhart, and Vegh label “fast and furious.”
We refer to contagion as an episode in which there are significant immediate
effects in a number of countries following an event—that is, when the conse-
quences are fast and furious and evolve over a matter of hours or days. This “fast
and furious” reaction is a contrast to cases in which the initial international reac-
tion to the news is muted. The latter cases do not preclude the emergence of
gradual and protracted effects that may cumulatively have major economic con-
sequences. We refer to these gradual cases as spillovers. Common external shocks,
such as changes in international interest rates or oil prices, are also not automati-
cally included in our working definition of contagion. We add to this classification
that common shocks need not all be external. This caveat is particularly impor-
tant with regard to the current episode. Countries may share common “domestic”
macroeconomic fundamentals, such as the bursting of a housing bubble, capital
inflow bonanzas, increasing private and (or) public leveraging, and so on.
The three pillars of fast and furious contagion are:
1. Surprise crises and anticipated catastrophes: Fast and furious crises and
contagion cases have a high degree of surprise associated with them, while
their quieter counterparts are more broadly anticipated.
2. Capital flow cycle and leverage: Fast and furious contagion episodes are
typically preceded by a surge in capital inflows and rapidly rising lever-
age, which come to an abrupt halt or sudden stop in the wake of a crisis.
The inflow of capital may come from banks, other financial institutions, or
bondholders. The debt contracts typically have short maturities (i.e., inves-
tors and financial institutions will have to make decisions about rolling over
their debts or not doing so.) With fast and furious contagion, investors and
financial institutions that are often highly leveraged are exposed to the
crisis country. Such investors can be viewed as halfway through the door,
ready to back out on short notice.
3. Common creditors: The previous distinction appears to be critical when
“potentially affected countries” have a common lender. If the common lend-
er is surprised by the shock in the initial crisis country, there is no time ahead
of the impending crisis to rebalance portfolios and scale back from the af-
fected country. In contrast, if the crisis is anticipated, investors have time to
limit the damage by scaling back exposure or hedging their positions.
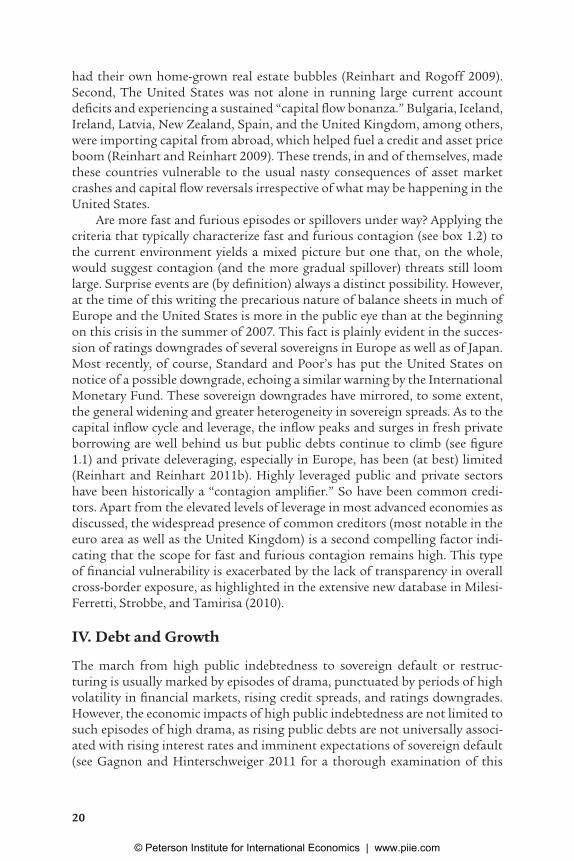
20
had their own home-grown real estate bubbles (Reinhart and Rogoff 2009).
Second, The United States was not alone in running large current account
deficits and experiencing a sustained “capital flow bonanza.” Bulgaria, Iceland,
Ireland, Latvia, New Zealand, Spain, and the United Kingdom, among others,
were importing capital from abroad, which helped fuel a credit and asset price
boom (Reinhart and Reinhart 2009). These trends, in and of themselves, made
these countries vulnerable to the usual nasty consequences of asset market
crashes and capital flow reversals irrespective of what may be happening in the
United States.
Are more fast and furious episodes or spillovers under way? Applying the
criteria that typically characterize fast and furious contagion (see box 1.2) to
the current environment yields a mixed picture but one that, on the whole,
would suggest contagion (and the more gradual spillover) threats still loom
large. Surprise events are (by definition) always a distinct possibility. However,
at the time of this writing the precarious nature of balance sheets in much of
Europe and the United States is more in the public eye than at the beginning
on this crisis in the summer of 2007. This fact is plainly evident in the succes-
sion of ratings downgrades of several sovereigns in Europe as well as of Japan.
Most recently, of course, Standard and Poor’s has put the United States on
notice of a possible downgrade, echoing a similar warning by the International
Monetary Fund. These sovereign downgrades have mirrored, to some extent,
the general widening and greater heterogeneity in sovereign spreads. As to the
capital inflow cycle and leverage, the inflow peaks and surges in fresh private
borrowing are well behind us but public debts continue to climb (see figure
1.1) and private deleveraging, especially in Europe, has been (at best) limited
(Reinhart and Reinhart 2011b). Highly leveraged public and private sectors
have been historically a “contagion amplifier.” So have been common credi-
tors. Apart from the elevated levels of leverage in most advanced economies as
discussed, the widespread presence of common creditors (most notable in the
euro area as well as the United Kingdom) is a second compelling factor indi-
cating that the scope for fast and furious contagion remains high. This type
of financial vulnerability is exacerbated by the lack of transparency in overall
cross-border exposure, as highlighted in the extensive new database in Milesi-
Ferretti, Strobbe, and Tamirisa (2010).
IV. Debt and Growth
The march from high public indebtedness to sovereign default or restruc-
turing is usually marked by episodes of drama, punctuated by periods of high
volatility in financial markets, rising credit spreads, and ratings downgrades.
However, the economic impacts of high public indebtedness are not limited to
such episodes of high drama, as rising public debts are not universally associ-
ated with rising interest rates and imminent expectations of sovereign default
(see Gagnon and Hinterschweiger 2011 for a thorough examination of this

A DECADE OF DEBT 21
issue.) Serious public debt overhangs may also cast a shadow on economic
growth, even when the sovereign’s solvency is not called into question.
In this section we summarize our main findings in Reinhart and Rogoff
(2010a, 2010b), elaborate on some methodology issues, and discuss some of
the very recent literature that examines the debt and growth connection.
The Basic Exercise and Key Results
Our analysis of growth and debt was based on newly compiled data on 44 coun-
tries spanning about 200 years. This amounts to 3,700 annual observations and
covers a wide range of political systems, institutions, exchange rate arrange-
ments, and historic circumstances.
The main findings of Reinhart and Rogoff (2010a) are the following.
First, the relationship between government debt and real GDP growth is
weak for debt/GDP ratios below 90 percent of GDP.14 Above the threshold
of 90 percent, median growth rates fall by 1 percent, and average growth
falls considerably more. The threshold for public debt is similar in advanced
and emerging-market economies and applies for both the post–World War
II period and as far back as the data permit (often well into the 1800s).
Second, emerging markets face lower thresholds for total external debt
(public and private)—which is usually denominated in a foreign currency.
When total external debt reaches 60 percent of GDP, annual growth
declines about 2 percent; for higher levels, growth rates are roughly cut in
half.
Third, there is no apparent contemporaneous link between inflation and
public debt levels for the advanced countries as a group (some countries,
such as the United States, have experienced higher inflation when debt/
GDP is high). The story is entirely different for emerging markets, where
inflation rises sharply as debt increases.
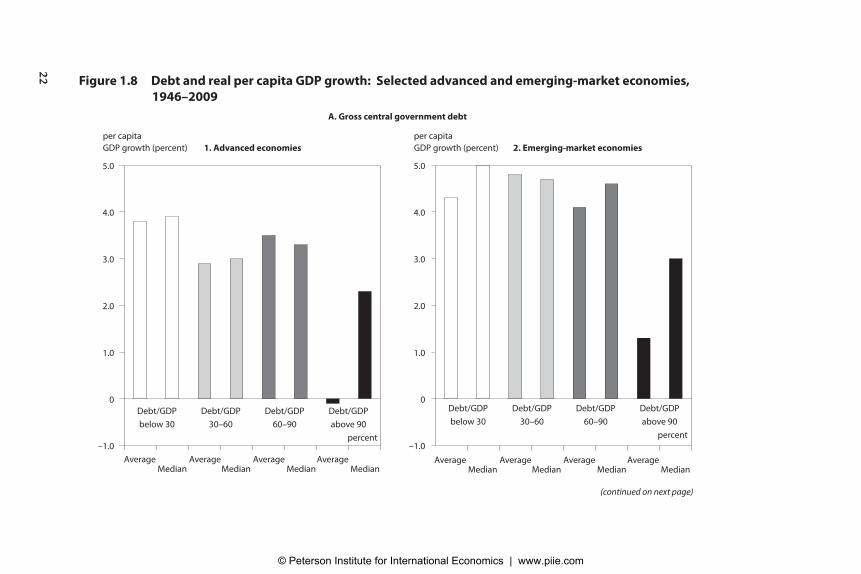
Figure 1.8 can be used to summarize our main conclusions. The top panel
applies to the 20 advanced countries in our 44-country sample (where much of
the public debate is centered).15 The remaining two panels of the figure present
comparable results for emerging-market public debt and gross external debt.
14. As noted previously, “public debt” here refers to gross central government debt. “Domestic
public debt” is government debt issued under domestic legal jurisdiction. Public debt does not
include obligations carrying a government guarantee. Total gross external debt includes the
external debts of all branches of government as well as private debt issued by domestic private
entities under a foreign jurisdiction.
15. The comparable emerging-market exercises are presented in the original working paper (NBER
Working Paper 15639, January 2010).
22 Figure 1.8 Debt and real per capita GDP growth: Selected advanced and emerging-market economies,
1946–2009
A. Gross central government debt
(continued on next page)
per capita
GDP growth (percent)
5.0
4.0
3.0
2.0
1.0
0
–1.0
Average Average Average Average Median Median Median Median
Debt/GDP Debt/GDP Debt/GDP Debt/GDP
below 30 30–60 60–90 above 90
percent
1. Advanced economies
5.0
4.0
3.0
2.0
1.0
0
–1.0
Debt/GDP Debt/GDP Debt/GDP Debt/GDP
below 30 30–60 60–90 above 90
percent
per capita
GDP growth (percent) 2. Emerging-market economies
Average Average Average Average Median Median Median Median

A DECADE OF DEBT 23
In the figure, the annual observations are grouped into four categories,
according to the ratio of debt/GDP during that particular year: years when
debt-to-GDP levels were below 30 percent; 30 to 60 percent; 60 to 90 percent;
and above 90 percent.16 The bars show average and median GDP growth for
each of the four debt categories. Note that of the 1,186 annual observations,
there are a significant number in each category, including 96 above 90 percent.
(Recent observations in that top bracket come from Belgium, Greece, Italy, and
Japan.) From the figure, it is evident that there is no obvious link between debt
and growth until public debt exceeds the 90 percent threshold. The observa-
tions with debt to GDP over 90 percent have median growth roughly 1 percent
lower than the lower debt burden groups and mean levels of growth almost
4 percent lower. (Using lagged debt does not dramatically change the picture.)
16. The four “buckets” encompassing low, medium-low, medium-high, and high debt levels are
based on our interpretation of much of the literature and policy discussion on what are consid-
ered low, high debt levels. It parallels the World Bank country groupings according to four
income groups. Sensitivity analysis involving a different set of debt cutoffs merits exploration,
as do country-specific debt thresholds along the broad lines discussed in Reinhart, Rogoff, and
Savastano (2003).
B. Gross external (public plus private) debt
per capita
GDP growth (percent)
5.5
4.5
3.5
2.5
1.5
0.5
–0.5
–1.5
Average Average Average Average Median Median Median Median
Debt/GDP Debt/GDP Debt/GDP Debt/GDP
below 30 30–60 60–90 above 90
percent
1. Emerging-market economies
Sources: Reinhart and Rogoff (2010a) and sources cited therein.
24
High Debt Episodes in the Sample
The episodes that attract our interest are those where debt levels were histori-
cally high. As convenient as it is to focus exclusively on a particular country or a
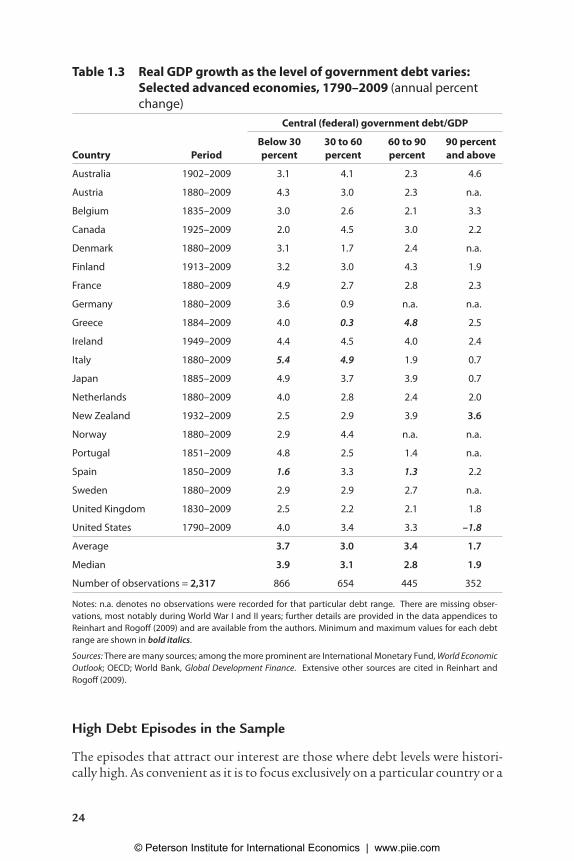
Table 1.3 Real GDP growth as the level of government debt varies:
Selected advanced economies, 1790–2009 (annual percent
change)
Central (federal) government debt/GDP
Country Period
Below 30
percent
30 to 60
percent
60 to 90
percent
90 percent
and above
Australia 1902–2009 3.1 4.1 2.3 4.6
Austria 1880–2009 4.3 3.0 2.3 n.a.
Belgium 1835–2009 3.0 2.6 2.1 3.3
Canada 1925–2009 2.0 4.5 3.0 2.2
Denmark 1880–2009 3.1 1.7 2.4 n.a.
Finland 1913–2009 3.2 3.0 4.3 1.9
France 1880–2009 4.9 2.7 2.8 2.3
Germany 1880–2009 3.6 0.9 n.a. n.a.
Greece 1884–2009 4.0 0.3 4.8 2.5
Ireland 1949–2009 4.4 4.5 4.0 2.4
Italy 1880–2009 5.4 4.9 1.9 0.7
Japan 1885–2009 4.9 3.7 3.9 0.7
Netherlands 1880–2009 4.0 2.8 2.4 2.0
New Zealand 1932–2009 2.5 2.9 3.9 3.6
Norway 1880–2009 2.9 4.4 n.a. n.a.
Portugal 1851–2009 4.8 2.5 1.4 n.a.
Spain 1850–2009 1.6 3.3 1.3 2.2
Sweden 1880–2009 2.9 2.9 2.7 n.a.
United Kingdom 1830–2009 2.5 2.2 2.1 1.8
United States 1790–2009 4.0 3.4 3.3 –1.8
Average 3.7 3.0 3.4 1.7
Median 3.9 3.1 2.8 1.9
Number of observations = 2,317 866 654 445 352
Notes: n.a. denotes no observations were recorded for that particular debt range. There are missing obser-
vations, most notably during World War I and II years; further details are provided in the data appendices to
Reinhart and Rogoff (2009) and are available from the authors. Minimum and maximum values for each debt
range are shown in bold italics.
Sources: There are many sources; among the more prominent are International Monetary Fund, World Economic
Outlook; OECD; World Bank, Global Development Finance. Extensive other sources are cited in Reinhart and
Rogoff (2009).

A DECADE OF DEBT 25
single episode for a single country (like the United States around World War II,
where the data are readily available, or an interesting ongoing case like Japan),
the basis for an empirical regularity is multiple observations. Because our data
span 44 countries with many going back to the 1800s or at least the beginning
of the 19th century, our analysis is based on all the episodes of high (above 90
percent) debt for the post–World War II period; for the pre-war sample it covers
all those for which data are available. Table 1.3 is reproduced from Reinhart
and Rogoff (2010a) and describes the coverage and the basic statistics for the
various debt levels for the advanced economies.17
It is common knowledge that the United States emerged after World War
II with a very high debt level. But this also held for Australia, Canada, and most
markedly the United Kingdom, where public debt/GDP peaked at near 240
percent in 1948. These cases from the aftermath of World War II are joined in
our sample by a number of peacetime high-debt episodes: the 1920s and 1980s
to the present in Belgium; the 1920s in France; Greece in the 1920s, 1930s, and
1990s to the present; Ireland in the 1980s; Italy in the 1990s; Spain at the turn
of the last century; the United Kingdom in the interwar period and prior to the
1860s; and, of course, Japan in the past decade. As will be discussed, episodes
where debt is above 90 percent are themselves rare, and as shown in table 1.3, a
number of countries have never had debt entries above 90 percent.
Debt Thresholds and Nonlinearities: The 90 Percent Benchmark
Thresholds and nonlinearities play a key role in understanding the relation-
ship between debt and growth that should not be ignored in casual reinter-
pretations.
Thresholds. Anyone who has done any work with data is well aware that
mapping a vague concept, such as “high debt” or “overvalued” exchange rates
to a workable definition for interpreting the existing facts and informing the
discussion requires making arbitrary judgments about where to draw lines. In
the case of debt, we worked with four buckets: 0 to 30 percent, 30 to 60 percent,
60 to 90 percent, and over 90 percent. The last one turned out to be the critical
one for detecting a difference in growth performance, so we single it out for
discussion here.
Figure 1.9 shows the public debt to GDP ratio as well as pooled descrip-
tive statistics (inset) for the advanced economies (to complement the country-
specific ones shown in table 1.3) over the post World War II period.18 The
median public debt/GDP ratio is 36.4 percent; about 92 percent of the obser-
vations fall below the 90 percent threshold (see figure 1.9). In effect, about
76 percent of the observations were below the 60 percent Maastricht criteria.
17. Again, the interested reader is referred to the original working paper version of Reinhart and
Rogoff (2010a). See NBER Working Paper 15639 (January 2010).
18. Our sample includes 24 emerging-market countries.

26 Figure 1.9 The 90 percent debt/GDP threshold: 1946–2009, advanced economies
probability density function
Notes: The advanced economy sample is the complete IMF grouping (Switzerland and Iceland were added). It includes Australia, Austria,
Belgium, Canada, Denmark, Finland, France, Germany, Greece, Iceland, Ireland, Italy, Japan, Netherlands, New Zealand, Norway, Portugal,
Spain, Sweden, Switzerland, the United Kingdom, and the United States.
annual observations
12
10
8
6
4
2
0
5 10 15 20 25 30 35 40 45 50 55 60 65 70 75 80 85 90 95 100 110 130 150 170 above
Public debt/GDP: 1946–2009,
22 advanced economies
Median 36.4
Average 43.5
Minimum 2.8
Maximum 237.9
Annual observations 1,326.0
91.6 percent of observations
below 90 percent
8.4 percent of observations
above 90 percent
90 percent
public debt/GDP (percent)
percent of observations
A DECADE OF DEBT 27
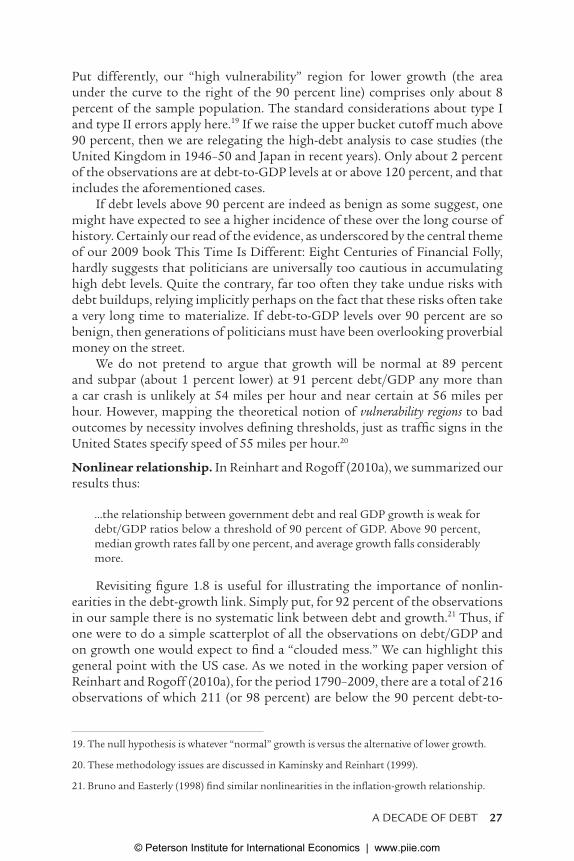
Put differently, our “high vulnerability” region for lower growth (the area
under the curve to the right of the 90 percent line) comprises only about 8
percent of the sample population. The standard considerations about type I
and type II errors apply here.19 If we raise the upper bucket cutoff much above
90 percent, then we are relegating the high-debt analysis to case studies (the
United Kingdom in 1946–50 and Japan in recent years). Only about 2 percent
of the observations are at debt-to-GDP levels at or above 120 percent, and that
includes the aforementioned cases.
If debt levels above 90 percent are indeed as benign as some suggest, one
might have expected to see a higher incidence of these over the long course of
history. Certainly our read of the evidence, as underscored by the central theme
of our 2009 book This Time Is Different: Eight Centuries of Financial Folly,
hardly suggests that politicians are universally too cautious in accumulating
high debt levels. Quite the contrary, far too often they take undue risks with
debt buildups, relying implicitly perhaps on the fact that these risks often take
a very long time to materialize. If debt-to-GDP levels over 90 percent are so
benign, then generations of politicians must have been overlooking proverbial
money on the street.
We do not pretend to argue that growth will be normal at 89 percent
and subpar (about 1 percent lower) at 91 percent debt/GDP any more than
a car crash is unlikely at 54 miles per hour and near certain at 56 miles per
hour. However, mapping the theoretical notion of vulnerability regions to bad
outcomes by necessity involves defining thresholds, just as traffic signs in the
United States specify speed of 55 miles per hour.20
Nonlinear relationship. In Reinhart and Rogoff (2010a), we summarized our
results thus:
…the relationship between government debt and real GDP growth is weak for
debt/GDP ratios below a threshold of 90 percent of GDP. Above 90 percent,
median growth rates fall by one percent, and average growth falls considerably
more.
Revisiting figure 1.8 is useful for illustrating the importance of nonlin-
earities in the debt-growth link. Simply put, for 92 percent of the observations
in our sample there is no systematic link between debt and growth.21 Thus, if
one were to do a simple scatterplot of all the observations on debt/GDP and
on growth one would expect to find a “clouded mess.” We can highlight this
general point with the US case. As we noted in the working paper version of
Reinhart and Rogoff (2010a), for the period 1790–2009, there are a total of 216
observations of which 211 (or 98 percent) are below the 90 percent debt-to-
19. The null hypothesis is whatever “normal” growth is versus the alternative of lower growth.
20. These methodology issues are discussed in Kaminsky and Reinhart (1999).
21. Bruno and Easterly (1998) find similar nonlinearities in the inflation-growth relationship.

28
GDP cutoff. It should be quite obvious that a scatterplot of the US data would
not be capable of revealing a systematic pattern (as demonstrated in Iron and
Bivens 2010). Indeed, this example illustrates one of our main results: that
there is no systematic relationship between debt and growth below a threshold
of 90 percent of GDP.
Debt and Growth Causality
As discussed, we examine average and median growth and inflation rates
contemporaneously with debt. Temporal causality tests are not part of the
analysis. The application of many of the standard methods for establishing
temporal precedence is complicated by the nonlinear relationship between
growth and debt (more of this to follow) that we have alluded to.
But where do we place the evidence on causality? For low-to-moderate
levels of debt there may or may not be one; the issue is an empirical one, which
merits study. For high levels of debt the evidence points to bi-directional
causality.
Growth-to-debt: As we discuss in section II, our analysis of the aftermath of
financial crisis (Reinhart and Rogoff 2008) presents compelling evidence for
both advanced and emerging markets over 1800–2008 on the fiscal impacts
(revenue, deficits, debts, and sovereign credit ratings) of the recessions associ-
ated with banking crises (figure 1.2).
There is little room to doubt that severe economic downturns, irrespective
of whether their origins was a financial crisis or not, will, in most instances,
lead to higher debt/GDP levels contemporaneously and/or with a lag. There is,
of course, a vast literature on cyclically adjusted fiscal deficits making exactly
this point.
Debt-to-growth: A unilateral causal pattern from growth to debt, however,
does not accord with the evidence. Public debt surges are associated with a
higher incidence of debt crises (figure 1.4).22 This temporal pattern is analyzed
in Reinhart and Rogoff (2008) and in the accompanying country-by-country
analyses cited therein (Reinhart and Rogoff 2011b). In the current context, even
a cursory reading of the recent turmoil in Greece and other European countries
can be importantly traced to the adverse impacts of high levels of government
debt (or potentially guaranteed debt) on country risk and economic outcomes.
At a very basic level, a high public debt burden implies higher future taxes
(inflation is also a tax) or lower future government spending, if the govern-
ment is expected to repay its debts.
There is scant evidence to suggest that high debt has little impact on growth.
Kumar and Woo (2010) highlight in their cross-country findings that debt levels
22. For a model where credit-financed government deficits lead to a currency crisis, see Krugman
(1979).
A DECADE OF DEBT 29
have negative consequences for subsequent growth, even after controlling for
other standard determinants in growth equations. For emerging markets, an
older literature on the debt overhang of the 1980s frequently addresses this
theme.
V. The Aftermath of High Debt: The 1930s and World War II
Up until very recently, financial markets and policymakers had all but forgotten
that default and restructuring are not alien to the advanced economies. For
instance, Reinhart, Rogoff, and Savastano (2003) and Reinhart and Rogoff
(2009) document that several now-wealthy countries have a long history of
serial default. This section does not attempt to review this rich sovereign
debt crisis history; the focus is confined to the last two “global” debt spikes.
These two high-debt episodes share some of the characteristics of the current
debt spike, as they involve numerous advanced economies (accounting for an
important share of world GDP).
The first part of the section presents a brief sketch of the last wave of sover-
eign defaults, restructurings, and forcible conversions in response to the debt
overhang during the 1930s that engulfed the advanced economies while the
second subsection outlines the more subtle debt restructuring that was facili-
tated by pervasive financial repression during the 1940s to the 1970s.
Default, Restructurings, and Forcible Conversions in the 1930s
Table 1.4 lists the known “domestic credit events” of the Great Depression.
Default on or restructuring of external debt (see the notes to the table) also
often accompanied the restructuring or default of the domestic debt. All the
allied governments, with the exception of Finland, defaulted on (and remained
in default through 1939 and never repaid) their World War I debts to the United
States as economic conditions deteriorated worldwide during the 1930s.23
Financial Repression in 1940s–70s: The “Quiet” Restructuring
Apart from emerging markets, many of which have continued to openly peri-
odically default or restructure their debts (usually at times of severe economic
stress) through the present, the only explicit defaults (or restructurings) in
advanced economies since World War II were confined to either those of the
countries that lost the war (Austria, Germany, Italy, and Japan) or those that
never reestablished their credit since slipping into default in the 1930s (Greece,
for instance, was in default from 1932 until 1964). Financial repression was
the post-World War II “politically correct” replacement for the more open debt
restructurings and defaults of the 1930s.
23. Finland, being under continuous threat of Soviet invasion at the time, maintained payments
on its debts to the United States so as to maintain the best possible relationship.

30
Table 1.4 Selected episodes of domestic debt default or restructuring,
1920s–40s
Country Dates Commentary
For additional possible domestic defaults in several European countries during the 1930s, see notes below.
Australia 1931/1932 The Debt Conversion Agreement Act in 1931/32 ap-
pears to have done something similar to the later
New Zealand induced conversion. See New Zealand
entry.1
Bolivia 1927 Arrears of interest lasted until at least 1940.
Canada (Alberta) April 1935 The only province to default—which lasted for about
10 years.
China 1932 First of several “consolidations”, monthly cost of do-
mestic service was cut in half. Interest rates were
reduced to 6 percent (from over 9 percent)—amorti-
zation periods were about doubled in length.
Greece 1932 Interest on domestic debt was reduced by 75 percent
since 1932; domestic debt was about 1/4 of total pub-
lic debt.
Mexico 1930s Service on external debt was suspended in 1928.
During the 1930s, interest payments included “ar-
rears of expenditure and civil and military pensions.”
New Zealand 1933 In March 1933 the New Zealand Debt Conversion
Act was passed providing for voluntary conversion
of internal debt amounting to 113 million pounds
to an interest rate of 4 percent for ordinary debt and
3 percent for tax-free debt. Holders had the option of
dissenting but interest in the dissented portion was
made subject to an interest tax of 33.3 percent.1
Peru 1931 After suspending service on external debt on May 29,
Peru made “partial interest payments” on domestic
debt.
Romania February 1933 Redemption of domestic and foreign debt is sus-
pended (except for three loans).
Spain October 1936–
April 1939
Interest payments on external debt were suspended;
arrears on domestic debt service accumulated.
United States 1933 Abrogation of the gold clause. In effect, the US re-
fused to pay Panama the annuity in gold due to
Panama according to a 1903 treaty. The dispute was
settled in 1936 when the US paid the agreed amount
in gold balboas.
United Kingdom 1932 Most of the outstanding World War I debt was con-
solidated into a 3.5 percent perpetual annuity. This
domestic debt conversion was apparently voluntary.
However, some of the World War I debts to the Unit-
ed States were issued under domestic (UK) law (and
therefore classified as domestic debt) and these were
defaulted on following the end of the Hoover 1931
moratorium.
(continued on next page)

A DECADE OF DEBT 31
Generally, the aims of debt restructuring are (1) reducing the value of the
stock of existing debts (haircut); (2) reducing debt servicing costs (by cutting
or capping interest rates); and (3) minimizing rollover risk by lengthening
maturities and/or shifting into nonmarketable debt. Financial repression
achieves all three goals of debt restructuring—albeit that the first (reducing
the value) is achieved more gradually than in open restructurings. Thus, as
argued in Reinhart and Rogoff (2009), financial repression—a hallmark of the
1940s–70s—is nothing other than a more subtle form of debt restructuring.
Legislation or “moral suasion” limiting the range and amounts of nongov-
ernment debt domestic assets financial institutions can hold; limiting further
(or outright forbidding) holdings of foreign assets; and requiring financial
institutions to hold more government debt were all part of the “financially
repressed landscape.” A whole range of interest rate ceilings (for example, on
deposits) made holding low-yielding government bonds also more palatable
for individuals as well as institutions. Pension funds have historically provided
the “captive audience par excellence” for placing vast sums of government debt
at questionable rates of return (often negative ex post in real terms). It is worth
noting that the real ex post interest rate on public debt (appropriately weighted
Table 1.4 Selected episodes of domestic debt default or restructuring,
1920s–40s (continued)
Uruguay November 1, 1932–
February, 1937
After suspending redemption of external debt on
January 20, redemptions on domestic debt were
equally suspended.
Austria December 1945 Restoration of schilling (150 limit per person); re-
mainder placed in blocked accounts. In December
1947, large amounts of previously blocked schillings
were invalidated and rendered worthless; temporary
blockage of 50 percent of deposits.
Germany June 20, 1948 Monetary reform limiting 40 deutsche mark per per-
son; partial cancellation and blocking of all accounts.
Japan March 2, 1946–1952 After inflation, exchange of all bank notes for new is-
sue (1 to 1) limited to 100 yen per person; remaining
balances were deposited in blocked accounts.
Russia 1947 The monetary reform subjected privately held cur-
rency to a 90 percent reduction.
April 10, 1957 Repudiation of domestic debt (about 253 billion ru-
bles at the time).
1. See Schedvin (1970) and Prichard (1970), for accounts of the Australian and New Zealand conversions, re-
spectively, during the Depression. Michael Reddell kindly alerted us to these episodes and references.
Notes: We have made significant further progress in sorting out the defaults on World War I debts to the United
States, notably by European countries. In all cases these episodes are classified as a default on external debts.
However, in some cases—such as the United Kingdom—some of the World War I debts to the United States
were also issued under domestic law and, as such, would also qualify as a domestic default. The external de-
faults on June 15, 1934 included Austria, Belgium, Czechoslovakia, Estonia, France, Greece, Hungary, Italy, Lat-
via, Poland, the United Kingdom. Only Finland made payments. See New York Times, June 15, 1934.

32
by the type of debt instrument) was negative for US debt for 25 percent of the
years during 1945–80, while the comparable share for the United Kingdom
was nearly 50 percent, as Reinhart and Sbrancia (2011) document.
Table 1.5 illustrates, for the examples of Italy, the United Kingdom, and
the United States, the important role played by financial repression (combined
with some inflation) in the crucial debt-reduction decade that followed World
War II.24 The savings range from an average of about 9 percent for Italy (which
had higher inflation) to about 5 percent for the United States and United
Kingdom. In effect, the savings from financial repression are a lower bound
for the United Kingdom, as we use the “official” consumer price index for this
period in the calculations and inflation is estimated to have been substantially
higher than the official figure (see, for example, Friedman and Schwartz 1963).
Also, other factors (such as the 1951 US conversion, which swapped market-
able for nonmarketable debt) do not factor into these simple debt-reduction
calculations. The simple fact is that ex post real interest rates were significantly
lower in both advanced and emerging-market economies during the finan-
cial repression era that is sandwiched between World War II and the high real
interest rates of the 1930s and the post-financial and capital account liberal-
ization that has swept through financial markets since the mid-1980s.
24. See Reinhart and Sbrancia (2011) for a full fledged analysis of the international role played by
financial repression in reducing the World War II debt overhang.
Table 1.5 Debt liquidation through financial repression: Italy, United
Kingdom, and United States, 1945–55
Public debt/GDP
Annual average:
1946–1955
Country 1945
1955
(actual)
1955 without
repression
savings
(estimate)3
“Financial
repression
revenue”/
GDP Inflation
Italy1 79.2 38.1 129.3 9.1 10.8
United Kingdom2 215.6 138.2 182.9 4.5 5.9
United States 116.0 66.2 118.6 5.2 4.2
1. Italy was in default on its external debt 1940–46.
2. The savings from financial repression are a lower bound, as we use the “official” consumer price index for this
period in the calculations and inflation is estimated to have been substantially higher than the official figure
(see for example Friedman and Schwartz 1963).
3. The simple cumulative annual savings without compounding.
Notes: The peaks in debt/GDP were: Italy 129.0 in 1943; United Kingdom 247.5 in 1946; United States 121.3 in
1946. An alternative interpretation of the financial repression revenue is simply as savings in interest service
on the debt.
Source: Reinhart and Sbrancia (2011).

A DECADE OF DEBT 33
VI. Conclusion
One need look no further than the stubbornly high unemployment rates
in the United States and other advanced economies to be convinced of the
importance of developing a better understanding of the growth prospects for
the decade ahead. We have presented evidence suggesting that high levels of
debt dampen growth. One can argue that the United States can tolerate higher
levels of debt more than other countries can without having its solvency called
into question. That is probably so.25 We have shown in our earlier work that
a country’s credit history plays a prominent role in determining what levels
of debt it can sustain without landing on a sovereign debt crisis. More to the
point of this analysis, however, we have no comparable evidence yet to suggest
that the consequences of higher debt levels for growth will be different for the
United States than for other advanced economies.
Figure 1.10, which plots total (public and private) credit market debt
outstanding for the United States during 1916 to 2010Q1, makes this point
clear.26 Despite considerable deleveraging by the private financial sector, total
debt remains near its historic high in 2008. Total public-sector debt during the
first quarter of 2010 is 117 percent of GDP; since 1916 (when this series begins)
it has been higher only during a one-year stint at 119 percent in 1945. Perhaps
soaring US debt levels will not prove to be a drag on growth in the decades to
come. However, if history is any guide, that is a risky proposition, and overreli-
ance on US exceptionalism may only prove to be one more example of the This
Time is Different Syndrome.27
The sharp runup in public-sector debt will likely prove one of the most
enduring legacies of the 2007–09 financial crises in the United States and else-
where. We examine the experience of 44 countries spanning up to two centuries
of data on central government debt, inflation, and growth. Our main finding
is that across both advanced countries and emerging markets, high debt/
GDP levels (90 percent and above) are associated with notably lower-growth
outcomes. Much lower levels of external debt/GDP (60 percent) are associated
with adverse outcomes for emerging-market growth. Seldom do countries
“grow” their way out of debts. The nonlinear response of growth to debt as
25. Indeed, this is the central argument in Reinhart and Reinhart (2010), originally published on
November 17, 2008.
26. The Flow of Funds data aggregate the private and public sectors, where the latter comprises
federal (net), state, and local government enterprises. To reiterate, this is not the public debt
measure used in our historical analysis; we use gross central government debt (which for the
United States is at present about 90 percent of GDP).
27. The This Time is Different Syndrome is rooted in the firmly held beliefs that (1) financial crises
and negative outcomes are something that happen to other people in other countries at other
times (these do not happen here and now to us); (2) we are doing things better, we are smarter,
we have learned from the past mistakes; and (3) as a consequence, old rules of valuation are not
thought to apply any longer.

34 Figure 1.10 Total (public and private) credit market debt outstanding: United States,
1916–2010Q1
Notes: Beginning in 2010 Q1, almost all Fannie Mae and Freddie Mac mortgage pools are consolidated in Fannie Mae’s and Freddie Mac’s
balance sheets and, thus, are included in the debt of government
Source: Chapter 2.
400
350
300
250
200
150
100 1916 1926 1936 1946 1956 1966 1976 1986 1996 2006
Debt/GDP
Private Public
Median 117.4 61.5
Maximum 282.9 2008 119.2 1946
Minimum 35.9 1946 11.5 1916
2010 Q1 234.8 117.4
1933, suspension of the
Gold Clause
First year of banking crisis Default
percent of GDP
A DECADE OF DEBT 35
debt grows toward historical boundaries is reminiscent of the “debt intoler-
ance” phenomenon developed in Reinhart, Rogoff, and Savastano (2003). As
countries hit debt intolerance ceilings, market interest rates can begin to rise
quite suddenly, forcing painful adjustment.
For many if not most advanced countries, dismissing debt concerns at
this time is tantamount to ignoring the proverbial elephant in the room. So is
pretending that no restructuring will be necessary. It may not be called restruc-
turing, so as not to offend the sensitivities of governments that want to pretend
to find an advanced-economy solution for an emerging market style sovereign
debt crisis. As in other debt crisis resolution episodes, debt buybacks and debt-
equity swaps are a part of the restructuring landscape. Financial repression
is not likely to also prove a politically correct term—so prudential regulation
will probably provide the aegis for a return to a system more akin to what the
global economy had prior to the 1980s market-based reforms.
The process where debts are being “placed” at below-market interest rates
in pension funds and other more captive domestic financial institutions is
already under way in several countries in Europe. Central banks on both sides
of the Atlantic have become even bigger players in purchases of government
debt, possibly for the indefinite future. For the United States, fear of currency
appreciation continues to drive central banks in many emerging markets to
purchase US government bonds on a large scale. In other words, markets for
government bonds are increasingly populated by nonmarket players, calling
into question the information content of bond prices relative to their under-
lying risk profile—a common feature of financially repressed systems.
References
Arellano, Cristina, and Narayana Kocherlakota. 2008. Internal Debt Crises and Sovereign Defaults.
NBER Working paper 13794. Cambridge, MA: National Bureau of Economic Research.
Bordo, Michael, and Barry Eichengreen. 1999. Is Our Current International Economic Environment
Unusually Crisis Prone? Paper prepared for Reserve Bank of Australia conference on private
capital, Sydney, August.
Bordo, Michael, Barry Eichengreen, Daniela Klingebiel, and Maria Soledad Martinez-Peria. 2001.
Is the Crisis Problem Growing More Severe? Economic Policy 16 (April): 51–82.
Bruno, Michael, and William Easterly. 1998. Inflation Crises and Long-Run Growth. Journal of
Monetary Economics 41, no. 1 (February): 3–26.
Calvo, Guillermo. 1988. Servicing the Public Debt: The Role of Expectations. American Economic
Review 78, no. 4 (September): 647–61.
Caprio, Gerard, Daniela Klingebiel, Luc Laeven, and Guillermo Noguera. 2005. Banking Crisis
Database. In Systemic Financial Crises, ed. Patrick Honohan and Luc Laeven. Cambridge: Cam-
bridge University Press.
Checherita, Christina, and Philipp Rother. 2010. The Impact of High and Growing Debt on Economic
Growth and Empirical Investigation for the Euro Area. European Central Bank Working Paper
Series no. 1237 (August). Frankfurt: European Central Bank.
Diaz-Alejandro, Carlos. 1985. Goodbye Financial Repression, Hello Financial Crash. Journal of De-
velopment Economics 19.

36
Easterly, William R. 1989. Fiscal Adjustment and Deficit Financing During the Debt Crisis. In
Dealing with the Debt Crisis, ed. I. Husain and I. Diwan. Washington: World Bank.
Eichengreen, Barry. 1992. Golden Fetters The Gold Standard and the Great Depression 1919–1939. New
York: Oxford University Press.
Eichengreen, Barry, and Peter H. Lindert, eds. 1989. The International Debt Crisis in Historical Perspec-
tive. Cambridge, MA: MIT Press.
Flandreau, Marc, and Frederic Zumer. 2004. The Making of Global Finance, 1880–1913. Paris: Organi-
zation for Economic Cooperation and Development.
Fostel, Ana, and John Geanokoplos. 2008. Leverage Cycles and the Anxious Economy. American
Economic Review 98, no. 4: 1211–44.
Friedman, Milton, and Anna Jacobson Schwartz. 1963. A Monetary History of the United States 1867–
1960. Princeton: Princeton University Press.
Gagnon, Joseph, with Marc Hinterschweiger. 2011. The Global Outlook for Government Debt over the
Next 25 Years: Implications for the Economy and Public Policy. Policy Analyses in International
Economics 94. Washington: Peterson Institute for International Economics.
Geanokoplos, John. 2009. The Leverage Cycle. In NBER Macroeconomic Annual 2009, volume 24, ed.
D. Acemoglu, K. Rogoff and M. Woodford. Chicago: University of Chicago Press.
Giovannini, Alberto, and Martha de Melo. 1993. Government Revenue from Financial Repression.
American Economic Review 83, no. 4: 953–63.
Gopinath, Gita, and Mark Aguiar. 2006. Defaultable Risk, Interest Rates and the Current Account.
Journal of International Economics 69, no. 1 (June).
Jeanne, Olivier. 2009. Debt Maturity and the International Financial Architecture. American Eco-
nomic Review 99, no. 5: 2135–48.
Kaminsky, Graciela L., and Carmen M. Reinhart. 1999. The Twin Crises: The Causes of Banking
and Balance of Payments Problems. American Economic Review 89, no. 3 (June): 473–500.
Kaminsky, Graciela L., Carmen M. Reinhart, and Carlos Vegh. 2003. The Unholy Trinity of Finan-
cial Contagion. Journal of Economic Perspectives 17, no. 4 (Fall): 51–74.
Krugman, Paul R. 1979. A Model of Balance of Payments Crises. Journal of Money, Credit and Banking
11 (August): 311–25.
Kindleberger, Charles P. 1989. Manias, Panics and Crashes: A History of Financial Crises. New York:
Basic Books.
Lazaretou, Sophia. 2005. Greek Monetary Economics in Retrospect: The Adventures of the Drach-
ma. Economic Notes by Banca Monte dei Paschi di Siena 34, no. 3: 331–70.
Kumar, Mohan, and Jaejoon Woo. 2010. Public Debt and Growth. IMF Working Paper WP/10/174
(July). Washington: International Monetary Fund.
Lindert, Peter H., and Peter J. Morton. 1989. How Sovereign Debt Has Worked. In Developing Coun-
try Debt and Economic Performance, volume 1, ed. Jeffrey Sachs. Chicago: University of Chicago
Press.
Mendoza, Enrique G., and Marco E. Terrones. 2008. An Anatomy of Credit Booms: Evidence from Macro
Aggregates and Micro Data. NBER Working Paper 14049 (May). Cambridge, MA: National Bu-
reau of Economic Research.
Milesi-Ferretti, Gian Maria, Francesco Strobbe, and Natalia Tamirisa. 2010. Bilateral Financial Link-
ages and Global Imbalances: A View on The Eve of the Financial Crisis. IMF Working Paper 10/257.
Washington: International Monetary Fund.
Obstfeld, Maurice, and Kenneth Rogoff. 1995. Foundations of International Economics. Cambridge,
MA: MIT Press.
Prichard, Muriel F. Lloyds. 1970. An Economic History of New Zealand to 1939. Auckland: Collins.

A DECADE OF DEBT 37
Reinhart, Carmen M., and Vincent R. Reinhart. 2009. Capital Flow Bonanzas: An Encompassing
View of the Past and Present. In NBER International Seminar in Macroeconomics 2008, ed. Jeffrey
Frankel and Francesco Giavazzi. Chicago: Chicago University Press for National Bureau of
Economic Research.
Reinhart, Carmen M., and Vincent R. Reinhart. 2010. Is the US Too Big to Fail? VoxEU, May 9, www.
voxeu.org. Originally posted November 17, 2008.
Reinhart, Carmen M., and Vincent R. Reinhart. 2011 (forthcoming). After the Fall. Forthcoming
in Federal Reserve Bank of Kansas City Economic Policy Symposium, Macroeconomic Chal-
lenges: The Decade Ahead, Jackson Hole, Wyoming, August 26-28, 2010.
Reinhart, Carmen M., and Kenneth S. Rogoff. 2004. The Modern History of Exchange Rate Ar-
rangements: A Reinterpretation. Quarterly Journal of Economics CXIX, no. 1 (February): 1–48.
Reinhart, Carmen M., and Kenneth S. Rogoff. 2008. This Time is Different: A Panoramic View of Eight
Centuries of Financial Crises. NBER Working Paper 13882 (March). Cambridge, MA: National
Bureau of Economic Research.
Reinhart, Carmen M., and Kenneth S Rogoff. 2009. This Time is Different: Eight Centuries of Financial
Folly. Princeton: Princeton University Press (October).
Reinhart, Carmen M., and Kenneth S. Rogoff. 2010a. Growth in a Time of Debt. American Economic
Review 100, no. 2 (May): 573–78. Also published as NBER Working Paper 15639 (January
2010).
Reinhart, Carmen M., and Kenneth S. Rogoff. 2010b. Debt and Growth Revisited. VoxEU, August 11,
www.voxeu.org.
Reinhart, Carmen M., and Kenneth S. Rogoff. 2011a (forthcoming). Domestic Debt: The Forgot-
ten History. Economic Journal (May).
Reinhart, Carmen M., and Kenneth S Rogoff. 2011b (forthcoming). From Financial Crash to Debt
Crisis. American Economic Review. Also published as NBER Working Paper 15795 (March
2010).
Reinhart, Carmen M., and M. Belen Sbrancia. 2011. The Liquidation of Government Debt. Working
Paper 11-10. Washington: Peterson Institute for International Economics.
Reinhart, Carmen M., Kenneth S. Rogoff, and Miguel A. Savastano. 2003. Debt Intolerance. Brook-
ings Papers on Economic Activity 1 (Spring): 1–74.
Rodrik, Dani, and Andres Velasco. 2000. Short-Term Capital Flows. In Annual World Bank Confer-
ence on Development Economics (April). Washington: World Bank.
Schedvin, C. B. 1970. Australia and the Great Depression. Sydney: Sydney University Press.
Velasco, Andres. 1987. Financial and Balance-of-Payments Crises. Journal of Development Economics
27, no. 1/2 (October): 263–83.
Winkler, Max. 1933. Foreign Bonds: An Autopsy. Philadelphia: Roland Sway Co.
Wynne, William H. 1951. State Insolvency and Foreign Bondholders: Selected Case Histories of Governmen-
tal Foreign Bond Defaults and Debt Readjustments II. London: Oxford University Press.