Ch08 failure -sent fall2016
13
10/4/2016 1 Chapter 8 - Chapter 8: Failure • Fracture Mechanics-design when fracture is present • Cup and cone fracture • Intergranular fracture • Transgranular fracture • Charpy Test • Izod test • S-N Curve • Factors affecting fatigue life-? • Creep - Creep behavior- stress and T • Creep prediction by Data Extrapolation Do we know these? Chapter 8 - Overview of this chapter • Need to understand failure to be able to design so that it does not happen.. .. .. • Various ways materials fail/break – Fracture • Stress beyond strength – Ductile vs. brittle • Because of defect/crack – Fracture mechanics – Fatigue • Cyclic, reversed stress below yield • Cycles, Stress levels • Temperature – Creep • Stress • Temperature, time • Prediction Chapter 8 - Fracture mechanisms • Ductile fracture – Occurs with/after plastic deformation • Brittle fracture – Little or no plastic deformation – Catastrophic
-
Upload
savanna-holt -
Category
Engineering
-
view
16 -
download
1
Transcript of Ch08 failure -sent fall2016
10/4/2016
1
Chapter 8 -
Chapter 8: Failure
• Fracture Mechanics-design when fracture is present• Cup and cone fracture• Intergranular fracture• Transgranular fracture• Charpy Test• Izod test• S-N Curve• Factors affecting fatigue life-?• Creep - Creep behavior- stress and T• Creep prediction by Data Extrapolation
Do we know these?
Chapter 8 -
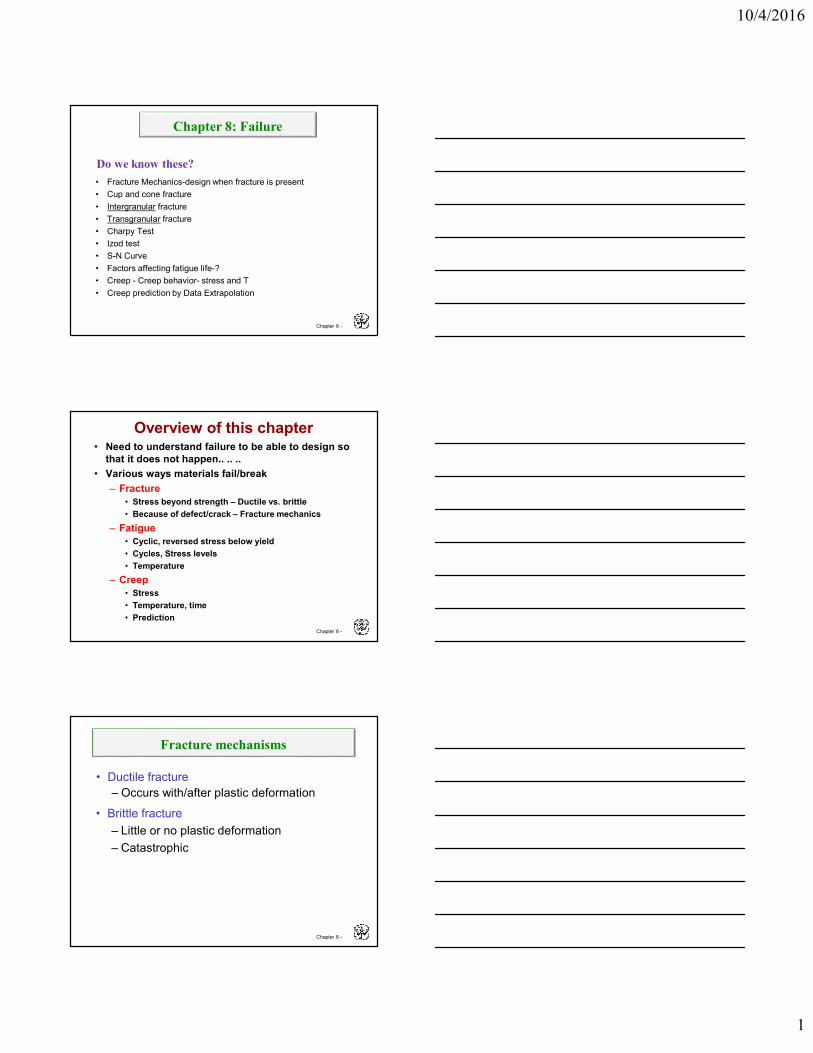
Overview of this chapter• Need to understand failure to be able to design so
that it does not happen.. .. .. • Various ways materials fail/break
– Fracture • Stress beyond strength – Ductile vs. brittle• Because of defect/crack – Fracture mechanics
– Fatigue• Cyclic, reversed stress below yield• Cycles, Stress levels• Temperature
– Creep• Stress• Temperature, time• Prediction
Chapter 8 -
Fracture mechanisms
• Ductile fracture– Occurs with/after plastic deformation
• Brittle fracture– Little or no plastic deformation– Catastrophic

10/4/2016
2
Chapter 8 -
Ductile vs Brittle Failure BehaviorVery
DuctileModerately
Ductile BrittleFracturebehavior:
Large Moderate%AR or %EL Small• Ductile
fracture is usuallydesirable!
Adapted from Fig. 8.1, Callister 7e.
• Classification:
Ductile:warning before
fracture
Brittle:No
warning
Chapter 8 -
• Ductile failure:--one piece--large deformation
Figures from V.J. Colangelo and F.A. Heiser, Analysis of Metallurgical Failures(2nd ed.), Fig. 4.1(a) and (b), p. 66 John Wiley and Sons, Inc., 1987. Used with permission.
Example: Failure of a Pipe
• Brittle failure:--many pieces--small deformation
Chapter 8 -
• Stages to failure:
• Resultingfracturesurfaces(steel)
50 mm
particlesserve as voidnucleationsites.
50 mm
From V.J. Colangelo and F.A. Heiser, Analysis of Metallurgical Failures (2nd ed.), Fig. 11.28, p. 294, John Wiley and Sons, Inc., 1987. (Orig. source: P. Thornton, J. Mater. Sci., Vol. 6, 1971, pp. 347-56.)
100 mmFracture surface of tire cord wire loaded in tension. Courtesy of F. Roehrig, CC Technologies, Dublin, OH. Used with permission.
Moderately Ductile Failure (5 stages)
neckingσ
void nucleation
void growth and linkage
shearing at surface fracture

10/4/2016
3
Chapter 8 -
Ductile vs. Brittle Failure
Adapted from Fig. 8.3, Callister 7e.
cup-and-cone fracture brittle fracture
Chapter 8 -
Brittle FailureArrows indicate point at which failure originated
Adapted from Fig. 8.5(a), Callister 7e.
Chapter 8 -
• Intergranular(between grains)
• Intragranular(Through grains)
Al Oxide(ceramic)
Reprinted w/ permission from "Failure Analysis of Brittle Materials", p. 78.
Copyright 1990, The American Ceramic
Society, Westerville, OH. (Micrograph by R.M.
Gruver and H. Kirchner.)
316 S. Steel (metal)
Reprinted w/ permission from "Metals Handbook", 9th ed, Fig. 650, p. 357.
Copyright 1985, ASM International, Materials
Park, OH. (Micrograph by D.R. Diercks, Argonne
National Lab.)
304 S. Steel (metal)Reprinted w/permission from "Metals Handbook", 9th ed, Fig. 633, p. 650. Copyright 1985, ASM International, Materials Park, OH. (Micrograph by J.R. Keiser and A.R. Olsen, Oak Ridge National Lab.)
Polypropylene(polymer)Reprinted w/ permission from R.W. Hertzberg, "Defor-mation and Fracture Mechanics of Engineering Materials", (4th ed.) Fig. 7.35(d), p. 303, John Wiley and Sons, Inc., 1996. 3 mm
4 mm160mm
1 mm(Orig. source: K. Friedrick, Fracture 1977, Vol. 3, ICF4, Waterloo, CA, 1977, p. 1119.)
Brittle Fracture Surfaces
10/4/2016
4
Chapter 8 -
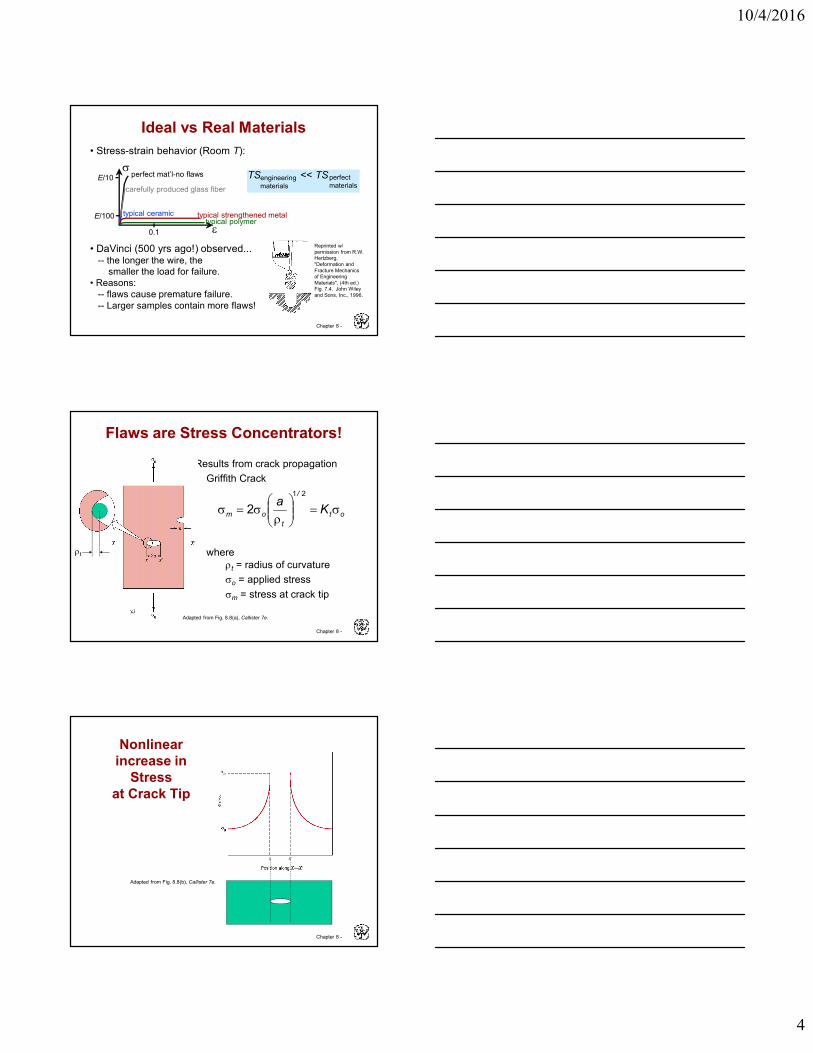
• Stress-strain behavior (Room T):
Ideal vs Real Materials
TS << TSengineeringmaterials
perfectmaterials
σ
ε
E/10
E/100
0.1
perfect mat’l-no flaws
carefully produced glass fiber
typical ceramic typical strengthened metaltypical polymer
• DaVinci (500 yrs ago!) observed...-- the longer the wire, the
smaller the load for failure.• Reasons:
-- flaws cause premature failure.-- Larger samples contain more flaws!
Reprinted w/ permission from R.W. Hertzberg, "Deformation and Fracture Mechanics of Engineering Materials", (4th ed.) Fig. 7.4. John Wiley and Sons, Inc., 1996.
Chapter 8 -
Flaws are Stress Concentrators!
Results from crack propagation• Griffith Crack
where ρt = radius of curvatureσo = applied stressσm = stress at crack tip
ot
/
tom Ka
σ=
ρ
σ=σ21
2
ρt
Adapted from Fig. 8.8(a), Callister 7e.
Chapter 8 -
Nonlinear increase in
Stress at Crack Tip
Adapted from Fig. 8.8(b), Callister 7e.
10/4/2016
5
Chapter 8 -
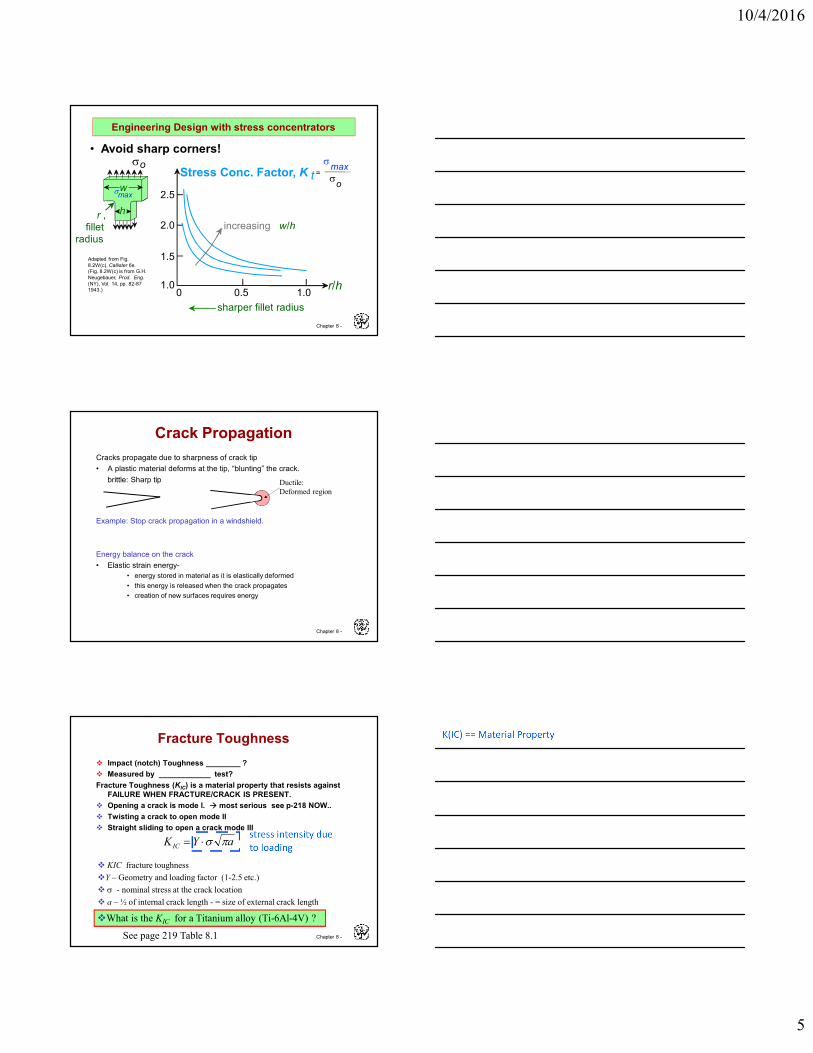
Engineering Design with stress concentrators
r/h
sharper fillet radius
increasing w/h
0 0.5 1.01.0
1.5
2.0
2.5
Stress Conc. Factor, K tσmax
σo=
• Avoid sharp corners!σ
Adapted from Fig. 8.2W(c), Callister 6e.(Fig. 8.2W(c) is from G.H. Neugebauer, Prod. Eng.(NY), Vol. 14, pp. 82-87 1943.)
r , fillet
radius
w
h
o
σmax
Chapter 8 -
Crack PropagationCracks propagate due to sharpness of crack tip • A plastic material deforms at the tip, “blunting” the crack.
brittle: Sharp tip
Example: Stop crack propagation in a windshield.
Energy balance on the crack• Elastic strain energy-
• energy stored in material as it is elastically deformed• this energy is released when the crack propagates• creation of new surfaces requires energy
Ductile: Deformed region
Chapter 8 -
Fracture Toughness! Impact (notch) Toughness ________ ?! Measured by ____________ test?Fracture Toughness (KIC) is a material property that resists against
FAILURE WHEN FRACTURE/CRACK IS PRESENT.! Opening a crack is mode I. " most serious see p-218 NOW..! Twisting a crack to open mode II! Straight sliding to open a crack mode III
aYKIC πσ⋅=
! KIC fracture toughness!Y – Geometry and loading factor (1-2.5 etc.)! σ - nominal stress at the crack location! a – ½ of internal crack length - = size of external crack length
!What is the KIC for a Titanium alloy (Ti-6Al-4V) ?
See page 219 Table 8.1
stress intensity due to loading
K(IC) == Material Property

10/4/2016
6
Chapter 8 -
• Crack growth condition:
• Largest, most stressed cracks grow first!
Design Against Crack Growth
Kc = aY πσ
--Result 1: Max. flaw sizedictates design stress.
max
cdesign aY
Kπ
<σ
σ
amaxno fracture
fracture
--Result 2: Design stressdictates max. flaw size.
21
σπ<
design
cmax Y
Ka
amax
σno fracture
fracture
Chapter 8 -
Fracture Toughness
Based on data in Table B5,p-A16Callister 7e.Composite reinforcement geometry is: f = fibers; sf = short fibers; w = whiskers; p = particles. Addition data as noted (vol. fraction of reinforcement):1. (55vol%) ASM Handbook, Vol. 21, ASM Int., Materials Park, OH (2001) p. 606.2. (55 vol%) Courtesy J. Cornie, MMC, Inc., Waltham, MA.3. (30 vol%) P.F. Becher et al., Fracture Mechanics of Ceramics, Vol. 7, Plenum Press (1986). pp. 61-73.4. Courtesy CoorsTek, Golden, CO.5. (30 vol%) S.T. Buljan et al., "Development of Ceramic Matrix Composites for Application in Technology for Advanced Engines Program", ORNL/Sub/85-22011/2, ORNL, 1992.6. (20vol%) F.D. Gace et al., Ceram. Eng. Sci. Proc., Vol. 7 (1986) pp. 978-82.
Graphite/ Ceramics/ Semicond
Metals/ Alloys
Composites/ fibersPolymers
5
KIc
(MP
a · m
0.5)
1
Mg alloysAl alloys
Ti alloysSteels
Si crystalGlass -sodaConcrete
Si carbide
PC
Glass 6
0.5
0.7
2
43
10
20
30
<100><111>
Diamond
PVCPP
Polyester
PS
PET
C-C(|| fibers) 1
0.6
67
40506070
100
Al oxideSi nitride
C/C( fibers) 1
Al/Al oxide(sf) 2
Al oxid/SiC(w) 3
Al oxid/ZrO 2(p) 4Si nitr/SiC(w) 5
Glass/SiC(w) 6
Y2O3/ZrO 2(p) 4
Chapter 8 -
• Two designs to consider...Design A--largest flaw is 9 mm--failure stress = 112 MPa
Design B--use same material--largest flaw is 4 mm--failure stress = ?
• Key point: Y and Kc are the same in both designs.
Answer: MPa 168)( B =σc• Reducing flaw size pays off!
• Material has Kc = 26 MPa-m0.5
Design Example: Aircraft WingStress VS amax
• Use...max
cc aY
Kπ
=σ
σc amax( )A = σc amax( )B
9 mm112 MPa 4 mm--Result:

10/4/2016
7
Chapter 8 -
Loading Rate
• Increased loading rate...-- increases σy and TS-- decreases %EL
• Why? An increased rategives less time for dislocations to move past obstacles.
σ
ε
σy
σy
TS
TS
largerε
smallerε
Chapter 8 -
8.6 Impact Testing
final height initial height
• Impact loading:-- severe testing case-- makes material more brittle like-- decreases toughness
Adapted from Fig. 8.12(b), Callister 7e.(Fig. 8.12(b) is adapted from H.W. Hayden, W.G. Moffatt, and J. Wulff, The Structure and Properties of Materials, Vol. III, Mechanical Behavior, John Wiley and Sons, Inc. (1965) p. 13.)
(Charpy)
Chapter 8 -
• Increasing temperature...--increases %EL and Kc
• Ductile-to-Brittle Transition Temperature (DBTT)...
Temperature
BCC metals (e.g., iron at T < 914°C)
Impa
ct E
nerg
y
Temperature
High strength materials (σy > E/150)
polymers More DuctileBrittle
Ductile-to-brittle transition temperature ( a small range)
FCC metals (e.g., Cu, Ni)
Adapted from Fig. 8.15, Callister 7e.

10/4/2016
8
Chapter 8 -
• Pre-WWII: The Titanic • WWII: Liberty ships
• Problem: Used a type of steel with a higher DBTT
Reprinted w/ permission from R.W. Hertzberg, "Deformation and Fracture Mechanics of Engineering Materials", (4th ed.) Fig. 7.1(a), p. 262, John Wiley and Sons, Inc., 1996. (Orig. source: Dr. Robert D. Ballard, The Discovery of the Titanic.)
Reprinted w/ permission from R.W. Hertzberg, "Deformation and Fracture Mechanics of Engineering Materials", (4th ed.) Fig. 7.1(b), p. 262, John Wiley and Sons, Inc., 1996. (Orig. source: Earl R. Parker, "Behavior of Engineering Structures", Nat. Acad. Sci., Nat. Res. Council, John Wiley and Sons, Inc., NY, 1957.)
Design Strategy:Stay Above The DBTT!
Chapter 8 -
Fatigue Failure• Fatigue = failure under cyclic stress.
• Stress varies with time.-- key parameters are S, σm, and
frequency
σmax
σmin
σ
time
σmS
• Key points: Fatigue...--can cause part failure, even though σmax < σc.--causes ~ 90% of mechanical engineering failures.
Adapted from Fig. 8.18, Callister 7e. (Fig. 8.18 is from Materials Science in Engineering, 4/E by Carl. A. Keyser, Pearson Education, Inc., Upper Saddle River, NJ.)tension on bottom
compression on top
countermotor
flex coupling
specimen
bearing bearing
Chapter 8 -
• Fatigue limit, σe:--no fatigue if σ < σe
Adapted from Fig. 8.19(a), Callister 7e.
S-N CurveFatigue Design Parameters
σe
case for steel (typ.)
N = Cycles to failure103 105 107 109
unsafe
safe
σ = stress amplitude
• Sometimes, thefatigue limit is zero!
(almost..)
Adapted from Fig. 8.19(b), Callister 7e.
case for Al (typ.)
N = Cycles to failure103 105 107 109
unsafe
safe
σ = stress amplitude

10/4/2016
9
Chapter 8 -
Improving Fatigue Life1. Impose a compressive
surface stress(to suppress surfacecracks from growing)
N = Cycles to failure
moderate tensile σmLarger tensile σm
S = stress amplitude
near zero or compressive σmIncreasing
σm
--Method 1: shot peening
put surface
into compression
shot--Method 2: carburizing
C-rich gas
2. Remove stressconcentrators. Adapted from
Fig. 8.25, Callister 7e.
bad
bad
better
better
Adapted fromFig. 8.24, Callister 7e.
Chapter 8 -
Improving Fatigue Life (contd.)
3. Improve Surface Finish-grinding , polishingDesign factor for surface finish uses empirical data /
chart.
Input "surface finish ( abs. roughness, average unevenness)
Output "design factor.
Chapter 8 -
Fatigue Testing
Different ways:
• Axial • Bending- sheet/flat specimen• Rotating Cantilever (bending)• Rotating (4 pt. bending) R.R. Moore• Torsional fatigue

10/4/2016
10
Chapter 8 -
Axial fatigue testing R.R. Moore Fatigue Testing (4 point loading)
Chapter 8 -
This is the Rotating Cantilever Beam Fatigue Tester
Chapter 8 -
CreepSample deformation at a constant stress (σ) vs. time
Adapted fromFig. 8.28, Callister 7e.
Instantaneous deformation:
Primary Creep: slope (creep rate) decreases with time.
Secondary Creep: steady-statei.e., constant slope.
Tertiary Creep: slope (creep rate) increases with time, i.e.acceleration of rate. Tr = time to rupture
σσ,ε
0 t
10/4/2016
11
Chapter 8 -
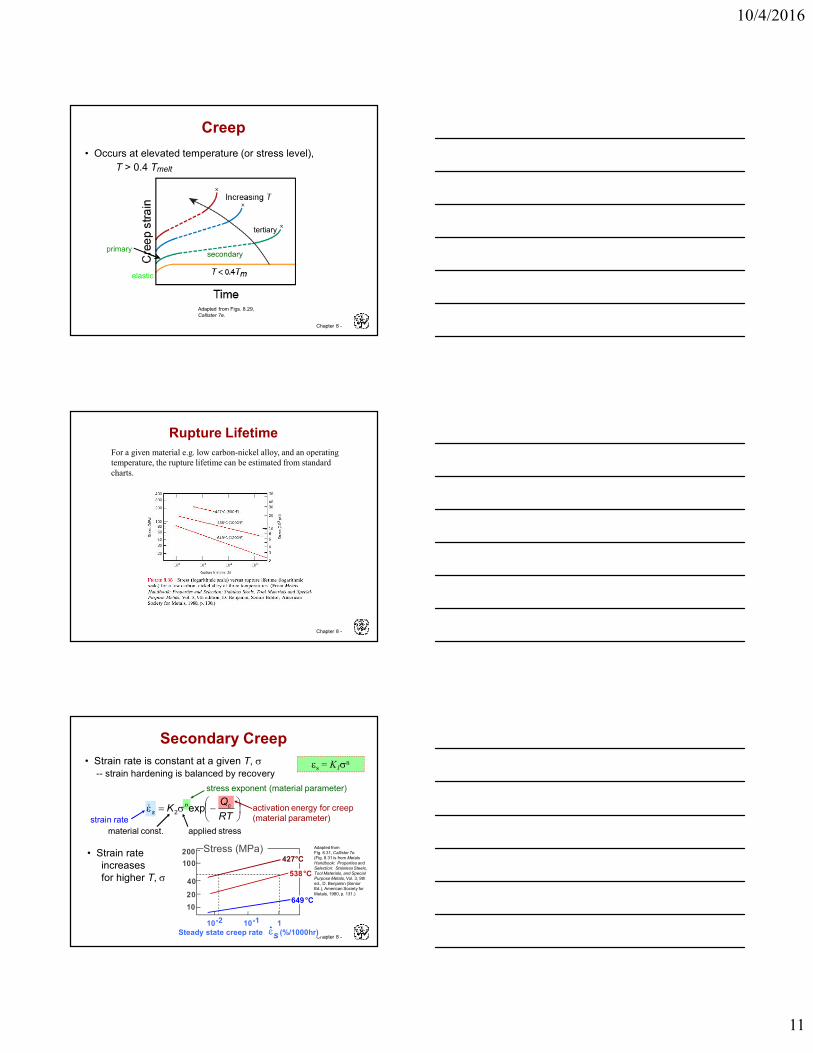
• Occurs at elevated temperature (or stress level), T > 0.4 Tmelt
Adapted from Figs. 8.29, Callister 7e.
Creep
elastic
primarysecondary
tertiary
Chapter 8 -
Rupture LifetimeFor a given material e.g. low carbon-nickel alloy, and an operating temperature, the rupture lifetime can be estimated from standard charts.
Chapter 8 -
• Strain rate is constant at a given T, σ-- strain hardening is balanced by recovery
stress exponent (material parameter)
strain rateactivation energy for creep(material parameter)
applied stressmaterial const.
• Strain rateincreasesfor higher T, σ
102040
100200
10-2 10-1 1Steady state creep rate (%/1000hr)ε s
Stress (MPa)427°C
538°C
649°C
Adapted fromFig. 8.31, Callister 7e.(Fig. 8.31 is from Metals Handbook: Properties and Selection: Stainless Steels, Tool Materials, and Special Purpose Metals, Vol. 3, 9th ed., D. Benjamin (Senior Ed.), American Society for Metals, 1980, p. 131.)
−σ=ε
RTQK cn
s exp2&
Secondary Creepεs = K1σn

10/4/2016
12
Chapter 8 -
Creep Failure-Data Extrapolation• Estimate rupture time
S-590 Iron, T = 800°C, σ = 20 ksi• Failure:
along grain boundaries.
time to failure (rupture)
function ofapplied stress
temperature
L)t(T r =+ log20
appliedstress
g.b. cavities
• Time to rupture, tr
From V.J. Colangelo and F.A. Heiser, Analysis of Metallurgical Failures (2nd ed.), Fig. 4.32, p. 87, John Wiley and Sons, Inc., 1987. (Orig. source: Pergamon Press, Inc.)
L)t(T r =+ log20
1073K
Ans: tr = 233 hr
24x103 K-log hr
Adapted fromFig. 8.32, Callister 7e.(Fig. 8.32 is from F.R. Larson and J. Miller, Trans. ASME, 74, 765 (1952).)
L(103K-log hr)
Stre
ss, k
si
100
10
112 20 24 2816
data for S-590 Iron
20
Larson –Miller Parameter
Chapter 8 -
See page 296
LM Parameter
Example Prob 8D6
Chapter 8 -
8D5
2 stages:
Stage 1: solve for material properties K and n
Stage 2: solve for strain rate

10/4/2016
13
Chapter 8 -
• Engineering materials don't reach theoretical strength.• Flaws produce stress concentrations that cause
premature failure.• Sharp corners produce large stress concentrations
and premature failure.• Failure type depends on T and stress:
- for noncyclic σ and T < 0.4Tm, failure stress decreases with:- increased maximum flaw size,- decreased T,- increased rate of loading.
- for cyclic σ:- cycles to fail decreases as ∆σ increases.
- for higher T (T > 0.4Tm):- time to fail decreases as σ or T increases.
SUMMARY