
Ch 2 Wind - Recinto Universitario de Mayagüez
58
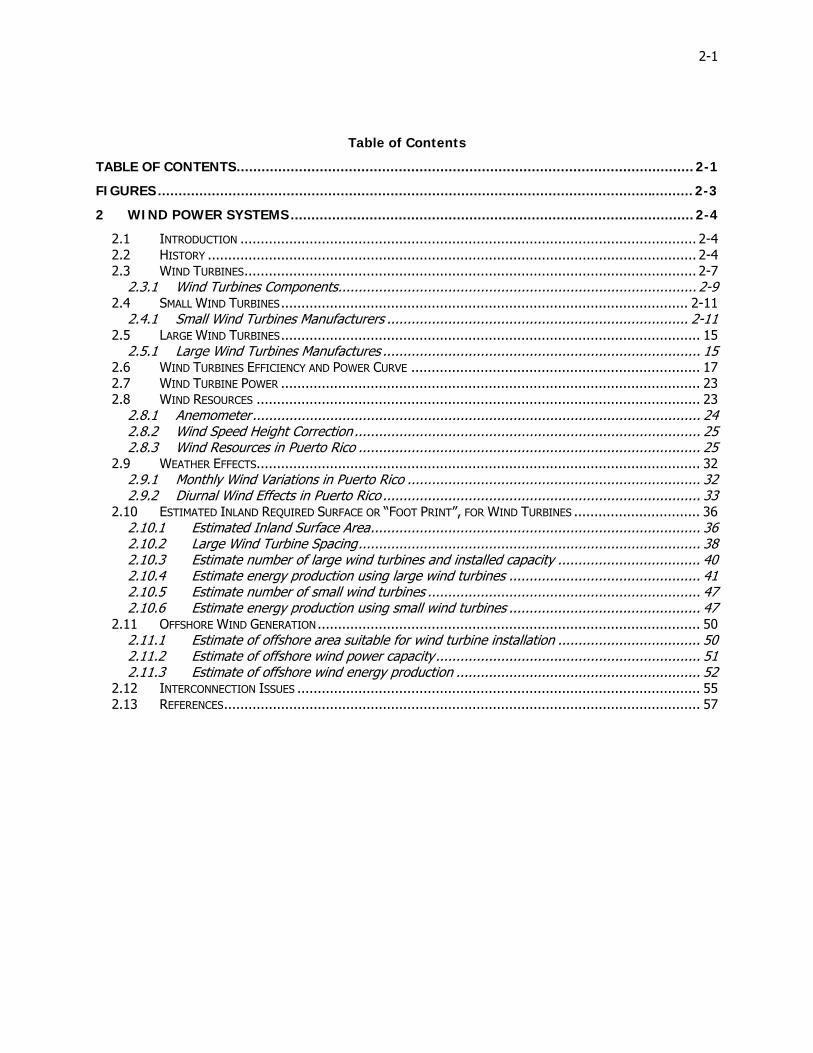
2-1 Table of Contents TABLE OF CONTENTS.............................................................................................................. 2-1 FIGURES ................................................................................................................................. 2-3 2 WIND POWER SYSTEMS ................................................................................................. 2-4 2.1 INTRODUCTION ................................................................................................................ 2-4 2.2 HISTORY ........................................................................................................................ 2-4 2.3 WIND TURBINES............................................................................................................... 2-7 2.3.1 Wind Turbines Components........................................................................................ 2-9 2.4 SMALL WIND TURBINES .................................................................................................... 2-11 2.4.1 Small Wind Turbines Manufacturers .......................................................................... 2-11 2.5 LARGE WIND TURBINES ....................................................................................................... 15 2.5.1 Large Wind Turbines Manufactures .............................................................................. 15 2.6 WIND TURBINES EFFICIENCY AND POWER CURVE ....................................................................... 17 2.7 WIND TURBINE POWER ....................................................................................................... 23 2.8 WIND RESOURCES ............................................................................................................. 23 2.8.1 Anemometer .............................................................................................................. 24 2.8.2 Wind Speed Height Correction ..................................................................................... 25 2.8.3 Wind Resources in Puerto Rico .................................................................................... 25 2.9 WEATHER EFFECTS............................................................................................................. 32 2.9.1 Monthly Wind Variations in Puerto Rico ........................................................................ 32 2.9.2 Diurnal Wind Effects in Puerto Rico .............................................................................. 33 2.10 ESTIMATED INLAND REQUIRED SURFACE OR “FOOT PRINT”, FOR WIND TURBINES ............................... 36 2.10.1 Estimated Inland Surface Area ................................................................................. 36 2.10.2 Large Wind Turbine Spacing .................................................................................... 38 2.10.3 Estimate number of large wind turbines and installed capacity ................................... 40 2.10.4 Estimate energy production using large wind turbines ............................................... 41 2.10.5 Estimate number of small wind turbines ................................................................... 47 2.10.6 Estimate energy production using small wind turbines ............................................... 47 2.11 OFFSHORE WIND GENERATION .............................................................................................. 50 2.11.1 Estimate of offshore area suitable for wind turbine installation ................................... 50 2.11.2 Estimate of offshore wind power capacity ................................................................. 51 2.11.3 Estimate of offshore wind energy production ............................................................ 52 2.12 INTERCONNECTION ISSUES ................................................................................................... 55 2.13 REFERENCES..................................................................................................................... 57
Transcript of Ch 2 Wind - Recinto Universitario de Mayagüez
2-1
Table of Contents TABLE OF CONTENTS .............................................................................................................. 2-1 FIGURES ................................................................................................................................. 2-3 2 WIND POWER SYSTEMS ................................................................................................. 2-4
2.1 INTRODUCTION ................................................................................................................ 2-4 2.2 HISTORY ........................................................................................................................ 2-4 2.3 WIND TURBINES ............................................................................................................... 2-7
2.3.1 Wind Turbines Components ........................................................................................ 2-9 2.4 SMALL WIND TURBINES .................................................................................................... 2-11
2.4.1 Small Wind Turbines Manufacturers .......................................................................... 2-11 2.5 LARGE WIND TURBINES ....................................................................................................... 15
2.5.1 Large Wind Turbines Manufactures .............................................................................. 15 2.6 WIND TURBINES EFFICIENCY AND POWER CURVE ....................................................................... 17 2.7 WIND TURBINE POWER ....................................................................................................... 23 2.8 WIND RESOURCES ............................................................................................................. 23
2.8.1 Anemometer .............................................................................................................. 24 2.8.2 Wind Speed Height Correction ..................................................................................... 25 2.8.3 Wind Resources in Puerto Rico .................................................................................... 25
2.9 WEATHER EFFECTS ............................................................................................................. 32 2.9.1 Monthly Wind Variations in Puerto Rico ........................................................................ 32 2.9.2 Diurnal Wind Effects in Puerto Rico .............................................................................. 33
2.10 ESTIMATED INLAND REQUIRED SURFACE OR “FOOT PRINT”, FOR WIND TURBINES ............................... 36 2.10.1 Estimated Inland Surface Area ................................................................................. 36 2.10.2 Large Wind Turbine Spacing .................................................................................... 38 2.10.3 Estimate number of large wind turbines and installed capacity ................................... 40 2.10.4 Estimate energy production using large wind turbines ............................................... 41 2.10.5 Estimate number of small wind turbines ................................................................... 47 2.10.6 Estimate energy production using small wind turbines ............................................... 47
2.11 OFFSHORE WIND GENERATION .............................................................................................. 50 2.11.1 Estimate of offshore area suitable for wind turbine installation ................................... 50 2.11.2 Estimate of offshore wind power capacity ................................................................. 51 2.11.3 Estimate of offshore wind energy production ............................................................ 52
2.12 INTERCONNECTION ISSUES ................................................................................................... 55 2.13 REFERENCES ..................................................................................................................... 57
2-2
Tables
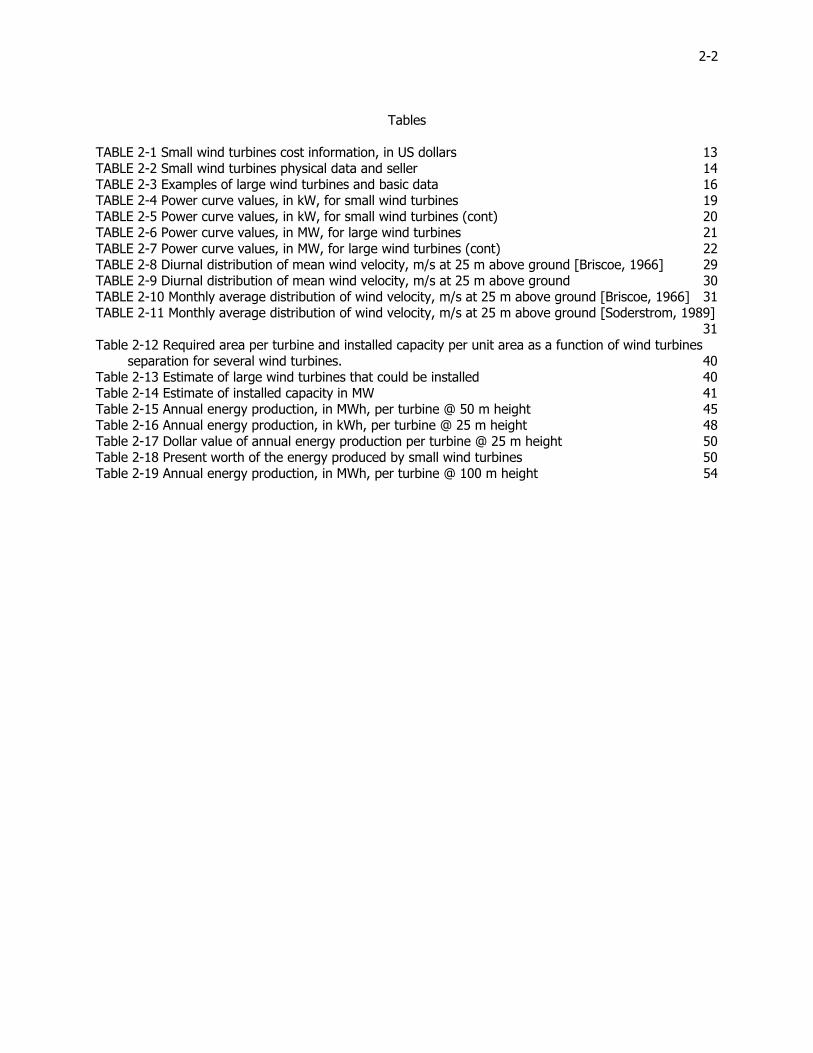
TABLE 2-1 Small wind turbines cost information, in US dollars 13 TABLE 2-2 Small wind turbines physical data and seller 14 TABLE 2-3 Examples of large wind turbines and basic data 16 TABLE 2-4 Power curve values, in kW, for small wind turbines 19 TABLE 2-5 Power curve values, in kW, for small wind turbines (cont) 20 TABLE 2-6 Power curve values, in MW, for large wind turbines 21 TABLE 2-7 Power curve values, in MW, for large wind turbines (cont) 22 TABLE 2-8 Diurnal distribution of mean wind velocity, m/s at 25 m above ground [Briscoe, 1966] 29 TABLE 2-9 Diurnal distribution of mean wind velocity, m/s at 25 m above ground 30 TABLE 2-10 Monthly average distribution of wind velocity, m/s at 25 m above ground [Briscoe, 1966] 31 TABLE 2-11 Monthly average distribution of wind velocity, m/s at 25 m above ground [Soderstrom, 1989]
31 Table 2-12 Required area per turbine and installed capacity per unit area as a function of wind turbines
separation for several wind turbines. 40 Table 2-13 Estimate of large wind turbines that could be installed 40 Table 2-14 Estimate of installed capacity in MW 41 Table 2-15 Annual energy production, in MWh, per turbine @ 50 m height 45 Table 2-16 Annual energy production, in kWh, per turbine @ 25 m height 48 Table 2-17 Dollar value of annual energy production per turbine @ 25 m height 50 Table 2-18 Present worth of the energy produced by small wind turbines 50 Table 2-19 Annual energy production, in MWh, per turbine @ 100 m height 54
2-3
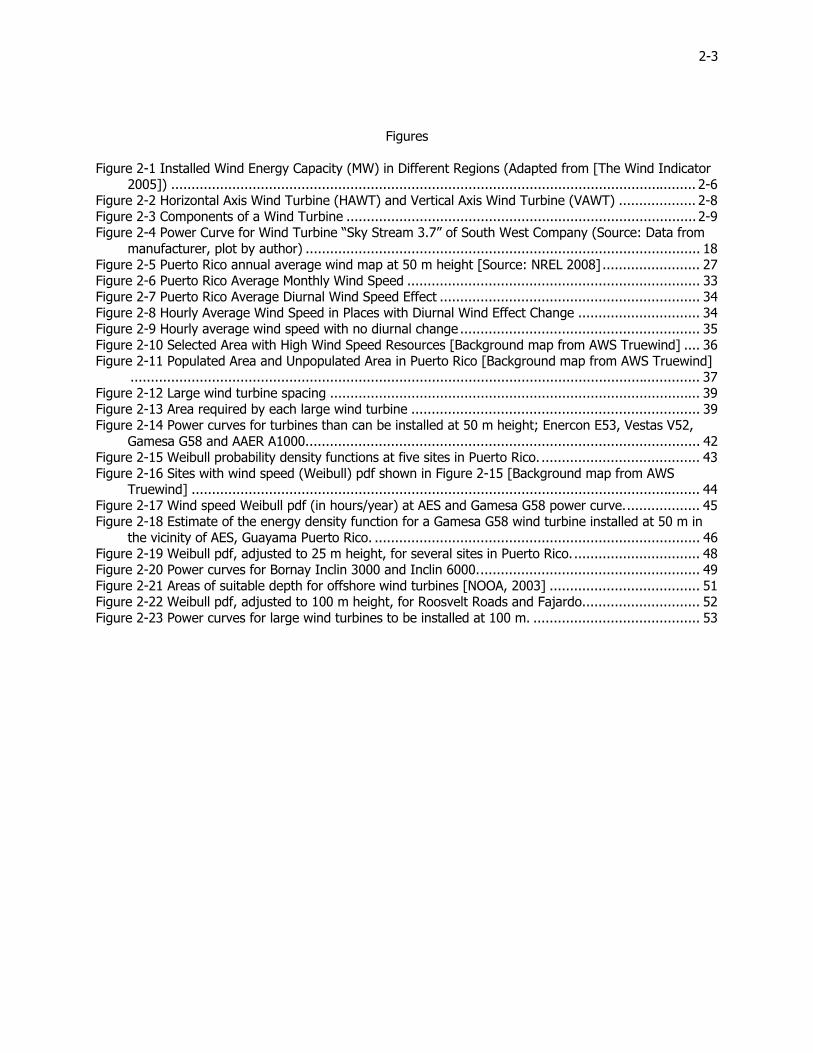
Figures Figure 2-1 Installed Wind Energy Capacity (MW) in Different Regions (Adapted from [The Wind Indicator
2005]) ................................................................................................................................. 2-6 Figure 2-2 Horizontal Axis Wind Turbine (HAWT) and Vertical Axis Wind Turbine (VAWT) ................... 2-8 Figure 2-3 Components of a Wind Turbine ...................................................................................... 2-9 Figure 2-4 Power Curve for Wind Turbine “Sky Stream 3.7” of South West Company (Source: Data from
manufacturer, plot by author) ................................................................................................. 18 Figure 2-5 Puerto Rico annual average wind map at 50 m height [Source: NREL 2008] ........................ 27 Figure 2-6 Puerto Rico Average Monthly Wind Speed ........................................................................ 33 Figure 2-7 Puerto Rico Average Diurnal Wind Speed Effect ................................................................ 34 Figure 2-8 Hourly Average Wind Speed in Places with Diurnal Wind Effect Change .............................. 34 Figure 2-9 Hourly average wind speed with no diurnal change ........................................................... 35 Figure 2-10 Selected Area with High Wind Speed Resources [Background map from AWS Truewind] .... 36 Figure 2-11 Populated Area and Unpopulated Area in Puerto Rico [Background map from AWS Truewind]
............................................................................................................................................ 37 Figure 2-12 Large wind turbine spacing ........................................................................................... 39 Figure 2-13 Area required by each large wind turbine ....................................................................... 39 Figure 2-14 Power curves for turbines than can be installed at 50 m height; Enercon E53, Vestas V52,
Gamesa G58 and AAER A1000. ................................................................................................ 42 Figure 2-15 Weibull probability density functions at five sites in Puerto Rico. ....................................... 43 Figure 2-16 Sites with wind speed (Weibull) pdf shown in Figure 2-15 [Background map from AWS
Truewind] ............................................................................................................................. 44 Figure 2-17 Wind speed Weibull pdf (in hours/year) at AES and Gamesa G58 power curve. .................. 45 Figure 2-18 Estimate of the energy density function for a Gamesa G58 wind turbine installed at 50 m in
the vicinity of AES, Guayama Puerto Rico. ................................................................................ 46 Figure 2-19 Weibull pdf, adjusted to 25 m height, for several sites in Puerto Rico. ............................... 48 Figure 2-20 Power curves for Bornay Inclin 3000 and Inclin 6000. ...................................................... 49 Figure 2-21 Areas of suitable depth for offshore wind turbines [NOOA, 2003] ..................................... 51 Figure 2-22 Weibull pdf, adjusted to 100 m height, for Roosvelt Roads and Fajardo. ............................ 52 Figure 2-23 Power curves for large wind turbines to be installed at 100 m. ......................................... 53
2-4
2 WIND POWER SYSTEMS 2.1 Introduction
Wind is the movement of air caused by the irregular heating of the Earth's surface. It
happens at all scales, from local breezes created by heating of land surfaces that lasts
some minutes, to global winds caused from solar heating of the Earth. Wind power is
the transformation of wind energy into more utile forms, typically electricity using wind
turbines [Gipe, 2004].
2.2 History
The first use of wind power was to make possible the sailing of ships in the Nile River
some 5000 years ago. Many civilizations used wind power for transportation and other
applications. The Europeans used it to crush grains and pump water in the 1700s and
1800s. The first wind mill to generated electricity in the rural U.S. was installed in 1890
[Patel 2006]. However, for much of the twentieth century there was small interest in
using wind energy other than for battery charging for distant dwellings. These low-
power systems were quickly replaced once the electricity grid became available. The
sudden increases in the price of oil in 1973 stimulated a number of substantial

2-5
Government-funded programs for research, development and demonstrations of wind
turbines and other alternative energy technologies.
In the United States this led to the construction of a series of prototype turbines
starting with the 38 diameter 100kW Mod-0 in 1975 and culminating in the 97.5m
diameter 2.5MW Mod-5B in 1987. Similar programs were pursued in the UK, Germany
and Sweden [Burton et al. 2001]. Today, even larger wind turbines are being
constructed such as 5MW units. Wind generated electricity is the fastest renewable
growing energy business sector [Gipe, 2004].
Growth in the use of larger wind turbines, has made small wind turbines increasingly
attractive for small applications such as, powering homes and farms. Wind power has
become a very attractive renewable energy source because it is cheaper than other
technologies and is also compatible with environmental preservation. To provide the
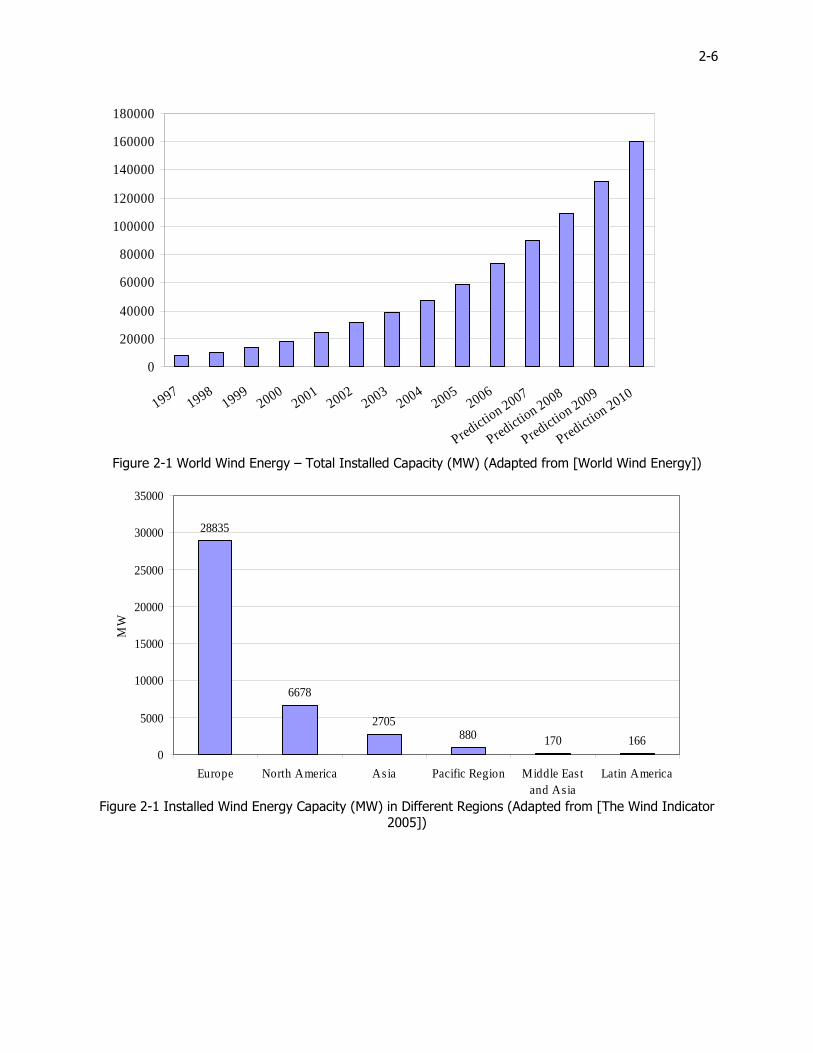
reader with an idea of how has been the growth in wind energy, the installed capacity
of wind has increased by a factor of 4.2 during the last five years [Mathew 2006]. The
total global installed capacity of wind power systems in 2006 is approximately
73,904MW. Figure 2.1 [World Wind Energy 2007] shows the total installed in the last
few years and provide a prediction for 2010. Figure 2.2 [The wind indicator 2005]
shows the total wind power installed in different parts of the world.
2-6
0
20000
40000
60000
80000
100000
120000
140000
160000
180000
19971998
19992000
20012002
20032004
20052006
Prediction 2007
Prediction 2008
Prediction 2009
Prediction 2010
Figure 2-1 World Wind Energy – Total Installed Capacity (MW) (Adapted from [World Wind Energy])
28835
6678
2705880 170 166
0
5000
10000
15000
20000
25000
30000
35000
Europe North America Asia Pacific Region Middle Eas tand Asia
Latin America
MW
Figure 2-1 Installed Wind Energy Capacity (MW) in Different Regions (Adapted from [The Wind Indicator
2005])
2-7
2.3 Wind Turbines
A wind turbine is a machine that converts the kinetic energy from the wind into
mechanical energy. If the mechanical energy is used directly by machinery, such as a
pump or grinding stones, the machine is usually called a windmill. If the mechanical
energy is then converted to electricity, the machine is called a wind generator [Gipe,
2004].
The modern wind turbine is a sophisticated piece of machinery with aerodynamically
designed rotor and efficient power generation, transmission and regulation components.
The size of these turbines ranges from a few Watts (Small Wind Turbines) to several
Million Watts (Large Wind Turbines).
The modern trend in the wind industry is to go for bigger units of several MW capacity
in places where the wind is favorable, as the system scaling up can reduce the unit cost
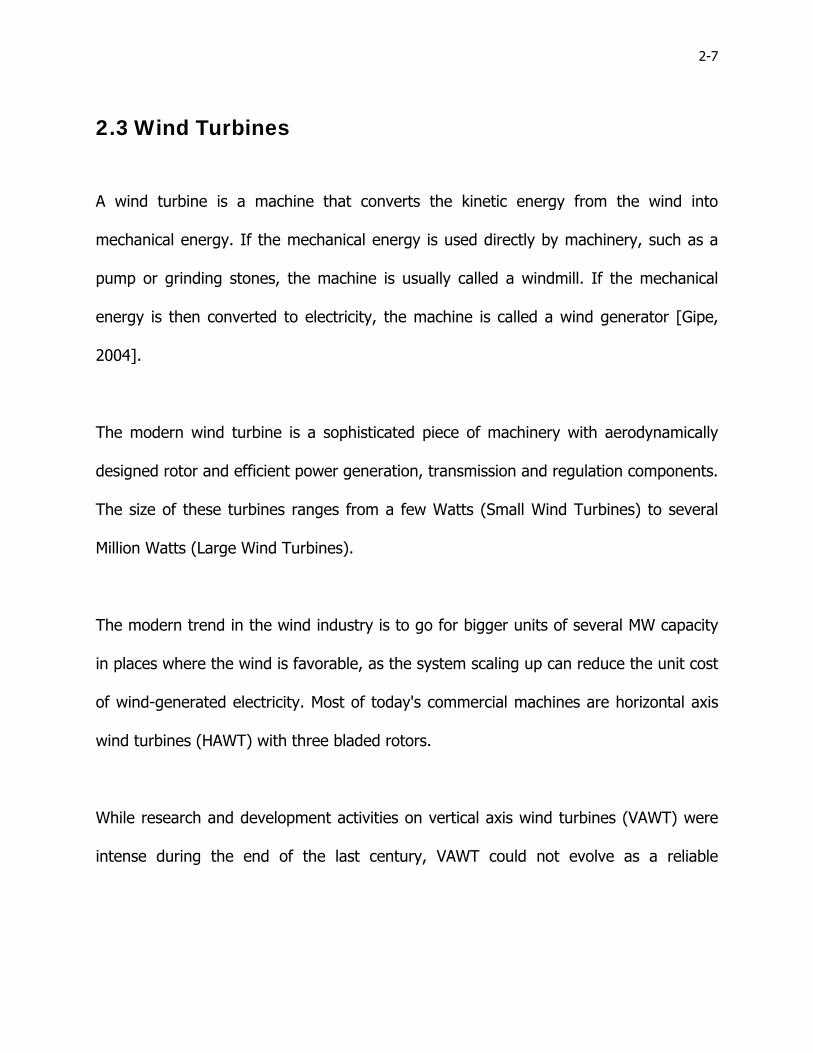
of wind-generated electricity. Most of today's commercial machines are horizontal axis
wind turbines (HAWT) with three bladed rotors.
While research and development activities on vertical axis wind turbines (VAWT) were
intense during the end of the last century, VAWT could not evolve as a reliable
2-8
alternative to the horizontal axis machines [Mathew 2006]. Figure 2.3 shows the typical
vertical and horizontal wind turbines.
Figure 2-2 Horizontal Axis Wind Turbine (HAWT) and Vertical Axis Wind Turbine (VAWT)
2-9
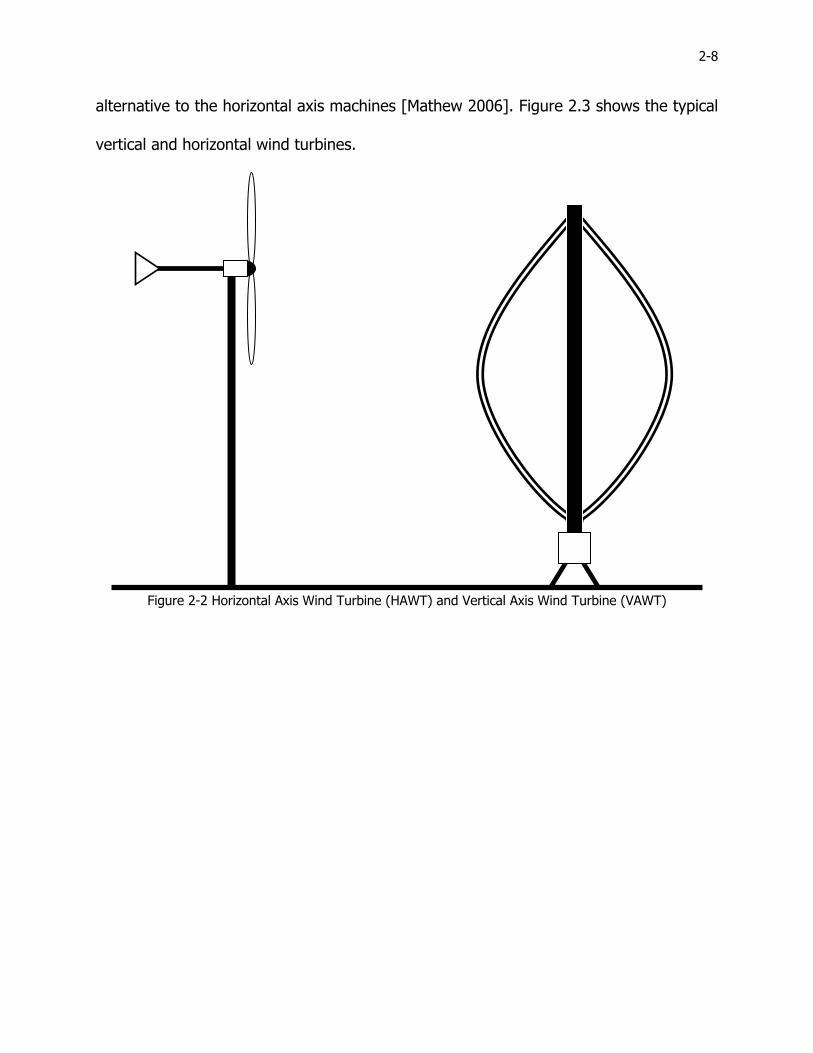
2.3.1 Wind Turbines Components The basic components for horizontal axis wind turbine are shown on Figure 2-3
Components of a Wind Turbine.
Figure 2-3 Components of a Wind Turbine
• Rotor/blades – The blades together with the hub are called the rotor. The rotor
drives the generator by harnessing the kinetic energy in the wind. The blades are
aerodynamically shaped to best capture the wind. The amount of energy a turbine can
capture is proportional to the rotor sweep area. The blades are usually made of
fiberglass, metal, reinforced plastic or wood.
• Generator/Alternator – Is the part of the turbine that produces electricity from
the kinetic energy captured by the rotor. A generator produces Direct Current (DC)
Tail vane
Nacelle
Generator Alternator
Gearbox
Rotor/Blades
Tower
2-10
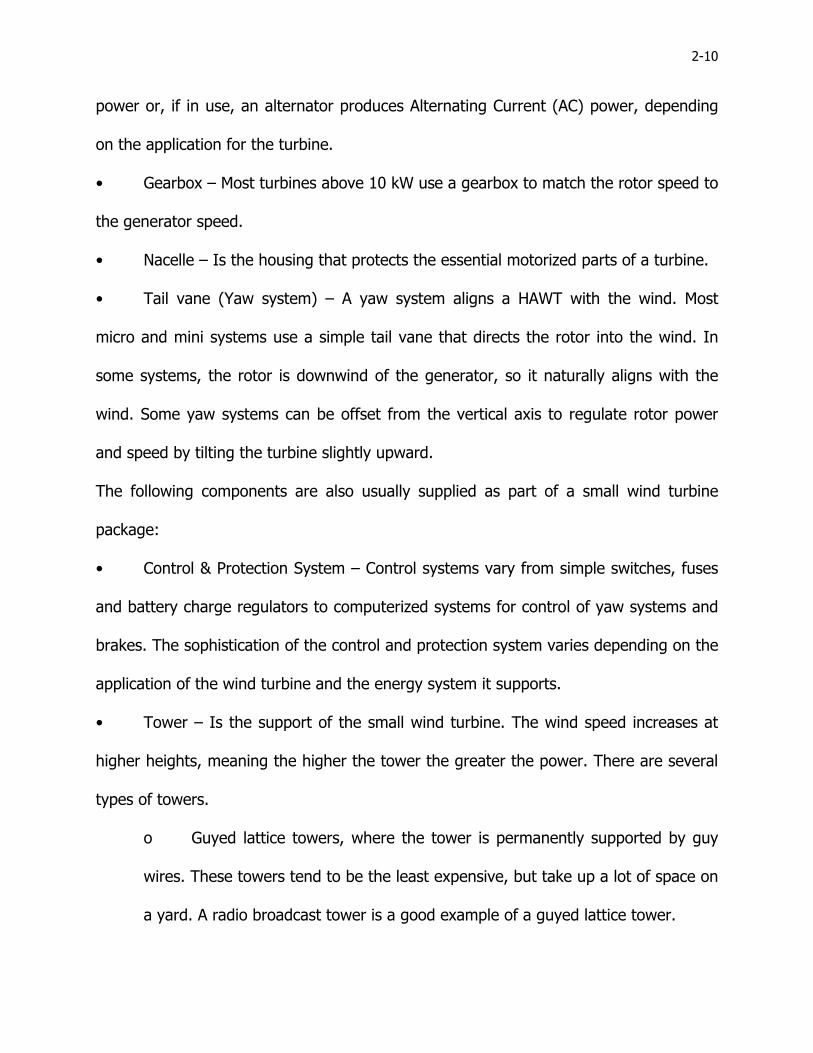
power or, if in use, an alternator produces Alternating Current (AC) power, depending
on the application for the turbine.
• Gearbox – Most turbines above 10 kW use a gearbox to match the rotor speed to
the generator speed.
• Nacelle – Is the housing that protects the essential motorized parts of a turbine.
• Tail vane (Yaw system) – A yaw system aligns a HAWT with the wind. Most
micro and mini systems use a simple tail vane that directs the rotor into the wind. In
some systems, the rotor is downwind of the generator, so it naturally aligns with the
wind. Some yaw systems can be offset from the vertical axis to regulate rotor power
and speed by tilting the turbine slightly upward.
The following components are also usually supplied as part of a small wind turbine
package:
• Control & Protection System – Control systems vary from simple switches, fuses
and battery charge regulators to computerized systems for control of yaw systems and
brakes. The sophistication of the control and protection system varies depending on the
application of the wind turbine and the energy system it supports.
• Tower – Is the support of the small wind turbine. The wind speed increases at
higher heights, meaning the higher the tower the greater the power. There are several
types of towers.
o Guyed lattice towers, where the tower is permanently supported by guy
wires. These towers tend to be the least expensive, but take up a lot of space on
a yard. A radio broadcast tower is a good example of a guyed lattice tower.
2-11
o Guyed tilt-up towers, which can be raised and lowered for easy
maintenance and repair.
o Self-supporting towers, which do not have any guy wires. These towers
tend to be the heaviest and most expensive, but because they do not require
guy wires, they do not take up as much space on a yard.
2.4 Small Wind Turbines Small wind turbines are typically used for powering houses, farms and remote locations
that usually consume less than 50 kW of total capacity. For use these small turbines
there must be enough wind, tall towers are allowed in the neighborhood or rural area,
there enough space, the noise level of the turbine is approved and know how much
electricity want to produce.
2.4.1 Small Wind Turbines Manufacturers
Today there are more than fifty manufactures of small wind turbines worldwide, and
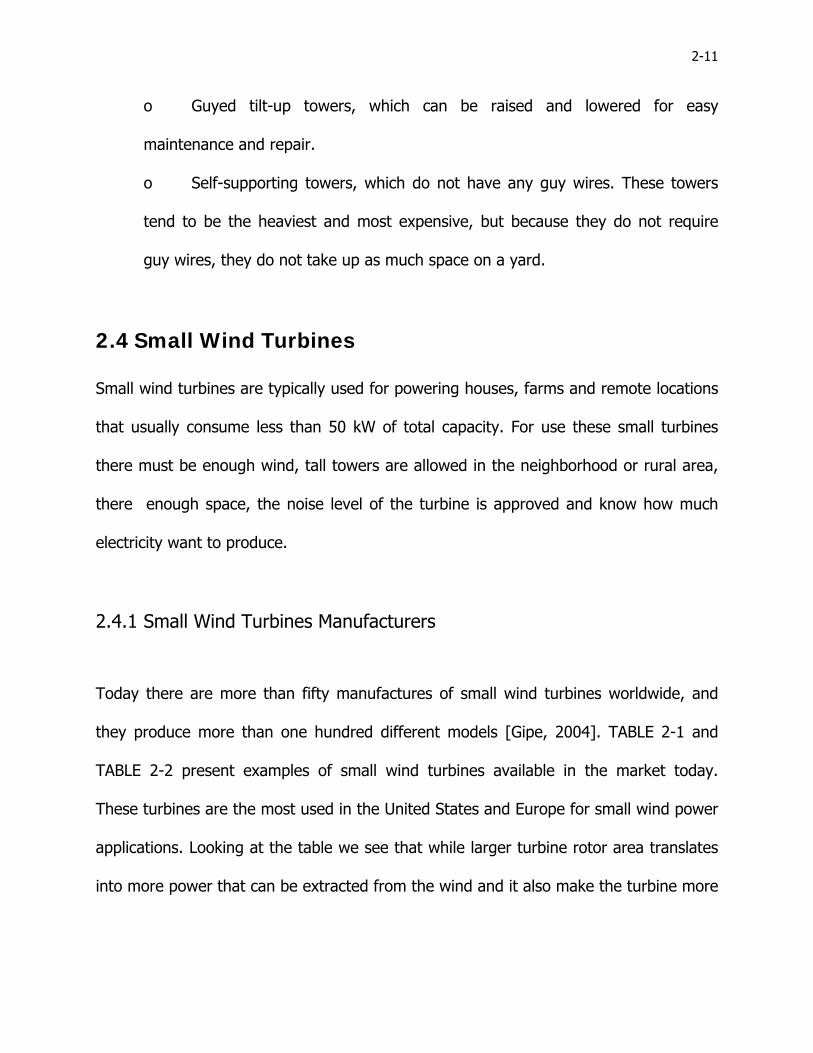
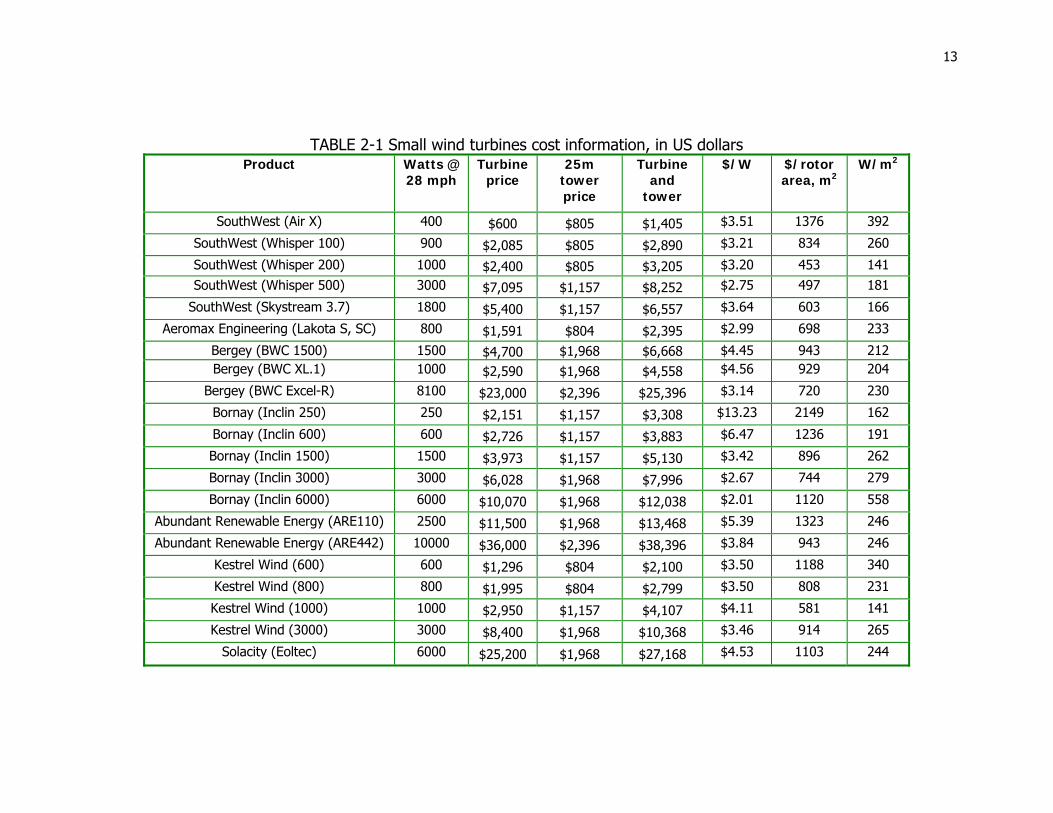
they produce more than one hundred different models [Gipe, 2004]. TABLE 2-1 and
TABLE 2-2 present examples of small wind turbines available in the market today.
These turbines are the most used in the United States and Europe for small wind power
applications. Looking at the table we see that while larger turbine rotor area translates
into more power that can be extracted from the wind and it also make the turbine more

2-12
expensive. We selected a 25m tower to be used with all turbines. The prices were
obtained from different manufactures in the internet during January 2008.
13
TABLE 2-1 Small wind turbines cost information, in US dollars Product Watts @
28 mph Turbine
price 25m
tower price
Turbine and
tower
$/W $/rotor area, m2
W/m2
SouthWest (Air X) 400 $600 $805 $1,405 $3.51 1376 392
SouthWest (Whisper 100) 900 $2,085 $805 $2,890 $3.21 834 260
SouthWest (Whisper 200) 1000 $2,400 $805 $3,205 $3.20 453 141 SouthWest (Whisper 500) 3000 $7,095 $1,157 $8,252 $2.75 497 181
SouthWest (Skystream 3.7) 1800 $5,400 $1,157 $6,557 $3.64 603 166
Aeromax Engineering (Lakota S, SC) 800 $1,591 $804 $2,395 $2.99 698 233
Bergey (BWC 1500) 1500 $4,700 $1,968 $6,668 $4.45 943 212 Bergey (BWC XL.1) 1000 $2,590 $1,968 $4,558 $4.56 929 204
Bergey (BWC Excel-R) 8100 $23,000 $2,396 $25,396 $3.14 720 230
Bornay (Inclin 250) 250 $2,151 $1,157 $3,308 $13.23 2149 162
Bornay (Inclin 600) 600 $2,726 $1,157 $3,883 $6.47 1236 191
Bornay (Inclin 1500) 1500 $3,973 $1,157 $5,130 $3.42 896 262
Bornay (Inclin 3000) 3000 $6,028 $1,968 $7,996 $2.67 744 279
Bornay (Inclin 6000) 6000 $10,070 $1,968 $12,038 $2.01 1120 558
Abundant Renewable Energy (ARE110) 2500 $11,500 $1,968 $13,468 $5.39 1323 246
Abundant Renewable Energy (ARE442) 10000 $36,000 $2,396 $38,396 $3.84 943 246
Kestrel Wind (600) 600 $1,296 $804 $2,100 $3.50 1188 340
Kestrel Wind (800) 800 $1,995 $804 $2,799 $3.50 808 231
Kestrel Wind (1000) 1000 $2,950 $1,157 $4,107 $4.11 581 141
Kestrel Wind (3000) 3000 $8,400 $1,968 $10,368 $3.46 914 265
Solacity (Eoltec) 6000 $25,200 $1,968 $27,168 $4.53 1103 244
14
TABLE 2-2 Small wind turbines physical data and seller
Product Rotor Diameter
(m)
Rotor Area (m²)
Weigh lb
Voltage V
Seller
SouthWest (Air X) 1.14 1.02 13 12, 24, 48 Vdc Alt En Store
SouthWest (Whisper 100) 2.1 3.46 47 12, 24, 48 Vdc Infinigy
SouthWest (Whisper 200) 3 7.07 65 12, 24, 48 Vdc 230 Vac Gaiam
SouthWest (Whisper 500) 4.6 16.62 155 12, 24, 48 Vdc 230 Vac Alt En Store
SouthWest (Skystream 3.7) 3.72 10.87 154 120/240 AC Southwest
Aeromax Engineering (Lakota S, SC) 2.09 3.43 35 12, 24, 48 Vdc Aeromax Engineering
Bergey (BWC 1500) 3 7.07 168 12, 24, 36, 48, 120 Vdc Alter System
Bergey (BWC XL.1) 2.5 4.91 75 24, 48 Vdc Alter System
Bergey (BWC Excel-R) 6.7 35.26 1050 48 Vdc 120Ac 240Ac Alt En Store
Bornay (Inclin 250) 1.4 1.54 93 12, 24, 48, 220 Vdc Bornay
Bornay (Inclin 600) 2 3.14 93 12, 24, 48, 220 Vdc Bornay
Bornay (Inclin 1500) 2.7 5.73 93 12, 24, 48, 220 Vdc Bornay
Bornay (Inclin 3000) 3.7 10.75 276 12, 24, 48, 220 Vdc Bornay
Bornay (Inclin 6000) 3.7 10.75 342 12, 24, 48, 220 Vdc Bornay
Abundant Renewable Energy (ARE110) 3.6 10.18 315 48Vdc ARE
Abundant Renewable Energy (ARE442) 7.2 40.72 1350 48Vdc ARE
Kestrel Wind (600) 1.5 1.77 44 12, 24, 48, 220 Vdc www.kestrelwind.co.za
Kestrel Wind (800) 2.1 3.46 66.1 12, 24, 48, 220 Vdc www.kestrelwind.co.za
Kestrel Wind (1000) 3 7.07 88 12, 24, 48, 220 Vdc www.kestrelwind.co.za
Kestrel Wind (3000) 3.8 11.34 397 24, 48, 220 Vdc www.kestrelwind.co.za
Solacity (Eoltec) 5.6 24.63 450 3 phase AC Solacity.com
15
2.5 Large Wind Turbines
Large wind turbines are typically used to sell power to electric utilities. Their power
ranges from 100 kW up to 5 MW. For use these large turbines there must be enough
wind, tall towers are allowed in the neighborhood or rural area, there enough space,
the noise level of the turbine is approved and know how much electricity want to
produce.
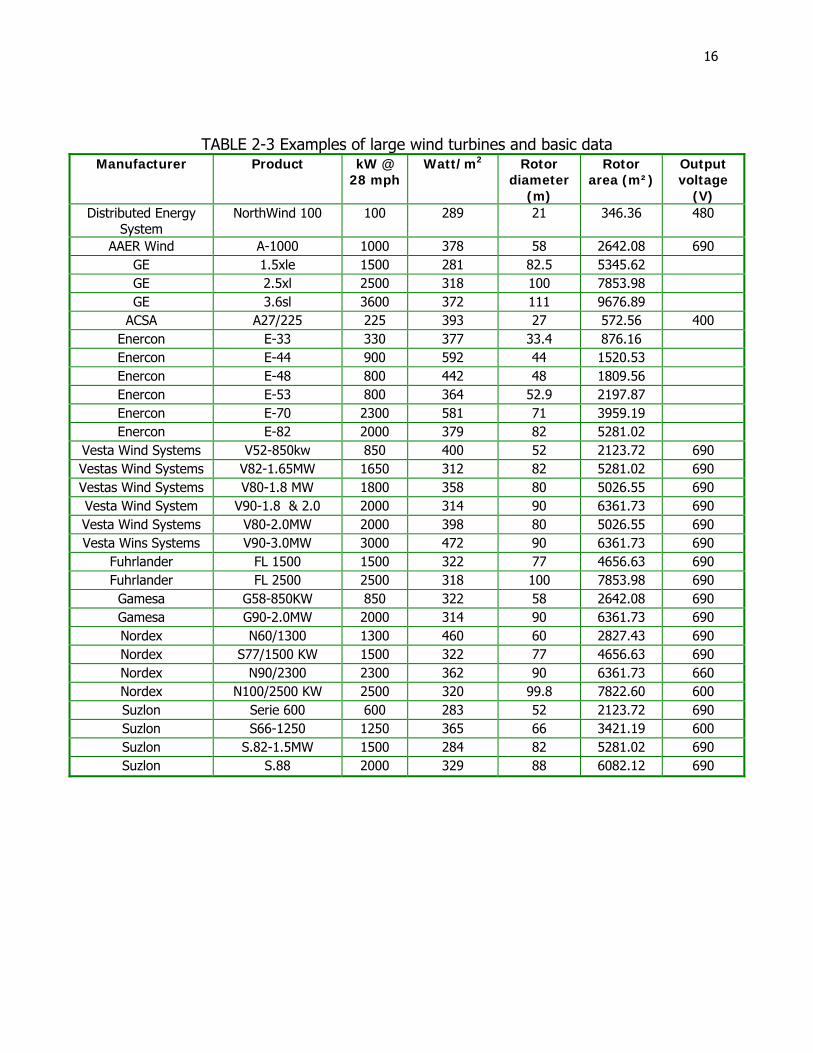
2.5.1 Large Wind Turbines Manufactures
TABLE 2-3 presents examples of large wind turbines available in the market today.
These turbines are the most used in the United States and Europe for large wind power
applications. From TABLE 2-3 see that while larger turbine rotor area translates into
more power that can be extracted from the wind and it also make the turbine more
expensive. Installed cost of these turbines ranges between 1 and 1.4 dollars per
installed W. Typical costs of operation and maintenance are in the $0.01 per kWh
generated.
16
TABLE 2-3 Examples of large wind turbines and basic data Manufacturer Product kW @
28 mphWatt/m2 Rotor
diameter (m)
Rotor area (m²)
Output voltage
(V) Distributed Energy
System NorthWind 100 100 289 21 346.36 480
AAER Wind A-1000 1000 378 58 2642.08 690 GE 1.5xle 1500 281 82.5 5345.62 GE 2.5xl 2500 318 100 7853.98 GE 3.6sl 3600 372 111 9676.89
ACSA A27/225 225 393 27 572.56 400 Enercon E-33 330 377 33.4 876.16 Enercon E-44 900 592 44 1520.53 Enercon E-48 800 442 48 1809.56 Enercon E-53 800 364 52.9 2197.87 Enercon E-70 2300 581 71 3959.19 Enercon E-82 2000 379 82 5281.02
Vesta Wind Systems V52-850kw 850 400 52 2123.72 690 Vestas Wind Systems V82-1.65MW 1650 312 82 5281.02 690 Vestas Wind Systems V80-1.8 MW 1800 358 80 5026.55 690 Vesta Wind System V90-1.8 & 2.0 2000 314 90 6361.73 690 Vesta Wind Systems V80-2.0MW 2000 398 80 5026.55 690 Vesta Wins Systems V90-3.0MW 3000 472 90 6361.73 690
Fuhrlander FL 1500 1500 322 77 4656.63 690 Fuhrlander FL 2500 2500 318 100 7853.98 690 Gamesa G58-850KW 850 322 58 2642.08 690 Gamesa G90-2.0MW 2000 314 90 6361.73 690 Nordex N60/1300 1300 460 60 2827.43 690 Nordex S77/1500 KW 1500 322 77 4656.63 690 Nordex N90/2300 2300 362 90 6361.73 660 Nordex N100/2500 KW 2500 320 99.8 7822.60 600 Suzlon Serie 600 600 283 52 2123.72 690 Suzlon S66-1250 1250 365 66 3421.19 600 Suzlon S.82-1.5MW 1500 284 82 5281.02 690 Suzlon S.88 2000 329 88 6082.12 690
17
2.6 Wind Turbines Efficiency and Power Curve
The theoretical limit of power extraction from wind, or any other fluid was derived by
the German aerodynamicist Albert Betz. Betz law, [Betz, 1966], states that 59% or less
of the kinetic energy in the wind can be transformed to mechanical energy using a wind
turbine.
In practice, wind turbines rotors deliver much less than Betz limit. The factors that
affect the efficiency of a turbine are the turbine rotor, transmission and the generator.
Normally the turbine rotors have efficiencies between 40 to 50%. Gearbox and
generator efficiencies can be estimated to be around 80% to 90%. Also efficiency of a
turbine is not constant. It varies with wind speeds. Many companies do not provide
their wind turbine efficiencies. Instead they provide a power curve.
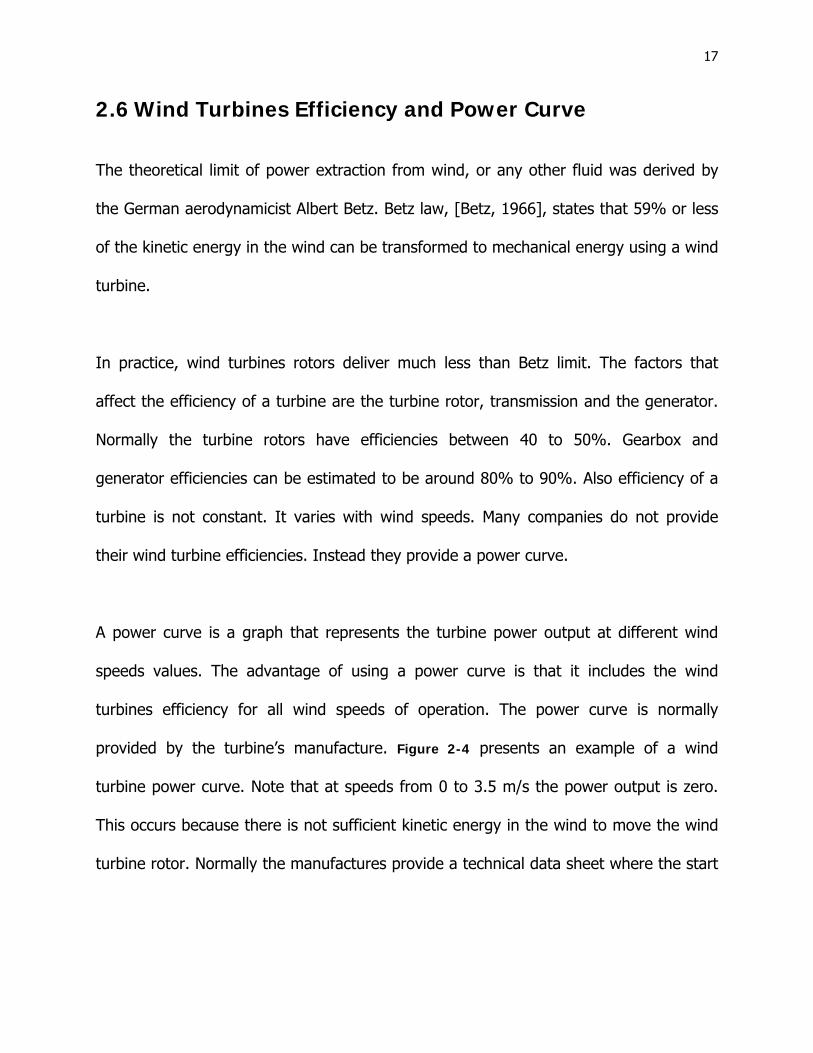
A power curve is a graph that represents the turbine power output at different wind
speeds values. The advantage of using a power curve is that it includes the wind
turbines efficiency for all wind speeds of operation. The power curve is normally
provided by the turbine’s manufacture. Figure 2-4 presents an example of a wind
turbine power curve. Note that at speeds from 0 to 3.5 m/s the power output is zero.
This occurs because there is not sufficient kinetic energy in the wind to move the wind
turbine rotor. Normally the manufactures provide a technical data sheet where the start

18
up wind speed of the turbine is given. In general lower start up wind speeds result in
higher energy coming from the turbine.
-0.5
0
0.5
1
1.5
2
0 5 10 15 20 25 30
Wind Speed (m/s)
Pow
er O
utpu
t (kW
)
Figure 2-4 Power Curve for Wind Turbine “Sky Stream 3.7” of South West Company (Source: Data from
manufacturer, plot by author)
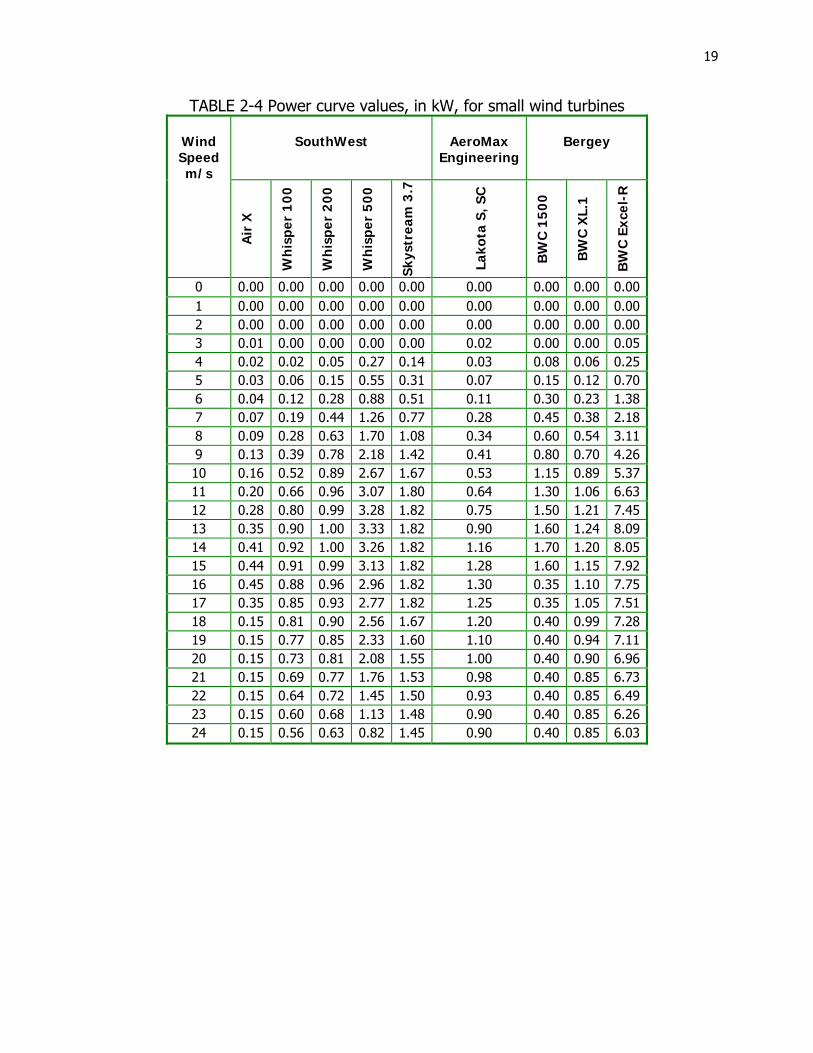
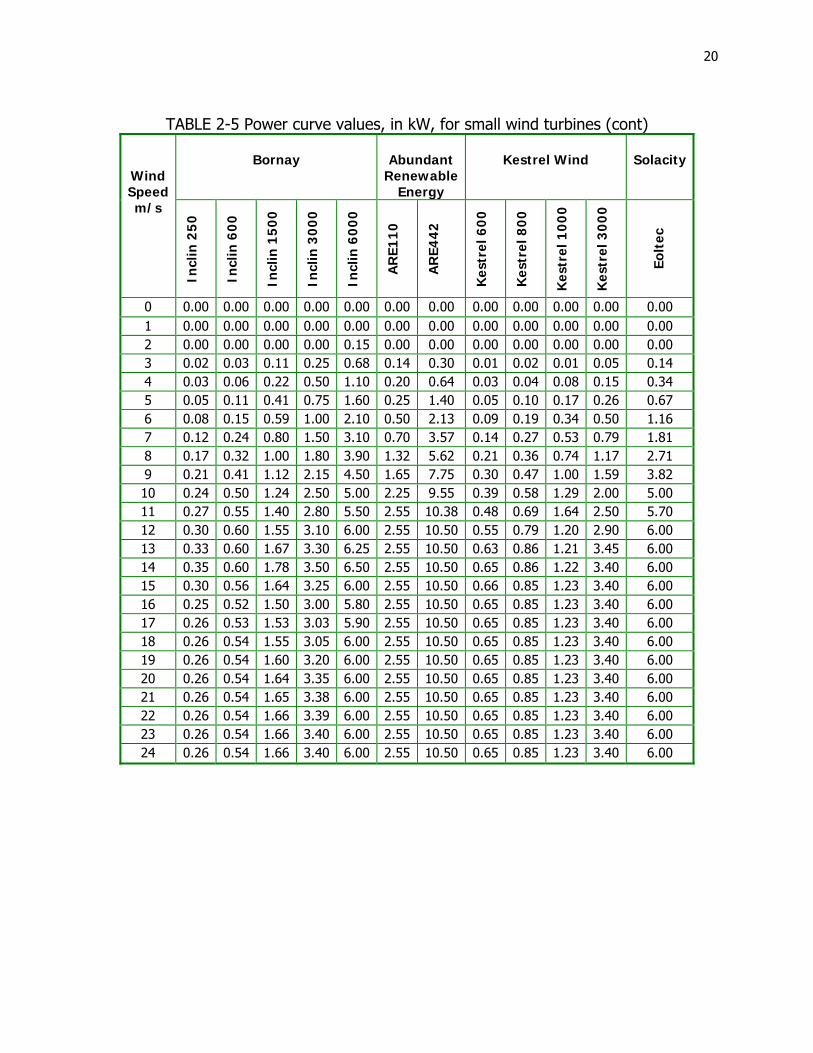
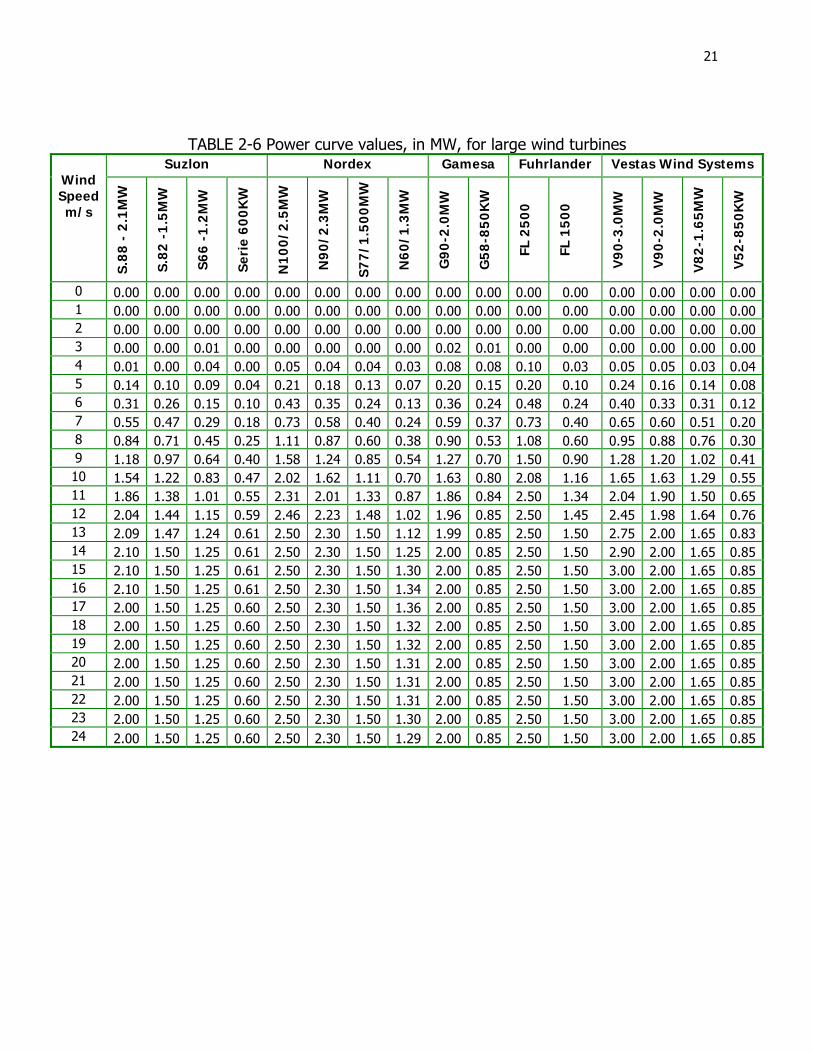
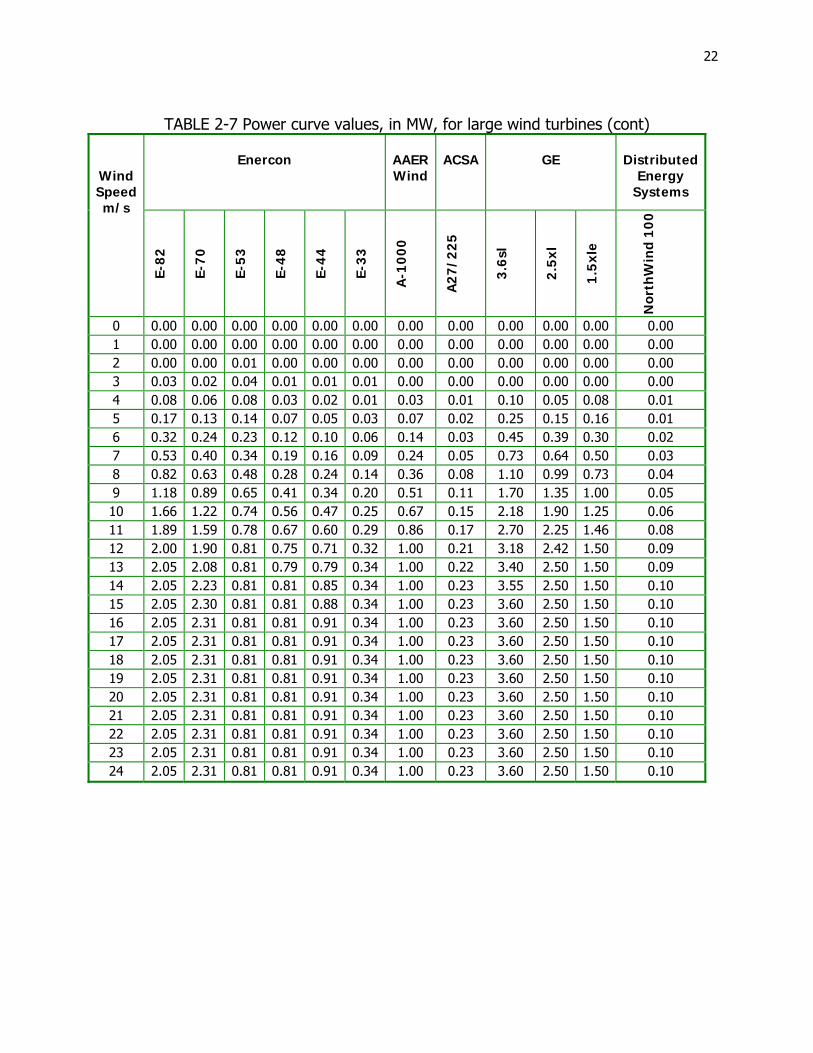
A manufacturer may also show the power curve information in table format. The table
provides the exact value of power at different wind speed. The power curve is then
obtained by plotting the table values. TABLE 2-4 and TABLE 2-5 present the power
curve data for different small turbines. TABLE 2-6 and TABLE 2-7 present the power
curve data for different large turbines.
19
TABLE 2-4 Power curve values, in kW, for small wind turbines
Wind Speed m/s
SouthWest
AeroMax
Engineering
Bergey
Air
X
Wh
ispe
r 10
0
Wh
ispe
r 20
0
Wh
ispe
r 50
0
Skys
trea
m 3
.7
La
kota
S, S
C
BW
C 1
500
BW
C X
L.1
BW
C E
xcel
-R
0 0.00 0.00 0.00 0.00 0.00 0.00 0.00 0.00 0.00 1 0.00 0.00 0.00 0.00 0.00 0.00 0.00 0.00 0.00 2 0.00 0.00 0.00 0.00 0.00 0.00 0.00 0.00 0.00 3 0.01 0.00 0.00 0.00 0.00 0.02 0.00 0.00 0.05 4 0.02 0.02 0.05 0.27 0.14 0.03 0.08 0.06 0.25 5 0.03 0.06 0.15 0.55 0.31 0.07 0.15 0.12 0.70 6 0.04 0.12 0.28 0.88 0.51 0.11 0.30 0.23 1.38 7 0.07 0.19 0.44 1.26 0.77 0.28 0.45 0.38 2.18 8 0.09 0.28 0.63 1.70 1.08 0.34 0.60 0.54 3.11 9 0.13 0.39 0.78 2.18 1.42 0.41 0.80 0.70 4.26 10 0.16 0.52 0.89 2.67 1.67 0.53 1.15 0.89 5.37 11 0.20 0.66 0.96 3.07 1.80 0.64 1.30 1.06 6.63 12 0.28 0.80 0.99 3.28 1.82 0.75 1.50 1.21 7.45 13 0.35 0.90 1.00 3.33 1.82 0.90 1.60 1.24 8.09 14 0.41 0.92 1.00 3.26 1.82 1.16 1.70 1.20 8.05 15 0.44 0.91 0.99 3.13 1.82 1.28 1.60 1.15 7.92 16 0.45 0.88 0.96 2.96 1.82 1.30 0.35 1.10 7.75 17 0.35 0.85 0.93 2.77 1.82 1.25 0.35 1.05 7.51 18 0.15 0.81 0.90 2.56 1.67 1.20 0.40 0.99 7.28 19 0.15 0.77 0.85 2.33 1.60 1.10 0.40 0.94 7.11 20 0.15 0.73 0.81 2.08 1.55 1.00 0.40 0.90 6.96 21 0.15 0.69 0.77 1.76 1.53 0.98 0.40 0.85 6.73 22 0.15 0.64 0.72 1.45 1.50 0.93 0.40 0.85 6.49 23 0.15 0.60 0.68 1.13 1.48 0.90 0.40 0.85 6.26 24 0.15 0.56 0.63 0.82 1.45 0.90 0.40 0.85 6.03
20
TABLE 2-5 Power curve values, in kW, for small wind turbines (cont)
Wind Speed m/s
Bornay
Abundant
Renewable Energy
Kestrel Wind
Solacity
Incl
in 2
50
Incl
in 6
00
Incl
in 1
50
0
Incl
in 3
00
0
Incl
in 6
00
0
AR
E110
AR
E442
Kes
trel
600
Kes
trel
800
Kes
trel
100
0
Kes
trel
300
0
Eo
ltec
0 0.00 0.00 0.00 0.00 0.00 0.00 0.00 0.00 0.00 0.00 0.00 0.00 1 0.00 0.00 0.00 0.00 0.00 0.00 0.00 0.00 0.00 0.00 0.00 0.00 2 0.00 0.00 0.00 0.00 0.15 0.00 0.00 0.00 0.00 0.00 0.00 0.00 3 0.02 0.03 0.11 0.25 0.68 0.14 0.30 0.01 0.02 0.01 0.05 0.14 4 0.03 0.06 0.22 0.50 1.10 0.20 0.64 0.03 0.04 0.08 0.15 0.34 5 0.05 0.11 0.41 0.75 1.60 0.25 1.40 0.05 0.10 0.17 0.26 0.67 6 0.08 0.15 0.59 1.00 2.10 0.50 2.13 0.09 0.19 0.34 0.50 1.16 7 0.12 0.24 0.80 1.50 3.10 0.70 3.57 0.14 0.27 0.53 0.79 1.81 8 0.17 0.32 1.00 1.80 3.90 1.32 5.62 0.21 0.36 0.74 1.17 2.71 9 0.21 0.41 1.12 2.15 4.50 1.65 7.75 0.30 0.47 1.00 1.59 3.82 10 0.24 0.50 1.24 2.50 5.00 2.25 9.55 0.39 0.58 1.29 2.00 5.00 11 0.27 0.55 1.40 2.80 5.50 2.55 10.38 0.48 0.69 1.64 2.50 5.70 12 0.30 0.60 1.55 3.10 6.00 2.55 10.50 0.55 0.79 1.20 2.90 6.00 13 0.33 0.60 1.67 3.30 6.25 2.55 10.50 0.63 0.86 1.21 3.45 6.00 14 0.35 0.60 1.78 3.50 6.50 2.55 10.50 0.65 0.86 1.22 3.40 6.00 15 0.30 0.56 1.64 3.25 6.00 2.55 10.50 0.66 0.85 1.23 3.40 6.00 16 0.25 0.52 1.50 3.00 5.80 2.55 10.50 0.65 0.85 1.23 3.40 6.00 17 0.26 0.53 1.53 3.03 5.90 2.55 10.50 0.65 0.85 1.23 3.40 6.00 18 0.26 0.54 1.55 3.05 6.00 2.55 10.50 0.65 0.85 1.23 3.40 6.00 19 0.26 0.54 1.60 3.20 6.00 2.55 10.50 0.65 0.85 1.23 3.40 6.00 20 0.26 0.54 1.64 3.35 6.00 2.55 10.50 0.65 0.85 1.23 3.40 6.00 21 0.26 0.54 1.65 3.38 6.00 2.55 10.50 0.65 0.85 1.23 3.40 6.00 22 0.26 0.54 1.66 3.39 6.00 2.55 10.50 0.65 0.85 1.23 3.40 6.00 23 0.26 0.54 1.66 3.40 6.00 2.55 10.50 0.65 0.85 1.23 3.40 6.00 24 0.26 0.54 1.66 3.40 6.00 2.55 10.50 0.65 0.85 1.23 3.40 6.00
21
TABLE 2-6 Power curve values, in MW, for large wind turbines
Wind Speed m/s
Suzlon Nordex Gamesa Fuhrlander Vestas Wind Systems
S.88
- 2
.1M
W
S.82
-1.
5MW
S66
-1.2
MW
Seri
e 60
0KW
N10
0/2.
5MW
N90
/2.3
MW
S77/
1.50
0M
W
N60
/1.3
MW
G9
0-2
.0M
W
G5
8-8
50
KW
FL 2
50
0
FL 1
50
0
V90
-3.0
MW
V90
-2.0
MW
V82
-1.6
5MW
V52
-850
KW
0 0.00 0.00 0.00 0.00 0.00 0.00 0.00 0.00 0.00 0.00 0.00 0.00 0.00 0.00 0.00 0.001 0.00 0.00 0.00 0.00 0.00 0.00 0.00 0.00 0.00 0.00 0.00 0.00 0.00 0.00 0.00 0.002 0.00 0.00 0.00 0.00 0.00 0.00 0.00 0.00 0.00 0.00 0.00 0.00 0.00 0.00 0.00 0.003 0.00 0.00 0.01 0.00 0.00 0.00 0.00 0.00 0.02 0.01 0.00 0.00 0.00 0.00 0.00 0.004 0.01 0.00 0.04 0.00 0.05 0.04 0.04 0.03 0.08 0.08 0.10 0.03 0.05 0.05 0.03 0.045 0.14 0.10 0.09 0.04 0.21 0.18 0.13 0.07 0.20 0.15 0.20 0.10 0.24 0.16 0.14 0.086 0.31 0.26 0.15 0.10 0.43 0.35 0.24 0.13 0.36 0.24 0.48 0.24 0.40 0.33 0.31 0.127 0.55 0.47 0.29 0.18 0.73 0.58 0.40 0.24 0.59 0.37 0.73 0.40 0.65 0.60 0.51 0.208 0.84 0.71 0.45 0.25 1.11 0.87 0.60 0.38 0.90 0.53 1.08 0.60 0.95 0.88 0.76 0.309 1.18 0.97 0.64 0.40 1.58 1.24 0.85 0.54 1.27 0.70 1.50 0.90 1.28 1.20 1.02 0.4110 1.54 1.22 0.83 0.47 2.02 1.62 1.11 0.70 1.63 0.80 2.08 1.16 1.65 1.63 1.29 0.5511 1.86 1.38 1.01 0.55 2.31 2.01 1.33 0.87 1.86 0.84 2.50 1.34 2.04 1.90 1.50 0.6512 2.04 1.44 1.15 0.59 2.46 2.23 1.48 1.02 1.96 0.85 2.50 1.45 2.45 1.98 1.64 0.7613 2.09 1.47 1.24 0.61 2.50 2.30 1.50 1.12 1.99 0.85 2.50 1.50 2.75 2.00 1.65 0.8314 2.10 1.50 1.25 0.61 2.50 2.30 1.50 1.25 2.00 0.85 2.50 1.50 2.90 2.00 1.65 0.8515 2.10 1.50 1.25 0.61 2.50 2.30 1.50 1.30 2.00 0.85 2.50 1.50 3.00 2.00 1.65 0.8516 2.10 1.50 1.25 0.61 2.50 2.30 1.50 1.34 2.00 0.85 2.50 1.50 3.00 2.00 1.65 0.8517 2.00 1.50 1.25 0.60 2.50 2.30 1.50 1.36 2.00 0.85 2.50 1.50 3.00 2.00 1.65 0.8518 2.00 1.50 1.25 0.60 2.50 2.30 1.50 1.32 2.00 0.85 2.50 1.50 3.00 2.00 1.65 0.8519 2.00 1.50 1.25 0.60 2.50 2.30 1.50 1.32 2.00 0.85 2.50 1.50 3.00 2.00 1.65 0.8520 2.00 1.50 1.25 0.60 2.50 2.30 1.50 1.31 2.00 0.85 2.50 1.50 3.00 2.00 1.65 0.8521 2.00 1.50 1.25 0.60 2.50 2.30 1.50 1.31 2.00 0.85 2.50 1.50 3.00 2.00 1.65 0.8522 2.00 1.50 1.25 0.60 2.50 2.30 1.50 1.31 2.00 0.85 2.50 1.50 3.00 2.00 1.65 0.8523 2.00 1.50 1.25 0.60 2.50 2.30 1.50 1.30 2.00 0.85 2.50 1.50 3.00 2.00 1.65 0.8524 2.00 1.50 1.25 0.60 2.50 2.30 1.50 1.29 2.00 0.85 2.50 1.50 3.00 2.00 1.65 0.85
22
TABLE 2-7 Power curve values, in MW, for large wind turbines (cont)
Wind Speed m/s
Enercon
AAER Wind
ACSA
GE
Distributed
Energy Systems
E-8
2
E-7
0
E-5
3
E-4
8
E-4
4
E-3
3
A-1
000
A27
/225
3.6s
l
2.5x
l
1.5x
le
N
orth
Win
d 10
0
0 0.00 0.00 0.00 0.00 0.00 0.00 0.00 0.00 0.00 0.00 0.00 0.00 1 0.00 0.00 0.00 0.00 0.00 0.00 0.00 0.00 0.00 0.00 0.00 0.00 2 0.00 0.00 0.01 0.00 0.00 0.00 0.00 0.00 0.00 0.00 0.00 0.00 3 0.03 0.02 0.04 0.01 0.01 0.01 0.00 0.00 0.00 0.00 0.00 0.00 4 0.08 0.06 0.08 0.03 0.02 0.01 0.03 0.01 0.10 0.05 0.08 0.01 5 0.17 0.13 0.14 0.07 0.05 0.03 0.07 0.02 0.25 0.15 0.16 0.01 6 0.32 0.24 0.23 0.12 0.10 0.06 0.14 0.03 0.45 0.39 0.30 0.02 7 0.53 0.40 0.34 0.19 0.16 0.09 0.24 0.05 0.73 0.64 0.50 0.03 8 0.82 0.63 0.48 0.28 0.24 0.14 0.36 0.08 1.10 0.99 0.73 0.04 9 1.18 0.89 0.65 0.41 0.34 0.20 0.51 0.11 1.70 1.35 1.00 0.05 10 1.66 1.22 0.74 0.56 0.47 0.25 0.67 0.15 2.18 1.90 1.25 0.06 11 1.89 1.59 0.78 0.67 0.60 0.29 0.86 0.17 2.70 2.25 1.46 0.08 12 2.00 1.90 0.81 0.75 0.71 0.32 1.00 0.21 3.18 2.42 1.50 0.09 13 2.05 2.08 0.81 0.79 0.79 0.34 1.00 0.22 3.40 2.50 1.50 0.09 14 2.05 2.23 0.81 0.81 0.85 0.34 1.00 0.23 3.55 2.50 1.50 0.10 15 2.05 2.30 0.81 0.81 0.88 0.34 1.00 0.23 3.60 2.50 1.50 0.10 16 2.05 2.31 0.81 0.81 0.91 0.34 1.00 0.23 3.60 2.50 1.50 0.10 17 2.05 2.31 0.81 0.81 0.91 0.34 1.00 0.23 3.60 2.50 1.50 0.10 18 2.05 2.31 0.81 0.81 0.91 0.34 1.00 0.23 3.60 2.50 1.50 0.10 19 2.05 2.31 0.81 0.81 0.91 0.34 1.00 0.23 3.60 2.50 1.50 0.10 20 2.05 2.31 0.81 0.81 0.91 0.34 1.00 0.23 3.60 2.50 1.50 0.10 21 2.05 2.31 0.81 0.81 0.91 0.34 1.00 0.23 3.60 2.50 1.50 0.10 22 2.05 2.31 0.81 0.81 0.91 0.34 1.00 0.23 3.60 2.50 1.50 0.10 23 2.05 2.31 0.81 0.81 0.91 0.34 1.00 0.23 3.60 2.50 1.50 0.10 24 2.05 2.31 0.81 0.81 0.91 0.34 1.00 0.23 3.60 2.50 1.50 0.10
23
2.7 Wind Turbine Power
To estimate the average power generated by a wind turbine at a given site you may
use the average wind speed for the site and the wind turbine power curve to estimate
the average power output. The power available for a wind turbine at a specific site is:
nvPP c *)(= 2-1
Where P is an estimate of the expected power production at the site, Pc(v) is the
turbine power output from the power curve at wind speed v, and n is the number of
wind turbines to be installed. The generated energy, for a given wind speed, is obtained
multiplying the power produced at such speed by the time the wind blows at such
speed. Total generated energy is obtained adding the energy produced at each wind
speed the turbine is capable of producing electricity.
2.8 Wind Resources Wind resource is the most important element in projecting turbine performance at a
given place. The energy that can be extracted from a wind stream is proportional to the
cube of its velocity, meaning that doubling the wind velocity increases the available
energy by a factor of eight. Also, the wind resource itself rarely is a constant or has a
steady flow. It varies with year, season, and time of day, elevation above ground, and
24
form of terrain. Proper location of windy sites, away from large obstructions, improves
wind turbine's performance.
2.8.1 Anemometer
Wind speed is measured with an instrument called an anemometer. These come in
several types. The most common type has three or four cups attached to a rotating
shaft. When the wind hits the anemometer, the cups and the shaft rotate. The angular
speed of the spinning shaft is calibrated in terms of the linear speed of the wind. In the
U.S., wind speed is reported in miles per hour or in nautical miles per hours (knots). In
other countries, it is reported in kilometers per hours or meters per second. No matter
what measurement system is installed, the user needs to be sure it is properly
calibrated. Make note that the energy that can be extracted from the wind is
proportional to the cube of its velocity, meaning bad wind speed measurements will
cause an even worse estimate of power available, [Gipe, 2004].
For a small wind turbine a minimum of one year of data should be recorded and
compared with another source of wind data. It is very important that the measuring
equipment is set high enough to avoid turbulence created by trees, buildings or other
obstructions. Readings would be most useful if they have been taken at hub height, or
25
the elevation at the top of the tower where the wind turbine is going to be installed,
[Gipe, 2004].
2.8.2 Wind Speed Height Correction
If the measurement of wind speed was not made at the wind turbine hub height it is
important to adjust the measured wind speed to the hub height. This can be done using
the one-seventh power law as shown in Equation 2.2, [Burton et al. 2001].
α
⎟⎟⎠
⎞⎜⎜⎝
⎛=
1
2
1
2
)()(
zz
zvzv
2-2
Where )( 2zv is the wind speed at the desired height 2z , )( 1zv is the wind speed
measured at a known height 1z . α is a coefficient known as the wind shear exponent.
The wind shear exponent varies with pressure, temperature and time of day. A
commonly use value for α is one-seventh (1/7), approximately 0.1429.
2.8.3 Wind Resources in Puerto Rico
Puerto Rico is a mountainous, oceanic island situated between the Atlantic Ocean and
the Caribbean Sea, at approximately 18º N latitude and 66º longitude. The island is
approximately rectangular, 177 kilometers east to west and about 57 kilometers
maximum north to south. The prevailing wind of the island comes from the northeast
26
trade winds [Burton et al. 2001]. A collaborative effort between the US Department of
Energy (DOE), the National Renewable Energy Laboratory ( the Wind Powering America
program and the Wind Resource Group), AWS Truewind and the Puerto Rico Energy
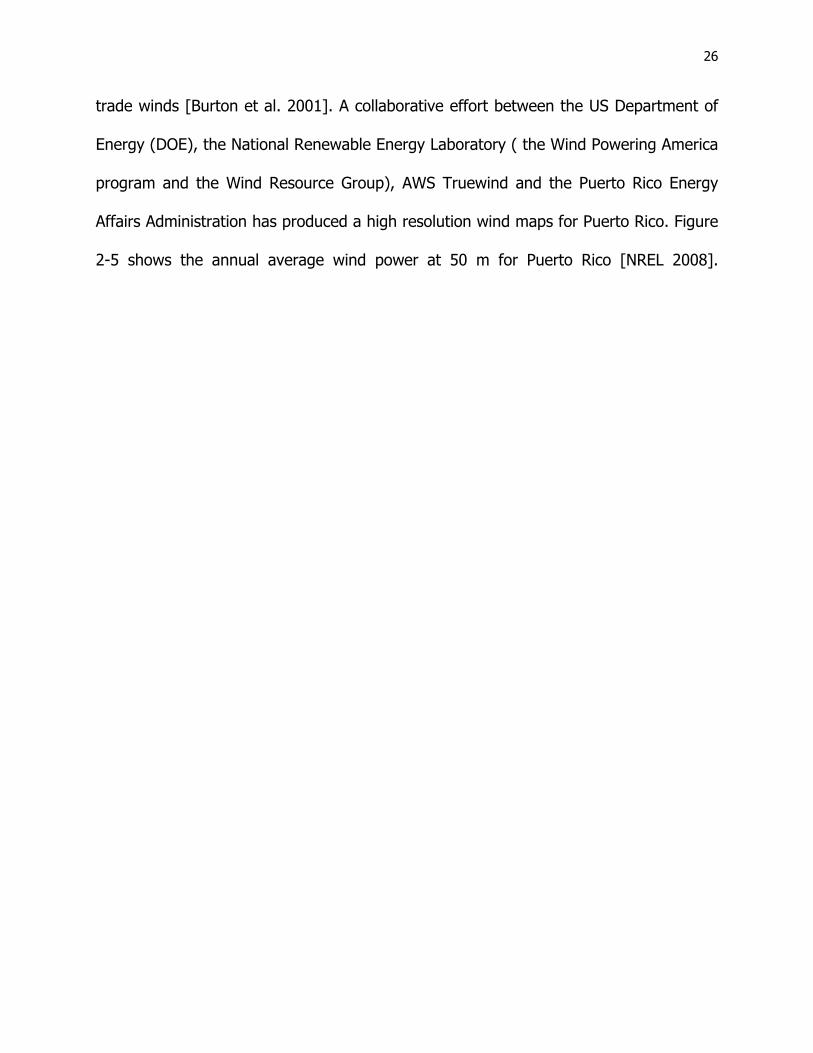
Affairs Administration has produced a high resolution wind maps for Puerto Rico. Figure
2-5 shows the annual average wind power at 50 m for Puerto Rico [NREL 2008].
27
Figure 2-5 Puerto Rico annual average wind map at 50 m height [Source: NREL 2008]
28
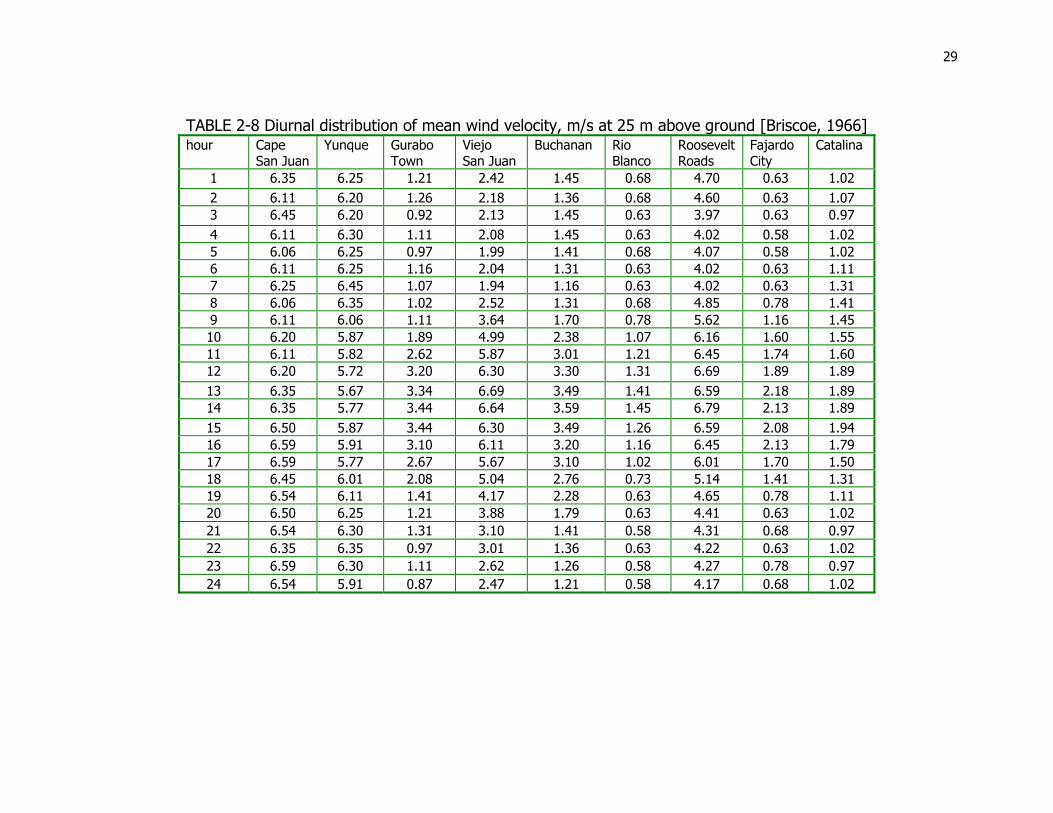
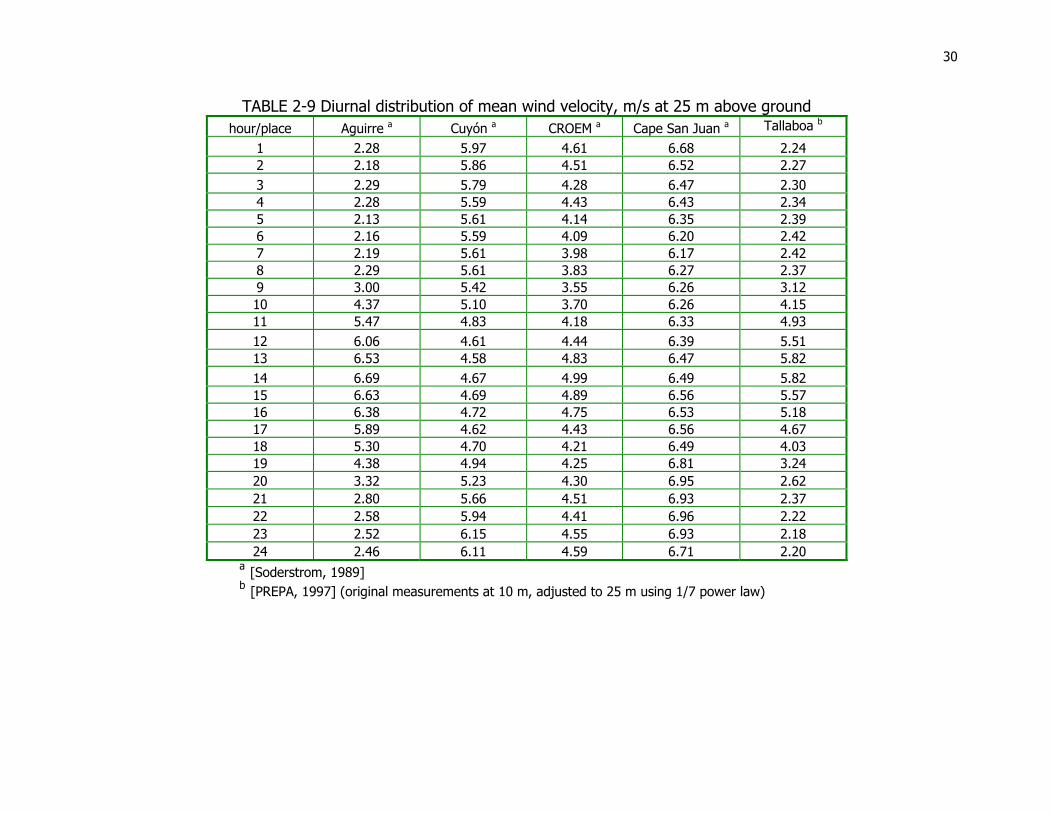
The maps show estimates of wind speed. The only way to make sure the wind speed
presented in the maps is correct for a given location is to use an anemometer to
measure wind speed at the site. Several studies have measure wind speed in Puerto
Rico. TABLE 2-8 and TABLE 2-9 present a diurnal distribution of mean wind velocity in
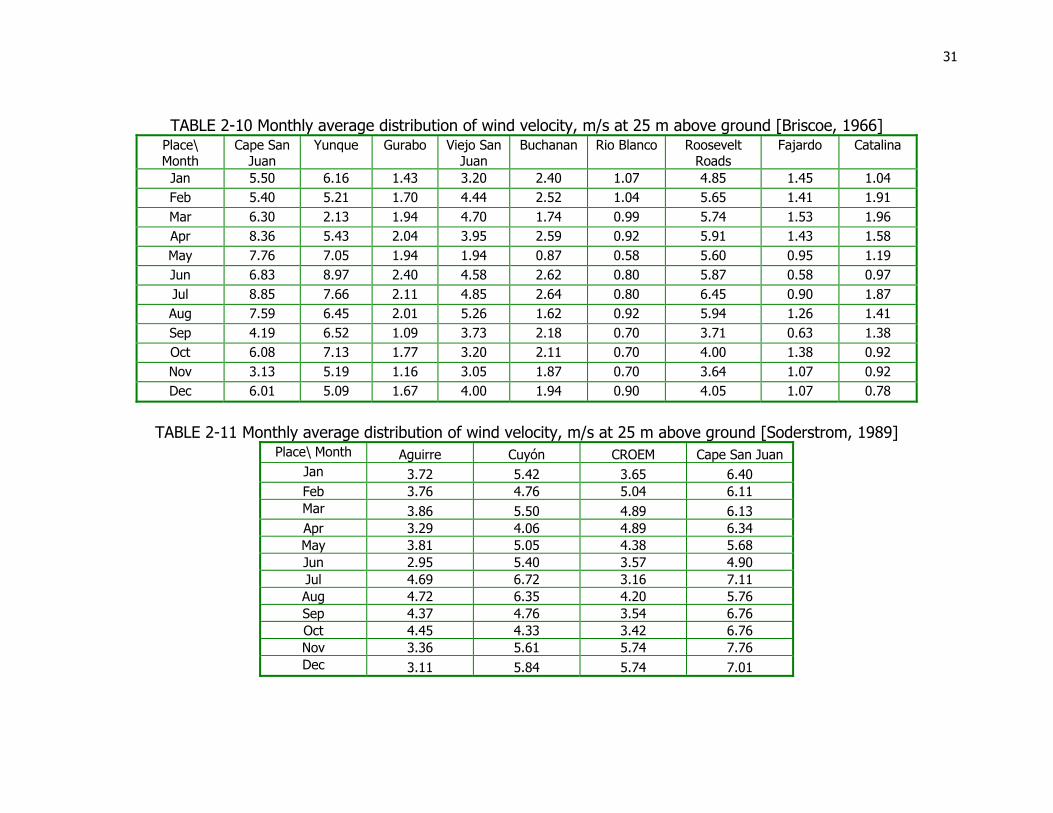
(m/s) for several sites in Puerto Rico. TABLE 2-10 and TABLE 2-11 present monthly
distribution of mean wind velocity in (m/s) for the sites shown in TABLE 2-8 and TABLE
2-9. All the data has been adjusted to a height of 25 meters from the ground.
29
TABLE 2-8 Diurnal distribution of mean wind velocity, m/s at 25 m above ground [Briscoe, 1966] hour Cape
San Juan Yunque Gurabo
Town Viejo San Juan
Buchanan Rio Blanco
Roosevelt Roads
Fajardo City
Catalina
1 6.35 6.25 1.21 2.42 1.45 0.68 4.70 0.63 1.02 2 6.11 6.20 1.26 2.18 1.36 0.68 4.60 0.63 1.07 3 6.45 6.20 0.92 2.13 1.45 0.63 3.97 0.63 0.97 4 6.11 6.30 1.11 2.08 1.45 0.63 4.02 0.58 1.02 5 6.06 6.25 0.97 1.99 1.41 0.68 4.07 0.58 1.02 6 6.11 6.25 1.16 2.04 1.31 0.63 4.02 0.63 1.11 7 6.25 6.45 1.07 1.94 1.16 0.63 4.02 0.63 1.31 8 6.06 6.35 1.02 2.52 1.31 0.68 4.85 0.78 1.41 9 6.11 6.06 1.11 3.64 1.70 0.78 5.62 1.16 1.45 10 6.20 5.87 1.89 4.99 2.38 1.07 6.16 1.60 1.55 11 6.11 5.82 2.62 5.87 3.01 1.21 6.45 1.74 1.60 12 6.20 5.72 3.20 6.30 3.30 1.31 6.69 1.89 1.89 13 6.35 5.67 3.34 6.69 3.49 1.41 6.59 2.18 1.89 14 6.35 5.77 3.44 6.64 3.59 1.45 6.79 2.13 1.89 15 6.50 5.87 3.44 6.30 3.49 1.26 6.59 2.08 1.94 16 6.59 5.91 3.10 6.11 3.20 1.16 6.45 2.13 1.79 17 6.59 5.77 2.67 5.67 3.10 1.02 6.01 1.70 1.50 18 6.45 6.01 2.08 5.04 2.76 0.73 5.14 1.41 1.31 19 6.54 6.11 1.41 4.17 2.28 0.63 4.65 0.78 1.11 20 6.50 6.25 1.21 3.88 1.79 0.63 4.41 0.63 1.02 21 6.54 6.30 1.31 3.10 1.41 0.58 4.31 0.68 0.97 22 6.35 6.35 0.97 3.01 1.36 0.63 4.22 0.63 1.02 23 6.59 6.30 1.11 2.62 1.26 0.58 4.27 0.78 0.97 24 6.54 5.91 0.87 2.47 1.21 0.58 4.17 0.68 1.02
30
TABLE 2-9 Diurnal distribution of mean wind velocity, m/s at 25 m above ground hour/place Aguirre a Cuyón a CROEM a Cape San Juan a Tallaboa b
1 2.28 5.97 4.61 6.68 2.24 2 2.18 5.86 4.51 6.52 2.27 3 2.29 5.79 4.28 6.47 2.30 4 2.28 5.59 4.43 6.43 2.34 5 2.13 5.61 4.14 6.35 2.39 6 2.16 5.59 4.09 6.20 2.42 7 2.19 5.61 3.98 6.17 2.42 8 2.29 5.61 3.83 6.27 2.37 9 3.00 5.42 3.55 6.26 3.12 10 4.37 5.10 3.70 6.26 4.15 11 5.47 4.83 4.18 6.33 4.93 12 6.06 4.61 4.44 6.39 5.51 13 6.53 4.58 4.83 6.47 5.82 14 6.69 4.67 4.99 6.49 5.82 15 6.63 4.69 4.89 6.56 5.57 16 6.38 4.72 4.75 6.53 5.18 17 5.89 4.62 4.43 6.56 4.67 18 5.30 4.70 4.21 6.49 4.03 19 4.38 4.94 4.25 6.81 3.24 20 3.32 5.23 4.30 6.95 2.62 21 2.80 5.66 4.51 6.93 2.37 22 2.58 5.94 4.41 6.96 2.22 23 2.52 6.15 4.55 6.93 2.18 24 2.46 6.11 4.59 6.71 2.20
a [Soderstrom, 1989] b [PREPA, 1997] (original measurements at 10 m, adjusted to 25 m using 1/7 power law)
31
TABLE 2-10 Monthly average distribution of wind velocity, m/s at 25 m above ground [Briscoe, 1966]
Place\ Month
Cape San Juan
Yunque Gurabo Viejo San Juan
Buchanan Rio Blanco Roosevelt Roads
Fajardo Catalina
Jan 5.50 6.16 1.43 3.20 2.40 1.07 4.85 1.45 1.04 Feb 5.40 5.21 1.70 4.44 2.52 1.04 5.65 1.41 1.91 Mar 6.30 2.13 1.94 4.70 1.74 0.99 5.74 1.53 1.96 Apr 8.36 5.43 2.04 3.95 2.59 0.92 5.91 1.43 1.58 May 7.76 7.05 1.94 1.94 0.87 0.58 5.60 0.95 1.19 Jun 6.83 8.97 2.40 4.58 2.62 0.80 5.87 0.58 0.97 Jul 8.85 7.66 2.11 4.85 2.64 0.80 6.45 0.90 1.87 Aug 7.59 6.45 2.01 5.26 1.62 0.92 5.94 1.26 1.41 Sep 4.19 6.52 1.09 3.73 2.18 0.70 3.71 0.63 1.38 Oct 6.08 7.13 1.77 3.20 2.11 0.70 4.00 1.38 0.92 Nov 3.13 5.19 1.16 3.05 1.87 0.70 3.64 1.07 0.92 Dec 6.01 5.09 1.67 4.00 1.94 0.90 4.05 1.07 0.78
TABLE 2-11 Monthly average distribution of wind velocity, m/s at 25 m above ground [Soderstrom, 1989]
Place\ Month Aguirre Cuyón CROEM Cape San Juan Jan 3.72 5.42 3.65 6.40 Feb 3.76 4.76 5.04 6.11 Mar 3.86 5.50 4.89 6.13 Apr 3.29 4.06 4.89 6.34 May 3.81 5.05 4.38 5.68 Jun 2.95 5.40 3.57 4.90 Jul 4.69 6.72 3.16 7.11 Aug 4.72 6.35 4.20 5.76 Sep 4.37 4.76 3.54 6.76 Oct 4.45 4.33 3.42 6.76 Nov 3.36 5.61 5.74 7.76 Dec 3.11 5.84 5.74 7.01
32
2.9 Weather Effects
The sun causes most weather effects changes. When the sun strikes the earth, it heats
the soil near the surface. In turn, the soil warms the air lying above it. Warm air is less
dense than cool air, and, like a helium-filled balloon, it rises. Cool air flows in to take its
place and is itself heated. The rising warm air eventually cools and falls back to the
earth completing the convection cell. This cycle is repeated over and over again every
day. This is how wind is created on Earth. While the sun keeps shinning the earth wind
will keep flowing.
In islands, winds are stronger and more frequent along the coast because of differential
heating between the land and the water. During the day, the sun warms the land much
quicker than it does the surface of water. Water has higher specific heat and can store
more energy without a change in temperature than can soil. The air above the land is
once again warmed and rises. Cool air flows landward, replacing the warm air, creating
a large convection cell. At night the flows reverse as the land cools more quickly than
the water. [Gipe 2006]
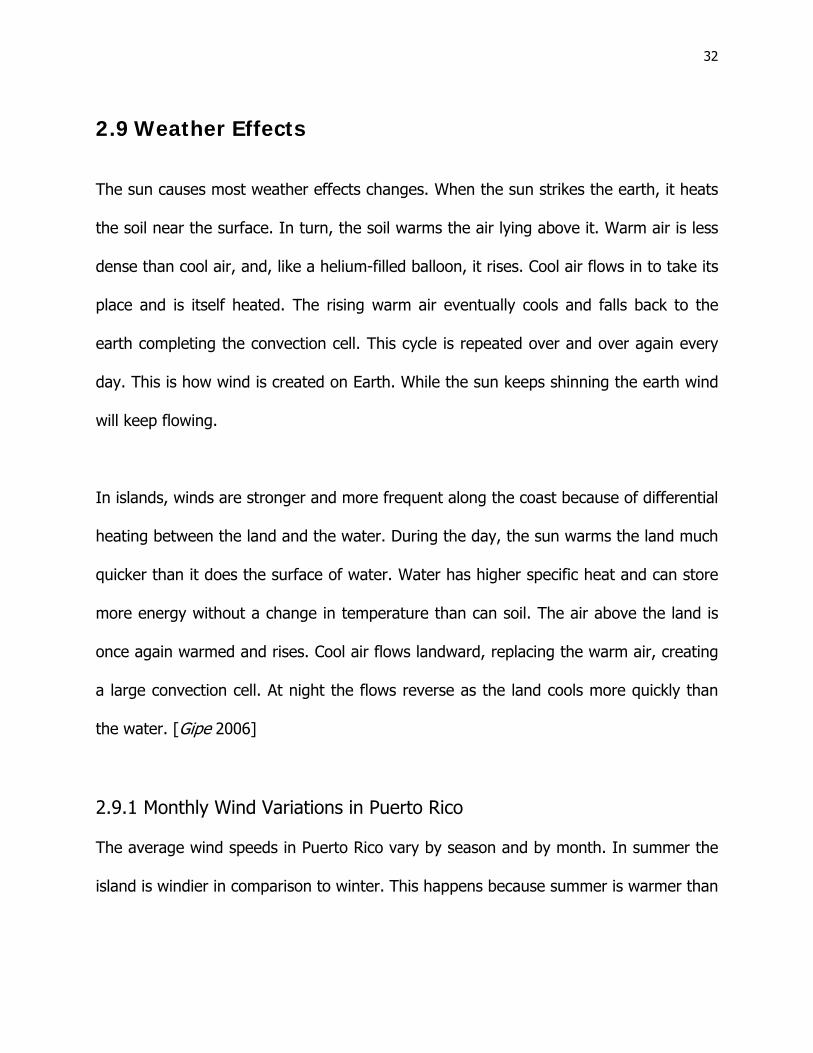
2.9.1 Monthly Wind Variations in Puerto Rico The average wind speeds in Puerto Rico vary by season and by month. In summer the
island is windier in comparison to winter. This happens because summer is warmer than
33
winter. Sun's rays hit the Earth at a more direct angle during summer than during
winter and also because the days are much longer than the nights during the summer.
During the winter, the Sun's rays hit the Earth at an extreme angle, and the days are
short. These effects are due to the tilt of the Earth's axis. Figure 2-6 shows the average
monthly distribution of mean wind velocity in (m/s).
0.00
0.50
1.00
1.50
2.00
2.50
3.00
3.50
4.00
4.50
5.00
Jan Feb Mar Apr May Jun Jul Aug Sep Oct Nov Dec
(m/s)
Figure 2-6 Puerto Rico Average Monthly Wind Speed
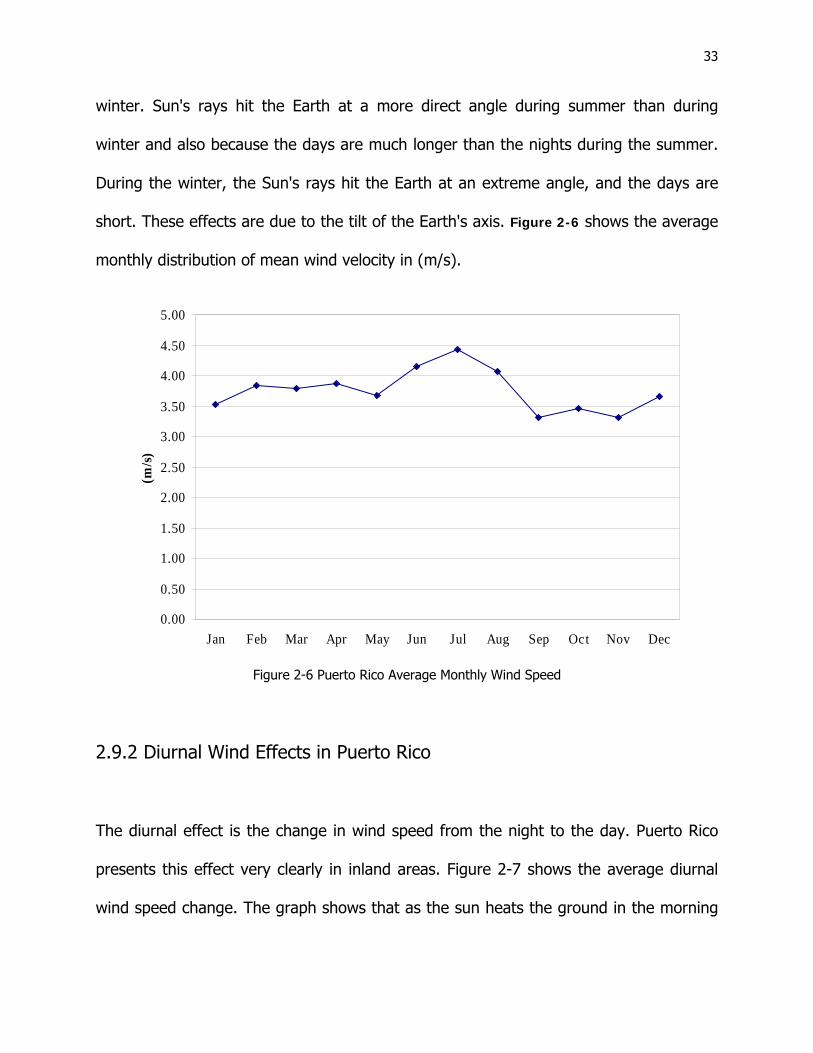
2.9.2 Diurnal Wind Effects in Puerto Rico
The diurnal effect is the change in wind speed from the night to the day. Puerto Rico
presents this effect very clearly in inland areas. Figure 2-7 shows the average diurnal
wind speed change. The graph shows that as the sun heats the ground in the morning
34
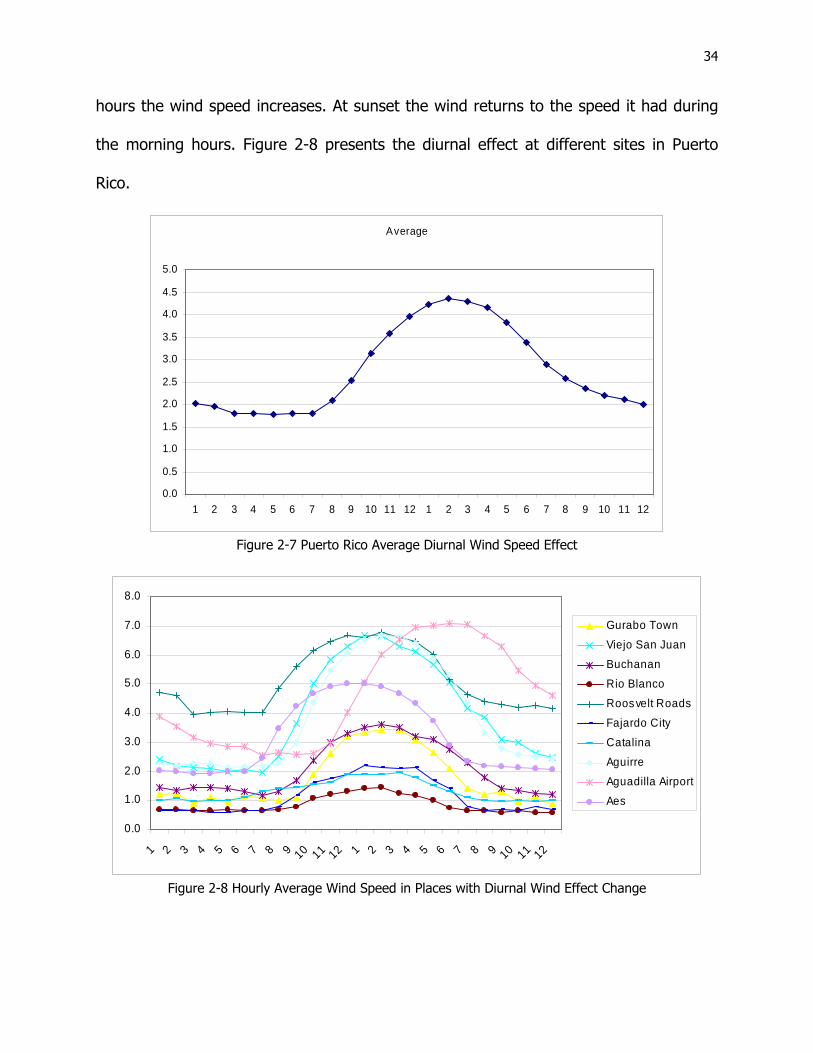
hours the wind speed increases. At sunset the wind returns to the speed it had during
the morning hours. Figure 2-8 presents the diurnal effect at different sites in Puerto
Rico.
Average
0.0
0.5
1.0
1.5
2.0
2.5
3.0
3.5
4.0
4.5
5.0
1 2 3 4 5 6 7 8 9 10 11 12 1 2 3 4 5 6 7 8 9 10 11 12
Figure 2-7 Puerto Rico Average Diurnal Wind Speed Effect
0.0
1.0
2.0
3.0
4.0
5.0
6.0
7.0
8.0
1 2 3 4 5 6 7 8 9 10 11 12 1 2 3 4 5 6 7 8 9 10 11 12
Gurabo Town
Viejo San Juan
Buchanan
Rio Blanco
Roosvelt Roads
Fajardo City
Catalina
AguirreAguadilla Airport
Aes
Figure 2-8 Hourly Average Wind Speed in Places with Diurnal Wind Effect Change
35
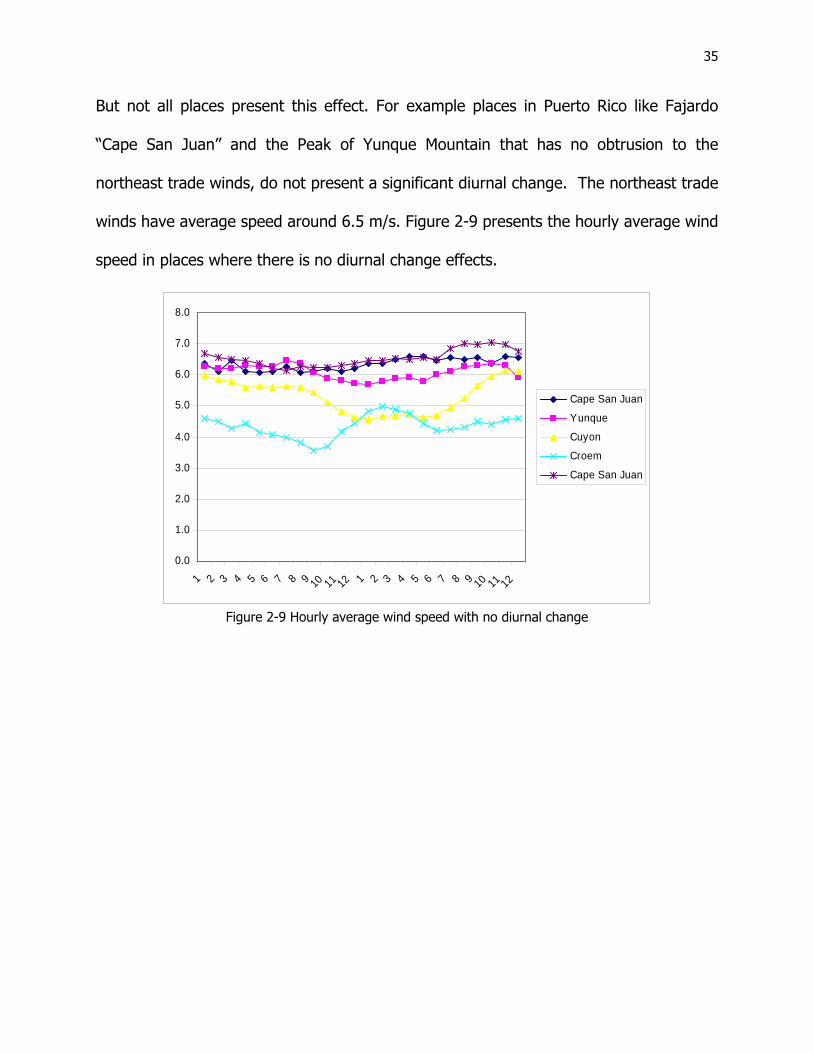
But not all places present this effect. For example places in Puerto Rico like Fajardo
“Cape San Juan” and the Peak of Yunque Mountain that has no obtrusion to the
northeast trade winds, do not present a significant diurnal change. The northeast trade
winds have average speed around 6.5 m/s. Figure 2-9 presents the hourly average wind
speed in places where there is no diurnal change effects.
0.0
1.0
2.0
3.0
4.0
5.0
6.0
7.0
8.0
1 2 3 4 5 6 7 8 9 10 11 12 1 2 3 4 5 6 7 8 9 10 11 12
Cape San Juan
Yunque
Cuyon
Croem
Cape San Juan
Figure 2-9 Hourly average wind speed with no diurnal change
36
2.10 Estimated Inland Required Surface or “Foot Print”, for Wind Turbines
2.10.1 Estimated Inland Surface Area
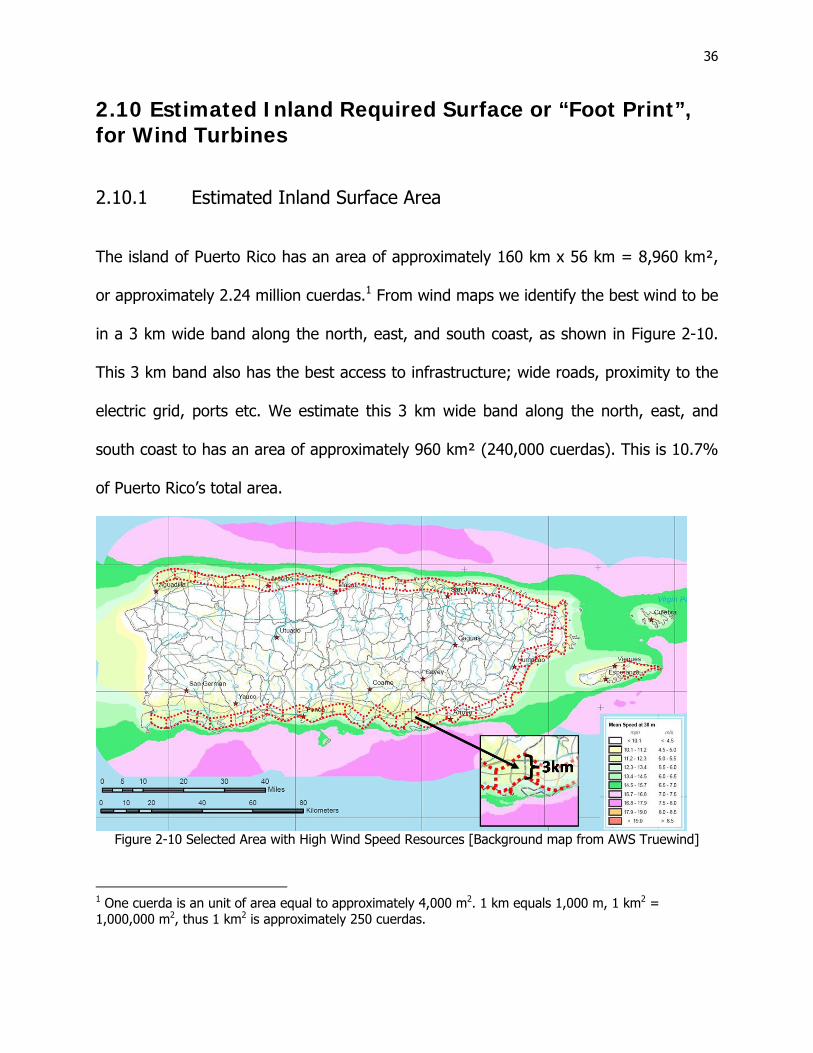
The island of Puerto Rico has an area of approximately 160 km x 56 km = 8,960 km²,
or approximately 2.24 million cuerdas.1 From wind maps we identify the best wind to be
in a 3 km wide band along the north, east, and south coast, as shown in Figure 2-10.
This 3 km band also has the best access to infrastructure; wide roads, proximity to the
electric grid, ports etc. We estimate this 3 km wide band along the north, east, and
south coast to has an area of approximately 960 km² (240,000 cuerdas). This is 10.7%
of Puerto Rico’s total area.
Figure 2-10 Selected Area with High Wind Speed Resources [Background map from AWS Truewind]
1 One cuerda is an unit of area equal to approximately 4,000 m2. 1 km equals 1,000 m, 1 km2 = 1,000,000 m2, thus 1 km2 is approximately 250 cuerdas.
37
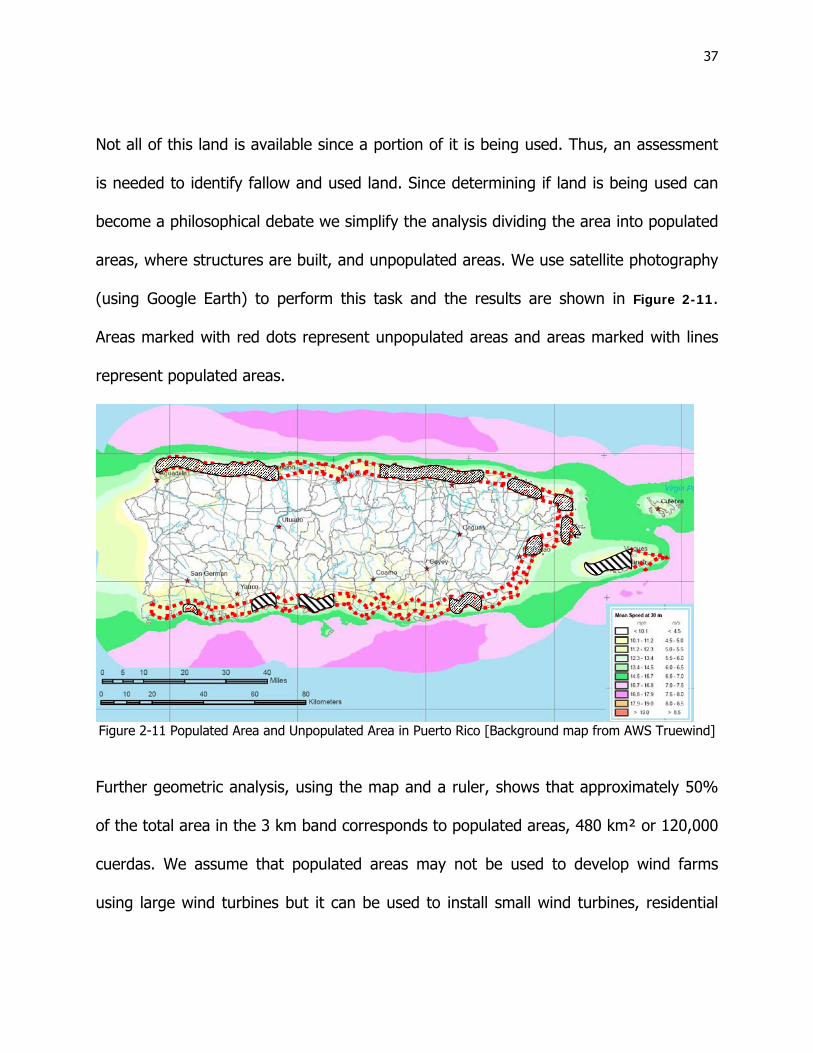
Not all of this land is available since a portion of it is being used. Thus, an assessment
is needed to identify fallow and used land. Since determining if land is being used can
become a philosophical debate we simplify the analysis dividing the area into populated
areas, where structures are built, and unpopulated areas. We use satellite photography
(using Google Earth) to perform this task and the results are shown in Figure 2-11.
Areas marked with red dots represent unpopulated areas and areas marked with lines
represent populated areas.
Figure 2-11 Populated Area and Unpopulated Area in Puerto Rico [Background map from AWS Truewind]
Further geometric analysis, using the map and a ruler, shows that approximately 50%
of the total area in the 3 km band corresponds to populated areas, 480 km² or 120,000
cuerdas. We assume that populated areas may not be used to develop wind farms
using large wind turbines but it can be used to install small wind turbines, residential
38
and commercial type turbines. The remaining 50% of the 3 km wide band along the
north, east, and south coast is not heavily populated and we assume it can be used to
develop wind farms using large wind turbines.
2.10.2 Large Wind Turbine Spacing
A wind turbine is designed to extract energy from the wind as it passes thru its blades.
Since the wind mass is the same before and after the turbine but the wind has less
energy the wind speed decreases. If we wish to install a second wind turbine behind
the first one we must separate the turbines enough for the wind to recover its original
speed thus allowing the second wind turbine to produce as much electricity as the first
one.
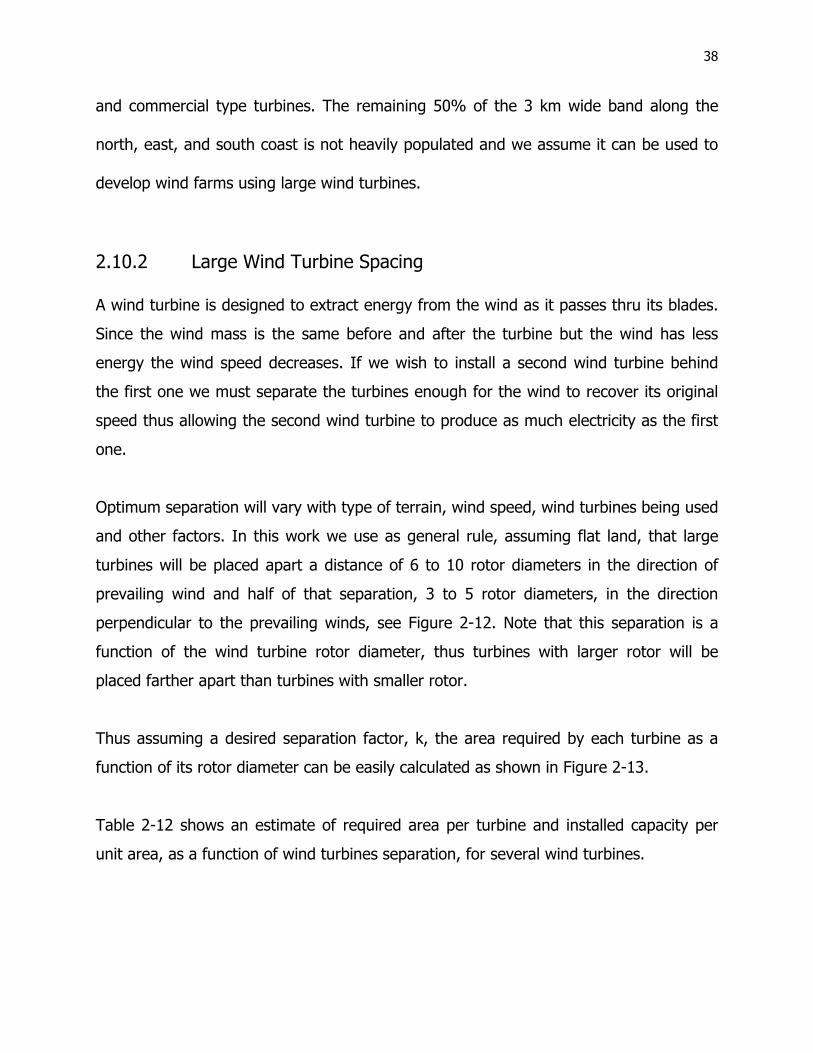
Optimum separation will vary with type of terrain, wind speed, wind turbines being used
and other factors. In this work we use as general rule, assuming flat land, that large
turbines will be placed apart a distance of 6 to 10 rotor diameters in the direction of
prevailing wind and half of that separation, 3 to 5 rotor diameters, in the direction
perpendicular to the prevailing winds, see Figure 2-12. Note that this separation is a
function of the wind turbine rotor diameter, thus turbines with larger rotor will be
placed farther apart than turbines with smaller rotor.
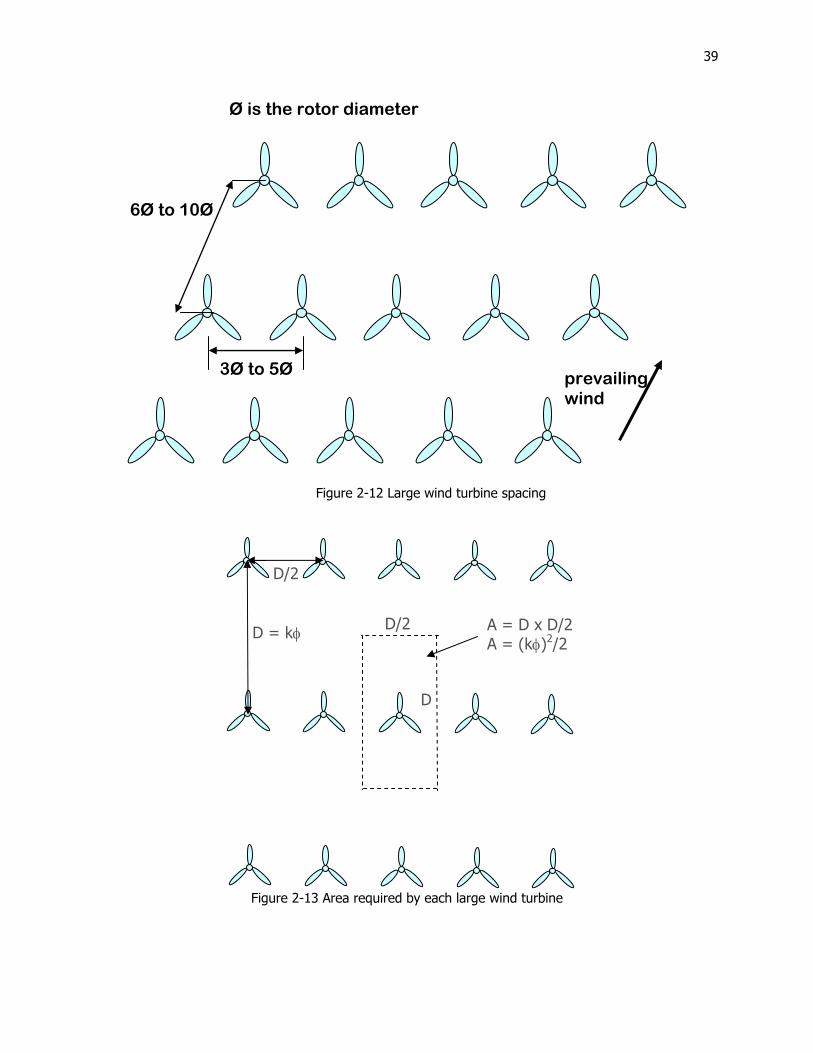
Thus assuming a desired separation factor, k, the area required by each turbine as a
function of its rotor diameter can be easily calculated as shown in Figure 2-13.
Table 2-12 shows an estimate of required area per turbine and installed capacity per
unit area, as a function of wind turbines separation, for several wind turbines.
39
Figure 2-12 Large wind turbine spacing
Figure 2-13 Area required by each large wind turbine
prevailing wind
6Ø to 10Ø
3Ø to 5Ø
Ø is the rotor diameter
D = kφ
D/2
D/2
D
A = D x D/2 A = (kφ)2/2
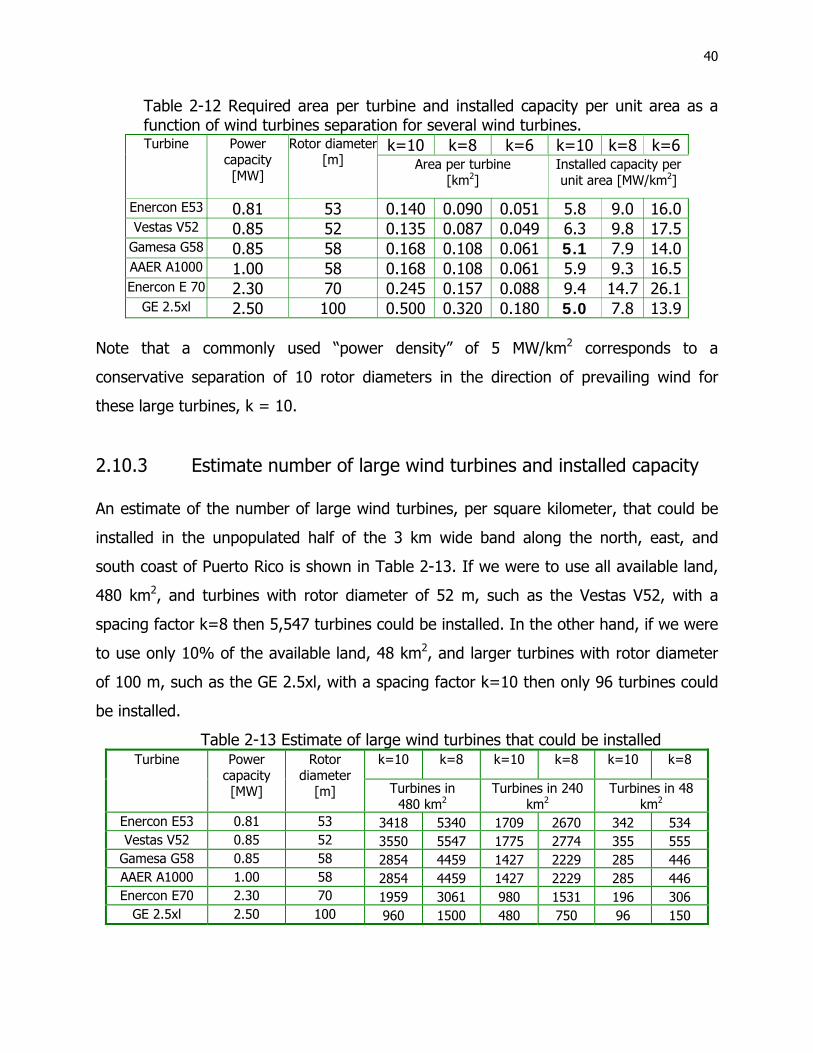
40
Table 2-12 Required area per turbine and installed capacity per unit area as a function of wind turbines separation for several wind turbines. Turbine Power
capacity [MW]
Rotor diameter[m]
k=10 k=8 k=6 k=10 k=8 k=6Area per turbine
[km2] Installed capacity per unit area [MW/km2]
Enercon E53 0.81 53 0.140 0.090 0.051 5.8 9.0 16.0Vestas V52 0.85 52 0.135 0.087 0.049 6.3 9.8 17.5
Gamesa G58 0.85 58 0.168 0.108 0.061 5.1 7.9 14.0AAER A1000 1.00 58 0.168 0.108 0.061 5.9 9.3 16.5Enercon E 70 2.30 70 0.245 0.157 0.088 9.4 14.7 26.1
GE 2.5xl 2.50 100 0.500 0.320 0.180 5.0 7.8 13.9 Note that a commonly used “power density” of 5 MW/km2 corresponds to a
conservative separation of 10 rotor diameters in the direction of prevailing wind for
these large turbines, k = 10.
2.10.3 Estimate number of large wind turbines and installed capacity
An estimate of the number of large wind turbines, per square kilometer, that could be
installed in the unpopulated half of the 3 km wide band along the north, east, and
south coast of Puerto Rico is shown in Table 2-13. If we were to use all available land,
480 km2, and turbines with rotor diameter of 52 m, such as the Vestas V52, with a
spacing factor k=8 then 5,547 turbines could be installed. In the other hand, if we were
to use only 10% of the available land, 48 km2, and larger turbines with rotor diameter
of 100 m, such as the GE 2.5xl, with a spacing factor k=10 then only 96 turbines could
be installed.
Table 2-13 Estimate of large wind turbines that could be installed Turbine Power
capacity [MW]
Rotor diameter
[m]
k=10 k=8 k=10 k=8 k=10 k=8
Turbines in 480 km2
Turbines in 240 km2
Turbines in 48 km2
Enercon E53 0.81 53 3418 5340 1709 2670 342 534 Vestas V52 0.85 52 3550 5547 1775 2774 355 555
Gamesa G58 0.85 58 2854 4459 1427 2229 285 446 AAER A1000 1.00 58 2854 4459 1427 2229 285 446 Enercon E70 2.30 70 1959 3061 980 1531 196 306
GE 2.5xl 2.50 100 960 1500 480 750 96 150
41
Finally, an estimate of installed capacity in MW is shown in Table 2-14. If we were to
use all available land, 480 km2, and turbines with rotor diameter of 52 m, such as the
Vestas V52, with a spacing factor k=8 then 4,715 MW could be installed. In the other
hand, if we were to use only 10% of the available land, 48 km2, and larger turbines
with rotor diameter of 100 m, such as the GE 2.5xl, with a spacing factor k=10 then
only 375 MW could be installed.
Table 2-14 Estimate of installed capacity in MW Turbine Power
capacity [MW]
Rotor diameter
[m]
k=10 k=8 k=10 k=8 k=10 k=8
MW in 480 km2
MW in 240 km2
MW in 48 km2
Enercon E53 0.81 53 2768 4325 1384 2163 277 433 Vestas V52 0.85 52 3018 4715 1509 2358 302 472
Gamesa G58 0.85 58 2426 3790 1213 1895 243 379 AAER A1000 1.00 58 2854 4459 1427 2229 285 446 Enercon E70 2.30 70 4506 7041 2253 3520 451 704
GE 2.5xl 2.50 100 2400 3750 1200 1875 240 375
Is it better to install less very large turbines or smaller turbines? Wind turbines are not
power producers, they are energy producers. The answer is install turbines that
produce the most amount of energy, turbines that match the wind regime.
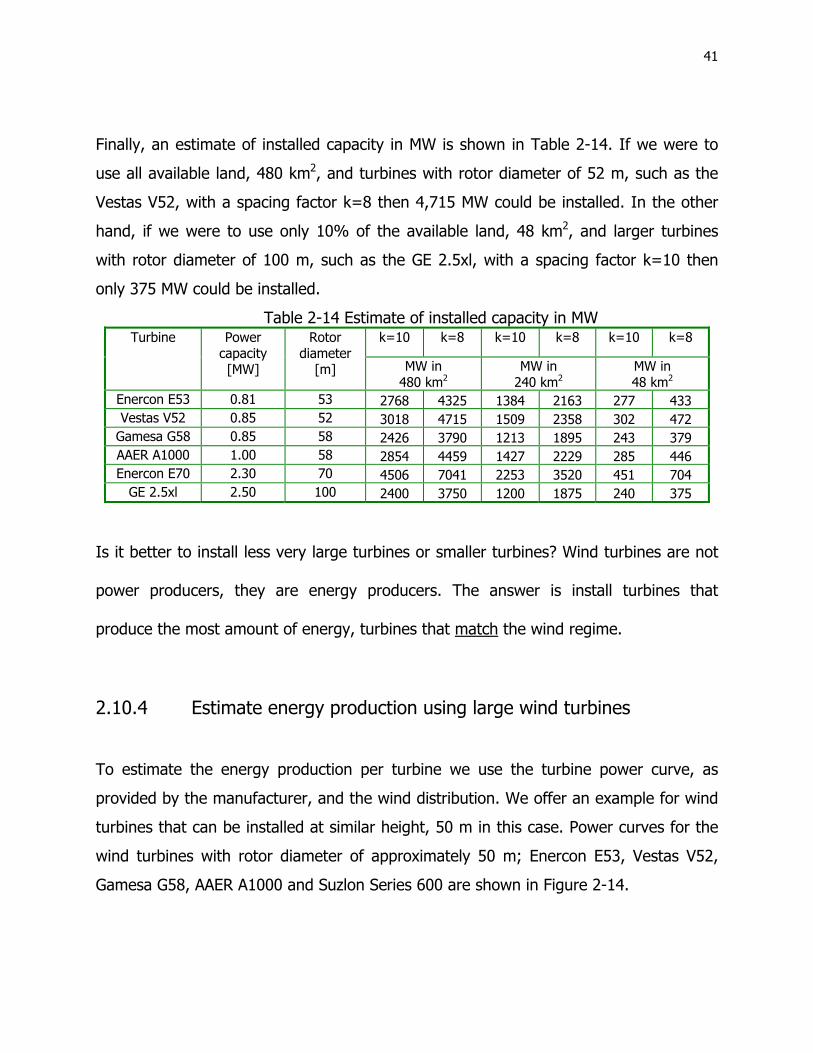
2.10.4 Estimate energy production using large wind turbines
To estimate the energy production per turbine we use the turbine power curve, as
provided by the manufacturer, and the wind distribution. We offer an example for wind
turbines that can be installed at similar height, 50 m in this case. Power curves for the
wind turbines with rotor diameter of approximately 50 m; Enercon E53, Vestas V52,
Gamesa G58, AAER A1000 and Suzlon Series 600 are shown in Figure 2-14.
42
Figure 2-14 Power curves for turbines than can be installed at 50 m height; Enercon E53, Vestas V52, Gamesa G58 and AAER A1000.
Note that even thought they are rated at the same power, 850 kW, the Gamesa G58
generates greater or equal power than the Vestas V52 at all wind speeds. This is so
because the Gamesa G58 has a larger rotor and will produce more energy than the
Vestas V52.
Also note that even though the AAER A1000 is rated at 1,000 kW and has a rotor
diameter of 58 m, equal to the Gamesa G58 rotor diameter, the Gamesa G58 will
produce more energy because it generates greater or equal power than the AAER
A1000 at wind speeds under 11 m/s.
43
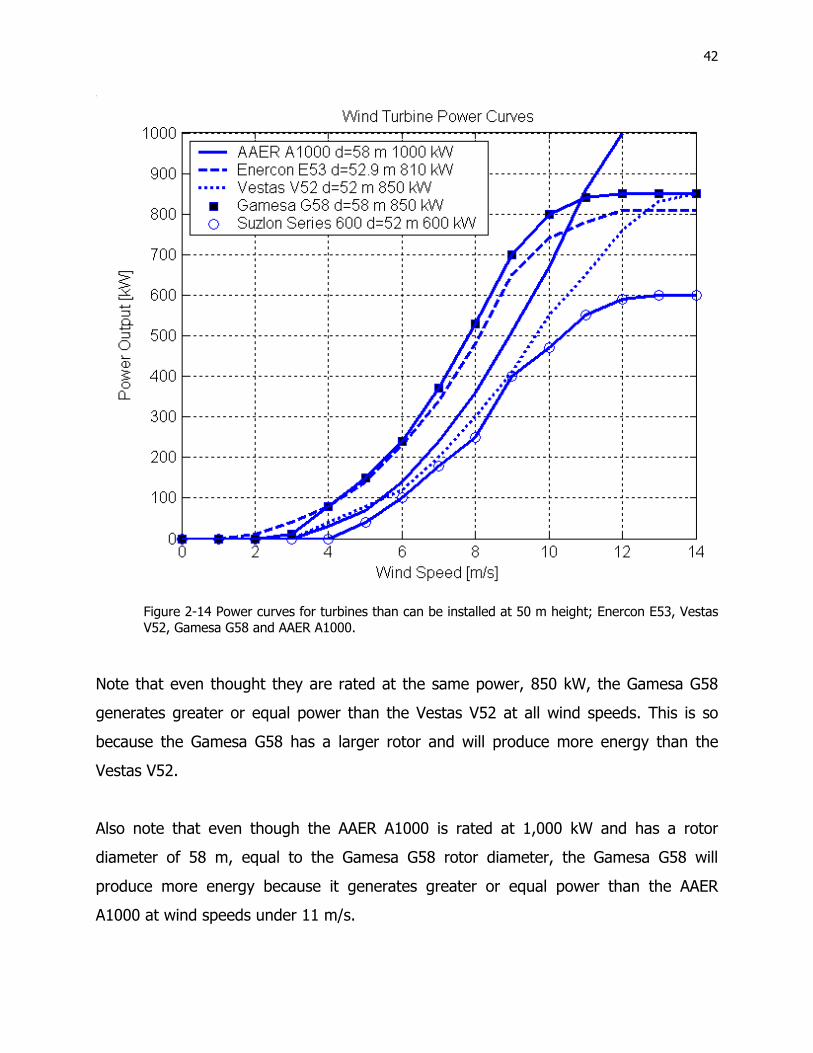
Wind speed varies with wind site and, at most sites in Puerto Rico, the wind speed is
less than 11 m/s during most of the hours of the year as shown in Figure 2-15.
Figure 2-15 Weibull probability density functions at five sites in Puerto Rico. A probability density function (pdf), in this case a Weibul pdf, summarizes the
probability of the wind blowing at a given speed. The probability axis, the vertical axis,
can be easily converted to hours in a year by simply multiplying it by the number of
hours in a standard year, 8760 hours. Then the plot will indicate the number of hours
the wind was blowing at a given speed.
44
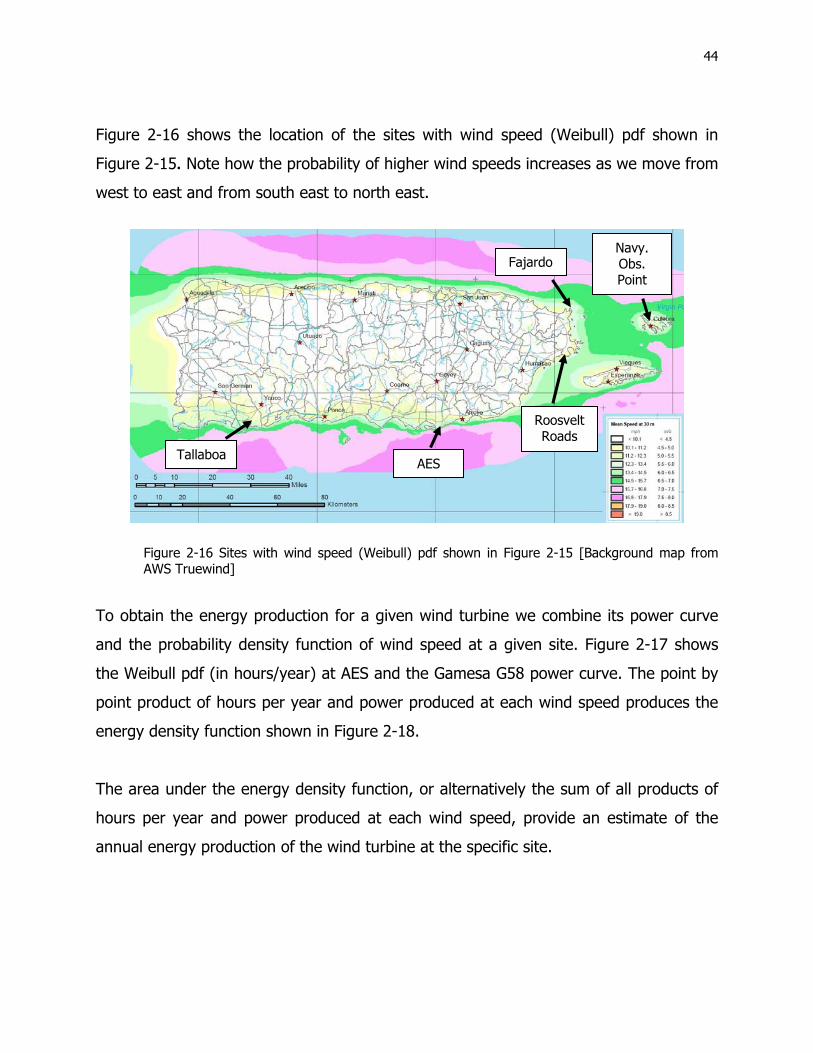
Figure 2-16 shows the location of the sites with wind speed (Weibull) pdf shown in
Figure 2-15. Note how the probability of higher wind speeds increases as we move from
west to east and from south east to north east.
Figure 2-16 Sites with wind speed (Weibull) pdf shown in Figure 2-15 [Background map from AWS Truewind]
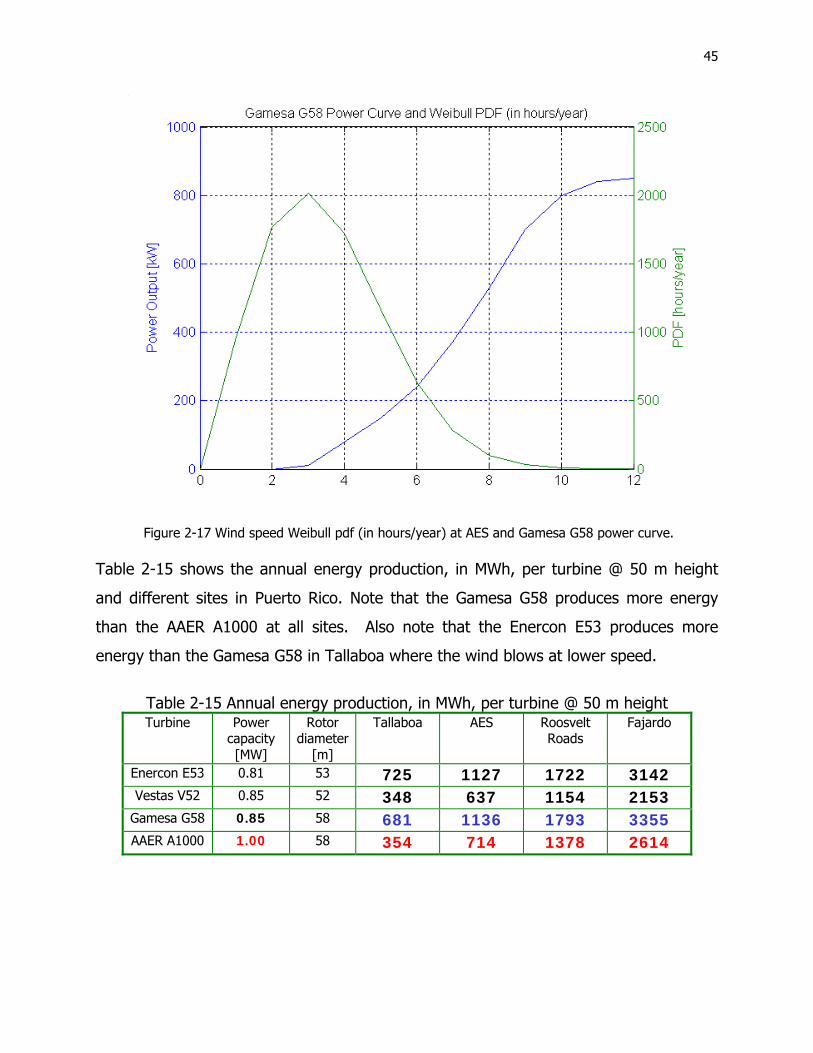
To obtain the energy production for a given wind turbine we combine its power curve
and the probability density function of wind speed at a given site. Figure 2-17 shows
the Weibull pdf (in hours/year) at AES and the Gamesa G58 power curve. The point by
point product of hours per year and power produced at each wind speed produces the
energy density function shown in Figure 2-18.
The area under the energy density function, or alternatively the sum of all products of
hours per year and power produced at each wind speed, provide an estimate of the
annual energy production of the wind turbine at the specific site.
Tallaboa AES
Roosvelt Roads
Fajardo Navy. Obs. Point
45
Figure 2-17 Wind speed Weibull pdf (in hours/year) at AES and Gamesa G58 power curve.
Table 2-15 shows the annual energy production, in MWh, per turbine @ 50 m height
and different sites in Puerto Rico. Note that the Gamesa G58 produces more energy
than the AAER A1000 at all sites. Also note that the Enercon E53 produces more
energy than the Gamesa G58 in Tallaboa where the wind blows at lower speed.
Table 2-15 Annual energy production, in MWh, per turbine @ 50 m height Turbine Power
capacity [MW]
Rotor diameter
[m]
Tallaboa AES Roosvelt Roads
Fajardo
Enercon E53 0.81 53 725 1127 1722 3142 Vestas V52 0.85 52 348 637 1154 2153
Gamesa G58 0.85 58 681 1136 1793 3355 AAER A1000 1.00 58 354 714 1378 2614
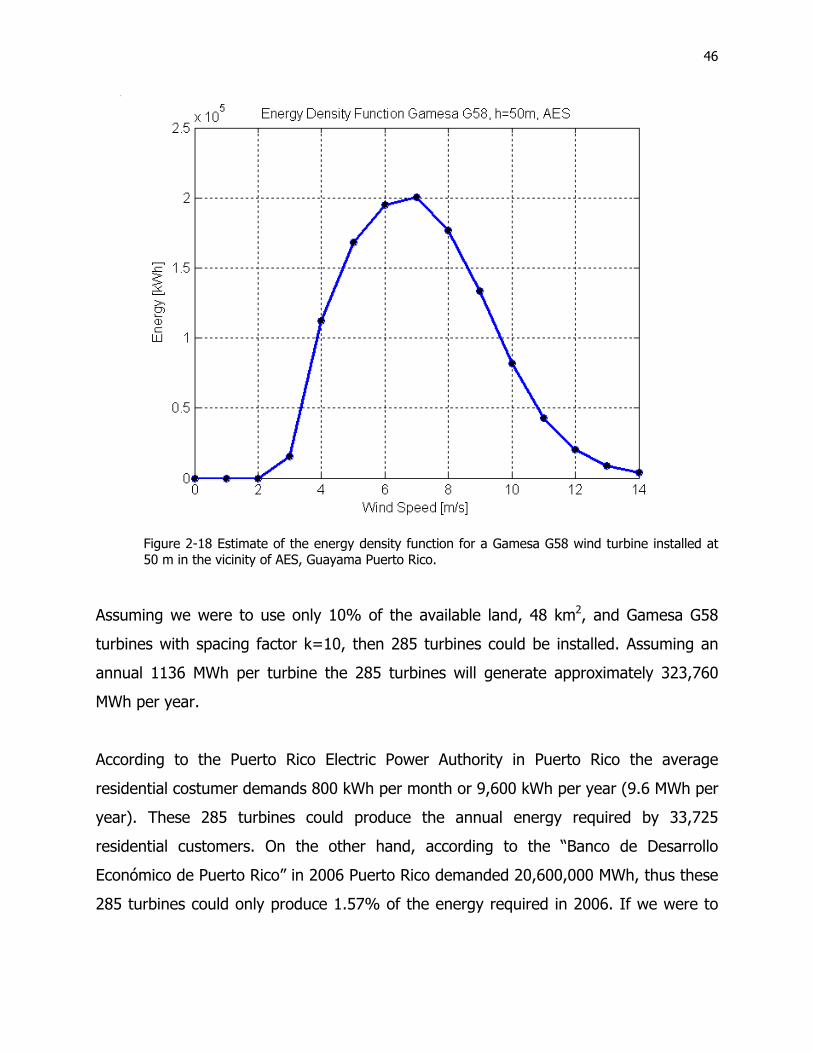
46
Figure 2-18 Estimate of the energy density function for a Gamesa G58 wind turbine installed at 50 m in the vicinity of AES, Guayama Puerto Rico.
Assuming we were to use only 10% of the available land, 48 km2, and Gamesa G58
turbines with spacing factor k=10, then 285 turbines could be installed. Assuming an
annual 1136 MWh per turbine the 285 turbines will generate approximately 323,760
MWh per year.
According to the Puerto Rico Electric Power Authority in Puerto Rico the average
residential costumer demands 800 kWh per month or 9,600 kWh per year (9.6 MWh per
year). These 285 turbines could produce the annual energy required by 33,725
residential customers. On the other hand, according to the “Banco de Desarrollo
Económico de Puerto Rico” in 2006 Puerto Rico demanded 20,600,000 MWh, thus these
285 turbines could only produce 1.57% of the energy required in 2006. If we were to
47
use 50% of the unpopulated land in the 3 km wide band along the north, east, and
south coast to install this type of turbines we will be able to produce approximately
7.86% of the energy demanded in Puerto Rico in 2006.
2.10.5 Estimate number of small wind turbines
For small wind turbines we use a very conservative estimate that each wind turbine will
occupy approximately 20,000 m², or 5 cuerdas. Even with this assumption the total
number of small wind turbines that can be installed in the populated zones of the 3 km
band is, 531000000m²/20000m² = 26,550 turbines. Half of these, or 13,275, will still
be a significant market for small wind turbines.
2.10.6 Estimate energy production using small wind turbines
Analysis of TABLE 2-1 shows that the Bornay Inclin 3000 and Inclin 6000 are the small
turbines with lowest installation cost per unit of capacity, 2.67 $/W for the Inclin 3000
and 2.01 $/W for the Inclin 6000. Further analysis of TABLE 2-4 shows that these two
small turbines produce the most amount of energy for the wind regimen we find in
Puerto Rico.
We assume that small wind turbines will be installed at a height of 25 m.
Figure 2-22 shows the Weibull pdf adjusted to 25 m height, for several sites in Puerto
Rico.
48
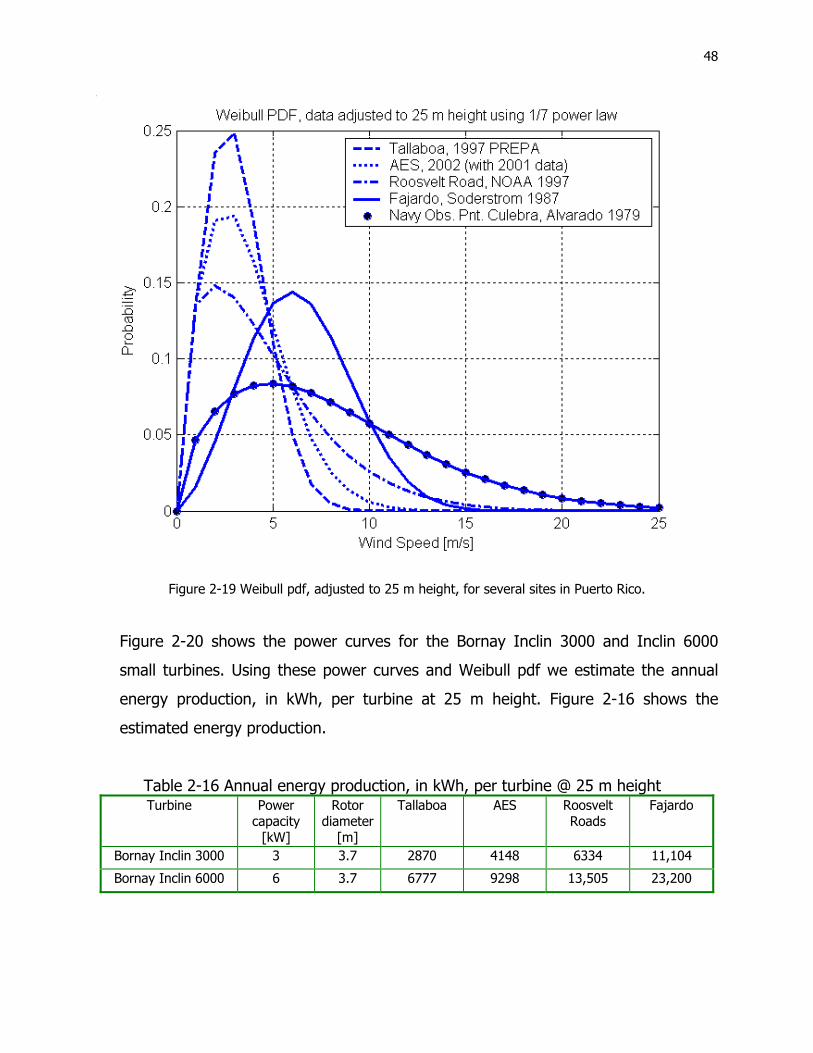
Figure 2-19 Weibull pdf, adjusted to 25 m height, for several sites in Puerto Rico.
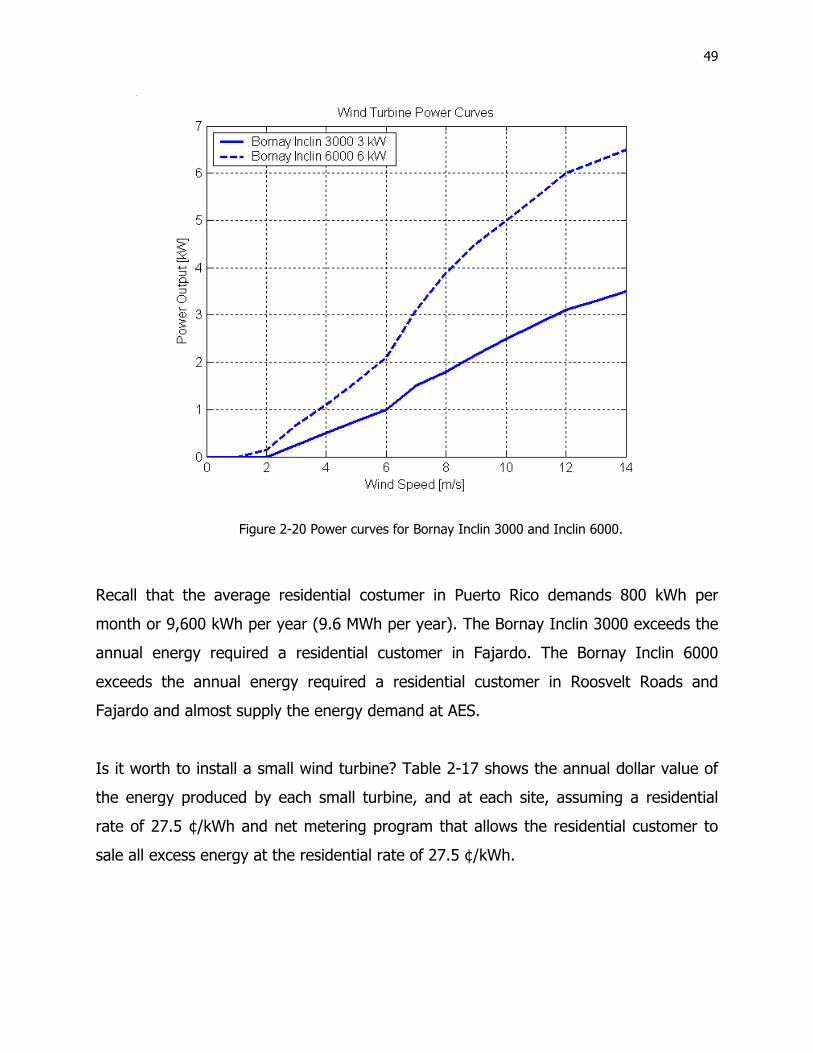
Figure 2-20 shows the power curves for the Bornay Inclin 3000 and Inclin 6000
small turbines. Using these power curves and Weibull pdf we estimate the annual
energy production, in kWh, per turbine at 25 m height. Figure 2-16 shows the
estimated energy production.
Table 2-16 Annual energy production, in kWh, per turbine @ 25 m height Turbine Power
capacity [kW]
Rotor diameter
[m]
Tallaboa AES Roosvelt Roads
Fajardo
Bornay Inclin 3000 3 3.7 2870 4148 6334 11,104
Bornay Inclin 6000 6 3.7 6777 9298 13,505 23,200
49
Figure 2-20 Power curves for Bornay Inclin 3000 and Inclin 6000.
Recall that the average residential costumer in Puerto Rico demands 800 kWh per
month or 9,600 kWh per year (9.6 MWh per year). The Bornay Inclin 3000 exceeds the
annual energy required a residential customer in Fajardo. The Bornay Inclin 6000
exceeds the annual energy required a residential customer in Roosvelt Roads and
Fajardo and almost supply the energy demand at AES.
Is it worth to install a small wind turbine? Table 2-17 shows the annual dollar value of
the energy produced by each small turbine, and at each site, assuming a residential
rate of 27.5 ¢/kWh and net metering program that allows the residential customer to
sale all excess energy at the residential rate of 27.5 ¢/kWh.
50
Table 2-17 Dollar value of annual energy production per turbine @ 25 m height
Turbine $/kWh Tallaboa AES Roosvelt Roads
Fajardo
Bornay Inclin 3000 0.275 $789 $1,141 $1,742 $3,054
Bornay Inclin 6000 0.275 $1,864 $2,557 $3,714 $6,380
Table 2-18 shows the present value of the energy produced by these small wind
turbines assuming an annual interest rate of 2.5% (a conservative inflation adjustment
for the cost of money), a fixed and unlikely electricity rate of 27.5 ¢/kWh and 20 years
of operation.
Table 2-18 Present worth of the energy produced by small wind turbines Turbine Estimated
cost of installed turbine
Tallaboa AES Roosvelt Roads
Fajardo
Bornay Inclin 3000 $12,000 $12,412 $17,939 $27,393 $48,021
Bornay Inclin 6000 $16,000 $29,308 $40,211 $58,405 $100,333
In all cases an investment in a small turbine returns a profit.
2.11 Offshore Wind Generation 2.11.1 Estimate of offshore area suitable for wind turbine installation
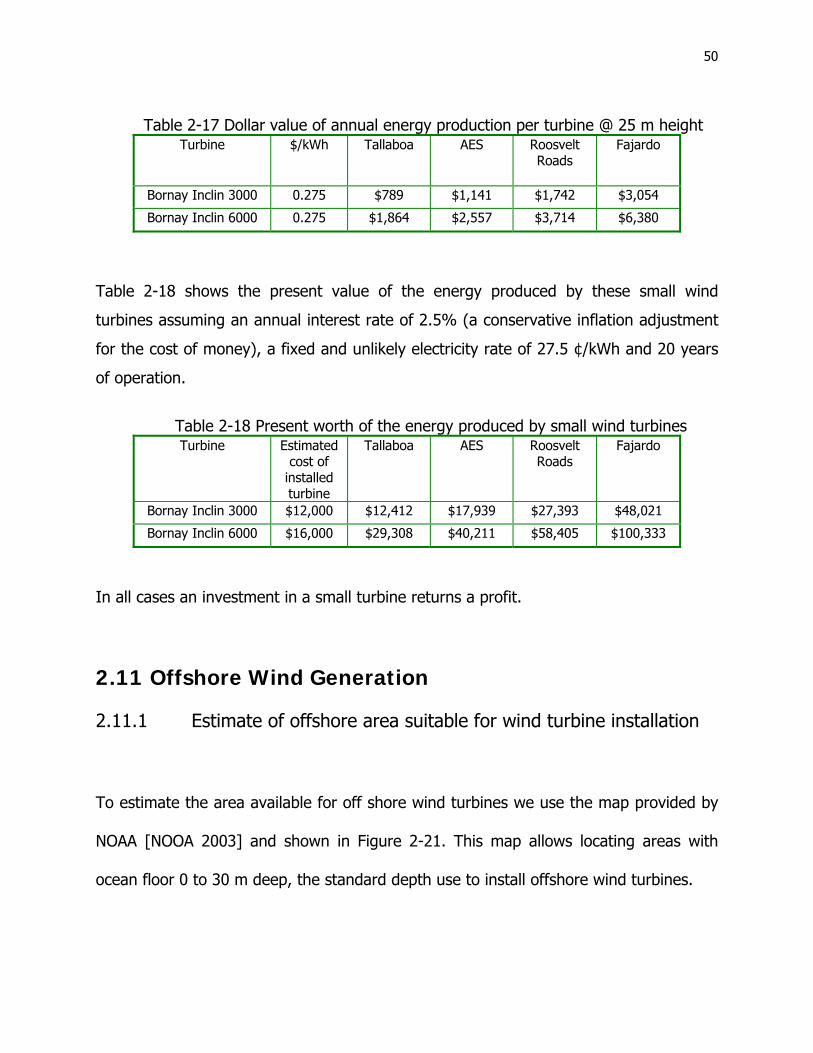
To estimate the area available for off shore wind turbines we use the map provided by
NOAA [NOOA 2003] and shown in Figure 2-21. This map allows locating areas with
ocean floor 0 to 30 m deep, the standard depth use to install offshore wind turbines.
51
Figure 2-21 Areas of suitable depth for offshore wind turbines [NOOA, 2003]
From this analysis the total suitable are for off-shore wind turbines installation is
approximately 2,745 km2.
2.11.2 Estimate of offshore wind power capacity
Assuming a power density of 5 MW/km2 the 2,745 km2 can accommodate 13,725 MW
of installed wind capacity. If only 10% is used we still have 1,372 MW.
60 x 32=1920 km2
55 x 15=825 km2
52
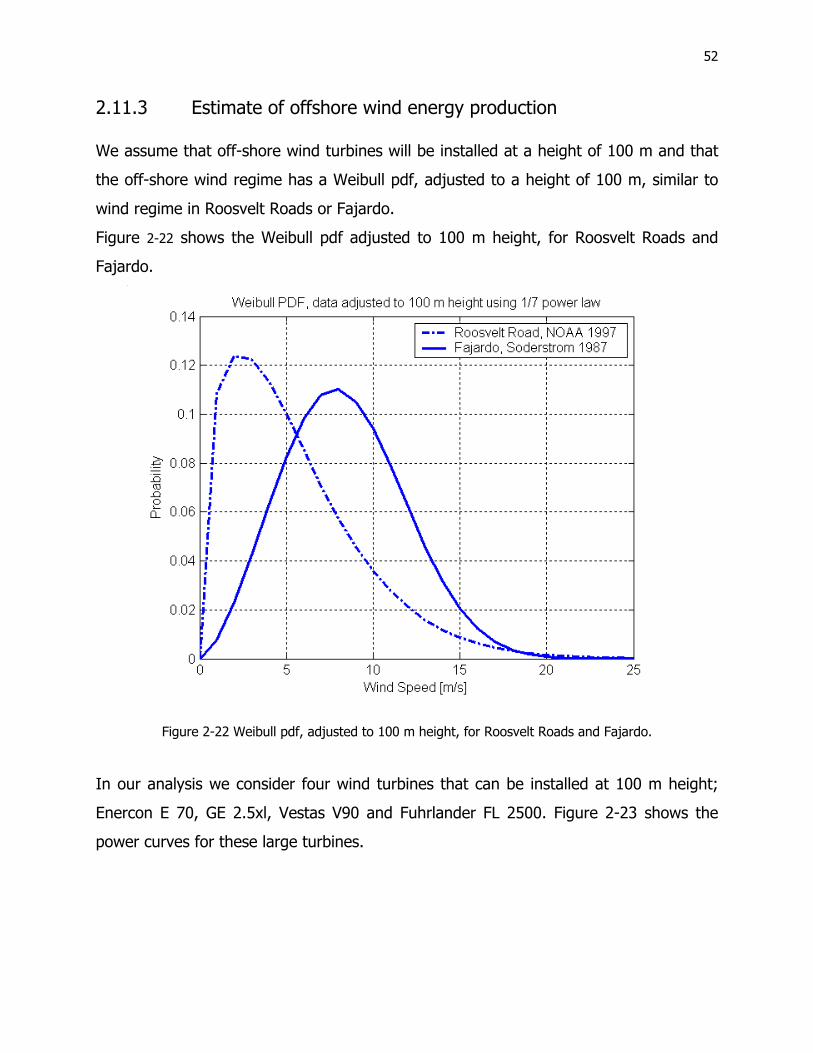
2.11.3 Estimate of offshore wind energy production
We assume that off-shore wind turbines will be installed at a height of 100 m and that
the off-shore wind regime has a Weibull pdf, adjusted to a height of 100 m, similar to
wind regime in Roosvelt Roads or Fajardo.
Figure 2-22 shows the Weibull pdf adjusted to 100 m height, for Roosvelt Roads and
Fajardo.
Figure 2-22 Weibull pdf, adjusted to 100 m height, for Roosvelt Roads and Fajardo.
In our analysis we consider four wind turbines that can be installed at 100 m height;
Enercon E 70, GE 2.5xl, Vestas V90 and Fuhrlander FL 2500. Figure 2-23 shows the
power curves for these large turbines.
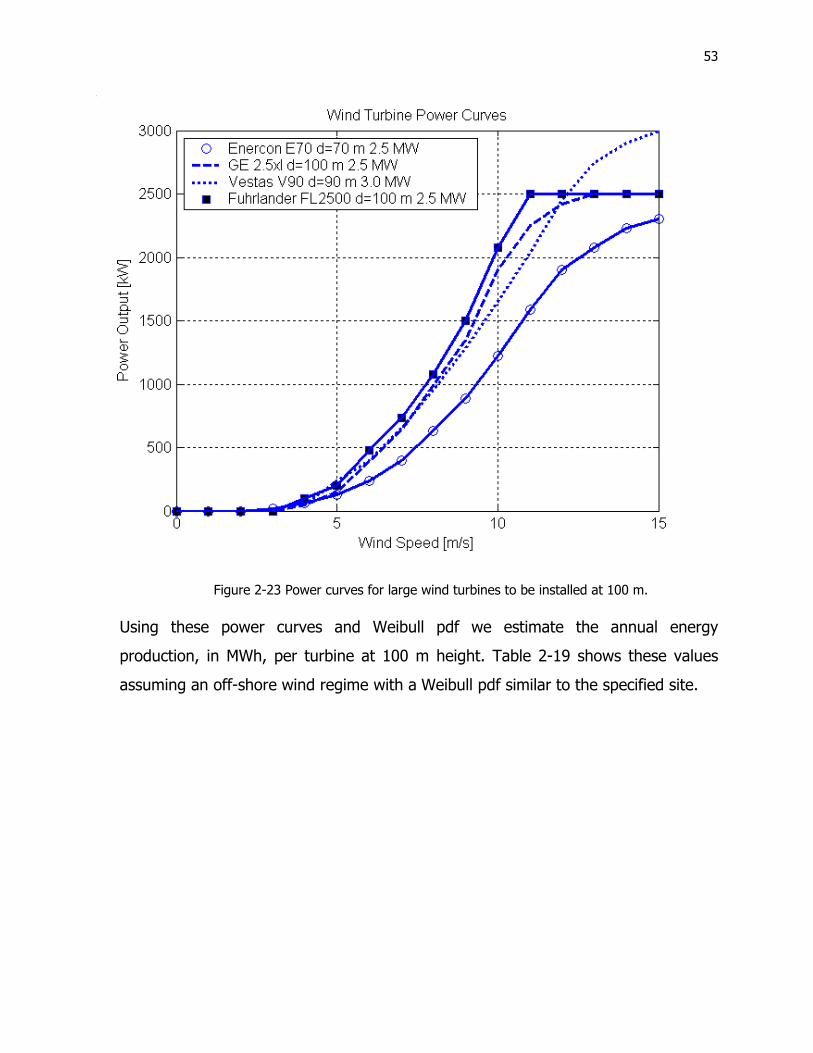
53
Figure 2-23 Power curves for large wind turbines to be installed at 100 m.
Using these power curves and Weibull pdf we estimate the annual energy
production, in MWh, per turbine at 100 m height. Table 2-19 shows these values
assuming an off-shore wind regime with a Weibull pdf similar to the specified site.

54
Table 2-19 Annual energy production, in MWh, per turbine @ 100 m height Turbine Power
capacity [MW]
Rotor diameter
[m]
Roosvelt Roads*
Fajardo*
Enercon E70 2.3 70 3118 7155
GE 2.5xl 2.5 100 4305 9864
Vestas V90 3.0 90 4339 9810
Fuhrlander FL2500 2.5 100 4759 10,680
* The off-shore wind regime is assumed to have a Weibull pdf, adjusted to 100 m height, and similar to the specified site.
Note that the Fuhrlander FL2500 produces more energy than any of the other wind
turbines even though its rated capacity of 2.5 MW is less than the 3.0 MW rated
capacity of the Vestas V90.
Assuming we were to use only 10% of the available off-shore area, 275 km2, and
Fuhrlander FL2500 turbines with spacing factor k=10, then 550 turbines could be
installed. Assuming an annual 4759 MWh per turbine the 550 turbines will generate
approximately 2,617,450 MWh per year.
Recall that the average residential costumer in Puerto Rico demands 800 kWh per
month or 9,600 kWh per year (9.6 MWh per year). These 550 off-shore turbines could
produce the annual energy required by 272,651 residential customers.
According to the “Banco de Desarrollo Económico de Puerto Rico” in 2006 Puerto Rico
demanded 20,600,000 MWh, thus these 550 off-shore turbines could produce 12.7% of
the energy required in 2006. If we were to use 50% of the available off-shore area to
install this type of turbines we will be able to produce approximately 63.5% of the
energy demanded in Puerto Rico in 2006. The latter case will require a new approach to
the operation of the electric grid.
55
2.12 Interconnection Issues
High penetration of intermittent wind power (greater than 20% of generation meeting
load) in the system faces fundamental technical and financial constraints with regards
to the connection of wind farms to the electrical network. These challenges include
power quality, active and reactive power flow, infrastructure, network stability, cost
recovery and profitability. Technically, it affects the network in the following ways and
has to be studied in detail [Zhenyu et al. 2006]:
1) Power flow - Ensure that the interconnecting transmission or distribution lines will
not be over-loaded. This type of analysis is needed to ensure that the introduction of
additional generation will not overload the thermal limit of the lines and other electrical
equipment. Both active and reactive power requirements should be investigated.
Reactive power should be generated not only at the interconnection point (PCC), but
also throughout the network, and should be compensated locally.
2) Short circuit - Determine the impact of additional generation sources to the short
circuit current ratings of existing electrical equipment on the network.
3) Transient stability - dynamic behavior of the system during contingencies, sudden
load changes and disturbances. Voltage and angular stability during these system
disturbances are important. In most cases, fast acting reactive-power compensation
equipment, including SVCs and STATCOMs, should be included for improving the
transient stability of the network.
56
4) Electromagnetic transients – Ensure these fast operational switching transients have
a detailed representation of the connected equipment, wind turbines, their controls and
protections, the converters, and DC links.
5) Protection – Investigate how unintentional islanding and reverse power flow may
have a large impact on existing protection schemes, philosophy, and settings.
6) Power leveling and energy balancing - Due to the fluctuating and uncontrollable
nature of wind power as well as the uncorrelated generation from wind and load, wind
power generation has to be balanced with other fast controllable generation sources.
These include gas, hydro, or renewable power generating sources, as well as short and
long-term energy storage, to smooth out fluctuating power from wind generators and
increase the overall reliability and efficiency of the system. The costs associated with
capital, operations, maintenance and generator stop-start cycles have to be taken into
account as well.
7) Power Quality - Fluctuations in the wind power and the associated power transport
(AC or DC), have direct consequences to the power quality. As a result, large voltage
fluctuations may result in voltage variations outside the regulation limits, as well as
violations on flicker and other power quality standards.
57
2.13 References [Archiba] VAWT Darrieus-windmill snapshot by A. Archiba [AWS Truewind] AWS Truewind Wind Resource of the US Virgin Island and Puerto Rico UTM, Zone 19N, WGS84 [Burton et al. 2001] T. Burton, D. Sharpe, N. Jenkins, E. Bossanyi, Wind Energy Hanbook, Wiley, 2001. [Creative Commons] Creative Commons Picture; CC-BY-SA-2.5. [DWIA 2003] Danish Wind Industry Association. June 2003. Guided Tour on Wind Energy. http://www.windpower.org/en/tour/index.htm [Gipe 2004] Paul Gipe, Wind Power for Home & Business, Chelsea Green Publishing Company,1993. [González 1998] L.C. González, "A Procedure to Determine Wind Power Capacity Value and its Future Application to Puerto Rico’s Electric Power System," M.S. dissertation, Dept. of Electrical Engineering, University of Puerto Rico, Mayagüez, P.R, 1998. [Mathew 2006] S. Mathew, Wind Energy Fundamentals Resources Analysis and Economics, Springer, 2006. [NOAA, 2003] Uri ten Brink, “Puerto Rico Trench 2003” Tracklines of the multibeam bathymetry cruises Summary and Results, U.S. Geological Survey, NOAA 2003. http://oceanexplorer.noaa.gov/explorations/03trench/welcome.html [NREL] U.S. Department of Energy-National Renewable Energy Laboratory. Wind Energy Resource Atlas of the United States. [Online]. Available: http://rredc.nrel.gov/wind/pubs/atlas/maps.html [Patel 2006] M. Patel, Wind and Solar Power Systems 2edt, Taylor & Francis Group, 2006 [Soderstrom] K. Soderstrom, "Wind Farm Assessment for Puerto Rico," Prepared for the Puerto Rico Office of Energy Office of the Governor and the Center for Energy and Environment Research University of Puerto Rico, May 1989. [The wind indicator 2005] The wind indicator (2005) Wind energy facts and figures from windpower monthly. Windpower Monthly News Magazine, Denmark, USA

58
[USDA Forest Service] C.B. Briscoe, “Weather In The Luquillo Mountains of Puerto Rico,” Forest Service U.S. Department of Agriculture, Institute of Tropical Forestry Rio Piedras, Puerto Rico, 1966. [USDE 2003] U.S. Department of Energy-National Renewable Energy Laboratory, "Wind Power Today," Prepared for the U.S. Department of Energy-Energy Efficiency and Renewable Energy, May 2003. [Wiki] Wikipedia , “Wind Turbine” Wikimedia Foundation, Inc, May 2005, http://en.wikipedia.org/wiki/Wind_turbine [World Wind Energy] World Wind Energy, Worldwide installed capacity and prediction 1997-2010, Source: http://www.wwindea.org [Zhenyu et al. 2006] Zhenyu Fan and Johan H.R. Enslin, “Wind Power Interconnection Issues in the North America” KEMA T&D Consulting, 3801 Lake Boone Trail, Ste200, Raleigh, NC 27613 USA, 2006.


![Plan de Negocios2[1] - Recinto Universitario de Mayagüez](https://static.fdocuments.net/doc/165x107/61f37ca344d8e926f127bb2a/plan-de-negocios21-recinto-universitario-de-mayagez.jpg)