CGE HANDS-ON TRAINING - UNFCCC · Web viewTier 1a – AD as natural gas consumption (m3) and EF...
38
CONSULTATIVE GROUP OF EXPERTS ON NATIONAL COMMUNICATIONS FROM PARTIES NOT INCLUDED IN ANNEX I TO THE CONVENTION (CGE)
-
Upload
nguyenkhanh -
Category
Documents
-
view
213 -
download
0
Transcript of CGE HANDS-ON TRAINING - UNFCCC · Web viewTier 1a – AD as natural gas consumption (m3) and EF...

CONSULTATIVE GROUP OF EXPERTS ON NATIONAL COMMUNICATIONS FROM PARTIES NOT INCLUDED
IN ANNEX I TO THE CONVENTION
(CGE)
HANDBOOK ON INDUSTRIAL PROCESSES SECTOR

CGE GHG Inventory Handbook (NAI)Industrial Processes Sector – Hands-on Training
TABLE OF CONTENTS
1.0 INTRODUCTION........................................................................................1
CHAPTER 1.......................................................................................................2
REVISED 1996 IPCC GUIDELINES APPROACH AND STEPS.........2
1.1 Definition of IP Sector Activities..........................................................................2
1.2 Differentiation Non-energy and Energy-related Emissions.....................................2
1.3 IPCC Source and Sub-source Categories or Disaggregation..................................2
1.4 Estimation Methods...............................................................................................31.4.1 Choice of Methods...........................................................................................31.4.2 Choice of Activity Data...................................................................................41.4.3 Choice of Default Emission Factors................................................................4
1.5 Tools Facilitating Choice of EF and Reporting..................................................41.5.1 IPCC Emission Factor Database.............................................................................41.5.2 Tools Facilitating Reporting............................................................................5
CHAPTER 2.......................................................................................................7
GPG2000 Approach and steps..........................................................................................7
2.1 Good Practice Principles.......................................................................................7
2.2 Choice of Methods – GPG2000 Approach...........................................................7
2.3 GPG2000 Potential Key Sources Identified........................................................7
CHAPTER 3.......................................................................................................9
REVIEW OF PROBLEMS ENCOUNTERED IN USING REVISED 1996 IPCC GUIDELINES, EFFECT,........................................................................................9
AND SUGGESTED APPROACHES AND GPG2000 OPTIONS..........................9
3.1 Difficulty in Disaggregation of Country Relevant Sources into IPCC Categories...........................................................................................................................9
3.2 Activity Data Collection and Confidential Business Information...................10
Page ii of 27

CGE GHG Inventory Handbook (NAI)Industrial Processes Sector – Hands-on Training
3.3 Emissions Estimation Methods and Reporting.................................................10
3.4 Sub-source Categories Not Listed in Revised 1996 IPCC Guidelines............11
3.5 Reporting of Non-energy Use of Fuel Feedstock..............................................11
3.6 Inappropriateness of Stoichiometric ratios as EFs...........................................11
3.7 Lack of Development of Country-specific Emission Factors...........................12
3.8 Use of Notation Keys in Reporting Tables 1& 2...............................................12
3.9 Activity Data Collection and Reporting............................................................12
3.10 Institutional Arrangements.................................................................................12
RECOMMENDED CAPACITY BUILDING..........................................................13
CHAPTER 4........................................................................................................14
GPG 2000 IMPROVEMENTS IN IP SECTOR INVENTORY...............................14
4.1 GPG 2000 Recommended good practice for AD and EFs estimation applying Revised 1996 IPCC Guidelines based on national circumstances...............................14
EMISSION FACTOR ESTIMATION (Tier 1)..........................................................................15
SUBSOURCE CATEGORY: 2A2: CO2-LIME PRODUCTION....................................15Estimate component lime EFs...............................................................................................15
PROCESS EMISSIONS ESTIMATION..................................................................................15
SUBSOURCE CATEGORY: 2C1: CO2-IRON AND STEEL PRODUCTION................16
Estimate emissions based on Tier 1 method as follows:..............................................................16
ESTIMATE AD FOR REDUCING AGENTS BASED ON PROCESS REACTION......................16
Estimate mass of reducing agent from coke and charcoal consumption based on stoichiometry of iron ore reduction in integrated iron and steel industry production including EAF electrodes where applicable.............................................................................................................................16
AD (Mass of reducing Agent)..................................................................................................16
Use DEFAULT EF by reducing agent type...............................................................................16
4.2 Aggregate emission factor Estimation.........................................................................17
Page iii of 27

CGE GHG Inventory Handbook (NAI)Industrial Processes Sector – Hands-on Training
Page iv of 27

CGE GHG Inventory Handbook (NAI)Industrial Processes Sector – Hands-on Training
Introduction
a) The Consultative Group of Experts hands-on training for Parties not included in Annex I to the Convention (non-Annex I Parties) for the Industrial Processes (IP) Sector inventories has been designed to address the main problems, which were encountered by non-Annex I Parties in the preparation of the initial national communications using the Revised 1996 IPCC Guidelines for National Greenhouse Gas Inventories (hereinafter referred to as the Revised 1996 IPCC Guidelines). The main objective is to build capacity of non-Annex I Parties’ participants in the application of currently available greenhouse gas (GHG) inventory tools and methods to improve IP sector inventories so as to facilitate the meeting of their obligations in inventory reporting under the UNFCCC guidelines for the preparation of national communications.
a) The training, which is participatory in nature, emphasizes, among other things, the demonstration of:
i. The use the IPCC Inventory Software, and the IPCC emission factors database (EFDB) to facilitate the application of the Revised 1996 IPCC Guidelines
ii. The accuracy of technology-based default emission factors (EFs), particularly in the IP sector (and build confidence in their application using the case of aluminium production in Ghana)
iii. How Good Practice Guidance and Uncertainty Management in National Greenhouse Gas Inventories (GPG2000) addresses the problems of methodological choices (tier level), activity data (AD), EFs, uncertainty estimation, prioritization of source categories to maximise resource use for specific IP sector source categories listed in GPG2000 based on national circumstances determined by the decision tree approach
iv. The advantages of the application of good practice principles to the Revised 1996 IPCC Guidelines source categories not listed in GPG2000, particularly where the default EFs are determined solely by the stoichiometric ratios of process reaction, to increase accuracy, transparency and comparability and reduce uncertainty
Page 1 of 27
CGE GHG Inventory Handbook (NAI)Industrial Processes Sector – Hands-on Training
Chapter 1
Revised 1996 IPCC Guidelines Approach and Steps
1.1 Definition of IP Sector Activities
Production-related emissions NOT classified under IP but under the Energy Sector are GHGs released from fuel combustion of feedstock in production activities as sources of energy/form of energy (i.e. heat, process steam or electricity generation).
1.2 Differentiation Non-energy and Energy-related Emissions
The chemical reactions involved in the source categories listed below are described in the specified sections in the Revised 1996 IPCC Guidelines Vol.3. The respective chemical equations generally indicate energy/heat requirement initiation and/or sustaining the chemical reaction kinetically and thermodynamically. The emissions associated with the energy input are not regarded as IP emissions and therefore not included in the emission factor estimation. They are accounted for under source category 1A2 – Manufacturing industries and construction in the energy sector. To avoid double counting, it is recommended that the NEU (non-energy uses) related emissions to be reported in the IP sector should be computed based on the use of the reducing agents, particularly for the source categories in metal production:
(a) Cement production 2.3.1 (b) Lime production , 2.4.1 (c) Soda ash production and use 2.6.1 (d) Ammonia production 2.8.1 and 2.8.2 (e) Silicon carbide 2.11.1(f) Calcium carbide 2.11.2 (g) Iron and steel 2.13.3.2 (h) Ferro alloys 2.13.5.1 (i) Aluminium 2.13.5.1
1.3 IPCC Source and Sub-source Categories or Disaggregation
The IPCC inventory software (electronic version of the IPCC worksheets) and the EFDB are tools that help to identify IPCC categorization/disaggregation.
Page 2 of 27

CGE GHG Inventory Handbook (NAI)Industrial Processes Sector – Hands-on Training
1.4 Estimation Methods
The general approach to estimation of IP emissions is the application of the equation below:
TOTALij = AD j x EF ijWhere:
TOTAL ij = process emission (tonne) of gas i from industrial sector jAD j = amount of activity or production of process material (AD) in industrial sector j (tonne/yr)EF ij = emission factor associated with gas i per unit of activity in industrial sector j (tonne/tonne)
1.4.1 Choice of Methods
For certain industrial processes, more than one estimation methodology is presented. These are:
Simplified approach referred to as Tier 1 More detailed methodology referred to as Tier 2.
Several options are also provided for certain industrial processes under Tier 1, as Tier 1a, 1b, 1c, based on data availability and suitability of methods. In such cases the order of preference for Tier 1 methods is 1a>1b>1c.
Typical selected tiers by sub-source categories in Revised 1996 IPCC Guidelines are summarized as follows:
a) 2B1 – Ammonia production (CO2)Tier 1a – AD as natural gas consumption (m3) and EF (kgC/m3)Tier 1b – AD as ammonia production (tonnes) and EF (tonne CO2/tonne NH3)
b) 2C5 – Calcium carbide production (CO2)T1a – Consumption of petroleum coke (tonne) and EF (tonne C/tonne coke type) T1b – Production of carbide
c) 2C – Metal production (iron and steel, Al, ferro-alloys)Tier 1a – Consumption of reducing agent (tonne) and EF (tonne C/tonne reducing agent) Tier 1b – Production of the metal (tonnes) and EF (tonne CO2/tonne metal)
d) PFCs from aluminium productionTier 1a – Direct plant emissions dataTier 1b – Estimation based on plant measurements and empirical estimation
Page 3 of 27

CGE GHG Inventory Handbook (NAI)Industrial Processes Sector – Hands-on Training
Tier 1c – Based on aluminium production (tonnes) and default emission factor (kg/tonne Al)
e) 2F – HCFC manufacture (HFC-23 release)Tier 1 – AD total production (tonnes) and Default EF (% of total production)Tier2 – Direct emissions from plant-specific measurements using standard methods
f) 2E – Consumption of ODS substitutes (HFCs, PFCs and SF6)Tier 1a and Tier b – Potential emissionsTier 2 – Actual emissions
1.4.2 Choice of Activity Data
Activity data sources include:
(a) Plant-level measurements or direct emissions reports with documented methodologies
(b) Where direct measurements are not available, estimations are based on calculation with plant-specific data
(c) International data set (United Nations data sets and industry associations) (d) National databases where available from appropriate government
ministries (e.g. statistics services, environmental protection agencies) (e) Standard production statistics from national statistical publications.
1.4.3 Choice of Default Emission Factors
The various types of emission factors can be classified as follows:
Process-reaction-based EFs (stoichiometric ratios) Production-based EFs Technology-specific EFs Reported country/region-specific plant-level measurements.
1.5 Tools Facilitating Choice of EF and Reporting
1.5.1 IPCC Emission Factor Database
The IPCC Emission Factor Database comprises different types default emissions factors, including process reaction stoichiometric ratios, technology-specific EFs, and country-specific documented factors that meets the IPCC database criteria.
The stoichiometric ratios are based on the process chemical reactions. The method assumes complete reaction, 100% purity factors of raw materials. They therefore represent a fairly good first estimate where plant-level and technology-specific emission factors are not available.
Page 4 of 27

CGE GHG Inventory Handbook (NAI)Industrial Processes Sector – Hands-on Training
The technology-based default EFs generally compare well with plant-level measurements where there is good practice at the industry level. For instance, the estimated CO2 emissions from plant-level activity data of a pre-baked anode process aluminium smelter in Ghana gave average specific net carbon consumption as 0.445 tonne C per tonne aluminium (Ghana’s initial national communication, 2000) over the operating period of 1990–1996 representing an emission factor of 1,630 tCO2/t aluminium based on net carbon consumption (figure 1). The corresponding IPCC technology-based default is 1.5 for pre-baked anode process (Revised 1996 IPCC Guidelines Vol.3 section 2.13.5) indicating that the technology-specific IPCC–D (default) approximates very well to plant level data and is therefore of low-level uncertainty.
1.5.2 Tools Facilitating Reporting
The IPCC inventory software (electronic version of the Revised 1996 IPCC Guidelines Vol.1 IPCC worksheets) employs default EFs (EF-D) from the IPCC EFDB to generate the emissions estimates when activity data are filled in the worksheets. The software also automatically generates inventory reporting IPCC Table 7A and 7B, which hither to inventory experts completed manually. The tool therefore avoids manual filling of worksheets and thus improves inventory compilation effectiveness and reduces reporting errors.
Page 5 of 27
CGE GHG Inventory Handbook (NAI)Industrial Processes Sector – Hands-on Training
The notation keys developed to improve completeness and transparency are summarized in box 1. The appropriate use of the keys as defined below shall be discussed, particularly “NE” and “NA”, to ensure that inventory experts use them to improve quality.
Box 1. Notation keys
NO (not occurring) for activities or processes that do not occur for a particular gas or source/sink category within a country NE (not estimated) for existing emissions and removals that have not been estimatedNA (not applicable) for activities in a given source/sink category that do not result in emissions or removals of a specific gasIE (included elsewhere) for emissions and removals estimated but included elsewhere in the inventory (Parties should indicate where the emissions or removals have been included)C (confidential) for emissions and removals that could lead to the disclosure of confidential business information (CBI).
Page 6 of 27

CGE GHG Inventory Handbook (NAI)Industrial Processes Sector – Hands-on Training
Chapter 2GPG2000 Approach and steps
2.1 Good Practice Principles
The general principles include key source analysis and determination key source categories for prioritization, and tier level determination by decision trees, choice of EFs, choice of AD, element of completeness and transparent AD , consistency in the time series, uncertainty assessment. The cross-cutting issues include reporting and documentation, and inventory quality assurance/quality control (QA/QC).
The main objectives include producing inventories, which neither overestimate nor underestimate emissions so far as can be judged based on the principle of TCCCA, namely: transparency, consistency over time, completeness, comparability and accuracy.
The others are:(a) To use limited resources more efficiently for key sources(b) To reduce levels of uncertainty(c) To improve reporting and documentation(d) To apply QA/QC.
2.2 Choice of Methods – GPG2000 Approach
(a) Identifies potential IP sector key source categories(b) Provides decision tree analysis for the selected sources (c) Describes source-category-specific good practice methods in adapting the
Revised 1996 IPCC Guidelines to country-specific circumstances(d) Defines tier numbers for alternative names of methods that are described
in the Revised 1996 IPCC Guidelines but which are not numbered(e) Provides good practice guidance for various tier levels of assessment
(Tiers 1, 2, 3) for selected source categories
2.3 GPG2000 Potential Key Sources Identified
The good practice guidance has been developed for major emissions source categories, which could be potential key sources in many countries based on trends and absolute levels or both. The sources are listed as follows:
2A1 – CO2 Emissions from Cement Production2A2 – CO2 Emissions from Lime Production2C1 – CO2 Emissions from the Iron and Steel Industry2B3 and 2B4 – N2O Emissions from Adipic Acid and Nitric Acid Production 2C3 – PFCs Emissions from Aluminium Production2C4 – Sulfur hexafluoride (SF6) emissions from Magnesium Production
Page 7 of 27

CGE GHG Inventory Handbook (NAI)Industrial Processes Sector – Hands-on Training
2E1 – HFC-23 Emissions from HCFC-22 Manufacture2F(1-5) – Emissions from Substitutes for Ozone Depleting Substances (ODS substitutes) from HFCs and PFCs used in refrigeration, air-conditioning, foam blowing, fire extinguishers, aerosols, solvents)2F7 – SF6 Emissions from Electrical Equipment2F8 – SF6 Emissions from Other Sources of SF6
2E3 – SF6 Emissions from Production of SF6
2F6 – PFC, HFC, and SF6 Emissions from Semiconductor Manufacturing.
Good Practice Guidance has not yet been developed for the following source categories described in the Revised 1996 IPCC Guidelines, Chapter 2, Industrial Processes: limestone and dolomite use (including use in the iron and steel industry), soda ash production and use, production and use of miscellaneous mineral products, ammonia production, carbide production, production of other chemicals, ferroalloys, CO2 emissions from aluminium production, other metal production, SF6 used in aluminium and magnesium foundries; pulp and paper industries, and food and drink industries.
For sources not covered by GPG2000, the principles of good practice should be adopted to improve quality. The main purpose of good practice guidance is to produce inventories that meet the TCCCA criteria. The approach helps ensure that the limited resources available to conduct inventories are used efficiently and that uncertainty is reduced. It is good practice to use higher tiers for key sources (i.e. source-category-specific good practice methods) for preparation of estimates.
Page 8 of 27
CGE GHG Inventory Handbook (NAI)Industrial Processes Sector – Hands-on Training
Chapter 3
Review of Problems Encountered in Using Revised 1996 IPCC Guidelines, Effect, and Suggested Approaches and GPG2000 Options
Specific problems identified by non-Annex I Parties and the impacts on the inventory quality are outlined in point form as follows. Suggested approaches and GPG2000 options, where applicable, are also provided.
3.1 Difficulty in Disaggregation of Country Relevant Sources into IPCC Categories
Problem: Difficulty in disaggregating country relevant sources into IPCC categories.
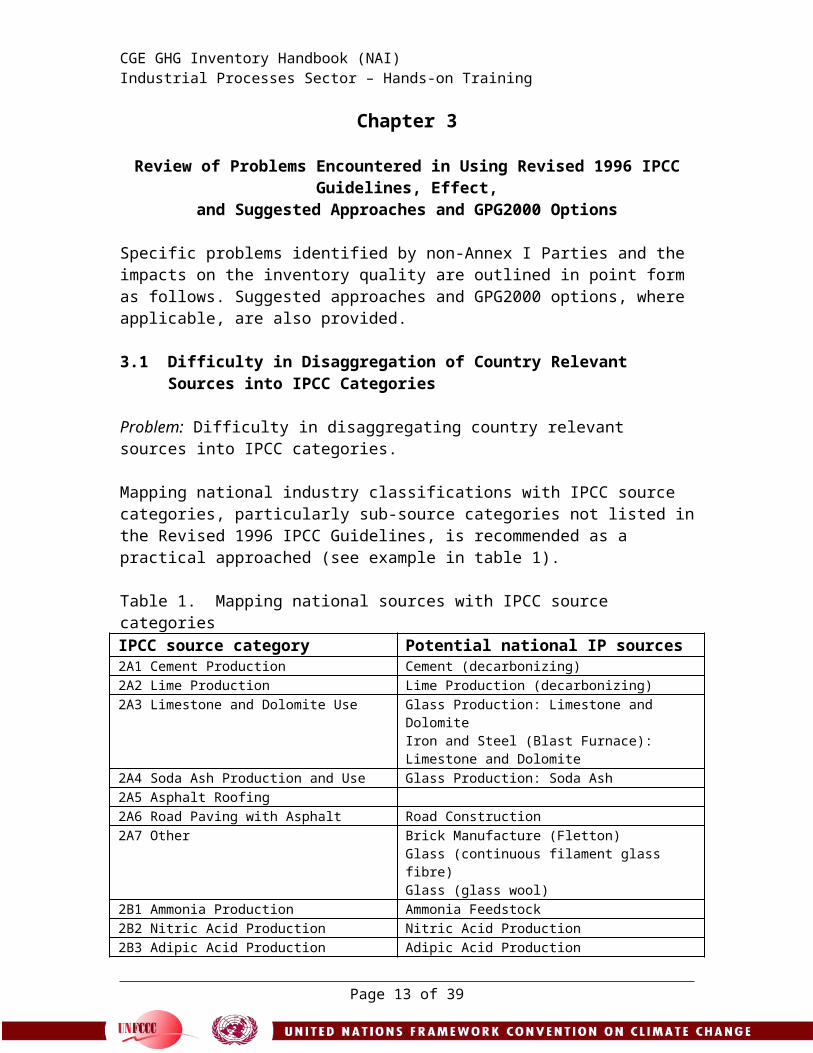
Mapping national industry classifications with IPCC source categories, particularly sub-source categories not listed in the Revised 1996 IPCC Guidelines, is recommended as a practical approached (see example in table 1). Table 1. Mapping national sources with IPCC source categoriesIPCC source category Potential national IP sources2A1 Cement Production Cement (decarbonizing)2A2 Lime Production Lime Production (decarbonizing)2A3 Limestone and Dolomite Use Glass Production: Limestone and Dolomite
Iron and Steel (Blast Furnace): Limestone and Dolomite
2A4 Soda Ash Production and Use Glass Production: Soda Ash2A5 Asphalt Roofing2A6 Road Paving with Asphalt Road Construction2A7 Other Brick Manufacture (Fletton)
Glass (continuous filament glass fibre)Glass (glass wool)
2B1 Ammonia Production Ammonia Feedstock2B2 Nitric Acid Production Nitric Acid Production2B3 Adipic Acid Production Adipic Acid Production2B4 Carbide Production2B5 Other Sulphuric Acid Production
Chemical IndustryChemical Industry (Carbon Black)Chemical Industry (Ethylene)Chemical Industry (Methanol)Chemical Industry (Nitric Acid Use)Chemical Industry (Pigment Manufacture)Chemical Industry (Reforming)Chemical Industry (Sulphuric Acid Use)Coal, tar and bitumen processesSolvent and Oil recoveryShip purging
2C1 Iron and Steel Iron and Steel (other)Iron and Steel (Basic Oxygen Furnace)Iron and Steel (Electric Arc Furnace)
Page 9 of 27
CGE GHG Inventory Handbook (NAI)Industrial Processes Sector – Hands-on Training
IPCC source category Potential national IP sourcesIron and Steel Flaring (Blast Furnace Gas)Rolling Mills (Hot & Cold Rolling)
2C2 Ferroalloys Productions No Comparable Source Category2C3 Aluminium Production Non-Ferrous Metals (Aluminium Production)2C4 SF6 Used in Aluminium and Magnesium Foundries
SF6 Cover Gas
2C5 Other Non-Ferrous Metals (other non-ferrous metals)Non-Ferrous Metals (primary lead/zinc)Non-Ferrous Metals (secondary Copper)Non-Ferrous Metals (secondary lead)
2D1 Pulp and Paper Wood Products Manufacture2D2 Food and Drink Brewing (barley malting, fermentation, wort boiling)
Bread BakingCider ManufactureOther Food (animal feed; cakes, biscuits, cereals; coffee, malting, margarine and other solid fats; meat, fish and poultry; sugar)Spirit Manufacture (barley malting, casking, distillation, fermentation, maturation, spent grain drying)Wine Manufacture
2E1 Halocarbon & SF6 By-Product Emissions2E2 Halocarbon & SF6 Fugitive Emissions
Halocarbons Production (By-Product and Fugitive)
2E3 Halocarbon & SF6 Other Not Estimated2F1 Refrigeration & Air Conditioning Refrigeration
Supermarket RefrigerationMobile Air Conditioning
2F2 Foam Blowing Foams2F3 Fire Extinguishers Fire Fighting2F2 Aerosols Metered Dose Inhalers
Aerosols (Halocarbons)2F2 Solvents Not Occurring2F2 Other Electronics
Training ShoesElectrical Insulation
3.2 Activity Data Collection and Confidential Business Information
Problem: Direct reporting of emissions without AD and/or EF to national institutions responsible for data collection because of confidential business information (CBI).
This reduces transparency and comparability. GPG2000 recommends plant-level verification and assessment of the measurement standards and QA/QC plan of the industry.
Page 10 of 27
CGE GHG Inventory Handbook (NAI)Industrial Processes Sector – Hands-on Training
3.3 Emissions Estimation Methods and Reporting
Problem: The reporting of industrial process emissions from non-energy use of feedstock produced in combination with fuel combustion under the Energy Sector due to the difficulty in differentiation and possible double counting of CO2. The problem leads to underestimation of the contribution of the IP sector to national emissions (e.g. the use of natural gas in ammonia production, and coke as reducing agent in iron and steel production). GPG2000 recommends stoichiometric estimation of the NEU and subtraction from the energy statistics to avoid double counting.
3.4 Sub-source Categories Not Listed in Revised 1996 IPCC Guidelines
Problem: Direct plant-level reporting of industrial process emissions of CO2 from chemical processes or stage processes in combination with fuel combustion emissions from energy uses of feedstock under the Energy Sector (e.g. CO2 emissions from CaCO3 decomposition reactions that use metallurgical coke or other fossil fuels as energy sources (e.g. cement, lime, and carbide production)).
This leads to underestimation of IP sector emissions and contribution to national totals. GPG2000 recommends QA/QC checks of the industry and plant-level verification.
3.5 Reporting of non-energy Use of Fuel Feedstock
Problem: The reporting of non-energy use of fuel feedstock in Energy Sector due to the difficulty in distinguishing whether a process emission from the fuel feedstock is a energy related or industrial-processes-based.
This leads to underestimation of IP sector emissions and contribution to national totals (e.g. oxidation of coke used as a reducing agent in iron and steel production, which releases heat. GPG2000 recommends QA/QC checks of the industry and plant-level verification, and the estimation of the IP emissions from the stoichiometric reactions based on the mass of reducing agent.
3.6 Inappropriateness of Stoichiometric ratios as EFs
Problem: Where technology-specific or plant-level data are not available, EF (default) is based on stoichiometric ratios of process reactions.
This leads to over/underestimation by not taking into account factors that influence the emissions, including per cent purity of raw materials and products, emissions mitigation technologies, raw material or product types/composition and production/process efficiency factors. Further, it increases the uncertainties in EFs.
Page 11 of 27
CGE GHG Inventory Handbook (NAI)Industrial Processes Sector – Hands-on Training
GPG2000 provides guidance on choice of EFs and AD to correct any errors or deficiencies and compensate for the significant factors ignored by applying the Revised 1996 IPCC Guidelines, thus improving accuracy and reducing uncertainties.
3.7 Lack of Development of Country-specific Emission Factors
Problem: Lack of development of plant-level EFs, which leads to the estimation of EFs based on top-down ratios calculated as EF = Emissions / Aggregate AD. Such EFs lack transparency and comparability, and the method is not considered good practice.
GPG2000 provides good practice based on a decision tree approach to applying Revised 1996 IPCC Guidelines (see chapter 4, table 2, below).
3.8 Use of Notation Keys in Reporting Tables 1and 2
Problem: Inappropriate use and/or limited use of notation keys (“NO”, “NE”, “NA”, “IE”, “C”) in UNFCCC reporting Table 1 and Table 2.
This results in lack of transparency and does not address completeness of the inventory coverage (see box 1).
3.9 Activity Data Collection and Reporting
a) Production data on large point sources may be available in various national institutions in data sets that are not easily converted to GHG inventory data
b) Where available, mandatory or voluntary plant-level data reports total emissions without AD and EF
c) Lack of activity data or deficiencies in data collection in the informal/small point sources
d) Mandatory industry reports (e.g. annual environmental reports) provide only emissions estimates without AD and/or EF
e) Lack of IPCC default EFs due to differences in IPCC source and sub-source categories and disaggregation of country-relevant sources.
3.10 Institutional Arrangements
Specific issues raised on institutional arrangement include:
a) National institutions and industry associations collect and present data in formats not appropriate for GHG estimation because they are normally aggregated in data sets relevant for the purposes for which the date were collected
b) Limited awareness among industry/industry associations of opportunities under the Convention and therefore lack of motivation to develop capacity for reporting GHG inventories.
c) Lack of institutional arrangements and clarity over roles and responsibilities of experts carrying out the technical studies
Page 12 of 27
CGE GHG Inventory Handbook (NAI)Industrial Processes Sector – Hands-on Training
d) Lack of legal and institutional authority to demand data from industry to carry out the inventories (reporting is basically voluntary)
e) Non-involvement of universities and/or research centres that could help evolve a more sustainable inventory system
f) Lack of mainstreaming climate change related data collection by national statistical services and industry associations
g) Lack of QA/QC and uncertainty analysis by data collection institutions.
Recommended capacity building
a) Institute a national working group of relevant stakeholders for plant-level verification and peer review of the inventory report
b) Organize a capacity-building seminar for all institutions and relevant GHG contributing industries to disseminate the IP inventory data sets, convey the need for QA/QC and plant-specific good practice for development and reporting AD and EFs in GHG inventory data sets
c) Adapt Revised 1996 IPCC Guidelines and GPG2000 and develop country-specific workbooks documenting methods, AD, and EFs to increase transparency and preserve institutional memory
d) In a capacity-building workshop disseminate information about opportunities for emission reduction under the Convention and the Financing Mechanisms under the Kyoto Protocol to motivate industry participation.
Page 13 of 27
CGE GHG Inventory Handbook (NAI)Industrial Processes Sector – Hands-on Training
Chapter 4GPG 2000 Improvements in IP Sector Inventory
The source categories that are potentially key sources and for which good practice has been developed are listed in section 2.3 4.2.1. Unlike the Revised 1996 IPCC Guidelines, where tiers are specified for some sources, GPG2000 introduces systematic methodologies that facilitate the choice of the tier level of assessment (the tier approach). It uses a decision tree and key sources for determination of tiers for all sources for which good practice guidance has been developed. Sample decision trees are referenced as follows:
a) 2A1 – Cement production (CO2 figure 3.1 pg 3.11, in GPG2000)b) 2C1 – Iron and Steel Production (CO2 figure 3.2 pg 3.21)c) 2B1 and 2B2 – Nitric Acid and Adipic Acid (NO2) (figure 3.4 pg 3.32)d) 2C1 – Aluminium production (PFC) (figure 3.5 pg 3.40)e) 2C – Use of SF6 in magnesium production (SF6) (figure 3.6 pg 3.49)f) 2E and 2F – ODS Substitutes (figure 3.11 pg 3.80).
4.1 GPG2000 Recommended Good Practice for AD and EFs Estimation Applying Revised 1996 IPCC Guidelines Based on National Circumstances
The problems associated with lack of appropriate AD (particularly purity factors and process technologies considerations that influence the levels of emissions) and default emission factors inappropriate to national circumstances are resolved in GPG2000 source categories by providing good practice methods that apply Revised 1996 IPCC Guidelines to various national circumstances.
Tables 2.1 to 2.3 summarize sample GPG2000 recommended good practice in adapting the Revised 1996 IPCC Guidelines to country-specific circumstances for estimation of EFs and/or AD where plant-level data or country specific (CS) emission factors are unavailable.
Table 2.1. 2A1 CO2 – Cement production, from GPG2000
Sub-source category: 2A1 CO2 – Cement productionNational circumstance GPG2000 2000 Good Practice Approach ReferencePlant-level clinker production data not available
Obtain AD from national cement statistics, industry association, or international data sources
Decision Tree Figure 3.1 of GPG2000Estimate emissions using Tier 1 method based on cement
data based on clinker produced in countryCement types are known
Use default fractions for various cement types to estimate clinker fractions in each cement type
Tables 3.1, 3.3A; 3.3B of GPG2000
Fraction of cement types not available
Use default fractions (e.g. 95% clinker for essentially Portland cement) (Note: 98% default in Revised 1996 IPCC Guidelines is considered too high by GPG2000)
GPG2000page 3.14 para 1
CaO content of clinker not available
Use default lime (CaO) content value of 65%
Page 14 of 27

CGE GHG Inventory Handbook (NAI)Industrial Processes Sector – Hands-on Training
Sub-source category: 2A1 CO2 – Cement productionNational circumstance GPG2000 2000 Good Practice Approach Reference
EMISSION FACTOR ESTIMATION (Tier 1)Country-Specific EF not developed and documented
Estimate EF emissions based on Equation 3.3 (EF = 0.785 tonne CO2/tonne pure lime * CaO pure lime/tonne pure clinker) * f pure clinker/total clinker (with other non-carbonaceous materials, e.g. gypsum-CaSO4)
GPG2000page 3.12
PROCESS EMISSIONS ESTIMATION (Tier 1)Process emissions not estimated for because of lack of EF
For Portland cement :EF = stoichiometric ratio (0.785) * Default lime content in clinker depending on cement type(s) (CaO) * Default clinker ratio (f) Where:Stoichiometric ratio = 0.785 tonne CO2/tonne pureDefault lime content in clinker = 0.65 pure lime/tonne pure clinkerDefault clinker ratio = 0.95 pure clinker/tonne total clinker= 0.785 tonne CO2/tonne pure lime * 0.65 pure lime/tonne pure clinker * 0.95 pure clinker/tonne total clinker = 0.485 tonne CO2/tonne total clinkerEmissions = AD tonnes total clinker/year x EF tonne CO2/tonne total clinker
Table 2.2. 2A2 CO2 – Lime production, from GPG2000
Sub-source category: 2A2 CO2 – Lime productionNational circumstance Recommended good practice ReferencePlant-level lime production data not available
Estimate total production (from national statistics, industry associations, international data)
Decision Tree Figure 3.2 of GPG 2000
Include estimate of commercial and captive lime production from other sources, e.g. iron and steel plants
Fractions (purity) of lime types not available
Use default CaO and CaOMgO fractions (purity) Table 3.4of GPG2000
f (quick lime) = 0.95 tonne pure CaO/tonne total lime GPG2000Table 3.4 f (dolomite) = 0.85/95 tonne CaOMgO/tonne total
dolomitef (hydraulic lime) = 0.75 tonne CaO/tonne total hydraulic
Country-specific EFs not developed
EF estimation method
EF (by lime type) = stoichiometric ratio (lime type) x purity factors (f) (by lime type)Estimate component lime EFsEF (quick lime) = 0.785 x f(1) = 0.785x0.95 = GPG2000
Table 3.4 EF (dolomite lime) = 0.913 x f(2) = 0.913 x 0.85 =EF (hydraulic lime) = 0.785 x f(3) = 0.785 x 0.75=
Fractional composition of lime available
Estimate aggregate EF based on fractions of lime types using equations 3.5A and 3.5BEF (aggregate):= p x EF (quick lime)+ q x EF (dolomite) + r x EF (hydraulic lime) where p, q, r are proportions/lime fractions by type GPG2000
page 3.20PROCESS EMISSIONS ESTIMATIONCO2 Emissions = Aggregate EF tonne/tonne total aggregate lime x AD tonne total aggregate lime
Page 15 of 27

CGE GHG Inventory Handbook (NAI)Industrial Processes Sector – Hands-on Training
Table 2.3. 2C1 CO2 – Iron and steel production, from GPG2000
Sub-source category: 2C1 CO2 – Iron and steel productionNational circumstance Recommended good practice ReferenceData on reducing agents or plant-specific information on fuels used as reducing agent (CO, H2, natural gas) not available
Use nationally compiled production data on iron/steel production
Decision Tree Figure 3.3of GPG2000
Country-specific methodology not developed and/or documented
Estimate emissions based on Tier 1 method as follows:
ESTIMATE AD FOR REDUCING AGENTS BASED ON PROCESS REACTION
Process Reaction: Fe2O3 + 3C = 2Fe + 3/2 CO2
Stoichiometric ratio = 36 tonnes C/ X tonnes of pig iron Estimate mass of reducing agent from coke and charcoal consumption based on stoichiometry of iron ore reduction in integrated iron and steel industry production including EAF electrodes where applicableAD (mass of reducing agent)= 36 tonnes C/X tonnes pig iron x Q total pig
iron productionLack of emission factors (EF)
Use DEFAULT EF by reducing agent type
Coal 2.5 tonne CO2/tonne reducing agent
Revised 1996 IPCC GuidelinesTable 2-12 Coke 3.1 tonne CO2/tonne reducing
Petrol coke 3.6 tonne CO2/tonne reducing agent
Source category not estimated (NE)
PROCESS EMISSIONS ESTIMATION
Estimate emissions based on mass of reducing agents using default EFs
GPG2000Table 3.6
CO2 emissions = EF tonnes CO2/tonne reducing agent C (type) x AD tonne C (type) Subtract fuels used as reducing agent from 1A1-fuel combustion sub-source to avoid double counting
Decision tree 3.3 Box 1of GPG2000
Note: The method overestimates net CO2
emissions by the neglect of carbon storage from steel production (default mass storage C = 2.5–3.5 kg/tonne steel)
Revised 1996 IPCC Guidelines, section 2.13.3.2
Page 16 of 27

CGE GHG Inventory Handbook (NAI)Industrial Processes Sector – Hands-on Training
4.2 Aggregate Emission Factor Estimation
Aggregate emission factor estimations are also normally reported without the required transparency. Sample estimations of aggregate EFs using the Revised 1996 IPCC Guidelines’ default and good practice principles are thus presented as follows:
CO2: 2.A.2 Lime Production, Revised 1996 IPCC Guidelines Aggregate EF (default) Estimation
CO2 emissions = EF x Lime productionWhere :EF (lime) = f x EF f = purity/lime content assumed 100% in IPCC (default)EF = Stoichiometric ratio assuming that the purity of lime f = 100%EF(1) (quick lime) = x = 0.79 tonne/tonne limeEF (2) (dolomite lime) = y = 0.91 tonne/tonne limeEF(3) (hydraulic lime) = z = 0.79 tonne/tonne lime
Aggregate EF (Default) = xEF(1) + yEF(2) + zEf (3) = 0.79x + 0.91y + 0.79z
Where x, y and z represent proportions in the lime
Aggregate EF applying good practice principles:
CO2 emissions = EF x Lime production WhereEF (lime type) = f x EF f is CaO content (GPG 2000, Equation 3.5A pg 3.20)f is also a function of lime type given as follows (GPG 2000 Table 3.4)Hi-calcium = 0.95Dolomitic = 0.85/0.95Hydraulic = 0.75
The component EFs applying the purity factors as a function of lime type are as follows:EF (quick lime) = 0.785 f(1) tonne CO2/tonne limeEF (dolomite lime)= 0.913 f(2) tonne CO2 /tonne dolomite limeEF (hydraulic lime)= 0.785 tonne CO2/tonne lime
The aggregate EF based on fractions of the lime types in country’s lime production is estimated as follows:
EF (aggregate) = (p*0.785*0.95) + (q*0.913*0.85) + (r*0.785*0.75)Where p, q, and r represent the fraction of the lime types.
Page 17 of 27

CGE GHG Inventory Handbook (NAI)Industrial Processes Sector – Hands-on Training
4.3 GPG 2000 Improved AD and EFs Compared to Revised 1996 IPCC Guidelines Based on National Circumstances and Decision Trees
Tables 2.4–2.7 summarize sample GPG2000 recommended good practice in adapting the Revised 1996 IPCC Guidelines to country-specific circumstances for estimation of EFs and/or AD based on the decision trees and national circumstances regarding various levels of data availability. For instance, the emission factors for cement production in tonne CO2 per tonne cement production are 0.499 (Revised 1996 IPCC Guidelines default) and 0.507 (Tier 1) and 0.520 (Tier 2) (GPG2000). The analysis based on the good practice guidance demonstrates the differences in EFs depending on the types of activity data available at the country level.
Page 18 of 27

CGE GHG Inventory Handbook (NAI)Industrial Processes Sector – Hands-on Training
Table 2.4. 2A1 – CO2 from cement production
Page 19 of 27
CGE GHG Inventory Handbook (NAI)Industrial Processes Sector – Hands-on Training
Table 2.5. 2A2 – CO2 from lime production
Page 20 of 27

CGE GHG Inventory Handbook (NAI)Industrial Processes Sector – Hands-on Training
Table 2.6. 2A 3 – Limestone and dolomite use (based on good practice principles)
Source CategorySub-Source CategoryBrief Process Activity
Country Activity
Quick lime (CaO + impurities) CO2/CaCO3=0.440t/t
Dolomite Lime (CaOMgO + impurities) CO2/CaCO3MgCO3=0.477t/t
General Reference
Inventory elements Re96GL Good Practice Principle (GPG not developed )
Activity Data Default purity factor=100% where data on fractional purity is not available
Default purity factors provided (GPG 2000 Table 3.4)
High Calcium Lime =0.95Dolomite Lime= 0.85/0.95
Issues
Emission Factor by limestone type
EF (lime type) = stoichiometric ratio*purity factors (f) EF (lime type) = stoichiometric ratio*purity factors (f)
Calcium Carbonate 0.440 tCO2/ton CaCO3 EF(1) =0.440*f(1)
Dolomite 0.477 tCO2/t CaCO3MgCO3 EF(2)= 0.477*(f2)
Aggregate Emission factor
p*0.440 + q*477 where p,q are fraction of limestone by type
p*440 *f(1) + q*0.477 *f(2) where p,q are proportions/fracyion of limestone type and (f ) the purity factors provided in GPG 2000 Table 3.4
Uncertainty Assessment
TABLE 2.3 : Summary of Improvement in AD and EF by GPg 2000
2A Mineral Production2A3-Limestone and Dolomite Use Industrial applications of limestone (CaCO3) and dolomite (CaCO3.MgCO3) at high temperatures leads to their dissociation and release of CO2. The commercial applications include their use in iron and steel, glass manufacture , agriculture, construction and environmental pollution control.
Occurring if limestone and dolmite are use in commercial applications that produce CO2. All uses of limestone and dolomite except for cement production are included in this source category.
Types of Products and stoichiometric ratios
IPCC Guidelines 2.4IPCC good practice guidance and Uncertainty Management in National Greenhouse Gas Inventories section 3.1.2Chapter IV: Industrial Processes Sector Issues
The stoichiometric ratio is an exact number, and the uncertainty of the emission factor is therefore the uncertainty of limestone/dolomite composition, and in the activity data collection.
Different limestone/dolomite types lead to different stochiometric ratios, and hence to different emission factors. Complete activity data include both limestone/dolomite production data and data onlimestone/dolomite structure (including types and proportion of hydrated limestone/dolomite).
Apparent Consumption of limestone or dolomite is assumed to equal material mined (or dredged) plus material imported minus material exported.
CO2 from liming of agricultural soils should be reported in Land-Use Change and Forestry.
Page 21 of 27

CGE GHG Inventory Handbook (NAI)Industrial Processes Sector – Hands-on Training
Table 2.7. 2C1 – CO2 from iron and steel production
Page 22 of 27

CGE GHG Inventory Handbook (NAI)Industrial Processes Sector – Hands-on Training
Table 2.7. 2C1 – CO2 from iron and steel production (continued)
Source CategorySub-Source CategoryEmission Estimation Method
Calculates emissions from the production-based emissions factor (not a good practice )
Calculates emissions from the consumption of the reducing agent (e.g. coke from coal, coal, petroleum coke), using emission factors similar to those used to estimate combustion emissions
Method is similar to Tier 1 but includes a correction for the carbon stored in the metals produced
Subtracts fuel reported as energy requirement from total fuel used in the iron ore reduction
Estimates separately emissions from pig iron production and steel production (Total Emissions = (pig iron) + Emissions (steel)
Amount of fuel used for reduction can be calculated from the stoichiometric ratios of the iron ore reduction
Uncertainty Levels
2C1: CO2 Iron Steel Production (contd)
carbon content of pig iron, crude steel, and of iron ore
reducing agent
25-50% for non-plant data
5% for plant specific data
General Issues Where feedstocks such as CO. H2 are used as reducing agents, use emission factors similar to the energy sector for the consumption of each reductant
5% for good national energy statistics10% for countries with less developed energy statistics
2C Metal Production
it is good practice to make sectoral allocations of fuel combustion in the energy sector and emissions from consumption of reducing agents in industrial processes
Page 23 of 27