CFT Column-to-Cap Beam Connections for Accelerated Bridge ...
213
CFT Column-to-Cap Beam Connections for Accelerated Bridge Construction in Seismic Regions Lisa Marie Berg A thesis submitted in partial fulfillment of the requirements for the degree of Master of Science in Civil Engineering University of Washington 2014 Program Authorized to Offer Degree: Civil and Environmental Engineering
Transcript of CFT Column-to-Cap Beam Connections for Accelerated Bridge ...

CFT Column-to-Cap Beam Connections for
Accelerated Bridge Construction in Seismic Regions
Lisa Marie Berg
A thesis submitted in partial fulfillment of the
requirements for the degree of
Master of Science in Civil Engineering
University of Washington
2014
Program Authorized to Offer Degree:
Civil and Environmental Engineering

1
©Copyright 2014
Lisa M. Berg

2
University of Washington
Abstract
CFT Column-to-Cap Beam Connections for
Accelerated Bridge Construction in Seismic Regions
Lisa M. Berg
Chair of the Supervisory Committee:
Associate Professor Dawn E. Lehman
Dept. of Civil & Environmental Engineering
Due to their increased mechanical properties and ease of construction, Concrete filled
steel tubes (CFTs) offer an efficient and economical alternative compared to traditional
reinforced concrete columns. Despite their inherent advantages, the implementation of
CFT construction within the US is limited due to unverified design expressions and lack
of standard connection details. As an effort to facilitate the use of CFTs, a research
program has been undertaken by the University of Washington to develop practical
connection details for the use of CFTs in bridge construction in seismic regions. The
focus of this research is the development of CFT column-to-cap beam connections. Three
categories of the CFT column to cap beam connection have been experimentally
evaluated; an embedded connection in which the steel tube is embedded in the cap beam
concrete, a welded reinforced concrete connection in which headed reinforcing bars are
welded to the inside of the steel tube and extended into the cap beam, and a reinforced
concrete connection in which a traditional reinforced concrete cage is placed within the
CFT column and extended into the cap beam. Experimental results show that these
connections can achieve strength and ductility objectives with limited damage to
superstructure components.

3
TABLE OF CONTENTS
Chapter 1 Introduction…………………………………………………………....…15
1.1 Concrete filled tubes ....................................................................................... 14
1.2 Research objective .......................................................................................... 15
1.3 Report overview .............................................................................................. 15
Chapter 2 Review of Design Provisions……………………………………….....….18
2.1 AISC Design Provisions ................................................................................. 17
2.1.1 Material and Geometric Limitations ................................................... 17
2.1.2 Effective Stiffness ............................................................................... 18
2.1.3 Compressive Strength ......................................................................... 18
2.1.4 Flexural Strength ................................................................................. 19
2.1.5 Combined Flexure and Axial Compression ........................................ 19
2.2 AASHTO Design Provisions .......................................................................... 21
2.2.1 Stability Limitations............................................................................ 21
2.2.2 Effective Stiffness ............................................................................... 21
2.2.3 Compressive Strength ......................................................................... 22
2.2.4 Flexural Strength ................................................................................. 22
2.2.5 Combined Flexure and Axial Compression ........................................ 23
2.3 ACI Design Provisions ................................................................................... 23
2.3.1 Stability Limitations............................................................................ 23
2.3.2 Effective Stiffness ............................................................................... 24
2.3.3 Combined Strength ............................................................................. 24
2.4 Comparison of Design Provisions .................................................................. 25

4
2.4.1 Comparison of Stability Limits ........................................................... 26
2.4.2 Comparison of Effective Stiffness ...................................................... 26
Chapter 3 Literature Review…………………………………………………………29
3.1 Exposed Base Plate Connection ...................................................................... 28
3.2 Embedded Fixed-Base Connection ................................................................. 30
3.3 Reinforced Concrete-Filled Steel Tube Connection Tests.............................. 32
3.4 Embedded CFT Connections .......................................................................... 33
3.4.1 Kingsley (2005) Footing Connection Tests ........................................ 37
3.4.2 Williams (2006) Footing Connection Tests ........................................ 38
3.4.3 Lee (2011) Footing Connection Tests ................................................. 40
3.4.4 O’Neill (2011) Footing Connection Test ............................................ 41
3.5 Design Expressions from University of Washington Tests ............................ 42
3.5.1 Required Embedment Depth ............................................................... 42
3.5.2 Minimum Footing Depth .................................................................... 43
3.5.3 Shear Reinforcing Requirements ........................................................ 43
Chapter 4 Experimental Test Program…………………………………………...….45
4.1 Specimen Test Matrix ..................................................................................... 44
4.1.1 Embedded CFT Connections .............................................................. 45
4.1.2 Welded Reinforced Concrete Connections ......................................... 46
4.1.3 Reinforced Concrete Connection ........................................................ 47
4.2 Specimen Layout ............................................................................................ 47
4.3 Specimen Design and Construction ................................................................ 49
4.3.1 Caltrans Seismic Design Criteria ........................................................ 49

5
4.3.2 Embedded CFT Connections .............................................................. 51
4.3.3 Welded RC Connections ..................................................................... 57
4.3.4 RC Connection .................................................................................... 62
4.4 Specimen Materials ......................................................................................... 65
4.5 Experimental Test Setup ................................................................................. 67
4.6 Load Protocol .................................................................................................. 71
4.7 Specimen Instrumentation .............................................................................. 73
4.7.1 Global Instrumentation ....................................................................... 74
4.7.2 Column Instrumentation ..................................................................... 75
4.7.3 Connection Instrumentation ................................................................ 77
Chapter 5 Experimental Observations……………………………………………….85
5.1 Introduction ..................................................................................................... 84
5.2 Overview of Damage States............................................................................ 86
5.3 Specimen EMB80 ........................................................................................... 90
5.3.1 EMB 80 Damage State Summary ....................................................... 91
5.3.2 Low Drift Cycles (0.0% - 2.0% Drift) ................................................ 93
5.3.3 Moderate to High Drift Cycles (2.0% - 7.0% Drift) ........................... 94
5.3.4 Specimen Failure (7.0%+ Drift) ......................................................... 96
5.4 Specimen WRC ............................................................................................. 100
5.4.1 WRC Damage State Summary .......................................................... 101
5.4.2 Low Drift Cycles (0.0% - 2.0% Drift) .............................................. 103
5.4.3 Moderate to High Drift Cycles (2.0% - 8.0% Drift) ......................... 104
5.4.4 Specimen Failure (8.0% + Drift) ...................................................... 111

6
5.5 Specimen WRCUB ....................................................................................... 116
5.5.1 WRCUB Performance State Summary ............................................. 117
5.5.2 Low Drift Cycles (0.0% - 2.0% Drift) .............................................. 119
5.5.3 Moderate to High Drift Cycles (2.0% - 11.0% Drift) ....................... 119
5.5.4 Specimen Failure (11.0%+ Drift) ..................................................... 124
5.6 Specimen RC ................................................................................................ 127
5.6.1 RC Performance State Summary ...................................................... 128
5.6.2 Low Drift Cycles (0.0% - 2.0% Drift) .............................................. 130
5.6.3 Moderate to High Drift Cycles (2.0% - 9.0% Drift) ......................... 131
5.6.4 Specimen Failure (9.0%+ Drift) ....................................................... 135
5.7 Specimen EMB96 ......................................................................................... 137
5.7.1 EMB96 Performance State Summary ............................................... 138
5.7.2 Low Drift Cycles (0.0% - 2.0% Drift) .............................................. 140
5.7.3 Moderate to High Drift Cycles (2.0% - 7.0% Drift) ......................... 141
5.7.4 Specimen Failure (7.0%+ Drift) ....................................................... 144
Chapter 6 Data Interpretation and Analysis………………………………………..149
6.1 Force-drift response ...................................................................................... 148
6.2 Moment-drift response .................................................................................. 150
6.3 Longitudinal Strain Profiles .......................................................................... 153
6.3.1 Longitudinal Tube Strains................................................................. 154
6.3.2 Longitudinal Reinforcing Bar Strains ............................................... 156
6.4 Curvature Profiles ......................................................................................... 159
6.5 Column Rotation Profiles ............................................................................. 165

7
6.5.1 Embedded CFT Specimen Rotation Profiles .................................... 166
6.5.2 RC Connection Rotation Profiles...................................................... 168
6.6 Moment-Rotation .......................................................................................... 171
6.7 Column Displacement Profiles ..................................................................... 172
6.8 Connection Rotation and Column Rotation .................................................. 175
6.8.1 Embedded Specimen Rotation Contributions ................................... 175
6.8.2 WRC Specimen Rotation Contributions ........................................... 177
6.8.3 RC Specimen Rotation Contributions ............................................... 178
6.9 Column Buckled Shape Profile ..................................................................... 178
6.9.1 Buckled Profile of Specimen EMB80............................................... 179
6.9.2 Buckled Profile of Specimen EMB96............................................... 181
6.10 Fragility Curves ............................................................................................ 186
6.11 Assessment of Performance .......................................................................... 188
6.11.1 Comparison of EMB80 with Previous Work .................................... 190
6.11.2 Comparison of Specimens EMB80 and EMB96 .............................. 193
6.11.3 Comparison of Specimens WRC AND WRCUB ............................. 193
6.11.4 Comparison of Specimens RC and WRC ......................................... 193
6.12 Design Recommendations ............................................................................ 194
Chapter 7 Conclusions……………………………………………...………………197
7.1 Summary of Research ................................................................................... 196
7.2 Research Results and Conclusions................................................................ 197
7.3 Recommendations for Future Research ........................................................ 198

8
LIST OF FIGURES
Figure 2.1: Plastic Stress Distribution Method ................................................................. 20
Figure 2.2: Strain Compatibility Method .......................................................................... 21
Figure 2.3: ACI Model for Strength Prediction ................................................................ 25
Figure 2.4: CFT Column redesigned from Laguna de Santa Rosa RC Column ............... 26
Figure 3.1: CFT-Footing Connection Configuration by Kawaguchi and Morino. ........... 28
Figure 4.1: Proposed CFT column-to-cap beam connections ........................................... 45
Figure 4.2: Embedded CFT force transfer mechanism ..................................................... 45
Figure 4.3: Basic Specimen Layout .................................................................................. 48
Figure 4.4: Specimen EMB80 Reinforcing Details .......................................................... 53
Figure 4.5: Specimen EMB96 Reinforcing Details .......................................................... 54
Figure 4.6: Embedded CFT connection construction sequence ........................................ 55
Figure 4.7: Cap Beam Reinforcing and Formwork .......................................................... 55
Figure 4.8: EMB80 tube and annular ring ........................................................................ 56
Figure 4.9: Specimens WRC, WRCUB, and RC Reinforcing Details ............................. 59
Figure 4.10: Welded RC Connections Construction Sequence ........................................ 60
Figure 4.11: Specimen WRC annular ring and reinforcing bars ...................................... 61
Figure 4.12: RC Connection Construction Sequence ....................................................... 63
Figure 4.13: Reinforcing cage of Specimen RC ............................................................... 64
Figure 4.14: Experimental Test Rig .................................................................................. 67
Figure 4.15: Williams Rods Layout .................................................................................. 68
Figure 4.16: Axial Load Apparatus .................................................................................. 69
Figure 4.17: Experimental test rig with Specimen EMB80 .............................................. 70

9
Figure 4.18: Target load protocol ..................................................................................... 72
Figure 4.19: Global Instrumentation Schematic ............................................................... 74
Figure 4.20: Column Instrumentation Schematic ............................................................. 76
Figure 4.21: EMB80 Strain Gauge Schematic .................................................................. 78
Figure 4.22: Strain gauge schematic for (a) Specimens WRC, WRCUB, and (b) RC ..... 80
Figure 4.23: EMB80 Optotrak Target Layout .................................................................. 83
Figure 5.1: Specimen drift ................................................................................................ 85
Figure 5.2: Idealized Drift History.................................................................................... 86
Figure 5.3: EMB80 Connection Detail ............................................................................. 90
Figure 5.4: EMB80 Moment-Drift Response ................................................................... 91
Figure 5.5: EMB80 Cracking on South side of Column at 0.41% drift ............................ 93
Figure 5.6: EMB80 Radial cracking at 1.45% drif ........................................................... 94
Figure 5.7: EMB80 hairline cracking on the west side of the cap beam at 2.25% drift ... 94
Figure 5.8: EMB80 South tube buckling at (a) 3.19% drift, and (b) 4.43% drift ............. 95
Figure 5.9: EMB80 South tube buckling at 7.0% drift ..................................................... 96
Figure 5.10: EMB80 tear initiation on North side of column at 7.0% drift ...................... 97
Figure 5.11: EMB80 tear initiation on South side of column at 7.0% drift ...................... 97
Figure 5.12: EMB80 tear propagation on North side of column at 8.54% drift ............... 98
Figure 5.13: EMB80 tear propagation on South side of column at 8.30% drift ............... 98
Figure 5.14: WRC Connection Detail ............................................................................. 100
Figure 5.15: WRC Moment-Drift Response ................................................................... 101
Figure 5.16: WRC soffit cracking at 0.3% drift.............................................................. 103

10
Figure 5.17: WRC soffit openings on (a) North side of column at 1.48% drift, and (b)
south side of column at 1.62% drift ................................................................................ 104
Figure 5.18: WRC radial cracking on (a) North side of column at 1.48% drift, and (b)
south side of column at 1.62% drift ................................................................................ 104
Figure 5.19: WRC North grout pad cracking at 2.08% drift .......................................... 105
Figure 5.20: WRC South grout pad cracking at 3.43% drift North ................................ 106
Figure 5.21: WRC Residual soffit openings after 10th
load set (a) North side of column,
and (b) south side of column ........................................................................................... 106
Figure 5.22: WRC residual grout extrusion after 10th
load set ....................................... 107
Figure 5.23: WRC cap beam cracking during the 11th
cycle level (a) North side of
specimen, (b) South side of specimen............................................................................. 107
Figure 5.24: WRC cracking on South face of cap beam at 7.04% drift ......................... 108
Figure 5.25: WRC cap beam cracking on (a) South side of specimen, and (b) North side
of specimen ..................................................................................................................... 108
Figure 5.26: WRC North soffit cracking at 7.08% drift South ....................................... 109
Figure 5.27: WRC exposed reinforcing bar at 8.43% drift South .................................. 110
Figure 5.28: WRC South soffit openings at 8.33% drift North ...................................... 110
Figure 5.29: WRC South cap beam concrete uplift at 8.33% drift North ....................... 111
Figure 5.30: WRC North cap beam damage at 9.71% drift South (Cycle 1) ................. 112
Figure 5.31: WRC South cap beam damage at 9.46% drift North ................................. 112
Figure 5.32: WRC North cap beam uplift at 9.71% drift South (Cycle 2) ..................... 113
Figure 5.33: WRC North cap beam damage at 11.47% drift South ............................... 114
Figure 5.34: WRC South soffit damage at 11.47% drift South ...................................... 114

11
Figure 5.35: WRC South cap beam (a) uplift and (b) cracking at 11.01% drift North ... 115
Figure 5.36: WRC (a) North, and (b) South cap beam damage after test termination ... 115
Figure 5.37: WRCUB Connection Detail ....................................................................... 116
Figure 5.38: WRCUB Moment-drift response................................................................ 117
Figure 5.39: WRCUB North cap beam damage at 1.58% drift South ............................ 119
Figure 5.40: WRCUB North (a) soffit-flange opening, and (b) cap beam crack widths at
2.24% drift South ............................................................................................................ 120
Figure 5.41: WRCUB North soffit-flange opening at 3.51% drift South ....................... 121
Figure 5.42: WRCUB (a) soffit-flange opening, and (b) grout crushing at 4.72% drift
South ............................................................................................................................... 121
Figure 5.43: WRC North soffit opening at 7.17% drift South ........................................ 122
Figure 5.44: WRCUB (a) grout extrusion, and (b) residual soffit-flange opening after
13th cycle level ............................................................................................................... 123
Figure 5.45: WRCUB South (a) cap beam cracking, and (b) exposed reinforcing bar at
8.19% drift North ............................................................................................................ 123
Figure 5.46: WRCUB North exposed reinforcing bars at 9.76% drift South ................. 124
Figure 5.47: WRCUB (a) Soffit-flange opening at first bar fracture, and (b) South
concrete uplift at 10.53% drift North .............................................................................. 125
Figure 5.48: WRCUB (a) North bar fracture, and (b) North cap beam damage at 12.27%
drift South ....................................................................................................................... 126
Figure 5.49: WRCUB South cap beam damage at 11.58% drift North .......................... 126
Figure 6.1: EMB80 Force-Drift Response ………………………………………….149
Figure 6.2: EMB96 Force-Drift Response ………………………………………….149

12
Figure 6.3: WRC Force-Drift Response …………………………………….……….149
Figure 6.4: WRCUB Force-Drift Response ... ………………………………………….149
Figure 6.5: RC Force-Drift Response ............................................................................. 149
Figure 6.6: EMB80 Moment-Drift Response ................................................................. 151
Figure 6.7: EMB96 Moment-Drift Response ................................................................. 151
Figure 6.8: WRC Moment-Drift Response .............................................................. 151
Figure 6.9: WRCUB Moment-Drift Response ............................................................... 151
Figure 6.10: RC Moment-Drift Response ....................................................................... 151
Figure 6.11: Normalized moment-drift envelope comparison of all specimens ............. 152
Figure 6.12: EMB80 Longitudinal strain profiles of steel tube ...................................... 154
Figure 6.13: Longitudinal strain profiles of steel tube .................................................... 155
Figure 6.14: WRC Longitudinal strain profiles of North & South reinforcing bars ...... 156
Figure 6.15: WRCUB Longitudinal Strain Profiles of North & South reinforcing bars 157
Figure 6.16: RC Longitudinal strain profiles of North & South reinforcing bars .......... 158
Figure 6.17: Curvature calculation from strain gauges ................................................... 159
Figure 6.18: EMB80 Curvature profiles ......................................................................... 160
Figure 6.19: EMB90 Curvature Profiles ......................................................................... 161
Figure 6.20: WRC Curvature profiles ............................................................................. 162
Figure 6.21: WRCUB Curvature profiles ....................................................................... 163
Figure 6.22: RC Curvature profiles ................................................................................ 164
Figure 6.23: EMB80 Rotation profiles ........................................................................... 166
Figure 6.24: EMB96 Rotation profiles ........................................................................... 167
Figure 6.25: WRC Rotation profiles ............................................................................... 168

13
Figure 6.26: WRCUB Rotation profiles ......................................................................... 169
Figure 6.27: RC Rotation profiles ................................................................................... 170
Figure 6.28: EMB80 Moment-rotation response ............................................................ 171
Figure 6.29: EMB96 Moment-rotation response ............................................................ 171
Figure 6.30: WRC Moment-rotation response ................................................................ 171
Figure 6.31: WRCUB Moment-rotation response .......................................................... 171
Figure 6.32: RC Moment-rotation response ................................................................... 172
Figure 6.33: EMB80 Column displacement profile ........................................................ 172
Figure 6.34: EMB96 Column displacement profile ........................................................ 173
Figure 6.35: WRC Column displacement profile ........................................................... 173
Figure 6.36: WRCUB Column displacement profile ...................................................... 174
Figure 6.37: RC Column displacement profile ............................................................... 174
Figure 6.42: RC Rotation Contributions from column & connection ............................ 178
Figure 6.43: EMB80 Buckled Profile – Drift Set 5 ........................................................ 179
Figure 6.44: EMB80 Buckled Profile – Drift Set 7 ........................................................ 180
Figure 6.46: EMB96 Buckled Profile – Drift Set 10 ...................................................... 182
Figure 6.47: EMB96 Buckled Profile – Drift Set 11 ...................................................... 183
Figure 6.48: EMB96 Buckled Profile – Drift Set 13 ...................................................... 184
Figure 6.49: EMB96 Buckled Profile – Drift Set 14 ...................................................... 185

14
CHAPTER 1
INTRODUCTION
1 .1 CONCRETE FILLED TUBE S
Concrete filled steel tubes (CFTs) are composite structural elements consisting of
circular or rectangular steel tubes with concrete infill. CFTs efficiently combine the
tensile strength and ductility of steel with the compressive strength of concrete to create a
competitive alternative to traditional reinforced concrete columns.
The location of the steel and concrete components in the CFT cross section
optimizes the strength and stiffness of the section. By placing the steel component at the
outermost fiber of the cross section, the steel is at its optimal location to effectively resist
bending moment. In addition, the concrete core delays, and often prevents, local buckling
of the steel tube, while the steel tube confines the concrete infill and prevents spalling.
In addition to their increased strength and stiffness, CFTs provide economic
benefits as the steel tube eliminates the need for temporary shoring and formwork during
construction. In addition, the hollow tube has the strength to support dead weight prior to
casting concrete, facilitating rapid construction by eliminating concrete curing delays.
Despite their inherent advantages, CFTs are not currently used extensively in
bridge construction in the United States due to unverified design methods and limited
knowledge regarding their behavior.

15
1 .2 RESEARCH OBJECTIVE
This is the continuation of an ongoing research program undertaken by the
University of Washington to investigate the behavior of CFT column connections.
Extensive research has been conducted to develop expressions for the design of CFT
column-to-foundation connections capable of transferring the full moment capacity of the
CFT column to its adjacent footing element. Full realization of the system, however,
requires the development of CFT column-to-cap beam connection details, which present
additional challenges due to geometric and reinforcement constraints.
In an effort to address these constraints, this research program investigates the
response of five CFT column-to-cap beam specimens with varying connection
parameters. Three primary connection types are investigated in this research program: 1)
Embedded, in which the CFT column is embedded into a precast reinforced concrete cap
element through a recessed fiber-reinforced grouted connection, 2) Welded Reinforced
Concrete, in which headed reinforcing bars are welded to the inside of the steel tube and
are developed into the cap beam, and 3) Reinforced Concrete Connection, in which
longitudinal and transverse reinforcing extend from the CFT column into the cap beam.
1 .3 REPORT OVERVIEW
This report includes 8 chapters.
Chapter 2 outlines the current design provisions available for CFT members in the
AISC Steel Design Manual, the AASHTO LRFD Bridge Design Specification, and the

16
ACI Building Code. A brief comparison of the three design provisions using a prototype
column is provided at the end of the chapter.
Chapter 3 summarizes previous research that has been conducted on CFT column-
to-footing connections.
Chapter 4 provides an overview of the five specimens in the test program,
introducing their force transfer mechanisms and strength and ductility limitations. It also
provides a detailed description of the design rationale and construction procedure for
each specimen, as well as the testing apparatus, loading protocol, and instrumentation
used to test each specimen.
Chapter 5 discusses the experimental results of the five tests, including
photographs and a description of damage states used to evaluate the performance of each
specimen.
Chapter 6 discusses the data interpretation and analysis of the five tests based on
measured responses from specimen instrumentation. This chapter includes force-
displacement plots, as well as strain, curvature, and rotation profiles.
Chapter 7 summarizes the conclusions drawn based on the results of the five
experimental tests in this program.

17
CHAPTER 2
REVIEW OF DESIGN PROVISIONS
This chapter outlines the current design provisions for CFT members available in the 14th
Edition of the American Institute for Steel Construction (AISC) Steel Design Manual
(AISC, 2011), the AASHTO LRFD Bridge Design Specifications (AASHTO, 2011), and
the American Concrete Institute (ACI) Building Code Requirements for Structural
Concrete (ACI, 2011).
2 .1 AISC DESIGN PROVISIONS
AISC provides recommendations for the design of CFT members in Chapter I of the 2010
Steel Construction Manual (AISC, 2011). These recommendations include material
property and geometric limitations, as well as expressions to determine the strength and
stiffness of composite CFT sections.
2.1.1 Material and Geometric Limitations
For the purpose of strength determination, material limitations provided in AISC Section
I1.3 require the concrete to have a compressive strength between 3 and 10-ksi, and the
steel to have a yield stress not exceeding 75-ksi. Although these limitations may not be
exceeded in strength calculations, AISC permits the use of higher strength concrete
material properties when calculating the stiffness of the CFT section. For the CFT to be
considered a composite member, AISC Section I2.2 requires the cross-sectional area of
the steel component to comprise at least 1% of the total composite cross section area.

18
Limitations in Section I1.4 also require the member to be classified for local buckling
based on its diameter-to-thickness (
) ratio. This limitation is defined by the expression:
(2.1)
where and are the respective elastic modulus and nominal yield stress of steel tube.
2.1.2 Effective Stiffness
The effective stiffness, of the composite CFT section is defined in AISC Eq. I2-12
as:
(2.2a)
[
] (2.2b)
In Equations 2.2a and 2.2b, and represent the section’s modulus of elasticity,
moment of inertia, and area, respectively. The properties of steel and concrete are
denoted by their respective subscripts, and .
2.1.3 Compressive Strength
The compressive strength, of an axially loaded filled composite member is defined in
AISC Eq. I2-9b as:
(2.3)
where
is the design compressive strength of concrete, and is taken as 0.95 for
circular sections. The compressive strength of the CFT member is limited by the flexural
buckling limit states:

19
[ ]
(2.4a)
(2.4b)
in which is the elastic critical buckling load defined in AISC Eq. I2-5 as:
( )
( ) (2.5)
where is the AISC effective length factor, and is the length of the member.
2.1.4 Flexural Strength
The nominal flexural strength of a CFT is defined in AISC Eqs. I3-3a and I3-3b as:
(2.6a)
( )(
)
(2.6b)
where is the plastic moment capacity of the composite cross section, is the yield
moment, and , , and are slenderness ratios determined from AISC Table I1.1b.
2.1.5 Combined Flexure and Axial Compression
Section I1.2 of AISC permits use of two different methods to calculate the combined
axial-flexure capacity of the CFT: the plastic stress distribution method, and the strain-
compatibility method. In the plastic stress distribution method, the strength of the CFT is
computed assuming the entire steel tube has reached its yield stress in either tension or
compression. The component of concrete subject to compression is assumed to have
reached a uniform stress of , while the tension component of concrete is assumed

20
to have a negligible contribution. The 0.95 coefficient on the concrete stress is only
permitted for use in circular CFTs, as this increased strength accounts for the effects of
concrete confinement attributed to circular components. The moment capacity of the
section is determined by satisfying equilibrium, with the applied axial load acting at the
centroid of the cross section, as shown in Figure 2.1.
Figure 2.1: Plastic Stress Distribution Method
In the strain compatibility method, the strength of the CFT is computed assuming a linear
distribution of strains across the section, with a maximum concrete compressive strain of
0.003. Figure 2.2 shows the distribution of stresses used in the strain compatibility
method.

21
Figure 2.2: Strain Compatibility Method
2 .2 AASHTO DESIGN PROVISIONS
Articles 6.9.5 and 6.12.2 of the AASHTO LRFD Bridge Design Specifications (2011)
provide recommendations for the design of CFT members. The following section will
discuss the stability limitations specified in the AASHTO LRFD, as well as the
expressions to determine the strength and stiffness of CFT sections.
2.2.1 Stability Limitations
The AASHTO LRFD Specifications employ a
ratio to limit local buckling of the steel
tube. This limit is defined in Eq. 6.12.2.3.2-1 as:
√
(2.7)
where and are the elastic modulus and nominal yield stress of the steel, respectively.
2.2.2 Effective Stiffness
AASHTO defines the effective stiffness of the composite section, , in Eq. 6.9.5.1-5
as:
[ (
) (
)] (2.8)
where and represent the section’s moment of inertia and area, respectively, and
subscripts and refer to the properties of the steel and concrete sections. The composite
column coefficient, is specified in Table 6.9.5.1-1 as 0.40 for a CFT, and represents

22
the modular ratio of the concrete, defined in Eq. 6.10.1.1.1b-1 as:
, where is the
elastic modulus of the concrete.
2.2.3 Compressive Strength
The nominal compressive resistance, of a CFT is defined in AASHTO Eq. 6.9.5.1-4
as:
(2.9)
where the variables have been defined previously. This provision is similar to that as
defined by AISC, except the resistance provided by the concrete is multiplied by a
coefficient of 0.85, as opposed to 0.95. The column buckling is addressed in AASHTO
Eqs. 6.9.5.1-1 and 6.9.5.1-2, which have been provided previously in Eqs. 2.4a and 2.4b
above.
2.2.4 Flexural Strength
The nominal flexural resistance of the CFT is dependent on its
ratio, as well its material
properties and . AASHTO Eqs. 6.12.2.3.2-1 and 6.12.2.3.2-2 define the flexural
resistance as:
√
(2.10a)
√
(2.10b)

23
where is the plastic moment of the steel section, and is the yield moment of the
composite section determined by Article 6.19.3.1.2.
2.2.5 Combined Flexure and Axial Compression
Article 6.9.2.2 requires the axial compressive load, , and concurrent moments, and
, to satisfy the relationships defined in Eqns. 6.9.2.2-1 and 6.9.2.2-2 as:
(
)
(2.11a)
(
)
(2.11b)
where subscripts and correspond to loading about the x and y axes, and
represent the flexural moment demand and resistance, and and represent the axial
load demand and resistance, respectively.
2 .3 ACI DESIGN PROVISIONS
The American Concrete Institute (ACI) provides recommendations for the design of CFT
members in Section 10.13 of the Building Code Requirements for Structural Concrete
(ACI, 2011).
2.3.1 Stability Limitations
Section 10.13.6.1 of the ACI Building Code specifies a minimum
ratio to prevent local
buckling of the section. This limit is defined as:

24
√
(2.12)
2.3.2 Effective Stiffness
ACI defines the effective stiffness of composite compression members in Eq. 10-23 as:
(2.13)
where and represents the elastic modulus of the concrete and steel sections, and
represent the moment of inertia of the gross concrete section and the structural steel
tube about the centroid of the composite member, and is a ratio used to account for
the reduction of column stiffness due to sustained axial loading.
2.3.3 Combined Strength
The ACI procedure to calculate the strength of a composite member is similar to the
AISC strain compatibility method, except the ACI method permits the use of an
equivalent rectangular compressive stress block to replace the more exact concrete stress
distribution. The equivalent stress block is assumed to have a uniformly distributed stress
of that acts over a depth of , where is dependent on the specified
compressive strength of the concrete, and is the distance from the extreme compression
fiber to the neutral axis. Figure 2.3 shows the ACI stress distribution models.

25
Figure 2.3: ACI Model for Strength Prediction
2 .4 COMPARISON OF DESIGN PROVISIONS
For the purpose of comparison between the AISC, AASHTO and ACI design provisions,
a prototype column will be used to evaluate the stability limits and effective stiffness
from the three different design methods. Figure 2.4 shows the cross section of the
prototype column, which is based off of a reinforced concrete column in the Laguna de
Santa Rosa Bridge. The RC column has been redesigned using a comparable CFT that is
42-in. in diameter and has a 0.5-in. steel tube thickness. It will be assumed that the steel
has an elastic modulus and yield stress of 29,000-ksi and 50-ksi, respectively, and the
concrete has a design compressive strength of 6-ksi.

26
Figure 2.4: CFT Column redesigned from Laguna de Santa Rosa RC Column
2.4.1 Comparison of Stability Limits
Using the steel properties provided above, the AISC, AASHTO, and ACI stability
limitations provided in Eqs. 2.1, 2.7, and 2.12 yield the following D/t limits:
AISC:
AASHTO:
ACI:
From the above D/t limits, it can be seen that there is a wide variation in the local
slenderness limits between the different codes.
2.4.2 Comparison of Effective Stiffness
The effective stiffness was computed using the AISC, AASHTO, and ACI design
provisions provided in Eqs. 2.2a, 2.8 and 2.13, respectively. In the ACI design provision,
it is assumed that stiffness reduction ratio, is taken as 1.0. Because of this
assumption, the AISC and AASHTO provisions predict a significantly larger effective
stiffness, as can be seen through the predicted values below:

27
AISC:
AASHTO:
ACI:
CHAPTER 3
LITERATURE REVIEW
Due to their unverified design expressions and lack of standard connection details, CFTs
are not currently used extensively in bridge construction in the United States. As an effort
to promote the use of this bridge system, research has been conducted on a variety of

28
different CFT column-to-footing connections to develop a detail capable of transferring
the strength of a CFT column to its adjacent footing element. The following section
summarizes some of the research that has been conducted on various CFT column-to-
footing connections.
3 .1 EXPOSED BASE PLATE CONNECTION
Kawaguchi and Morino (2006) developed a CFT-foundation connection consisting of an
exposed base plate with anchor bolts and central reinforcing bars. The central reinforcing
bars are embedded into the concrete foundation, and they extend into the CFT column
through a hole in the base plate. The reinforcing bars are intended to increase the strength
and stiffness of the connection when compared to those without the reinforcing bars.
Figure 3.1 shows an overview of the proposed connection detail, as well as the
construction procedure.
Figure 3.1: CFT-Footing Connection Configuration by Kawaguchi and Morino (Kawaguchi and Morino,
2006).

29
A series of 10 specimens were tested to investigate the behavior of this proposed
connection. Six of the specimens consisted of 12-in. square steel tube columns with ¾-in.
thickness, and the remaining four consisted of 16-in. diameter circular steel tubes with ½-
in. thickness. Each specimen was constructed using a 20-in. square, 0.5-in. thick base
plate with identical anchor bolts. Varying test parameters included: 1) axial force: zero,
constant tension, varying tension and compression, 2) presence of central reinforcing
bars, and 3) varying strength of the central reinforcing bars.
The observed failure modes of the tests consisted of a combination of conical failure of
the foundation concrete due to pulling out of the anchor bolts, shear failure of concrete
along the side surface of the cone, and compressive failure of the filler mortar below the
base plate. None of the specimens experienced failure of the base plate or the anchor
bolts. Figure 3.2 shows an example of the moment-rotation hysteretic behavior
experienced by a 12-in. square CFT subjected to a constant tensile axial load of 1200-kN.
Figure 3.2: Moment-Rotation Behavior of 12-in. CFT with +1200 kN Axial Load (Kawaguchi and Morino,
2006)

30
Results from the experimental tests showed that the column bases with central reinforcing
bars exhibited a larger stiffness and strength compared to those without the central bars.
Specifically, the connections with central reinforcing bars produced an increased stiffness
of 1.2, and an increased maximum strength of 1.4 – 1.8 times those of the column bases
without central reinforcing.
3 .2 EMBEDDED FIXED -BASE CONNECTION
Marson and Bruneau (2004) developed a foundation detail capable of transferring the full
composite moment capacity of a circular concrete-filled steel tube column. In this
connection detail, the strength of the column is resisted entirely by structural steel
components that are welded to the steel tube and encased inside the concrete foundation.
Because these steel members are designed to transfer all of the forces, no reinforcing bars
are required in the concrete foundation. Figure 3.3 shows the schematic of the fixed-base
connection.
Figure 3.3: Fixed-Base Connection Schematic from Marson and Bruneau (Marson and Bruneau, 2004)

31
As shown in Figure 3.3, the base of the CFT column is welded to the top of a steel
bottom plate. Two C channels run along the sides of the steel tube, oriented such that
their flanges point away from one another. The bottom flanges of the two channels are
welded longitudinally to the bottom plate. A top plate with a hole cut out of its center is
then slid over the column, and is welded to the steel tube and the top flanges of the
channels.
Four specimens were tested using this connection detail, with diameters of 12.75-in. and
16-in., and D/t ratios ranging between 34 and 64. The specimens were subjected to a
constant axial load, as well as a cyclic lateral load following ATC-24 protocol. Figure 3.4
shows the resulting moment-drift hysteretic behavior of Specimen CFST 51, which
consisted of a 12.75-in. diameter CFT with a thickness of 1/4-in., resulting in a D/t ratio
of 51.
Figure 3.4: Moment-Drift Behavior from Marson and Bruneau (Marson and Bruneau, 2004)
The embedded fixed-base connection successfully developed the full plastic moment
capacity of each CFT during testing. The failure mode of the specimens consisted of local
buckling, followed by subsequent ductile tearing in the buckled regions. The columns
exceeded 7% drift before significant strength loss, and exhibited large energy dissipation.

32
3 .3 REINFORCED CONCRETE -FILLED STEEL TUBE
CONNECTION TESTS
Montejo (2012) tested a series of reinforced concrete-filled steel tube (RCFST) column-
cap beam connection specimens. In a RCFST column, a conventional steel cage inside of
the tube provides the primary flexural strength of the specimen. A gap is left between the
base of the steel tube and its adjacent cap element such that the need for a special joint
connection is avoided, and the contribution of the steel tube on shear strength and
concrete confinement is maximized. In this test program, the specimens were designed to
replicate a half-scale bridge column. The columns were 18-in. in diameter and 3/8-in.
thick, such that the resulting D/t ratio replicated that used in actual practice. Varying
amounts of longitudinal reinforcing was used between specimens. Figure 3.5 shows an
overview of the specimen geometry and test setup.
Figure 3.5: RCFST Geometry and Test Setup by Montejo (2012)
Specimen failure consisted of longitudinal reinforcement buckling with damage to the
support block near the column. The reduced D/t ratio typical of RCFST columns causes

33
the specimens to deflect as a rigid body with a reduced plastic hinge length, compared to
jacketed RC column.
3 .4 EMBEDDED CFT CONNECTIONS
An extensive experimental research program was conducted at the University of
Washington to develop a connection capable of transferring the full plastic moment
capacity of a CFT column to a reinforced concrete footing. In the CFT-footing
connection design, an annular steel ring is welded to the embedded end of the CFT
column. The ring is intended to provide anchorage of the column, and to transfer shear
and moment to the footing concrete and reinforcement via compression struts. The
footing is reinforced with standard shear and flexural reinforcement.
Two variations of the CFT-footing connection were investigated in the test program; a
monolithic and an isolated method. In the monolithic method, the steel tube is
temporarily supported such that the footing and the column are cast simultaneously. In
the isolated method, the footing is cast around a void created by a lightweight corrugated
steel pipe. The end of the steel tube with the annular ring is lowered into the void, which
is then filled with high-strength, fiber-reinforced grout. Finally, the steel tube is filed with
low-shrinkage, self-consolidating concrete. The latter method achieves the strength and
ductility of the embedded connection, while providing a more constructible alternative to
the monolithic method. The two construction methods are illustrated in Figure 3.6.

34
Figure 3.6: (a) Monolithic Connection, and (b) Isolated Connection
The experimental test program to investigate the embedded CFT connection consisted of
a series of 19 CFT column-footing specimens. The specimens simulated an approximate
half-scale bridge pier column, with the majority of them having a 20-in. diameter column.
In all cases, the thickness of the steel tube was ¼-in., resulting in a D/t ratio of 80. The
annular rings were all ¼-in. thick, and they extended 4-in. (16t) and 2-in. (8t) from the
respective outer and inner diameters of the steel tube. Figure 3.7 shows the typical
specimen geometry and reinforcement layout.

35
Figure 3.7: Typical specimen geometry and reinforcing (Stephens, 2014)
The series of tests investigated the effects of several different parameters, including
variations on column embedment depth, connection type, and tube fabrication techniques.
A summary of the study parameters for each CFT column-footing specimen is provided
in table 3.1.

36
Table 3.1: University of Washington Experimental Test Parameters
Specimen
Designation Researcher
le
D
Connection
Type
Study
Parameter
I Kingsley 0.6 Monolithic No shear reinforcing
II Kingsley 0.6 Monolithic Shear reinforcing
III Kingsley 0.9 Monolithic Embedment depth
IV Kingsley 0.6 Isolated Connection type
5 Williams 0.9 Monolithic Flexible underlay
6 Williams 0.75 Isolated Flexible underlay
7 Williams 0.75 Isolated Monotonic axial loading
8 Williams 0.75 Isolated Cyclic axial loading
9 Chronister 0.9 Isolated Galvanized tube
10 Chronister 0.9 Isolated Galvanized tube, Load
history
11 Chronister 0.9 Isolated 0.15Po Axial load
12 Chronister 0.9 Isolated 0.20Po Axial load
1-50 Lee 0.8 Monolithic Straight seam tube
2-50 Lee 0.775 Isolated Straight seam tube
3-50 Lee 0.775 Isolated Spiral weld tube
4-50 Lee 0.8 Monolithic Spiral weld tube
5-50 Lee 0.7 Isolated Spiral wed tube
6-50 Lee 0.6 Isolated Spiral weld tube
19 O’Neill 0.62 Isolated 30-in. tube, 0.05Po Axial load

37
3.4.1 Kingsley (2005) Footing Connection Tests
Kingsley’s experimental test program consisted of a series of four CFT-footing
connection specimens. The first three specimens were selected to evaluate the effect of
shear reinforcement and embedment depth on the strength and behavior of the
connection. The fourth specimen was tested to evaluate the efficiency and potential
structural benefits of using an isolated connection procedure as opposed to the monolithic
option.
Each specimen was constructed using a 20-in. diameter, high-strength vanadium alloy
steel tube. The tubes were ¼-in. thick, resulting in a D/t ratio of 80. The footings were
designed with sufficient flexural reinforcement to resist the strength of the CFT column,
and the dimensions of the footing were selected such that the footing size did not
influence the connection behavior or the failure mode.
The specimens were subjected to a constant axial load equivalent to 10% of their
crushing load, as well as a cyclic horizontal drift history based on ATC-24 protocol.
Results from the four tests suggested the following conclusions:
The presence of vertical shear reinforcement in specimen II had little effect on the
load capacity of the connection, but appeared to reduce the severity of footing
damage compared to that of Specimen I.
Increasing the embedment depth from 0.6D to 0.9D increased the load capacity of
the specimen by approximately 25%. The increased embedment depth also
improved the drift capacity, as well as the energy dissipation capacity.

38
The increased embedment depth of 0.9D resulted in tube tearing and subsequent
ductile tearing with minimal damage to the footing.
The isolated connection method provided comparable strength, while reducing
and delaying damage to the concrete footing.
The force-drift hysteretic behavior of Specimens I and III is presented in Figure 3.8. By
comparing the two hystereses, it can be seen that the overall strength and ductility of the
connection is greatly influenced by the embedment depth of the column.
Figure 3.8: Force-Drift Response from adequately and inadequately embedded specimens (Kinsley, 2005)
3.4.2 Williams (2006) Footing Connection Tests
Williams tested four CFT-footing specimens to evaluate the effects of embedment depth,
flexible underlay, connection design, and axial loading. Similar to Kinglsey, each column
consisted of a 20-in. diameter spiral welded high-strength vanadium alloy steel tube, with
a ¼-in. thickness. The first two specimens (Specimens 5 and 6) were constructed to
evaluate the effect of varying column embedment depths under the presence of a flexible
underlay to simulate flexible soil. The flexible underlay was constructed by placing
deformable plywood underneath the specimens, to allow damage to occur on the

39
underside of the footing. Specimen 5 was cast monolithically, while Specimen 6 was cast
using the isolated construction method. The two specimens were subjected to a constant
axial load of 10% of their ultimate axial capacity, as well as a cyclic lateral load based on
ATC-24 protocol.
Specimens 7 and 8 were constructed with half-height columns to evaluate the punching
shear strength of the footing. To replicate the soil resistance expected in practice, the base
of each specimen was supported by a stiff Hydrostone perimeter filled with loose sand.
Both specimens were cast using the isolated construction method, and were subjected to
axial loading only. Specimen 7 was loaded monotonically, while Specimen 8 was loaded
cyclically for ten cycles, and then loaded monotonically until failure. Results from the
four tests suggested the following conclusions:
The monolithically constructed specimen with 0.9D embedment experienced
limited cracking in the footing, with no observed damage on the underside of
the specimen.
The smaller embedment depth of Specimen 6 resulted in damage on the
underside of the specimen, suggesting a punching-shear effect on the footing.
The decreased embedment of 0.75D was sufficient to develop the full flexural
capacity of the CFT. Considerable cracking in the footing suggested high
demands, but below the ultimate capacity.
Local buckling of the steel tube causes degradation in stiffness, but not in
strength. Repeated buckling leads to tearing of the tube.

40
3.4.3 Lee (2011) Footing Connection Tests
Lee tested a series of six CFT-footing specimens to evaluate the effects of using different
construction methods, different tube fabrication methods, and varying embedment depths.
Unlike the previous specimens tested by Kingsley, Williams and Chronister in which
high-strength vanadium alloy steel tubes were used, this test program investigated the
response using steel tubes with a 50 ksi yield strength.
Specimens 1-50 and 2-50 were both constructed using straight seam welded tubes, while
the remaining four specimens were constructed using spiral weld tubes. Specimens 1-50
and 4-50 were cast monolithically, whereas the remaining four specimens were cast using
the isolated construction method. Specimens 4-50, 5-50, and 6-50 were constructed with
varying embedment depths of 0.8D, 0.7D, and 0.6D, respectively. All specimens were
subjected to a constant axial load of 10% of their ultimate axial capacity, as well as a
cyclic lateral load following ATC-24 protocol. Results from the six tests suggested the
following conclusions:
Both isolated and monolithic connections exhibited comparable strength,
ductility, and stiffness.
Specimens with shallower embedment depths experienced increased footing
damage.
The 50 ksi steel tubes resulted in a lower stiffness compared to the previously
tested 75 ksi vanadium alloy steel tubes. The lower strength tubes also
experienced an increased ductility.
Both straight seam and spiral welded steel tubes provided similar strengths
and stiffness. Although specimens using straight seam tubes experienced a

41
25% increase in drift ductility, toughness testing suggested this increase was
attributed to the base metal as opposed to tube fabrication methods.
3.4.4 O’Neill (2011) Footing Connection Test
This experimental test program investigated the performance of a CFT-footing specimen
using a steel tube of 50% larger diameter than pervious tests. The thickness of the tube
was ¼-in., resulting in a D/t ratio of 120, as opposed to the previously tested specimens
with D/t ratios of 80. The specimen was cast using the isolated construction method, with
an 18-in. (0.62D) embedment depth. The specimen was subjected to a constant axial load
equal to 5% of the gross axial capacity, as well as a cyclic lateral load adapted from
ATC-24 protocol. Results from the four tests suggested the following conclusions:
The 30-in. diameter specimen possessed similar normalized stiffness
compared to the previously tested 20-in. diameter specimens with similar
study parameters.
Tube tearing occurred at a lower drift value than in previously studied
specimens.
The decrease in moment capacity following tube tearing occurred more
rapidly in the 30-in. diameter specimen than in the 20-in. diameter specimens.

42
3 .5 DESIGN EXPRESSIONS F ROM UNIVERSITY OF
WASHINGTON TESTS
Lehman and Roeder (2012) used results from the University of Washington experimental
test program to develop a series of expressions for the design of CFT column-to-footing
connections that are capable of transferring the full plastic moment capacity of the CFT
to its adjacent footing element. These expressions include: the required column
embedment depth, the minimum total footing depth, and a minimum shear reinforcing
requirement.
3.5.1 Required Embedment Depth
The cone pullout model shown in Figure 3.9 was used to develop an expression for the
required column embedment depth, to assure ductile behavior of the connection. The
expression is defined as:
√
√
(3.1)
In Eq. 3.1, represents the outside diameter of the annular ring in a monolithic
connection, or the diameter of the corrugated pipe in an isolated connection. and
represent the diameter and thickness of the steel tube, respectively, is the tensile
strength of the tube, and is the compressive strength of the footing concrete.

43
Figure 3.9: Cone pullout model for required CFT embedment depth
3.5.2 Minimum Footing Depth
In order to prevent punching shear failure in the foundation, adequate concrete depth
must be provided below the concrete filled tube. Using ACI requirements as a basis for
punching shear evaluation (ACI, 2011), Lehman and Roeder developed an expression for
the required total footing depth, to prevent punching shear failure:
√
√
(3.2a)
(3.2b)
where and are the compression forces in the concrete and steel due to combined
bending and axial load as computed by the PSDM.
3.5.3 Shear Reinforcing Requirements
The required embedment depth defined in Eq. 3.1 results in a shear stress of √ in the
critical area surrounding the tube. Assuming the concrete resists a shear demand of √ ,
the vertical shear reinforcement in this area must be designed to resist √ .

44
CHAPTER 4
EXPERIMENTAL TEST PROGRAM
As discussed in the previous chapter, the University of Washington has conducted an
extensive research program to develop expressions for the design of CFT column-to-
foundation connections. Full realization of the system, however, requires the
development of CFT column-to-cap beam connection details, which present additional
challenges due to geometric and reinforcement constraints. In an effort to address these
constraints, a continuation of the University of Washington experimental test program
has been implemented to investigate the response of five different CFT column-to-cap
beam connections. Section 4.1 provides an overview of the five specimens in the test
program, introducing their force transfer mechanisms and strength and ductility
limitations. The basic geometric layouts are presented in Section 4.2, followed by the
design and construction processes in Section 4.3. The specimen material properties are
presented in Section 4.4, followed by the experimental test set up, loading protocol, and
instrumentation set up in Sections 4.5, 4.6, and 4.7, respectively.
4 .1 SPECIMEN TEST MATRIX
This section describes the force transfer mechanisms and strength and ductility
limitations of the five proposed specimens in this test program. The specimens are
divided into three categories depending on their connection type: 1) embedded CFT
connections, 2) welded reinforced concrete connections, and 3) reinforced concrete
connections. The three proposed connection types are presented in Figure 4.1.

45
Figure 4.1: Proposed CFT column-to-cap beam connections
4.1.1 Embedded CFT Connections
Figure 4.1a shows the embedded CFT connection, in which the CFT column is embedded
into a precast RC cap element through a recessed fiber-reinforced grouted connection. An
annular steel ring is welded to the embedded end of the steel tube to provide anchorage of
the column, and to transfer shear and moment to the surrounding concrete and reinforcing
bars via diagonal compression struts, as shown in Figure 4.2. The strength and ductility
of this connection is controlled by the steel tube component, as long as adequate
embedment of the CFT is provided (Lehman and Roeder, 2012).
Figure 4.2: Embedded CFT force transfer mechanism

46
Two specimens with the embedded CFT connection type are investigated in this test
program. The first specimen, EMB80, is constructed using a 20-in. diameter spiral-weld
steel tube. The second specimen, EMB96, is constructed using a 24-in. diameter straight-
seam tube. Because the straight-seam weld does not impose strain concentrations in the
buckled region of the steel tube, it is intended that Specimen EMB96 will experience an
increased ductility response compared EMB80 with the spiral-welded tube.
4.1.2 Welded Reinforced Concrete Connections
Figure 4.1b shows the welded reinforced concrete connection, in which headed
reinforcing bars are welded to the inside of the steel tube and are developed into the cap
beam. The axial, moment, and shear transfer is provided by the longitudinal reinforcing
bars, which also control the strength and ductility of the specimen. The force transfer
mechanism of this connection is similar to that in Figure 4.2, except the compression
struts initiate from the heads of the embedded reinforcing bars, as opposed to the annular
ring in the embedded CFT connection. Because the reinforcing ratio of the welded RC
connection is lower than that of the embedded connection, the specimens with this
connection type do not achieve the plastic moment capacity of the CFT.
Two specimens with the welded RC connection detail are investigated in the test
program. The first welded RC connection specimen, WRC, contains longitudinal
reinforcing bars that are fully bonded to the surrounding concrete. In the second welded
RC connection specimen, WRCUB, the reinforcing bars are partially debonded in the
column-to-cap beam interface region. This intentional debonding is intended to increase
the ductility of the connection, by allowing deformations to distribute along a greater

47
length of the reinforcing bar, consequently decreasing the strains in the steel (Stringer,
2010).
4.1.3 Reinforced Concrete Connection
Figure 4.1c shows the traditional reinforced concrete (RC) connection, in which
longitudinal and transverse reinforcing extend from the CFT column into the cap beam.
Cover is provided between the longitudinal reinforcing bars and the inside of the steel
tube, and there is a grouted soffit between the base of the steel tube and the surface of the
cap beam. The test program investigates one specimen with this connection detail, as this
is standard practice in the state of Alaska.
4 .2 SPECIMEN LAYOUT
The geometric and reinforcement layouts of the specimens in this test program are based
off the Laguna De Santa Rosa Bridge located outside of Santa Rosa, California. The
prototype bridge is constructed with conventional reinforced concrete columns that are
48-in. in diameter, and are reinforced longitudinally with 32 bundled No. 11 bars, and
transversely with No. 8 bars spaced at 6-in. on-center. For the purpose of this study, the
prototype RC column was redesigned using a comparable CFT, shown previously in
Figure 2.4. The redesigned CFT column uses a 42-in. diameter, 0.5-in. thick steel tube
with a resulting D/t ratio of 84.
Based on material availability and test apparatus limitations, four 20-in. diameter
columns and one 24-in. diameter column with steel tube thicknesses of .25-in. were
selected to represent 45% and 55% scaled specimens with respective D/t ratios of 80 and

48
96. The widths of the cap beams varied from the prototype bridge, as they were selected
from results of a parametric study performed by Stephens (Stephens, 2014) that evaluated
the connection performance for differing cap beam widths. Results from the study
suggested that the width of the cap beam could be minimized to 2D while still achieving
strength and ductility performance objectives.
Figure 4.3a presents the resulting geometry for the four specimens containing 20-in.
diameter columns. The cap beams for these specimens are 25-in. high, 40-in. (2D) wide,
and 76-in. in length. Figure 4.3b presents the geometry for Specimen EMB96, which has
a 24-in. diameter column. The cap beam for this specimen stands 29.75-in. high, 48-in
(2D) wide, and 76-in. in length.
Figure 4.3: Basic Layout of (a) Specimens EMB80, WRC, WRCUB and RC, and (b) EMB96

49
4 .3 SPECIMEN DESIGN AND CONSTRUCT ION
The objective of the design process was to design each specimen such that a plastic hinge
would form in the column, and the cap beam would remain essentially elastic when
subject to axial and lateral loading. In order to assure these performance objectives were
met, the specimens were designed using a combination of standard design provisions, the
2010 Caltrans Seismic Design Criteria, and design expressions developed from previous
CFT column-to-footing experimental research. An overview of the relevant design
expressions specified in the Caltrans Seismic Design Criteria is provided in Section 4.3.1.
Sections 4.3.2 through 4.3.4 outline the specific design processes and construction
procedures used for the embedded CFT specimens, welded RC specimens, and RC
specimen, respectively.
4.3.1 Caltrans Seismic Design Criteria
The 2010 Caltrans Seismic Design Criteria (SDC) specifies seismic design requirements
for concrete bridge construction. Section 7.4 of the SDC provides the minimum detailing
requirements of joint regions in RC bridges such that the superstructure remains elastic,
while plastic hinges form in adjacent substructure elements. The proceeding section
summarizes the design expressions from the SDC that are relevant to this research.
Joint Performance
Section 7.4.1 of the Caltrans SDC requires moment resisting connections between
the superstructure and column to be designed to transmit the maximum forces
produced when the column reaches its overstrength capacity, . The
overstrength capacity is defined in Caltrans SDC Eq. 4.4 as:

50
(4.1)
where is the plastic moment capacity of the CFT. The 20% overstrength
magnifier is applied to the moment capacity of the column to account for material
strength variations between the column and the cap beam.
Joint Shear Reinforcement Requirements
If the principal tension stress in the joint region exceeds √ additional joint
shear reinforcement is required in the form of horizontal and vertical stirrups, as
well as horizontal side reinforcing. Section 7.4.4.3 of the Caltrans SDC defines
the required horizontal and vertical joint shear reinforcement area,
and
, as:
(4.2a)
(4.2b)
where
is the total area of column reinforcement anchored in the joint. Caltrans
requires the horizontal and vertical stirrups to be placed transversely within a
distance extending from either side of the column centerline, where is the
diameter of the column. The horizontal stirrups are to be placed around the
vertical stirrups in two or more intermediate layers, with vertical spacing not to
exceed 18-in.
The required area of longitudinal side reinforcing,
, is defined by Caltrans Eq.
7.21 as:

51
{
(4.3)
where
and
refer to the area of flexural steel at the top and bottom of the
cap beam, respectively. The side reinforcement is to be placed near the sides of
the cap beam, with a maximum spacing of 12-in.
4.3.2 Embedded CFT Connections
Specimen Design
Two CFT column-to-cap beam specimens were proposed using the embedded CFT
connection: EMB80 and EMB96. Specimen EMB80 contains a 20-in. diameter spiral-
weld steel tube, and EMB96 contains a 24-in. diameter straight-seam tube. Both tubes are
¼-in. thick, resulting in respective D/t ratios of 80 and 96.
For both specimens, the required embedment depth was calculated using Eq. 3.1, which
was derived from previous CFT-footing research at UW. The sizes of the annular rings
were selected based on results of a parametric study performed by Stephens (Stephens,
2014), which suggested that the outside diameter of the annular ring could be minimized
to D+16t without influencing the behavior of the connection. Using this design limitation
with a 1/4-in. steel thickness, the resulting annular ring diameters were 24-in and 28-in.
for Specimens EMB80 and EMB96, respectively. The annular rings were welded to the
base of the steel tubes using ¼-in. fillet welds on both the inside and outside of the tube,
such that the full strength of the tube could be developed.

52
In order to minimize inelastic deformations in the cap beam, the primary flexure
reinforcing was designed to resist the plastic moment capacity of the CFT with an
additional 20% overstrength factor. The shear reinforcing was selected to meet Caltrans
Seismic Design Criteria (SDC) requirements, as well as design recommendations from
the embedded foundation connection in which the concrete was assumed to take √ of
the shear demand (Lehman and Roeder, 2012). Horizontal stirrups were included on
either side of the column per Caltrans SDC requirements, as well as on the extreme ends
of the specimen to provide additional confinement around the hold-down regions. The
complete reinforcing and connection details for Specimens EMB80 and EMB96 are
shown in Figures 4.4 and 4.5, respectively.

53
Figure 4.4: Specimen EMB80 Reinforcing Details

54
Figure 4.5: Specimen EMB96 Reinforcing Details

55
Specimen Construction
Figure 4.6 provides an overview of the construction process used to construct the two
embedded CFT connection specimens.
Figure 4.6: Embedded CFT connection construction sequence
As shown in Figure 4.6, the first step of the construction process was to cast the cap beam
around a lightweight corrugated steel pipe, such that a void was created in the center of
the cap beam with a diameter greater than that of the annular ring. Figure 4.7 shows the
formwork and corrugated pipe used to create the void for the column.
Figure 4.7: Cap Beam Reinforcing and Formwork

56
As the concrete cured, the annular ring was welded to the base of the steel tube, using
fillet welds on both the inside and outside perimeters of the tube. Four holes were drilled
through the annular ring, which would later be used to help stabilize the column. Figure
4.8 shows the steel tube with the annular ring clamped to the base, in preparation for
welding.
Figure 4.8:EMB80 tube and annular ring
Once the concrete had cured sufficiently, the column (with annular ring welded to the
base) was then lowered into the void such that the holes in the annular ring slid over four
threaded anchor rods that had been embedded into the concrete during casting. Steel
washers were placed around the anchors underneath the annular ring as necessary until
the column was plumb. Once the column was leveled, the remaining void between the
cap beam and steel tube was then filled with 6-ksi fiber-reinforced grout. The first lift of
the grout pour was left to set for several hours, such that subsequent grout pours wouldn’t

57
seep underneath the annular ring and fill up the embedded portion of the steel tube. Once
the grout was cured, the column was finally filled with low-shrinkage, 6-ksi self-
consolidating concrete.
4.3.3 Welded RC Connections
Two specimens were designed with welded RC connections: one with fully bonded
reinforcing bars, and one with partially debonded reinforcing bars intended to increase
the ductility of the connection. For both specimens, the target reinforcement ratio of the
connection was 3%, per discussion with Caltrans. However, based on construction
limitations, the final design was limited to 8 No. 9 longitudinal reinforcing bars, with a
resulting reinforcement ratio of 2.5%. The bars were embedded 14-in. (12db) into the cap
beam, as calculated from standard ACI requirements for headed reinforcing bars using
respective steel and concrete design strengths of 60 ksi and 6 ksi. Per discussion with
Caltrans, the reinforcing bars were developed 27-in. (24db) into the CFT column. The
ends of the reinforcing bars were welded to the inside of the steel tube using ¼-in. flare
bevel groove welds. The weld lengths were designed such that the strength of each pair
exceeded the ultimate strength of the reinforcing bar.
For Specimen III, the required debonded bar length was calculated using Equation 4.4
(Stringer 2010).
(4.4)
Where:
Target rotation of connection at failure (in radians)

58
Curvature of connection at a steel strain limit of 0.05 in/in, as
obtained from a moment curvature analysis.
Assuming a target connection rotation of 8% at failure, the resulting debonded bar length
was 22-in., centered at the column-cap beam interface.
The flexure reinforcing for the welded RC connections was again designed to exceed the
plastic moment capacity of the CFT, while the shear reinforcing was designed according
to Caltrans SDC requirements. The complete reinforcing details for both welded
connection specimens are presented in Figure 4.9.

59
Figure 4.9: Specimens WRC, WRCUB, and RC Reinforcing Details

60
Specimen Construction
Figure 4.10 shows the sequence used to construct the two welded RC specimens. Similar
to the previous sequence, the cap beams were first cast around a void created by
corrugated steel pipe.
Figure 4.10: Welded RC Connections Construction Sequence
As the concrete cured, the annular ring was welded to the base of the steel tube using a
¼-in. fillet weld, and the longitudinal reinforcing bars were welded to the inside of the
steel tube such that the heads of the bars projected 15.5-in. from the end of the column.
This projection accounts for the 14-in. embedment into the cap beam, as well as the 1.5-
in. grouted soffit. Figure 4.11 shows Specimen WRC after the annular ring and
reinforcing bars had been welded to the steel tube.

61
Figure 4.11: Specimen WRC annular ring and reinforcing bars
Due to the relatively small diameter of the steel tube in conjunction with the depth of the
weld region inside the tube, only four of the eight total bars (every-other bar) could be
welded from the base of the tube, and the remaining four had to be welded from the other
free end. After the bars were welded, 1¼-in. lightweight PVC was placed over the bars in
Specimen WRCUB to debond them from surrounding concrete. Hydrostone was applied
to the ends of the PVC to ensure a watertight seal.
To serve as formwork for the grouted soffit, a 24-in. diameter Sonotube was placed on
top of the cap beam around the existing void. Both the void and the Sonotube were then
quickly filled with 6-ksi, fiber-reinforced grout. The steel tube and reinforcing bars were
then promptly lowered until the heads reached the bottom of the grout-filled void.

62
Ratchet straps were used to level and support the column while the grout set. Lastly, the
steel tube was filled with low-shrinkage, self-consolidating concrete.
Because the CFT-to-cap beam specimens would be constructed right side up in the field,
there is concern for the weight of the cap beam bearing solely on top of the headed
reinforcing bars. Because of this, the construction process was altered slightly for the
second welded RC connection, to provide proof of concept for construction in the field.
For this alternative method, a second steel ring of larger diameter was tack welded to the
top of the existing annular ring. Shims were then placed between the surface of the cap
beam and the second steel ring, such that the weight of the cap beam would bear on this
added ring as opposed to the reinforcing bars. The void was then filled with fiber-
reinforced grout, and the ring was removed by grinding through the welds after the grout
had cured.
4.3.4 RC Connection
Specimen Design
The design of the RC connection was similar to that of the welded RC connections,
except the reinforcing bars were not welded to the inside of the steel tube. Instead, a 1-in.
cover was provided between the longitudinal reinforcing bars and the inside of the steel
tube, and the bars were fully developed into the CFT. The development length of the bars
was calculated from standard ACI requirements, assuming a design steel strength of 60
ksi, and a specified concrete compressive strength of 6 ksi. The transverse reinforcement
was selected based on the required Caltrans SDC minimum reinforcement ratio, resulting

63
with a No. 3 spiral spaced at 2.5-in. on center. The remaining flexure and shear
reinforcing was the same as that of the welded connections, as shown in Figure 4.9.
Specimen Construction
The construction sequence for the RC connection specimen is shown in Figure 4.12.
Again, it should be noted that this sequence differs from that in the field, due to
constructing the specimen upside-down in the structures laboratory.
Figure 4.12: RC Connection Construction Sequence
Similar to the previous construction processes, the cap beam was first cast around a void
created by a corrugated steel pipe. The longitudinal rebar cage, shown in Figure 4.13, was
then lowered into the void, which was subsequently filled with fiber-reinforced grout.
Once set, a 20-in. diameter Sonotube was placed above the grouted surface, and filled
with an additional 1.5-inches of grout to create the soffit beneath the column. Lastly, the
steel tube was lowered around the rebar cage onto the soffit, and filled with self-
consolidating, low-shrinkage concrete.

64
Figure 4.13: Reinforcing cage of Specimen RC

65
4 .4 SPECIMEN MATERIALS
A variety of materials were used in the construction of the CFT column-to-cap beam
specimens. These materials are summarized in Table 4.1, along with their respective
specifications and supplying vendors.
Table 4.1: Material List (Adapted from Lee, 2011)
Item Designation Vendor
Spiral Weld Steel Tube AWWA C200, ASTM
A1018-07 SS Northwest Pipe
Straight Seam Steel Tube
Annular Ring ASTM A572 Bloch Steel
Reinforcing Steel ASTM A615-09 Grade 60 Addison Supply
Corrugated Pipe AASHTO M36, ASTM A760 Washington Culvert
Company
Concrete Self-consolidating, low-
shrinkage, 6-ksi Stoneway Concrete
Grout ASTM C-1107 Grades A, B
and C Mason Supply
Fiber Reinforcement Polypropylene, Strux 85/50 Grace Construction
Products
The concrete used for the construction of the columns and cap beams was mixed and
delivered by Stoneway Concrete, with a specified compressive strength of 6-ksi. The cap
beams were constructed using conventional concrete, whereas the steel tubes were filled
with self-consolidating, low-shrinkage concrete. The two embedded specimens were cast
independently, and the cap beams and columns of the three RC specimens were cast
simultaneously. Table 4.2 provides the measured strengths of the concrete and grout
components for each specimen on its respective day of testing.

66
Table 4.2: Day-of-Test Concrete and Grout Compressive Strengths
Specimen
Designation
Test
Date
Cap Beam Stress
(ksi)
Column Stress
(ksi)
Grout Stress
(ksi)
I EMB80 10-31-13 9905 10732 6767
II WRC 1-20-14 9767 8766 7916
III WRCUB 2-14-14 9452 7516 8078
IV RC 3-14-14 10016 9742 N/A
V EMB96 7-8-14 10057 8256 N/A
Four specimens were constructed using 20-in. diameter spiral weld steel tubes, and one
specimen was constructed using a 24-in. diameter straight seam steel tube. Table 4.3
summarizes the tensile test results of the five steel tubes.
Table 4.3: Steel Tube Material Properties
Specimen
Designation
Tube
Type
Yield Stress
(ksi)
Ultimate Stress
(ksi)
I EMB80 Spiral Weld
II WRC Spiral Weld
III WRCUB Spiral Weld
IV RC Spiral Weld
V EMB96 Straight Seam
Table 4.4 presents the average material properties of the reinforcing bars used in the three
RC connection specimens.
Table 4.4: Longitudinal Reinforcing Bar Material Properties
Specimen
Designation
Yield Stress
(ksi)
Ultimate Stress
(ksi)
I-III WRC, WRCUB, RC

67
4 .5 EXPERIMENTAL TEST SETUP
The CFT column-to-cap beam specimens were tested using a self-reacting rig developed
by Angela Kingsley, as shown in Figure 4.14. The rig is centered underneath a 2400-kip
Baldwin Universal Testing Machine, which applies a constant axial load to the top of the
column. A 220-kip actuator is used to apply a cyclic, displacement-controlled lateral load
to the specimen at a height of 72-in. above the surface of the cap beam.
Figure 4.14: Experimental Test Rig
The cap beam was fixed to the reaction block using high-strength Williams all-thread
bars. As shown in Figure 4.15, the bars are spaced at 60-in. on-center in the direction of
loading, and 18-in. on-center in the direction perpendicular to loading. Each rod was

68
post-tensioned to 120-kips to prevent any uplift or slip from occurring during testing. A
layer of hydrostone was placed between the surface of the reaction block and the
underside of the cap beam to ensure a level bearing surface.
Figure 4.15: Williams Rods Layout
A spherical, swivel-head bearing was fixed to the top of the CFT column to allow for
lateral displacements while still maintaining a constant axial load. The bearing sat within
a recessed steel plate, which was lined with a polytetrafluoroethylene (PTFE) sliding
surface, as shown in Figure 4.16. Under lateral loading, the PTFE slid within a stainless
steel-lined channel, which was fixed to the bottom of the Baldwin head to prevent out-of-
plane drifts. A silicone lubricant was applied between the PTFE and stainless steel to
create a low-friction sliding surface.

69
Figure 4.16: Axial Load Apparatus
Figure 4.17 shows the actual test rig with Specimen EMB80 anchored to the reaction
block.

70
Figure 4.17: Experimental test rig with Specimen EMB80
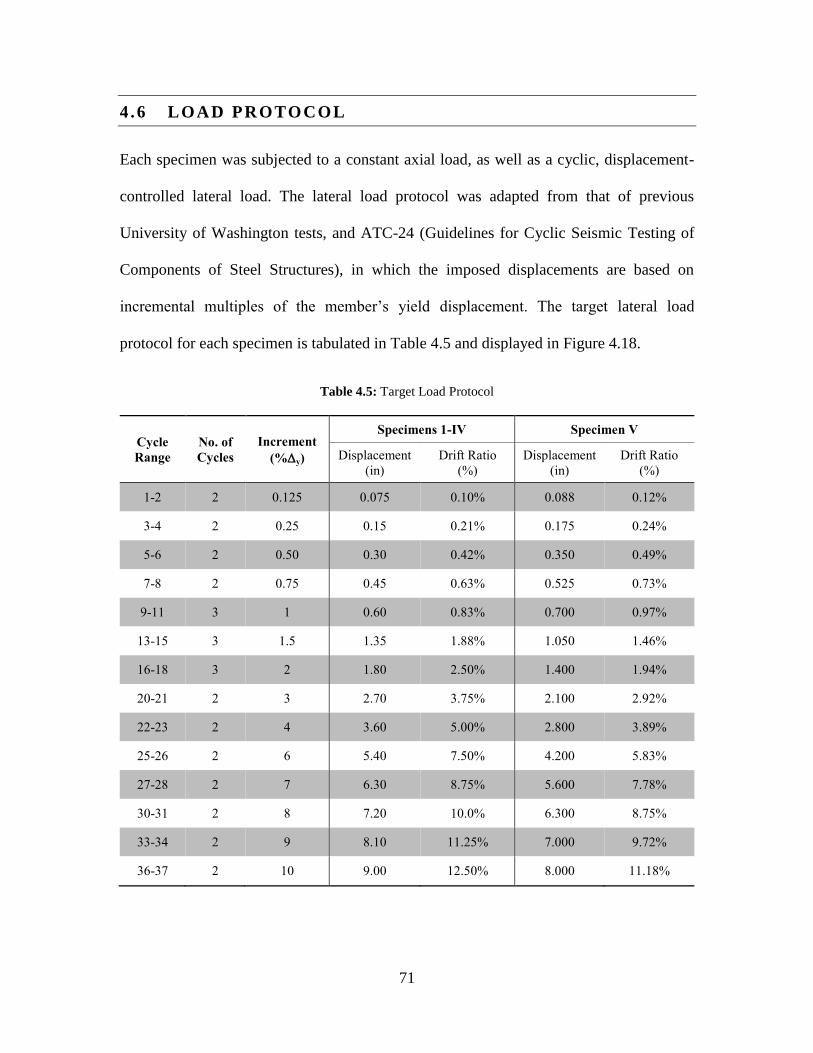
71
4 .6 LOAD PROTOCOL
Each specimen was subjected to a constant axial load, as well as a cyclic, displacement-
controlled lateral load. The lateral load protocol was adapted from that of previous
University of Washington tests, and ATC-24 (Guidelines for Cyclic Seismic Testing of
Components of Steel Structures), in which the imposed displacements are based on
incremental multiples of the member’s yield displacement. The target lateral load
protocol for each specimen is tabulated in Table 4.5 and displayed in Figure 4.18.
Table 4.5: Target Load Protocol
Cycle
Range
No. of
Cycles
Increment
(%y)
Specimens 1-IV Specimen V
Displacement
(in)
Drift Ratio
(%)
Displacement
(in)
Drift Ratio
(%)
1-2 2 0.125 0.075 0.10% 0.088 0.12%
3-4 2 0.25 0.15 0.21% 0.175 0.24%
5-6 2 0.50 0.30 0.42% 0.350 0.49%
7-8 2 0.75 0.45 0.63% 0.525 0.73%
9-11 3 1 0.60 0.83% 0.700 0.97%
13-15 3 1.5 1.35 1.88% 1.050 1.46%
16-18 3 2 1.80 2.50% 1.400 1.94%
20-21 2 3 2.70 3.75% 2.100 2.92%
22-23 2 4 3.60 5.00% 2.800 3.89%
25-26 2 6 5.40 7.50% 4.200 5.83%
27-28 2 7 6.30 8.75% 5.600 7.78%
30-31 2 8 7.20 10.0% 6.300 8.75%
33-34 2 9 8.10 11.25% 7.000 9.72%
36-37 2 10 9.00 12.50% 8.000 11.18%

72
Specimens I-IV were subjected to an axial load equal to 10% of their compressive load
capacity, while Specimen V was only subjected to an axial load equal to 5% of its
compressive load capacity. The axial load was reduced for Specimen V to ensure the
actuator had sufficient capacity to apply the necessary load to reach the plastic moment
capacity of the larger specimen.
Figure 4.18: Target load protocol

73
4 .7 SPECIMEN INSTRUMENTATION
This section describes the instrumentation used to capture the behavior of the specimens
during testing. An overview of the five instrument types is presented in Table 4.6. The
global instrumentation plan is described in Section 4.7.1, followed by the column and
connection instrumentation plans respectively in Sections 4.7.2 and 4.7.3.
Table 4.6: Instrument Overview
Instrument Type Purpose Picture
Spectrotilt
Inclinometer
Column
rotation
String
Potentiometer
Column
displacement
Duncan
Potentiometer
Actuator beam
deflection, cap beam
slip, test rig slip
Tokyo Sokki
KenKyujo Strain
Gauge
Steel tube strains,
reinforcing bar
strains
NDI Optotrak
Certus Motion
Capture system
Connection
displacement &
rotation

74
4.7.1 Global Instrumentation
Duncan potentiometers were used to capture any global displacements that occurred
during testing. As shown in Figure 4.19, three Duncan potentiometers were fixed to the
base of the cap beam, intended to measure any horizontal slip or vertical uplift of the cap
beam relative to the reaction block. Similarly, three additional Duncan potentiometers
were fixed to the base of the reaction block to measure any slip or uplift relative to the
laboratory floor. A final Duncan potentiometer was mounted to a reference column South
of the test rig, such that lateral deflections of the actuator beam could be measured during
loading. A summary of the Duncan potentiometer locations is provided in Table 4.7.
Figure 4.19: Global Instrumentation Schematic

75
Table 4.7: Global Instrumentation Summary
Instrument
Name
Instrument
Type
Instrument
Location
Description
of Measurement
Act. Beam Duncan
Potentiometer Behind actuator beam
Horizontal beam
deflections
CB N Vert Duncan
Potentiometer North side of cap beam Cap beam uplift
CB S Vert Duncan
Potentiometer South side of cap beam Cap beam uplift
CB S Lat Duncan
Potentiometer South side of cap beam Horizontal cap beam slip
Rx N Vert Duncan
Potentiometer
North side of reaction
block Reaction block uplift
Rx S Vert Duncan
Potentiometer
South side of reaction
block Reaction block uplift
Rx S Lat Duncan
Potentiometer
South side of reaction
block
Horizontal reaction block
slip
4.7.2 Column Instrumentation
A combination of string potentiometers and inclinometers was used to capture the
behavior of the column during testing. Descriptions of two instrumentation types are
provided in the following sections with their locations shown in Figure 4.20 and
summarized in Table 4.8.
String Potentiometers
A series of four string potentiometers was used to measure horizontal displacements
along the North side of the column. As shown in Figure 4.20, three string potentiometers
were placed in the plastic region of the column, at 6-in. intervals above the surface of the
cap beam. Additionally, a fourth string potentiometer was attached to the point of lateral
loading (72 inches above the cap beam surface) such that the measured displacements
from the string potentiometer could be compared to those from the LVDT. The string

76
potentiometers were attached to the CFT column using a magnetic connection, and were
secured with hot glue to ensure they did not slip. The housings of the potentiometers were
secured to a reference column that was fixed to the North side of the reaction block.
Incl inometers
A series of three inclinometers was used to measure rotations along the height of the
column. The inclinometers were spaced at 6-in. intervals, starting 3-in. above the surface
of the cap beam. The inclinometers were fixed to the East side of the column, closest to
the data acquisition system.
Figure 4.20: Column Instrumentation Schematic

77
Table 4.8: Column Instrumentation Summary
Instrument
Name
Instrument
Type
Instrument
Location
Description
of Measurement
SP +6 String Potentiometer North side of column, 6” above
cap beam surface
Column
displacement
SP +12 String Potentiometer North side of column, 12”
above cap beam surface
Column
displacement
SP +18 String Potentiometer North side of column, 18”
above cap beam surface
Column
displacement
SP +72 String Potentiometer North side of column, 72”
above cap beam surface
Column
displacement
Inc. +3 Inclinometer East side of column, 3” above
cap beam surface Column rotation
Inc. +9 Inclinometer East side of column, 9” above
cap beam surface Column rotation
Inc. +15 Inclinometer East side of column, 15” above
cap beam surface Column rotation
4.7.3 Connection Instrumentation
The Optotrak Certus Motion System was used in conjunction with a series of uniaxial and
biaxial strain gauges to capture the behavior of the column-to-cap beam connection
region during testing. Section 4.7.3.1 details the strain gauge setup, and Section 4.7.3.2
describes the Optotrak Certus Motion System.
4.7 .3 .1 Strain Gauge Setup
High-elongation, 5-mm strain gauges were used to measure strains in the steel tube and
longitudinal reinforcing bars during testing. The strain gauges were placed within the
plastic hinge region of the column, primarily on the Northern & Southern-most sides of
the specimens. Uniaxial strain gauges were used to measure longitudinal strains, whereas

78
biaxial strain gauges were used in areas where both longitudinal and hoop strains were of
interest. The strain gauge schematic for Specimen EMB80 is presented in Figure 4.21,
and the schematic for the RC specimens is presented in Figure 4.22.
Figure 4.21: EMB80 Strain Gauge Schematic
As shown in Figure 4.21, Specimen EMB80 had uniaxial strain gauges running along the
north and south sides of the column, with two additional gauges in the NE, NW, SE and
SW directions. Biaxial strain gauges were placed 3-in. above the surface of the cap
beam, at the anticipated apex of local buckling. Table 4.9 summarizes the strain gauge
locations for Specimen EMB80.

79
Table 4.9: EMB80 Strain Gauge Locations
Instrument
Name
Strain Gauge
Type
Instrument
Location
SG N -15 2-wire Uniaxial North reinforcing bar, 15 inches below cap beam surface
SG N -11 2-wire Uniaxial North reinforcing bar, 11 inches below cap beam surface
SG N -7 2-wire Uniaxial North reinforcing bar, 7 inches below cap beam surface
SG N -3 2-wire Uniaxial North reinforcing bar, 3 inches below cap beam surface
SG N +3 2-wire Biaxial North side of tube, 3 inches above cap beam surface
SG N +5 2-wire Uniaxial North reinforcing bar, 9 inches above cap beam surface
SG N +13 2-wire Uniaxial North reinforcing bar, 15 inches above cap beam surface
SG N +27 2-wire Uniaxial North side of tube, 27 inches above cap beam surface
SG NE -15 2-wire Uniaxial Northeast reinforcing bar, 15 inches blow cap beam surface
SG NE -3 2-wire Uniaxial Northeast reinforcing bar, 3 inches blow cap beam surface
SG NW -15 2-wire Uniaxial Northwest reinforcing bar, 15 inches blow cap beam surface
SG NW -3 2-wire Uniaxial Northwest reinforcing bar, 3 inches blow cap beam surface
SG S -15 2-wire Uniaxial South reinforcing bar, 15 inches below cap beam surface
SG S -11 2-wire Uniaxial South reinforcing bar, 11 inches below cap beam surface
SG S -7 2-wire Uniaxial South reinforcing bar, 7 inches below cap beam surface
SG S -3 2-wire Uniaxial South reinforcing bar, 3 inches below cap beam surface
SG S +3 2-wire Biaxial South side of tube, 3 inches above cap beam surface
SG S +5 2-wire Uniaxial South reinforcing bar, 5 inches above cap beam surface
SG S +13 2-wire Uniaxial South reinforcing bar, 13 inches above cap beam surface
SG S +27 2-wire Uniaxial South side of tube, 27 inches above cap beam surface
SG SE -15 2-wire Uniaxial Southeast reinforcing bar, 15 inches blow cap beam surface
SG SE -3 2-wire Uniaxial Southeast reinforcing bar, 3 inches blow cap beam surface
SG SW -15 2-wire Uniaxial Southwest reinforcing bar, 15 inches blow cap beam surface
SG SW -3 2-wire Uniaxial Southwest reinforcing bar, 3 inches blow cap beam surface

80
Figure 4.22a shows the strain gauge locations for both Specimens WRC and WRCUB.
Four uniaxial strain gauges were placed on the north and south reinforcing bars, and two
were placed on the NE, NW, SE and SW bars. Two additional gauges were placed on the
North and South sides of the steel tube to measure strains in the region where the
reinforcing bars are welded to the steel tube and at the base of the column in case any
unexpected local buckling occurred.
As shown in Figure 4.22b, Specimen RC had three strain gauges on the north and south
reinforcing bars, and one gauge in the grouted soffit region on the NE, NW, SE and SW
bars. Three additional strain gauges were placed on the transverse spiral to measure
confining strains at heights of -7, +0.75 and +7.75, relative to the top surface of the cap
beam.
Figure 4.22: Strain gauge schematic for (a) Specimens WRC, WRCUB, and (b) RC

81
Tables 4.10 and 4.11 summarize the strain gauge locations for the WRC and RC
specimens, respectively.
Table 4.4.10: Specimen WRC and WRCUB Strain Gauge Locations
Instrument
Name
Strain Gauge
Type Instrument Location
SG N -11 2-wire Uniaxial North side, 11 inches below cap beam surface
SG N -3 2-wire Uniaxial North side, 3 inches below cap beam surface
SG N +3 2-wire Uniaxial North side, 7 inches below cap beam surface
SG N +5 2-wire Uniaxial North side, 3 inches below cap beam surface
SG N +13 2-wire Uniaxial North side, 3 inches above cap beam surface
SG N +27 2-wire Uniaxial North side, 9 inches above cap beam surface
SG S -11 2-wire Uniaxial North side, 15 inches above cap beam surface
SG S -3 2-wire Uniaxial North side, 27 inches above cap beam surface
SG S +3 2-wire Uniaxial Northeast side, 15 inches below cap beam surface
SG S +5 2-wire Uniaxial Northeast side, 3 inches below cap beam surface
SG S +13 2-wire Uniaxial Northwest side, 15 inches below cap beam surface
SG S +27 2-wire Uniaxial Northwest side, 3 inches below cap beam surface
SG NE -3 2-wire Uniaxial South side, 15 inches below cap beam surface
SG NE +5 2-wire Uniaxial South side, 11 inches below cap beam surface
SG NW -3 2-wire Uniaxial South side, 7 inches below cap beam surface
SG NW +5 2-wire Uniaxial South side, 3 inches below cap beam surface
SG SE -3 2-wire Uniaxial South side, 3 inches above cap beam surface
SG SE +5 2-wire Uniaxial South side, 9 inches above cap beam surface
SG SW -3 2-wire Uniaxial South side, 15 inches above cap beam surface
SG SW +5 2-wire Uniaxial South side, 27 inches above cap beam surface

82
Table 4.11: Specimen RC Strain Gauge Locations
Instrument
Name
Strain Gauge
Type Instrument Location
SG N -7 2-wire Uniaxial North reinforcing bar, 7 inches below cap beam surface
SG N +.75 2-wire Uniaxial North reinforcing bar, .75 inches above cap beam surface
SG N +8.5 2-wire Uniaxial North reinforcing bar, 8.5 inches above cap beam surface
SG S -7 2-wire Uniaxial South reinforcing bar, 7 inches below cap beam surface
SG S +.75 2-wire Uniaxial South reinforcing bar, .75 inches above cap beam surface
SG S +8.5 2-wire Uniaxial South reinforcing bar, 8.5 inches above cap beam surface
SG V -7 2-wire Uniaxial Transverse spiral, 7 inches below cap beam surface
SG V +.75 2-wire Uniaxial Transverse spiral, .75 inches above cap beam surface
SG V +8.5 2-wire Uniaxial Transverse spiral, 8.5 inches above cap beam surface
SG NE +.75 2-wire Uniaxial Northeast reinforcing bar, .75 inches above cap beam surface
SG NW +.75 2-wire Uniaxial Northwest reinforcing bar, .75 inches above cap beam
surface
SG SE +.75 2-wire Uniaxial Southeast reinforcing bar, .75 inches above cap beam surface
SG SW +.75 2-wire Uniaxial Southwest reinforcing bar, .75 inches above cap beam
surface
4 .7 .3 .2. Optotrak Certus Motion Capture System
The Optotrak Certus motion capture system was used to capture the deformed shape of
the column in the plastic region. This system used precision cameras to track 3D
displacements of small LED targets that were attached to the steel tube in the
arrangements presented in Figures 4.22 and 4.23. For each specimen, targets were placed
around the tube with a circumferential spacing of 4 inches, and a vertical spacing of 1.5”

83
in the anticipated buckled region, and 3” in the remainder of the plastic hinge region. As
shown in Figure 4.24, additional targets were placed above the plastic hinge region of the
column to capture deformations in the regions where the longitudinal reinforcing bars
were welded to the inside of the steel tube.
Figure 4.23: EMB80 Optotrak Target Layout (a) North & South Face, (b) West Face
Figure 4.24: WRC, WRCUB, and RC Optotrak Target Layout (a) North & South Face, (b) West Face

84
CHAPTER 5
EXPERIMENTAL OBSERVATIONS
5 .1 INTRODUCTION
The objective of this chapter is to provide a detailed discussion of the observations made
during testing. A series of physical damage states, outlined in Section 5.2, will be used to
evaluate the performance of each specimen. For reference, Table 5.1 provides a summary
of the connection properties specific to each specimen.
Table 5.1: Transverse Specimen Text Matrix
Specimen Designation
Test Date
Column Diameter
Steel
Tube
Thickness
Steel Tube Designation
Annular
Ring Outer
Diameter
Connection Reinforcing
Reinforcing
Embedment
Depth
Steel Tube
Embedment
Depth
EMB80 10-31-13 20-in. ¼-in. AWWA C200
Spiral Seam 24-in. N/A N/A 18-in.
WRC 1-20-14 20-in. ¼-in. AWWA C200
Spiral Seam 24-in.
8 No. 9
headed bars 14-in. N/A
WRCUB 2-14-14 20-in. ¼-in. AWWA C200
Spiral Seam 24-in.
8 No. 9
headed bars 14-in. N/A
RC 3-14-14 20-in. ¼-in. AWWA C200
Spiral Seam N/A
8 No. 9
headed bars 14-in. N/A
EMB96 7-8-14 24-in. ¼-in. API 5L
Straight Seam 28-in. N/A N/A 20.75-in.
The observed damage progression for each specimen, described in Sections 5.3
through 5.7, is separated into three drift ranges: low drift cycles (0% -2% drift), moderate
to high drift cycles (> 2% drift), and specimen failure. The drift ratio is defined in
Equation 5.1 as:
(5.1)

85
in which represents the lateral displacement at the point of loading, and is the
length of the column, shown in Figure 5.1.
Figure 5.1: Specimen drift
For reference, the idealized drift history is summarized in Table 5.2, and displayed in
Figure 5.2.
Table 5.2: Idealized Drift History
Cycle
Range
No. of
Cycles
Increment
(%y)
Specimens EMB80, WRC,
WRCUB, RC Specimen EMB96
Displacement
(in)
Drift Ratio
(%)
Displacement
(in)
Drift Ratio
(%)
1-2 2 0.125 0.075 0.10% 0.088 0.12%
3-4 2 0.25 0.15 0.21% 0.175 0.24%
5-6 2 0.50 0.30 0.42% 0.350 0.49%
7-8 2 0.75 0.45 0.63% 0.525 0.73%
9-11 3 1 0.60 0.83% 0.70 0.97%
13-15 3 1.5 1.35 1.88% 1.05 1.46%
16-18 3 2 1.80 2.50% 1.40 1.94%
20-21 2 3 2.70 3.75% 2.10 2.92%
22-23 2 4 3.60 5.00% 2.80 3.89%
25-26 2 6 5.40 7.50% 4.20 5.83%
27-28 2 7 6.30 8.75% 5.60 7.78%
30-31 2 8 7.20 10.0% 6.30 8.75%
33-34 2 9 8.10 11.25% 7.00 9.72%
36-37 2 10 9.00 12.50% 8.00 11.18%

86
Figure 5.2: Idealized Drift History
Sections 5.3 through 5.7 also provide a hysteretic moment-drift response of each
specimen, where the moment is defined in Equation 5.2 as:
(5.2)
in which variables and represent the applied lateral load and axial load, respectively.
5 .2 OVERVIEW OF DAMAGE S TATES
This section describes the damage states used to evaluate the performance of each
specimen. The damage states are separated into three categories: CFT connection damage
states, RC connection damage states, and cap beam damage states.
As shown in Table 5.3, the damage states for the embedded CFT specimens progress
from initial yielding of the steel tube to local buckling at the base of the column. The
failure mode consists of subsequent tearing at the apex of the buckled region. The steel

87
tube yielding is measured from actual strain gauge data, while the rest of the damage
states are observed visually.
Table 5.3: CFT Damage State Descriptions
Symbol Description Detailed Description Photo
Y1 Initial Yielding Initial yielding of steel
tube.
No observable
damage.
B1 Initial Buckling
Residual out-of-plane
displacement at the apex
of the buckled region
exceeds 0.
B2 Buckling > 2t
Residual out-of-plane
displacement at the apex
of the buckled region
exceeds 2t.
B3 Buckling > 4t
Residual out-of-plane
displacement at the apex
of the buckled region
exceeds 4t.
T1 Tube Tearing
Visual tearing initiation in
the buckled region of the
steel tube.

88
As shown in Table 5.4, the damage states for the RC connection specimens progress from
initial yielding of the reinforcing bars, to cracking and crushing of the grout pad, and
ultimate fracture of the reinforcing bars. Initial yielding is measured from strain gauge
data, while the remaining damage states are observed visually.
Table 5.4: RC Damage State Descriptions
Symbol Description Detailed Description Photo
Y1 Initial Yielding Initial yielding of
reinforcing bars.
No observable
damage.
G1 Grout Cracking Hairline radial cracks
visible in grout pad
G2 Grout Crushing Crushing of grout pad
BV Bars Visible Reinforcing bars visible
BF Bar Fracture Fracture of reinforcing
bars.

89
Table 5.4 defines the damage states for the cap beam, in which damage progresses from
hairline radial cracks to uplift in the concrete.
Table 5.5: Cap Beam Damage State Descriptions
Symbol Description Detailed Description Photo
C1 Initial Cracking Hairline radial cracks visible
in cap beam
C2 Cracking > 2mm Radial crack width exceeds
2mm.
U1 Initial Uplift Visual uplift of concrete
U2 Uplift > 5mm Concrete uplift exceeds
5mm.
U3 Uplift > 10mm Concrete uplift exceeds
10mm

90
5 .3 SPECIMEN EMB80
Specimen EMB80 consisted of a 20-in. diameter spiral-welded CFT embedded 18-in.
(.9D) into a precast reinforced concrete cap beam, as shown in Figure 5.3. The thickness
of the steel tube was ¼-in, resulting in a diameter-to-thickness (D/t) ratio of 80.
The purpose of testing Specimen EMB80 was to evaluate its overall performance
given its reduced annular ring diameter of 24-in. (D + 16t), and reduced cap beam width
of 40-in. (2D). The behavior of this specimen will later be compared to Specimen 3-50
tested by Jason Lee (2011), which has an annular ring diameter of 28-in., and cap beam
width of 68-in.
Figure 5.3: EMB80 Connection Detail
Specimen EMB80 was subjected to a constant axial load of 350-kips, as well as a
cyclic, displacement-controlled lateral load following the load protocol outlined in Table
5.2. The actual drift history achieved during testing is summarized in Table 5.6.

91
The general behavior of the specimen consisted of yielding of the steel tube,
followed by local buckling at the base of the column. Failure consisted of subsequent
ductile tearing at the apex of the buckled region on both the North and South sides of the
column. The moment-drift response of the specimen, with noted damage states, is shown
in Figure 5.4. The dashed line represents the plastic moment capacity of the CFT,
calculated using the PSDM method with specified design strengths.
Figure 5.4: EMB80 Moment-Drift Response
5.3.1 EMB 80 Damage State Summary
Table 5.6 summarizes the progression of damage that was observed to the column and
cap beam during testing, as well as the magnitude of repair that would be required at each
damage state. As shown in Table 5.6, the CFT column reached its final damage state of
tube tearing at 7.0% drift, while the cap beam experienced only limited cracking
throughout the duration of the test. The following section provides a detailed description
of the damage progression, and will refer to this damage state progression table.

92
Table 5.6: EMB80 Damage State Progression Table
Set
No.
Target
Drift (%)
Actual
Drift (%)
Column
Damage
Cap Beam Damage Lateral
Load1
(kips) North South
1 0.10 0.04 21.1
-0.10 -0.10 -23.8
2 0.21 0.10 36.3
-0.21 -0.18 -38.1
3 0.42 0.24 52.6
-0.42 -0.34 -54.1
4 0.63 0.41 69.3
-0.63 -0.52 -71.1
5 0.83 0.57 Y1
82.9
-0.83 -0.69
-84.1
7 1.88 1.45
C1
124.7
-1.88 -1.67
C1 -124.0
8 2.50 2.00
130.9
-2.50 -2.25
-129.3
10 3.75 3.19 B1
136.7
-3.75 -3.45
-131.6
11 5.00 4.43 B2
132.8
-5.00 -4.64
-127.6
13 7.50 7.00 B3 / T1
128.9
-7.50 -7.07
-120.9
14 8.75 8.54
61.9
-8.75 -8.30
-46.5
1 Lateral Load represents the peak load of the first cycle in each drift set
Repair States
No Repair Required
Repair
Full Replacement

93
5.3.2 Low Drift Cycles (0.0% - 2.0% Drift)
There was no visual damage observed to the column or cap beam during the first three
sets of loading. At an imposed drift of 0.41%, circumferential hairline cracks initiated on
the South side of the specimen along the grout-cap beam interface and the column-grout
interface, as shown in Figure 5.5. During the next load set at 0.57% drift, yielding of the
steel tube was measured by strain gauges located 3-in. above the surface of the cap beam
on both the North and South sides of the column.
Figure 5.5: EMB80 Cracking on South side of Column at 0.41% drift (Column displaced to the North)
At 1.45% drift, circumferential hairline cracks initiated along the grout interface on the
North side of the specimen, similar to those shown in Figure 5.5. At this same drift,
cracks were observed propagating radially in the grout pad and the cap beam, as shown in
Figures 5.6a and 5.6b. These cracks were hairline in width, and they continued
propagating down the East and West sides of the cap beam.
During the third cycle of this load set, slight flaking of the grouted region was
observed near the grout-cap beam interface, as shown in Figure 5.6a. The portions of

94
grout that flaked off ranged between ½-in. and 1-in. in diameter, and were less than ¼-in.
in thickness.
Figure 5.6: EMB80 Radial cracking at 1.45% drift in (a) grout region, and (b) cap beam
5.3.3 Moderate to High Drift Cycles (2.0% - 7.0% Drift)
During the 8th
load set, additional hairline cracks continued to develop radially from the
column and diagonally down the East and West sides of the cap beam. Figure 5.7 shows
cracking on the west side of the cap beam after the column was subjected to 2.25% drift
in the North direction.
Figure 5.7: EMB80 hairline cracking on the west side of the cap beam at 2.25% drift

95
Initial buckling of the North and South sides of the steel tube was observed visually
during the 10th
load set, at 3.19% and -3.45% drift, respectively. At this point, the
specimen had reached its maximum lateral load resistance of 136.7-kips in the South
direction, followed by 131.6-kips in the North direction. The apex of the buckled region
was approximately 1.75-in. above the surface of the cap beam, as shown in Figure 5.8a.
Additional hairline cracks formed radially in the top surface of the cap beam, as well as
vertically and diagonally down the East and West faces of the cap beam. No cracks were
observed on the North and South faces of the cap beam.
The magnitude of the residual out-of-plane displacement (measured at zero drift)
of the buckled region increased with subsequent cycles. Figure 5.8b shows the buckled
region on the South side of the column as it was subjected to 4.43% drift. Again, the apex
of the buckled region was approximately 1.75-in. above the surface of the cap beam, and
the total height of the buckled region was approximately 3.5-in.
Figure 5.8: EMB80 South tube buckling at (a) 3.19% drift, and (b) 4.43% drift

96
5.3.4 Specimen Failure (7.0%+ Drift)
During the first complete cycle of the 13th
load set, the magnitude of the out-of-plane
displacement of the buckled region on both the North and South sides of the column
increased without any tearing observed. Figure 5.9 shows the buckled region on the
South side of the tube after the column was subjected to 7.0% drift to the North. The
lateral load resistance remained stable through the first cycle of this drift set.
Figure 5.9: EMB80 South tube buckling at 7.0% drift
During the second cycle of the same drift set, tearing was observed in the buckled regions
on both the North and South sides of the column, as shown in Figures 5.10 and 5.11,
respectively. During this cycle, the lateral load resistance had decreased to 114.1-kips in
the South direction, and 91.6-kips in the North direction.
The tear on the North side of the column formed approximately 2-in. above the
surface of the cap beam, and was approximately 1 in. in length. As shown in Figure 5.11,
tearing initiated at two locations on the South side of the column: circumferentially along

97
the apex of the buckled region, and diagonally in the heat affected zone along the weld
seam at the base of the column. All tearing initiated at the apexes of the buckled regions.
Figure 5.10: EMB80 tear initiation on North side of column at 7.0% drift
Figure 5.11: EMB80 tear initiation on South side of column at 7.0% drift
After tearing initiated, the specimen was subjected to one more complete load cycle. As
the column reached 8.54% drift in the South direction, the initial tear on the North side of
the column propagated circumferentially, as shown in Figure 5.12.

98
Figure 5.12: EMB80 tear propagation on North side of column at 8.54% drift
The tear propagated along the apex of the buckled region, and the width of the tear at the
Northern-most point was approximately 1-in. as it was subject to tension. As the column
cycled to 8.30% drift in the North direction, the two existing tears on the South side of
the column propagated together as shown in Figure 5.13.
Figure 5.13: EMB80 tear propagation on South side of column at 8.30% drift

99
During this cycle, the lateral load resistance in the North direction had decreased to 46.5-
kips; a 65% decrease from its maximum load of 131.6-kips. Due to this significant
reduction in lateral load resistance, the test was terminated after this cycle was
completed. After the test was terminated, examination of the cap beam revealed no
additional concrete cracking, nor any widening of the existing hairline cracks.

100
5 .4 SPECIMEN WRC
Specimen WRC consisted of a 20-in. diameter CFT column connected to a precast RC
cap beam via 8 No. 9 headed reinforcing bars that were fully bonded to the surrounding
concrete. The reinforcing bars were welded to the inside of the column, and extended 14-
in. (12db) into the cap beam, as shown in Figure 5.14.
Figure 5.14: WRC Connection Detail
The purpose of testing this specimen was to: 1) compare its response to the
previously tested EMB80 specimen, and 2) compare its response to Specimen WRCUB,
which has a similar layout with the exception of partially debonded reinforcing bars. The
specimen was subjected to a constant axial load of 350-kips, as well as a cyclic,
displacement-controlled lateral load following the load protocol outlined in Table 5.2.
The actual drift history achieved during testing is summarized in Table 5.7.

101
The behavior of the specimen consisted of yielding of the reinforcing bars, followed by
crushing of the grouted soffit region. Failure of the specimen consisted of concrete
cracking and uplift in the cap beam, with no reinforcing bar fracture. The moment-drift
response of the specimen, with noted damage states, is shown in Figure 5.15. The dashed
line represents the plastic moment capacity of the RC section, as calculated by the PSDM
method using specified design strengths.
Figure 5.15: WRC Moment-Drift Response
5.4.1 WRC Damage State Summary
Table 5.7 summarizes the progression of damage that was observed to the column and
cap beam during testing, as well as the magnitude of repair that would be required at each
damage state. As shown in the table, there was no reinforcing bar fracture, and failure of
the specimen consisted of cracking and uplift in the cap beam. The proceeding section
provides a detailed description of the damage progression, and will refer to the damage
state progression table.

102
Table 5.7: WRC Damage State Progression Table
Set
No.
Target
Drift (%)
Actual
Drift (%)
Column
Damage
Cap Beam Damage Lateral
Load
(kips) North South
1 0.10 0.07 5.86
-0.10 -0.06 -25.24
2 0.21 0.14 19.74
-0.21 -0.15 -35.15
3 0.42 0.27 Y1 45.33
-0.42 -0.32 -47.37
4 0.63 0.43 73.92
-0.63 -0.5 -56.76
5 0.83 0.59 75.51
-0.83 -0.67 -65.19
7 1.88 1.48 G1 C1 112.20
-1.88 -1.62 C1 -82.60
8 2.50 2.08 116.30
-2.50 -2.24 -80.31
10 3.75 3.3 123.00
-3.75 -3.43 -84.62
11 5.00 4.58 115.50
-5.00 -4.63 -87.71
13 7.50 7.08 G2 C2 117.40
-7.50 -7.04 C2 -75.46
14 8.75 8.43 BV 115.60
-8.75 -8.33 U2 -74.12
16 10.00 9.71 U2 113.40
-10.00 -9.46 U3 -63.06
18 11.25 11.47 U3 80.11
-11.25 -11.01 -47.42
20 12.50 12.96 58.08
-12.50 -12.35 -22.00
Repair States
No Repair Required
Repair
Full Replacement

103
5.4.2 Low Drift Cycles (0.0% - 2.0% Drift)
There was no observed damage to the specimen during the first two cycle levels. During
the third cycle level, a hairline crack initiated circumferentially along the grout soffit-
steel flange interface on both the North and South sides of the specimen. On the South
side of the specimen, a circumferential hairline crack also initiated along the base of the
soffit, at the grout-cap beam interface. Figures 5.16a and 5.16b show the initiation of
cracking on the North and South sides of the specimen, respectively.
Figure 5.16: WRC soffit cracking at 0.3% drift on the (a) North side of specimen, and (b) South side of
specimen
The existing circumferential cracks along the grout soffit gradually widened with
increasing drift levels. During the 7th
drift set, the openings between the soffit and the
flange on both the North and South sides of the column measured approximately 4-mm
while they were each subjected to tensile loading. The cracks between the soffit and cap
beam on the South side of the specimen increased to approximately 3-mm, while
circumferential hairline cracks initiated at the base of the soffit on the North side of the
specimen. Figures 5.17a and 5.17b show the increased soffit openings on the North and
South sides of the specimen at 1.48% and 1.62% drift, respectively.

104
Figure 5.17: WRC soffit openings on (a) North side of column at 1.48% drift, and (b) south side of column
at 1.62% drift
During the same drift set, hairline cracks initiated radially in the grouted soffit, as well as
in the cap beam. The cap beam cracks formed at approximate angles of 30-45° of one
another, and continued vertically down the East and West faces of the cap beam. Figures
5.18a and 5.18b show the radial cap beam cracking on the North and South sides of the
specimen, respectively.
Figure 5.18: WRC radial cracking on (a) North side of column at 1.48% drift, and (b) south side of column
at 1.62% drift
5.4.3 Moderate to High Drift Cycles (2.0% - 8.0% Drift)
Additional cracks continued to initiate radially from the column as target drift levels
increased. During the 8th
cycle level, some of the existing radial cracks in both the cap

105
beam and grout pad were observed to have widened slightly, such that they were no
longer hairline in width. In addition, the opening between the grout pad and the column
flange increased to approximately 6 mm when the side of the specimen was in tension.
Figure 5.19 shows this soffit-flange opening and increased grout pad crack width on the
North side of the specimen as it was subject to 2.08% drift in the South direction.
Figure 5.19: WRC North grout pad cracking at 2.08% drift
The column reached its maximum lateral load resistance of 123-kips as it was cycled to
3.30% drift in the South direction. At this drift level, the gap between the grout pad and
the column flange increased to approximately 10-mm as each side was loaded into
tension. In addition, the opening at the base of the grout pad on the South side of the
specimen increased to approximately 5-mm under tensile loading. Additional hairline
cracks developed radially on the top surface of the cap beam, as well as vertically down
the East and West faces of the cap beam. Some of the existing cracks on the top surface
of the cap beam widened to approximately 1-mm. Figure 5.20 shows the grout pad

106
openings and increased radial crack widths on the South side of the specimen at 3.43%
drift in the North direction.
Figure 5.20: WRC South grout pad cracking at 3.43% drift North
After the cycle was complete and the column returned to zero drift, the widths of the
residual soffit openings were measured. As shown in Figures 5.21a and 5.21b, both the
North and South sides of the specimen had a residual soffit-flange opening of 2-mm.
Similarly, the opening between the soffit and cap beam on the South side of the specimen
had a residual width of approximately 1-mm, also shown in Figure 5.21b.
Figure 5.21: WRC Residual soffit openings after 10th
load set (a) North side of column, and (b) south side
of column

107
After the cycle was completed, it was also observed that the grout pad had deformed
laterally from underneath the column flange. As shown in Figure 5.22, the width of the
grout extending beyond the edge of the flange approximately 4-mm.
Figure 5.22: WRC residual grout extrusion after 10th
load set
During the 11th
cycle level, new hairline cracks developed radially from the column
towards the rebar lifting loops located in the four corners of the cap beam, shown in
Figures 5.23a and 5.23b.
Figure 5.23: WRC cap beam cracking during the 11
th cycle level (a) North side of specimen, (b) South side
of specimen

108
During the 13th
cycle level, a crack propagated radially from the column down the South
face of the cap beam, as shown in Figure 5.24. At this point in testing, this was the only
crack visible on the South face of the cap beam, and no cracks were visible on the North
face.
Figure 5.24: WRC cracking on South face of cap beam at 7.04% drift
During the same cycle level, several existing radial cracks in the cap beam increased in
width to approximately 2-mm. The cracks that experienced this increase in width were
primarily those strutting towards the rebar lifting loops, as shown in Figure 5.25.
Figure 5.25: WRC cap beam cracking on (a) South side of specimen, and (b) North side of specimen

109
During this cycle level, the widths of the radial cracks in the soffit increased to
approximately 5-mm. The gap between the soffit and flange opened to 30-mm as the
column approached peak drift. No reinforcing bars were visible at this point. Figure 5.26
shows the North side of the soffit while the column was subject to 7.08% drift in the
South direction.
Figure 5.26: WRC North soffit cracking at 7.08% drift South
During the 14th
cycle level, the gap between the soffit and the flange on the North side of
the specimen increased to approximately 35-mm as the column was cycled to 8.43% drift
in the South direction. At this point, the Northern-most reinforcing bar became visible
between the soffit-flange opening, as shown in Figure 5.27.

110
Figure 5.27: WRC exposed reinforcing bar at 8.43% drift South
As the column was cycled to 8.33% drift in the North direction, the soffit-flange and
soffit-cap beam openings on the South side of the specimen reached approximately 25-
mm and 20-mm at peak loading, respectively, as shown in Figure 5.28. No reinforcing
bars were currently visible on the South side of the specimen.
Figure 5.28: WRC South soffit openings at 8.33% drift North
At this point in the cycle, concrete uplift was observed at the South end of the cap beam.
The uplift was approximately 5-mm in height, and it strutted between the corners of the
two bearing plates where the Williams Rods anchored down the South end of the cap

111
beam, as shown in Figure 5.29. The lateral load resistance remained relatively stable
throughout this cycle.
Figure 5.29: WRC South cap beam concrete uplift at 8.33% drift North
5.4.4 Specimen Failure (8.0% + Drift)
During the first cycle of the 16th
cycle level, slight concrete uplift was noticed at the
North end of the cap beam. Similar to the uplift that occurred in the previous cycle, this
uplift also strutted between the two Williams Rods that anchored down the end of the cap
beam. The uplift was approximately 2-mm in height, as shown in Figure 5.30a. In
addition to this uplift, a significant increase in crack width was observed as the North end
of the specimen was subject to tensile loading. Figure 5.30b shows a crack propagating
from the Northern-most point on the column that increased to 3-mm in width during this
cycle. At this point, the lateral load resistance of the column dropped to 90.87-kips; a
26% decrease from the column’s maximum resistance.

112
Figure 5.30: WRC North cap beam damage at 9.71% drift South (Cycle 1)
As the South end of the specimen was cycled into tensile loading, the gap between the
flange and the soffit exposed the Southern-most reinforcing bar. In addition, the existing
uplift at the South end of the cap beam increased from 5-mm to approximately 10-mm in
height, as shown in Figure 5.31.
Figure 5.31: WRC South cap beam damage at 9.46% drift North
During the second cycle of the same drift set, the existing uplift at the North end of the
specimen increased from 2-mm to approximately 5-mm in height, and propagated to the
other side of the William Rod anchors. Figure 5.32 shows the propagation of uplift on the

113
outside of the NE Williams Rod, as well as the existing 5-mm uplift strutting between the
two Williams Rods. The existing uplift at the South end of the cap beam increased to just
over 10-mm as it was subjected to its second tension loading cycle during this drift set.
Figure 5.32: WRC North cap beam uplift at 9.71% drift South (Cycle 2)
During the 18th
cycle level, there was a significant increase in cap beam damage. Figure
5.33 shows the damage on the North side of the specimen as it was subject to 11.47%
drift in the South direction. As shown in Figure 5.33, the existing uplift strutting between
the two North Williams Rod anchors increased from 5-mm to just over 10-mm. The
existing cracks that propagated through the NE and NW rebar lifting loops increased in
width to nearly 10-mm towards the edge of the cap beam. At this point, the lateral load
resistance of the column had dropped to 80.1-kips; a 35% decrease compared to the
column’s maximum lateral load.

114
Figure 5.33: WRC North cap beam damage at 11.47% drift South
On the opposite side of the specimen, there was an increase in soffit crushing. Figure 5.34
shows the South side of the soffit as it was subject to compression at 11.47% drift.
Figure 5.34: WRC South soffit damage at 11.47% drift South
As the specimen cycled to 11.01% drift in the North direction, similar damage was
observed to the South end of the specimen. The existing cracks strutting to the South
rebar lifting loops increased in width to approximately 10-mm, similar to those on the
North side of the specimen. The existing uplift strutting between the two South Williams

115
Rods remained at just over 10-mm in height. This uplift and cap beam cracking through
the rebar lifting loops is shown in Figures 5.35a and 5.35b, respectively.
Figure 5.35: WRC South cap beam (a) uplift and (b) cracking at 11.01% drift North
After the previous drift set, the specimen was subject to one final cycle prior to
termination. The specimen was cycled to 12.96% drift in the South direction, and 12.35%
drift in the North direction. Due to a significant reducing in lateral load resistance, the
test was terminated after this cycle. Figures 5.36a and 5.36b show the cap beam damage
on the North and South sides of the specimen after the final cycle.
Figure 5.36: WRC (a) North, and (b) South cap beam damage after test termination
As shown in Figures 5.36a and 5.36b, failure of the specimen consisted of significant
grout crushing, concrete cracking and uplift, with no reinforcing bar fracture.

116
5 .5 SPECIMEN WRCUB
Specimen WRCUB consisted of a 20-in. diameter CFT column connected to a precast RC
cap beam via 8 No. 9 longitudinal headed reinforcing bars that were partially debonded
from the surrounding concrete. The reinforcing bars were welded to the inside of the
column, and extended 14-in. (12db) into the cap beam. The purpose of testing this
specimen was to compare its behavior to Specimen WRC, which had fully bonded
reinforcing bars. Figure 5.37 shows the WRCUB connection detail.
Figure 5.37: WRCUB Connection Detail
Specimen WRCUB was subjected to a constant axial load of 350-kips, as well as
a cyclic, displacement-controlled lateral load following the load protocol outlined in
Table 5.2. The actual drift history achieved during testing is summarized in Table 5.8.

117
The behavior of the specimen consisted of yielding of the reinforcing bars, followed by
crushing of the grouted soffit region. Failure of the specimen consisted of fracture of two
reinforcing bars at the North side of the column, with concrete uplift at the South end of
the cap beam. The moment-drift response of the specimen, with noted damage states, is
shown in Figure 5.38. The dashed line represents the plastic moment capacity of the CFT,
calculated using the PSDM method with specified design strengths.
Figure 5.38: WRCUB Moment-drift response
5.5.1 WRCUB Performance State Summary
Table 5.8 summarizes the progression of damage that was observed to the column and
cap beam during testing, as well as the magnitude of repair that would be required at each
damage state. As shown in the table, failure of the specimen consisted of bar fracture at
11.07% drift, with uplift in the South side of the cap beam. The proceeding section
provides a detailed description of the damage progression, and will refer to the damage
state progression table.

118
Table 5.8: WRCUB Damage State Progression Table
Set
No.
Target
Drift (%)
Actual
Drift (%) Column
Cap Beam Lateral
Load
(kips) North South
1 0.10 0.07 16.9
-0.10 -0.09 -16.6
2 0.21 0.13 31.7
-0.21 -0.16 -32.1
3 0.42 0.31 Y1 48.1
-0.42 -0.34 -48.0
4 0.63 0.48 59.0
-0.63 -0.52 -57.9
5 0.83 0.65 68.0
-0.83 -0.69 -66.8
7 1.88 1.58 G1 C1 92.7
-1.88 -1.63 C1 -88.6
8 2.50 2.24 96.7
-2.50 -2.24 -93.7
10 3.75 3.51 97.0
-3.75 -3.42 -92.8
11 5.00 4.72 G2 96.3
-5.00 -4.62 -91.7
13 7.50 7.17 BV (PVC) 93.4
-7.50 -7.00 -83.3
14 8.75 8.46 BV 84.1
-8.75 -8.19 C2 -76.6
16 10.00 9.76 85.0
-10.00 -9.39 -74.0
18 11.25 11.07 BF C2 64.8
-11.25 -10.53 U1 -66.4
20 12.50 12.27 51.6
-12.50 -11.58 U2 -55.4
Repair States
No Repair Required
Repair
Full Replacement

119
5.5.2 Low Drift Cycles (0.0% - 2.0% Drift)
There was no cracking observed in the cap beam or grout region until the second set of
loading. At .16% drift to the North, a circumferential hairline crack formed at the soffit-
cap beam interface on the South side of specimen. A similar circumferential crack
initiated on the North side of the soffit as the specimen was subjected to 1.58% drift in
South direction. At this drift level, radial hairline cracking was observed in the grouted
soffit region, as well as in the cap beam. The cap beam cracks initiated radially from the
grout region, and propagated vertically and diagonally down the East and West sides of
the cap beam. As the column cycled back and forth, an opening formed between the soffit
and the annular ring on the side of the specimen subjected to tensile loading. During this
cycle level, this gap opened to approximately 5 mm, as shown in Figure 5.39.
Figure 5.39: WRCUB North cap beam damage at 1.58% drift South
5.5.3 Moderate to High Drift Cycles (2.0% - 11.0% Drift)
As drift levels increased, new radial cracks continued to develop throughout the grout pad
and the cap beam. While the majority of them remained hairline in width for several

120
proceeding cycles, a few of the cracks increased slightly in width during the 8th
drift set.
At 2.24% drift to the South, the cracks propagating in the NE and NW directions
increased to approximately 0.5-mm in width, as shown in Figure 5.40b. At this point, the
opening between the soffit and the flange on the North side of the specimen reached
approximately 10-mm as it was subjected to peak tensile loading, as shown in Figure
5.40a.
Figure 5.40: WRCUB North (a) soffit-flange opening, and (b) cap beam crack widths at 2.24% drift South
During the 10th
cycle level, the maximum lateral load resistance of the specimen was
reached. The maximum load was 97.03-kips, and it occurred as the column was pushed to
3.51% drift in the South direction. At this drift, the opening between the soffit and steel
flange on the North side of the specimen reached approximately 13-mm in height, as
shown in Figure 5.41. During this drift set, new hairline cracks initiated along the top
surface and East and West faces of the cap beam, and the radial cracks in the soffit region
increased to approximately 1-mm in width.

121
Figure 5.41: WRCUB North soffit-flange opening at 3.51% drift South
In the following cycle level, the column was cycled to 4.72% drift in the South direction,
and 4.62% drift in the North direction. At this point, the opening between the grout and
the soffit increased to approximately 18-mm at peak loading, as shown in Figure 5.42a.
On the opposite side of the specimen, crushing of the grout pad was observed, as shown
in Figure 5.42b. There was no new cracking observed in the cap beam during this cycle
level.
Figure 5.42: WRCUB (a) soffit-flange opening, and (b) grout crushing at 4.72% drift South

122
During the 13th
cycle level, the opening between the soffit and the annular ring reached
approximately 30-mm at peak tensile loading, exposing the PVC pipes that encased the
three Northern-most longitudinal reinforcing bars. Figure 5.43 shows the exposed PVC
pipes on the North side of the specimen as it was subjected to 7.17% drift to the South.
Figure 5.43: WRC North soffit opening at 7.17% drift South
After the cycle was complete and the column returned to zero drift, the widths of the
residual soffit-flange openings and lateral grout extrusions were measured. As shown in
Figure 5.44a, the grout extended approximately 16-mm from underneath the edge of the
annular ring. The residual gap between the flange and the soffit was approximately 11-
mm, as shown in Figure 5.44b.

123
Figure 5.44: WRCUB (a) grout extrusion, and (b) residual soffit-flange opening after 13th cycle level
During the 14th
cycle level, new hairline cracks initiated radially form the column, as well
as down the East and West faces of the cap beam. Additionally, an increase in cap beam
crack width was observed as the South side of the specimen was subject to tensile
loading, specifically in the regions where cracks strutted from the column towards the
two Southern rebar lifting loops. Figure 5.45a shows a crack of approximately 2-mm in
width strutting towards the SE rebar lifting loop as the column was subjected to 8.19%
drift in the North direction. At this same drift, the Southern-most reinforcing bar became
exposed from within the PVC, as shown in Figure 5.45b.
Figure 5.45: WRCUB South (a) cap beam cracking, and (b) exposed reinforcing bar at 8.19% drift North

124
As the North side of the specimen was subjected to tensile loading during the 16th
load
set, the opening between the soffit and the annular ring increased to approximately 45-
mm. the PVC encasing the reinforcing bars had split open, such that the three Northern-
most reinforcing bars were now visible, as shown in Figure 5.46. At this point, the lateral
load resistance reached at peak drift had decreased by approximately 20% compared to
the maximum load reached at 3.51% drift.
Figure 5.46: WRCUB North exposed reinforcing bars at 9.76% drift South
5.5.4 Specimen Failure (11.0%+ Drift)
As the column was first displaced to 11.07% drift in the South direction, reinforcing bar
fracture was heard. The opening between the soffit and the annular ring on the North side
of the specimen was approximately 55-mm in height, but the location of the reinforcing
bar fracture could not yet be seen. At this point in testing, the lateral load resistance of the
specimen was 64.8-kips; a 33% decrease from its maximum resistance. Figure 5.47a
shows the soffit-flange opening on the North side of the specimen at the time of bar
fracture. As the column was sequentially cycled to 10.53% drift in North direction, initial

125
uplift was observed at the South end of the cap beam. The uplift was approximately 2-
mm in height, and it strutted between the South Williams Rods and lifting loops, as
shown in Figure 5.47b.
Figure 5.47: WRCUB (a) Soffit-flange opening at first bar fracture, and (b) South concrete uplift at
10.53% drift North
During the following load set, the location of the existing bar fracture became visible as
the North side of the column was cycled into tensile loading. As anticipated, the fracture
occurred on the Northern-most reinforcing bar within the soffit region, shown in Figure
5.48a. As the column approached peak drift, fracture of a second reinforcing bar was
heard at the North end of the column. The location of the second fracture was not visible.
At this point, the lateral load resistance of the specimen was 51.6-kips; a 46% decrease
from the maximum lateral load of 97-kips. Figure 5.48b shows the limited damage state
of the North side of the cap beam at this drift level.

126
Figure 5.48: WRCUB (a) North bar fracture, and (b) North cap beam damage at 12.27% drift South
As the South side of the specimen was cycled into tensile loading, significant crack
widening was observed in the cracks strutting from the grout pad to the Southern
reinforcing lifting loops, shown in Figure 5.49. An increase in concrete uplift height was
also observed near the Southwest Williams anchor rod. No uplift was observed in the
North side of the cap beam.
Figure 5.49: WRCUB South cap beam damage at 11.58% drift North

127
5 .6 SPECIMEN RC
Specimen RC consisted of a typical RC connection, in which 8 No. 9 longitudinal
reinforcing bars with transverse reinforcing extended from the CFT column into the cap
beam. A 1-in. cover was provided between the longitudinal reinforcing bars and the
inside of the steel tube. Figure 5.50 shows the RC connection detail. The purpose of
testing this specimen was to compare its behavior to the WRC specimens, as this
connection detail is standard practice in the state of Alaska.
Figure 5.50: RC Connection Detail
Specimen RC was subjected to a constant axial load of 350-kips, as well as a
cyclic, displacement-controlled lateral load following the load protocol outlined in Table
5.2. The actual drift history achieved during testing is summarized in Table 5.9.

128
The behavior of the specimen consisted of yielding of the reinforcing bars, followed by
crushing of the grouted soffit region. Failure of the specimen consisted of fracture of six
reinforcing bars, with slight concrete uplift at the North and South ends of the cap beam.
The moment-drift response of the specimen, with noted damage states, is shown in Figure
5.51. The dashed line represents the plastic moment capacity of the CFT, calculated using
the PSDM method with specified design strengths.
Figure 5.51: RC Moment-Drift Behavior
5.6.1 RC Performance State Summary
Table 5.9 summarizes the damage that was observed to the column and cap beam during
testing, as well as the magnitude of repair required at each damage state. As shown in the
table, failure of the specimen consisted of bar fracture at 9.83% drift, with slight concrete
uplift observed on the North and South sides of the cap beam at 8.46% and 4.70% drift,
respectively. The proceeding section provides a detailed description of the damage
progression, and will refer to the damage state progression table.

129
Table 5.9: RC Damage State Progression Table
Set
No.
Target
Drift (%)
Actual
Drift (%) Column
Cap Beam Lateral
Load
(kips) North South
1 0.10 0.04 23.1
-0.10 -0.08 -12.7
2 0.21 0.12 35.5
-0.21 -0.16 -25.9
3 0.42 0.28 Y1, G1 50.7
-0.42 -0.33 -40.3
4 0.63 0.44 60.4
-0.63 -0.51 -51.0
5 0.83 0.62 69.8
-0.83 -0.70 -61.1
7 1.88 1.54 C1 94.3
-1.88 -1.67 C1 -85.0
8 2.50 2.14 G2 96.1
-2.50 -2.27 -86.4
10 3.75 3.42 97.5
-3.75 -3.50 -86.2
11 5.00 4.67 94.7
-5.00 -4.70 U1 -83.8
13 7.50 7.20 91.0
-7.50 -7.02 -80.3
14 8.75 8.46 U1 80.4
-8.75 -8.15 BV (Trans.) -74.3
16 10.00 9.83 BV / BF 72.0
-10.00 -9.40 -55.7
18 11.25 11.19 37.7
-11.25 -10.57 -21.2
Repair States
No Repair Required
Repair
Full Replacement

130
5.6.2 Low Drift Cycles (0.0% - 2.0% Drift)
There was no observed damage to the specimen during the first two cycle levels. At .28%
drift, slight cracking and flaking was observed in the grouted soffit region. The pieces of
grout that spalled off were approximately 1/16 – 1/8-in. thick, as shown in Figure 5.52a.
At .44% drift, circumferential cracks formed on the North and South sides of the
specimen, along the soffit-steel tube and soffit-cap beam interfaces, as shown in Figure
5.52b.
Figure 5.52: WRC (a) Soffit spalling at .28% drift, and (b) Soffit cracking at .44% drift
As the drift levels increased, the widths of the circumferential cracks along the top and
bottom of the soffit gradually increased on the side of the specimen subject to tensile
loading. During the 7th
cycle level, these circumferential cracks along the soffit-steel tube
and soffit-cap beam interfaces opened to approximately 1.5-mm and 1-mm, respectively.
During the same cycle level, circumferential hairline cracks began to initiate at the
location where the corrugated pipe separates the grout from the concrete cap beam, as
shown in Figure 5.53. Additionally, hairline cracks began to initiate radially from the
column, continuing vertically down the East and West faces of the cap beam. Figure 5.53

131
shows radial cracking on the South side of the cap beam as the column was loaded to
1.67% drift in the North direction.
Figure 5.53: WRC South cap beam cracking at 1.67% drift North
5.6.3 Moderate to High Drift Cycles (2.0% - 9.0% Drift)
During the 8th
cycle level, crushing of the grouted soffit was observed as each side was
subjected to compressive loading. Figures 5.54a and 5.54b show the crushing on the
North and South sides of the soffit, respectively. During this cycle level, hairline cracks
continued to develop radially in the grouted region, as well as along the top surface and
East and West faces of the cap beam. These cracks remained hairline in width for several
proceeding cycles.

132
Figure 5.54: WRC Soffit crushing (a) North side of specimen, (b) South side of specimen
The column reached its maximum lateral load resistance during the 10th
cycle level. The
peak load was 97.54-kips, and it occurred as the column was first cycled to 3.42% drift in
the South direction.
By the 11th
cycle level, the openings between the soffit and the column had increased to
approximately 10-mm while subject to tensile loading. Figure 5.55 shows the soffit-
column opening on the North side of the specimen as it is subject to 4.67% drift in the
South direction.
Figure 5.55: WRC North soffit-tube opening at 4.67% drift South

133
During this cycle level, slight surface uplift of the grouted region was observed between
the soffit and the cap beam on the South side of the specimen, as shown in Figure 5.56a.
Additionally, slight concrete uplift was also observed in the South side of the cap beam,
just outside of the grouted region. The uplift was approximately 1-mm in height and 5-in.
in length, as shown in Figure 5.56b.
Figure 5.56: WRC initial uplift in (a) South grout region, and (b) South cap beam
During the 13th
cycle level, slight crack widening was observed in cracks propagating
radially in the NE, NW, SE, & SW directions. The widths of these cracks ranged between
.8-mm and 1-mm, as shown in Figure 5.57a. Additional uplift was observed in the South
grouted region, towards the grout-concrete interface, as shown in Figure 5.57b. During
the second cycle of this cycle level, the lateral load resistance of the column had dropped
to 82.8-kips; a 15% decrease from the maximum lateral load.

134
Figure 5.57: RC (a) Cap beam crack widening, and (b) South grout uplift at 7.02% drift North
During the 14th
cycle level, the column was cycled to 8.46% drift in the South direction,
followed by 8.15% drift in the North direction. As the column approached peak drift in
the North direction, the transverse spiral reinforcing on the South side of the column
became exposed through the soffit-steel tube opening. As shown in Figure 5.58a, the
spiral began to bend around the longitudinal reinforcing bars, such that it formed an
octagonal shape. On the opposite side of the specimen, slight concrete uplift was
observed in the cap beam just outside of the grouted region, as shown in Figure 5.58b.
Figure 5.58: WRC (a) South transverse reinforcing, and (b) North concrete uplift at 8.15% drift

135
5.6.4 Specimen Failure (9.0%+ Drift)
During the 16th
cycle level, the opening between the soffit and steel tube increased such
that the transverse reinforcing on the North side of the specimen became exposed as it
was subjected to tensile loading. At peak drift, fracture of the Northern-most reinforcing
bar was heard, but the location of the fracture was not yet visible. At this point, the lateral
load resistance of the column had dropped to 54.5-kips; a 44% decrease compared to its
maximum lateral load.
As the South side of the specimen was cycled to tensile loading, subsequent fracture
occurred in the Southern-most reinforcing bar. Figure 5.59a shows the reinforcing bar
fracture as the column is loaded to 9.40% drift in the North direction. At this point, the
existing concrete uplift at the South side of the cap beam propagated to approximately 8-
in. in length, as shown in Figure 5.59b.
Figure 5.59: WRC South (a) reinforcing bar fracture, and (b) Cap beam concrete uplift at 9.40% drift
North
In the cycle level, the NE, NW, SE and SW reinforcing bars fractured as they were each
respectively subjected to tensile loading. As the reinforcing bars fractured, the lateral load
resistance of the column continued to drop dramatically. Figure 5.60 shows the North &

136
South sides of the specimen at the final drift state after the reinforcing bars fractured. No
additional damage to the cap beam was observed at this drift state.
Figure 5.60: WRC Reinforcing bar fractures (a) North, and (b) South
After the last cycle was complete, the spalled grout pieces were removed from the
specimen for closer inspection of the reinforcing bars. Figures 5.61a and 5.61b show the
North and South sides of the specimen after the grout had been removed.
Figure 5.61: WRC(a) North and (b) South side of specimen after removal of spalled grout

137
5 .7 SPECIMEN EMB96
Specimen EMB96 consisted of a 24-in. diameter straight-seam CFT embedded 20.75-in.
(.9D) into a precast reinforced concrete cap beam, as shown in Figure 5.62. The
thickness of the steel tube was ¼-in, resulting in a diameter-to-thickness (D/t) ratio of 96.
The purpose of testing this specimen was to evaluate the performance of the connection
and cap beam using a straight-seam tube, as opposed to the spiral-welded tube used in
Specimen EMB80.
Figure 5.62: EMB96 Connection Detail
Specimen EMB96 was subjected to a constant axial load equal to 5% of its gross
compressive capacity, as well as a cyclic, displacement-controlled lateral load following
the load protocol outlined in Table 5.2. The actual drift history achieved during testing is
summarized in Table 5.10.

138
The general behavior of the specimen consisted of yielding of the steel tube, followed by
local buckling at the base of the column. Failure consisted of subsequent ductile tearing
at the apex of the buckled region on South side of the tube, and at the base of the buckled
region on the North side of the tube. The moment-drift response of the specimen, with
noted damage states, is shown in Figure 5.63. The dashed line represents the plastic
moment capacity of the CFT, calculated using the PSDM method with specified design
strengths.
Figure 5.63: EMB96 Moment-Drift Response
5.7.1 EMB96 Performance State Summary
Table 5.10 summarizes the damage that was observed to the column and cap beam during
testing, as well as the magnitude of repair required at each damage state. As shown in the
table, failure of the specimen consisted of ductile tearing of the steel tube at 7.50% drift,
with minimal damage to the cap beam. The proceeding section provides a detailed
description of the damage progression, and will refer to the damage state progression
table.

139
Table 5.10: EMB96 Damage State Progression Table
Set
No.
Target
Drift (%)
Actual
Drift (%)
Column
Damage
Cap Beam Damage Lateral
Load
(kips) North South
1 0.12 0.07 24.0
-0.12 -0.08 -21.6
2 0.24 0.13 38.2
-0.24 -0.14 -39.8
3 0.49 0.31 55.9
-0.49 -0.32 -60.4
4 0.73 0.49 76.2
-0.73 -0.47 -81.1
5 0.97 0.65 Y1 88.2
-0.97 -0.65 -95.6
7 1.46 0.94 114.3
-1.46 -1.02 -123.8
8 1.94 1.29 132.5
-1.94 -1.44 -143.0
10 2.92 2.01 155.0
-2.92 -2.28 -161.9
11 3.89 2.55 B1 155.9
-3.89 -3.36 -163.6
13 5.83 4.46 B2 C1 161.4
-5.83 -5.07 -160.7
14 7.78 6.39 B3 152.4
-7.78 -6.86 -151.3
16 8.75 7.50 T1 139.6
-8.75 -7.81 -136.9
18 9.72 8.60 135.1
-9.72 -9.15 -71.9
20 11.18 10.40 45.0
-11.18 -10.60 -35.8
Repair States
No Repair Required
Repair
Full Replacement

140
5.7.2 Low Drift Cycles (0.0% - 2.0% Drift)
There was no visible damage to the cap beam or column during the first two cycle levels.
During the third cycle level, two hairline cracks formed in grout region, propagating
radially in the NE and SW direction. Figure 5.64b shows the radial crack on the South
side of the specimen. At 0.5% drift, circumferential hairline cracks initiated along the
column-grout interface on both the North and South sides of the specimen, as each side
was respectively subjected to tensile loading. Figures 5.64a and 5.64b show the
circumferential grout pad cracks on the North and South side of the specimen,
respectively.
Figure 5.64: EMB96 (a) North and (b) South grout pad cracking at 0.5% drift
During the 5th
load set, strain gauges located 3-in. above the surface of the cap beam
measured yielding of the steel tube at .57% drift in the South direction. During the 7th
load set, a circumferential hairline crack formed along the grout-cap beam interface as the
South side of the specimen was loaded into tension. At the same drift, the opening
between the column and grout interface increased to approximately 1.5-mm while loaded
in tension. Figure 5.65 shows the cracking along the column-grout and grout-cap beam

141
interfaces on the South side of the specimen as it is subjected to 1.02% drift in the North
direction.
Figure 5.65: EMB96 South grout pad cracking at 1.02% drift North
During the subsequent load set, similar circumferential cracks formed along the grout-cap
beam interface on the North side of the specimen as it was displaced to 1.29% drift in the
South direction. These cracks were hairline in width, and approximately 1-in. in length.
During this load set, the crack between the column and the grout region increased to
approximately 2-mm in width as each side of the specimen was subjected to tensile
loading.
5.7.3 Moderate to High Drift Cycles (2.0% - 7.0% Drift)
There was no new damage observed during the 10th
load set. As the column approached
2.3% drift in the South direction, three of the threaded rods that attached the actuator to
the column fractured, and the test was paused such that the rods could be replaced. The
lateral load was 158.2-kips at the time of fracture. After the rods were replaced, the

142
column returned to its original location at zero displacement, and the target load protocol
was continued from the beginning of the drift set.
During the subsequent cycle of the 11th
load set (post-rod replacement), the onset of local
buckling of the steel tube was observed as both the North and South sides of the column
were respectively subjected to compressive loading. The apex of the local buckling was
approximately 2.5-in. from the surface of the cap beam. Figures 5.66a and 5.66b show
the buckling of the steel tube on the South and North sides of the column as they are
respectively subjected to 2.55% drift South and 3.36% drift North. During this load set,
the column was subjected to its maximum lateral load resistance of 163.6-kips in the
North direction.
Figure 5.66: EMB96 Onset of local buckling on (a) South and (b) North side of the column
As the column was displaced to 4.46% drift in the North direction, a crack formed in the
surface of the cap beam, propagating radially from the column in the SE direction. The
crack was hairline in width, and approximately 2-in. long, as shown in Figure 5.67a.
During the same load set, the magnitude of the out-of-plane displacement of the buckled
region increased to approximately 0.50-in., and the distance to the apex of the buckled
region shifted such that it was approximately 2-in. from the top surface of the cap beam.

143
Figure 5.67b shows the residual local buckling on the North side of the specimen after the
column had returned to zero displacement.
Figure 5.67: EMB96 (a) South cap beam cracking and (b) North column buckling after 13th
load set
During the 14th
load set, there was no new damage observed to the cap beam or grout
region. The magnitude of the residual out-of-plane displacement of the buckled region
increased to approximately 1-in., and the height of the apex remained at approximately 2-
in. from the surface of the cap beam. Figure 5.68 shows the buckled region on the South
side of the column at zero displacement after the 14th
load set.
Figure 5.72: EMB96 South local buckling after 14th
load set

144
5.7.4 Specimen Failure (7.0%+ Drift)
During the second cycle of the 16th
drift set, tearing was observed on the South side of
the column. The tear initiated circumferentially along the apex of the buckled region, and
it was approximately 1-in. in length, as shown in Figure 5.69. At this point, the lateral
load resistance was 129.6-kips in the South direction, and 120.5-kips in the North
direction.
Figure 5.69: EMB96 Initiation of South tube tearing
As the column was first displaced to 8.60% drift in the South direction, tearing initiated
on the North side of the column, at the base of the buckled region. The original tear at the
South side of the specimen propagated circumferentially to approximately 4-in. in length.
Figures 5.70a and 5.70b show the tearing on the North and South sides of the specimen,
respectively, while the column is at its peak drift in the South direction.

145
Figure 5.70: EMB96 (a) North and (b) South tube tearing at 8.60% drift South
As the column was subsequently displaced to 9.15% drift in the North direction, the tear
along the base of the buckled region on the North side of the specimen became invisible.
The tear along the South side of the specimen propagated to approximately 16-in. length,
as shown in Figure 5.71.
Figure 5.71: EMB96 South tear propagation at 9.15% drift North
At this point, the lateral load resistance had dropped to 71.91-kips in the North direction,
and no new cracks were observed in the cap beam concrete or grouted region.

146
Figure 5.72 shows the propagation of tearing on the North side of the specimen as the
column was subjected to its second cycle at 8.60% drift in the South direction. During
this cycle, the lateral load resistance dropped to 46-kips and 67.5-kips in the North and
South directions, respectively.
Figure 5.72: EMB96 North tear propagation during second cycle at 8.60% drift South
The specimen was subjected to one final load set, in which the column was displaced to
10.4% drift in the South direction, and 10.6% drift in the North direction. During this
load set, the lateral load resistance dropped 35.8-kips and 45-kips in the North and South
directions, respectively. No new cracking was observed in the cap beam concrete or grout
region. Figure 5.73 shows the final state of the specimen after the termination of testing.

147
Figure 5.73: EMB96 Specimen damage at termination of test

148
CHAPTER 6
DATA INTERPRETATION AND ANALYSIS
This chapter presents the measured responses of the specimens as obtained through
laboratory testing. The data collected from strain gauges, potentiometers, inclinometers,
and the NDI Optotrak motion capture system is used to produce strain and curvature
profiles, rotation profiles, and hysteretic responses to better understand the specimens’
behavior on the component and global level.
6 .1 FORCE-DRIFT RESPONSE
The hysteretic force-drift response of each specimen is presented in Figures 6.1 – 6.5.
The maximum lateral load resisted by each specimen is summarized in Table 6.1, along
with the corresponding drift ratio at each peak load. As shown in Table 6.1, the maximum
lateral load resisted by each specimen occurred at approximately 3.0% drift. It should be
noted that the forces tabulated in Table 6.1 and displayed in Figures 6.1 – 6.5 are
measured directly from the MTS load cell, and do not take into account the additional
contribution from P-Delta effects.
Table 6.1: Specimen Peak Lateral Loads
Specimen
Designation
Peak Lateral
Load (kips)
Drift at
Peak Load
I EMB80 137 3.1%
II WRC 123 3.0%
III WRCUB 97 3.3%
IV RC 98 3.2%
V EMB96 164 -3.3%1
1 Sign indicates direction of loading

149
Figure 6.1: EMB80 Force-Drift Response Figure 6.2: EMB96 Force-Drift Response
Figure 6.3: WRC Force-Drift Response Figure 6.4: WRCUB Force-Drift Response
Figure 6.5: RC Force-Drift Response

150
6 .2 MOMENT-DRIFT RESPONSE
Figures 6.6 through 6.10 present the hysteretic moment-drift responses of the five CFT
column-to-cap beam specimens. The moments are calculated using Equation 5.1, which
takes into account the additional moment contribution from P-Delta effects.
Table 6.2 summarizes the peak moment experienced by each specimen, as well as
the corresponding drift ratios where the maximum moments occurred. For each
specimen, the peak moment occurred several cycles after the peak lateral load was
applied. This shift in maximum load can be attributed to the P-Delta moment contribution
which becomes significant at large rotations.
Table 6.2: Specimen Peak Moments
Specimen
Designation
Peak Moment
(kip-in)
Drift at Peak
Moment
Plastic Moment,
Mp (kip-in)
Peak
Moment/Mp
I EMB80 11334 6.9% 8340 1.36
II WRC 11004 9.5% 8340 1.32
III WRCUB 8956 9.6% 8340 1.07
IV RC 8374 7.1% 8340 1.00
V EMB96 12555 4.4% 9800 1.28
Table 6.2 also presents the peak moment of each specimen normalized by the
plastic moment capacity of the CFT section. The plastic moment capacity was calculated
using the PSDM outlined in Section 2.1.5 with design material strengths. The plastic
moment capacities are represented by red dashed lines in Figures 6.6 through 6.10.

151
Figure 6.6: EMB80 Moment-Drift Response Figure 6.7: EMB96 Moment-Drift Response
Figure 6.8: WRC Moment-Drift Response Figure 6.9: WRCUB Moment-Drift Response
Figure 6.10: RC Moment-Drift Response

152
Figure 6.11 presents the envelopes of the five moment-drift hysteresis plots. The
envelopes were created using the moment and drift values that corresponded to the
maximum moment of the first cycle in each drift set. For comparison, the moments of
each specimen have been normalized by their respective CFT plastic moment capacities
as calculated by the PSDM method and tabulated in Table 6.2.
Figure 6.11: Normalized moment-drift envelope comparison of all specimens
As shown in Figure 6.11, each specimen developed the full plastic moment capacity of
the CFT column when loaded in the South direction (first direction of loading). When
loaded in the North direction, however, only the two embedded specimens developed the
full plastic moment capacity of the CFT.

153
6 .3 LONGITUDINAL STRAIN PROFILES
This section present the longitudinal strain profiles at four increasing drift levels for each
specimen. Section 6.3.1 presents the longitudinal strain profiles for the two embedded
specimens, followed by the strain profiles of the three RC specimens in Section 6.3.2.
For the two embedded specimens, the strain profiles were created using strain
gauge data from the Northern & Southern-most faces of the column. For the three RC
specimens, the strain profiles were created using strain gauge data from the Northern &
Southern-most longitudinal reinforcing bars.
It should be noted that there was a problem with the data acquisition system while
testing Specimen WRC, so manual corrections were made at data point 837. The raw
strain gauge data is presented in Appendix A.

154
6.3.1 Longitudinal Tube Strains
Figure 6.12: EMB80 Longitudinal strain profiles of steel tube

155
Figure 6.13: Longitudinal strain profiles of steel tube

156
6.3.2 Longitudinal Reinforcing Bar Strains
Figure 6.14: WRC Longitudinal strain profiles of North & South reinforcing bars

157
Figure 6.15: WRCUB Longitudinal Strain Profiles of North & South reinforcing bars

158
Figure 6.16: RC Longitudinal strain profiles of North & South reinforcing bars

159
6 .4 CURVATURE PROFILES
This section presents the column curvature profiles for each specimen at four increasing
drift levels. The curvatures were calculated by taking the difference in strains on the
North and South sides of the column, and dividing by the distance between the two
gauges, as shown by Equation 6.1.
This method of calculating curvature assumes plane sections remain plane, as shown in
Figure 6.17.
Figure 6.17: Curvature calculation from strain gauges
The resulting curvature profiles of the five specimens are presented in Figures 6.18 –
6.22.
(6.1)

160
Figure 6.18: EMB80 Curvature profiles

161
Figure 6.19: EMB90 Curvature Profiles

162
Figure 6.20: WRC Curvature profiles

163
Figure 6.21: WRCUB Curvature profiles

164
Figure 6.22: RC Curvature profiles

165
6 .5 COLUMN ROTATION PROF ILES
Figures 6.23 through 6.27 show the rotation profiles for each specimen at four increasing
drift levels. The rotations were measured directly by inclinometers located on the East
side of the column at 3-in., 9-in., and 15-in. above the surface of the cap beam.
Figures 6.23 and 6.24 present the rotation profiles of the two specimens with
embedded connections. While the rotation profiles appear nearly linear at low drift levels,
they begin to gradually curve along the height of the column as drift levels increase;
indicating that more deformation is occurring in the connection and at the base of the
column.
Figures 6.25 through 6.27 present the rotation profiles of the three specimens with
RC connections. These rotation profiles appear to have constant rotation along the height
of the column, suggesting the CFT acted as a rigid body, with the majority of the
deformations occurring in the reinforcing bars.

166
6.5.1 Embedded CFT Specimen Rotation Profiles
Figure 6.23: EMB80 Rotation profiles

167
Figure 6.24: EMB96 Rotation profiles

168
6.5.2 RC Connection Rotation Profiles
Figure 6.25: WRC Rotation profiles

169
Figure 6.26: WRCUB Rotation profiles

170
Figure 6.27: RC Rotation profiles

171
6 .6 MOMENT-ROTATION
Figures 6.28 through 6.32 show the moment-rotation responses for each specimen. The
rotations are measured directly by inclinometers located 9-in. above the surface of the cap
beam.
Figure 6.28: EMB80 Moment-rotation response Figure 6.29: EMB96 Moment-rotation response
Figure 6.30: WRC Moment-rotation response Figure 6.31: WRCUB Moment-rotation response
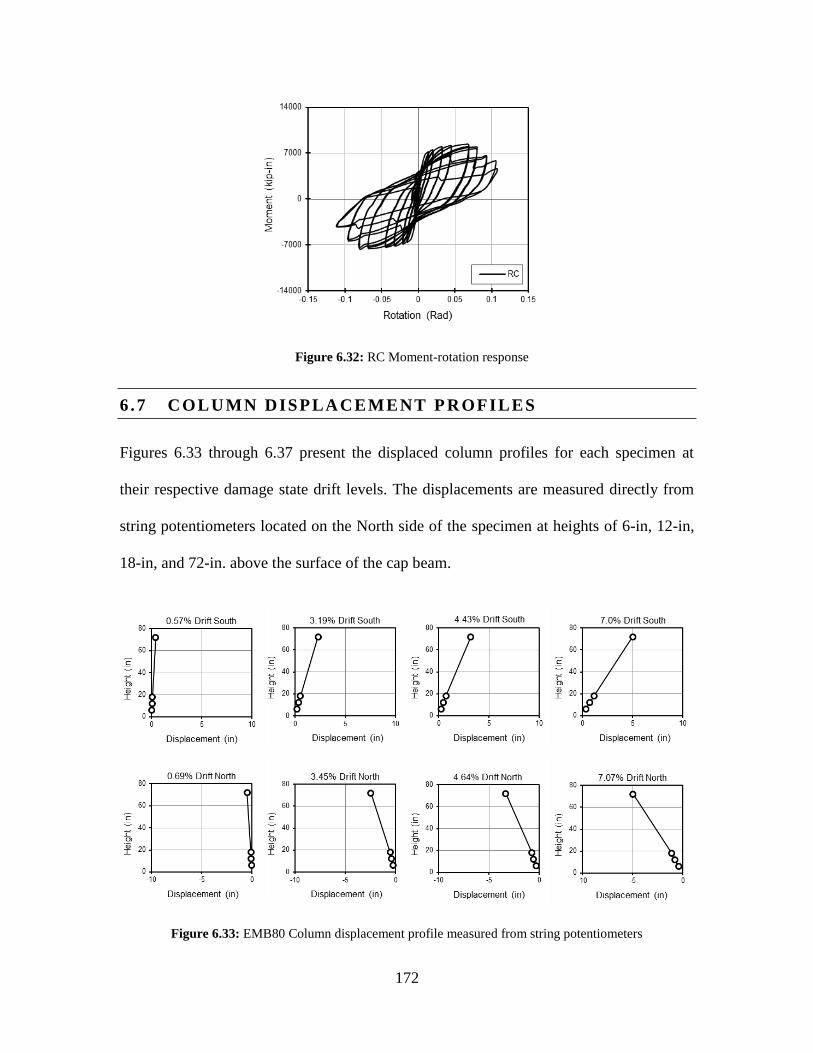
172
Figure 6.32: RC Moment-rotation response
6 .7 COLUMN DISPLACEMENT P ROFILES
Figures 6.33 through 6.37 present the displaced column profiles for each specimen at
their respective damage state drift levels. The displacements are measured directly from
string potentiometers located on the North side of the specimen at heights of 6-in, 12-in,
18-in, and 72-in. above the surface of the cap beam.
Figure 6.33: EMB80 Column displacement profile measured from string potentiometers

173
Figure 6.34: EMB96 Column displacement profile measured from string potentiometers
Figure 6.35: WRC Column displacement profile measured from string potentiometers

174
Figure 6.36: WRCUB Column displacement profile measured from string potentiometers
Figure 6.37: RC Column displacement profile measured from string potentiometers

175
6 .8 CONNECTION ROTATION AND COLUMN ROTATION
This section separates the overall specimen rotation into two components: rotation
attributed to the connection region, and rotation attributed to the column. Connection
rotation is defined as the rotation occurring below the lowest inclinometer, located 3-in.
above the surface of the cap beam. The remaining rotation is assumed to result from
deformations occurring within the column above the lowest inclinometer. Sections 6.8.1
through 6.8.3 present the breakdown of column rotation contributions for the embedded
specimens, welded RC specimens, and RC specimen, respectively.
6.8.1 Embedded Specimen Rotation Contributions
Figures 6.38 and 6.39 present the breakdown of column rotation for Specimens EMB80
and EMB96, respectively. For both specimens, it should be noted that the lowest
inclinometer was located within the buckled region, and consequently fell off during high
drift levels. For this reason, the rotation contribution plots for the two embedded
specimens only include data up to the point of the inclinometer falling off. Additionally,
the data for Specimen EMB96 has been corrected to account for a .02° offset.

176
Figure 6.38: EMB80 Rotation Contributions from column & connection
Figure 6.39: EMB96 Rotation Contributions from column & connection

177
6.8.2 WRC Specimen Rotation Contributions
Figures 6.40 and 6.41 present the breakdown of column rotation contribution for
Specimens WRC and WRCUB, respectively.
Figure 6.40: WRC Rotation Contributions from column & connection
Figure 6.41: WRCUB Rotation Contributions from column & connection

178
6.8.3 RC Specimen Rotation Contributions
Figure 6.42 presents the breakdown of column rotation contribution for Specimen RC. It
should be noted that data is only presented for drifts through 4.7%, as the inclinometer
slipped after this drift set.
Figure 6.38: RC Rotation Contributions from column & connection
6 .9 COLUMN BUCKLED SHAPE PROFILE
Sections 6.9.1 and 6.9.2 display the buckled profile progression of Specimens EMB80
and EMB96, respectively. The buckled profile was created using Optotrak data from the
Northern & Southern-most faces of the specimens.

179
6.9.1 Buckled Profile of Specimen EMB80
Figures 6.43 and 6.44 show the progression of the buckled region of Specimen EMB80
using the Optotrak data. While visual buckling was first observed at 3.19% drift in the
South direction and 3.45% drift in the North direction, Figure 6.44 shows initial buckling
occurring at 1.48% drift and 1.62% drift in the South and North directions, respectively.
Due to a corrupt file, Optotrak data is only available for Specimen EMB80 through drift
set 7.
Figure 6.39: EMB80 Buckled Profile – Drift Set 5

180
Figure 6.40: EMB80 Buckled Profile – Drift Set 7

181
6.9.2 Buckled Profile of Specimen EMB96
Figures 6.45 through 6.49 show the progression of the buckled region of Specimen
EMB96 using the Optotrak data. While visual buckling was first observed at 2.55% drift
in the South direction and 3.36% drift in the North direction, Figure 6.46 shows initial
buckling occurring at 2.01% drift and 2.29% drift in the South and North directions,
respectively.
Figure 6.45: EMB96 Buckled Profile – Drift Set 8

182
Figure 6.41: EMB96 Buckled Profile – Drift Set 10

183
Figure 6.42: EMB96 Buckled Profile – Drift Set 11

184
Figure 6.43: EMB96 Buckled Profile – Drift Set 13

185
Figure 6.44: EMB96 Buckled Profile – Drift Set 14

186
6 .10 FRAGILITY CURVES
The data from this research program has been combined with that from previous CFT
column-to-footing connection tests conducted at the University of Washington to produce
fragility functions capable of predicting the probability of damage state occurrences as a
function of column drift. For comparison purposes, the data has been divided into two
categories dependent on the type of steel tube used; spiral-weld or straight-seam. Tables
6.3 and 6.4 present the data used to create the fragility functions for the spiral-welded and
straight-seam specimens, respectively.
Although a total of 19 CFT column-to-footing tests have been conducted at the
University of Washington, the specimens that tested punching shear or exhibited pull-out
failure modes have been omitted from the creation of these fragility curves. Figures 6.50
and 6.51 show the fragility curves resulting from the data presented in Tables 6.3 and 6.4
for spiral-weld and straight-seam specimens, respectively.
Table 6.3: Data used to produce fragility curves of spiral-welded specimens based on specimen drift
GSR Specimen
Designation
Test
Parameters
Damage State Drift Ratios
Steel
Yielding
Local
Buckling
Tube
Tearing
Kingsley III Embedment depth 0.6% N.M. N.M
Williams 5 Flexible underlay 1.0% 4.1% 7.1%
Williams 6 Flexible underlay 1.2% 3.2% 8.6%
Lee 3-50 Grouted, spiral weld 0.8% 1.4% 7.4%
Lee 4-50 Monolithic, spiral weld 0.8% 2.2% 7.4%
Lee 5-50 grouted, spiral weld 0.8% 3.2% 7.4%
Lee 6-50 grouted, spiral weld 0.8% 3.2% 7.5%
Berg EMB80 Reduced annular ring,
& cap beam width 0.6% 3.2% 7.0%

187
Table 6.4: Data used to produce fragility curves of straight-seam specimens based on specimen drift
GSR Specimen
Designation
Test
Parameters
Damage State Drift Ratios
Steel
Yielding
Local
Buckling
Tube
Tearing
Lee 1-50 Monolithic, straight
weld 0.9% 3.2% 11.3%
Lee 2-50 grouted, straight weld 0.9% 2.2% 10.4%
Berg EMB96 straight seam 0.7% 2.6% 7.5%
Figure 6.50: Fragility curves for tube yielding, buckling, and tearing of spiral-welded CFT specimens
Figure 6.51: Fragility curves for tube yielding, buckling, and tearing of straight-seam CFT specimens

188
6 .11 ASSESSMENT OF PERFOR MANCE
This section evaluates the performance of the five specimens by comparing their
observed behaviors and measured responses. Tables 6.5 through 6.9 summarize the
response of the specimens at their respective damage states.
Table 6.5: Specimen EMB80 Response at Damage States
Co
lum
n
Damage State
Drift Level
Lateral Load (kips)
M (k-in)
M/Mp
Y1 Yielding 0.6% 83 5983 0.72
B1 Initial Buckling 3.2% 137 10326 1.24
B2 Buckling > 2t 4.4% 133 10405 1.25
B3 Buckling > 4t 7.0% 129 10919 1.31
T1 Tube Tearing 7.0% 129 10919 1.31
Cap
Bea
m C1 Initial Cracking 1.5% 125 8718 1.05
C2 Cracking > 2mm X X X X
U1 Initial Uplift X X X X
U2 Uplift > 5mm X X X X
U3 Uplift > 10mm X X X X
Table 6.6: Specimen EMB96 Response at Damage States
Co
lum
n
Damage State
Drift Level
Lateral Load (kips)
M (k-in)
M/Mp
Y1 Yielding 0.7% 88 6150 0.63
B1 Initial Buckling 2.6% 156 11498 1.17
B2 Buckling > 2t 4.5% 161 12382 1.26
B3 Buckling > 4t 6.4% 152 11834 1.21
T1 Tube Tearing 7.5% 140 11268 1.15
Cap
Bea
m C1 Initial Cracking 4.5% 161 12382 1.26
C2 Cracking > 2mm X X X X
U1 Initial Uplift X X X X
U2 Uplift > 5mm X X X X
U3 Uplift > 10mm X X X X

189
Table 6.7: Specimen WRC Response at Damage States
Co
lum
n
Damage State
Drift Level
Lateral Load (kips)
M (k-in)
M/Mp
Y1 Yielding 0.3% 45 3308 0.40
G1 Grout Cracking 1.5% 112 8175 0.98
G2 Grout Crushing 7.1% 117 9736 1.17
BV Bars Visible 8.4% 116 10065 1.21
BV Bar Fracture X X X X
Cap
Bea
m C1 Initial Cracking 1.5% 112 8175 0.98
C2 Cracking > 2mm 7.10% 117 9736 1.17
U1 Initial Uplift 7.10% 117 9736 1.17
U2 Uplift > 5mm -8.30%1 -74 -6930 0.83
U3 Uplift > 10mm -9.50% -63 -6197 0.74 1
Sign indicates direction of loading
Table 6.8: Specimen WRCUB Response at Damage States
Co
lum
n
Damage State
Drift Level
Lateral Load (kips)
M (k-in)
M/Mp
Y1 Yielding 0.3% 48 3563 0.43
G1 Grout Cracking 1.6% 93 6964 0.84
G2 Grout Crushing 4.7% 96 7757 0.93
BV Bars Visible 8.5% 84 8184 0.98
BV Bar Fracture 11.1% 65 6680 0.80
Cap
Bea
m C1 Initial Cracking 1.6% 93 6964 0.84
C2 Cracking > 2mm -8.2% -77 -7482 0.90
U1 Initial Uplift -10.5% -66 -6920 0.83
U2 Uplift > 5mm -11.6% -55 -6900 0.83
U3 Uplift > 10mm X X X X

190
Table 6.9: Specimen RC Response at Damage States
Co
lum
n
Damage State
Drift Level
Lateral Load (kips)
M (k-in)
M/Mp
Y1 Yielding 0.3% 51 3648 0.44
G1 Grout Cracking 0.3% 51 3648 0.44
G2 Grout Crushing 2.1% 96 7156 0.86
BV Bars Visible 9.8% 72 6416 0.77
BV Bar Fracture 9.8% 72 6416 0.77
Cap
Bea
m C1 Initial Cracking 1.5% 94 6868 0.82
C2 Cracking > 2mm X X X X
U1 Initial Uplift -4.7% -84 -7132 0.86
U2 Uplift > 5mm X X X X
U3 Uplift > 10mm X X X X
6.11.1 Comparison of EMB80 with Previous Work
In order to evaluate the performance of Specimen EMB80, the results of Specimen 3-50
tested by Jason Lee (2011) are summarized in this section to provide a basis for
comparison.
Overview of Specimen 3 -50
Specimen 3-50 consisted of a 20-in. diameter spiral-welded CFT column embedded 15.5-
in. (0.775) into a precast reinforced concrete footing. The specimen was constructed
using the isolated construction method, in which the embedded end of the CFT column
was placed inside a void in the precast footing, which was subsequently filled with high-
strength, fiber-reinforced grout. The annular ring welded to the embedded end of the steel
tube was 0.25-in. thick, with respective inner and outer diameters of 16-in. and 28-in. The
footing stood 24-in. deep, 76-in. long, and 68-in. wide.

191
The specimen was subjected to a constant axial load equivalent to 10% of its
gross axial capacity, as well as a cyclic, displacement-controlled lateral load. The
specimen was subjected to 28 complete cycles following ATC-24 loading protocol.
The overall behavior of the specimen consisted of yielding of the steel tube,
followed by local buckling near the base of the column. Failure of the specimen consisted
of ductile tearing at the apex of the buckled region at 7.40% drift. Figure 6.52 shows the
hysteretic moment-drift behavior of Specimen 3-50 with highlighted damage states.
Figure 6.52: Moment-drift behavior of Specimen 3-50 (Adapted from Lee, 2011)
Table 6.10 summarizes the response of Specimen 3-50 at its damage states of tube
yielding, buckling, and tearing, as well as cap beam cracking and pullout.

192
Table 6.10: Specimen 3-50 Response at Damage States
Co
lum
n
Damage State
Drift Level
Lateral Load (kips)
M (k-in)
M/Mp
Yielding 0.8% N.M 6309 0.79
Local Buckling 1.4% N.M 7499 1.04
Initial Tearing 7.4% N.M 8241 0.94
4.0%
Cap
B
eam
Radial Cracking 0.6% N.M 5200 0.65
Connecting Cracks X X X X
Cone Pullout X X X X
6.11.2 Comparison of Specimens EMB80 and 3 -50
A comparison of tables 6.5 and 6.10 show similar progressions of damage for Specimens
EMB80 and 3-50. The overall behavior of both specimens consisted of yielding between
0.6% and 0.8% drift, followed by local buckling and initial tearing at 7.0% drift and 7.4%
for Specimens EMB80 and 3-50, respectively.
While neither specimen experienced any pullout, the primary difference in
behavior between the two specimens was that Specimen EMB80 experienced an increase
in the magnitude of cap beam cracking compared to Specimen 3-50. However, the cracks
were all hairline in width.
While Specimen EMB80 experienced an increase in concrete damage, a
comparison of strengths show that the reduced cap beam width and reduced annular ring
diameter of Specimen EMB80 did not affect its overall capacity, as it was still able to
exceed the full plastic moment capacity of the CFT.

193
6.11.3 Comparison of Specimens EMB80 and EMB96
Results from Tables 6.5 and 6.6 show the following trends:
Both specimens reached the column damage states of initial yielding, buckling,
and tube tearing at comparable drifts (within 0.6% drift of one another), despite
EMB96 having a larger D/t ratio.
Specimen EMB96 experienced initial cap beam cracking several cycles later than
EMB80 (4.5% drift compared to 1.5% drift).
6.11.4 Comparison of Specimens WRC AND WRCUB
Results from Tables 6.7 and 6.8 show the following trends:
Both welded RC specimens had a pull-out failure mode. Specimen WRC
experienced uplift exceeding 10mm with no reinforcing bar fracture, while
Specimen WRCUB experienced uplift exceeding 5mm with reinforcing bar
fracture at 11.1% drift.
Specimen WRCUB experienced less cap beam damage compared to Specimen
WRC. While both specimens experienced initial cap beam cracking at similar
drifts (1.5% drift compared to 1.6% drift), Specimen WRC reached damage states
C2, U1, and U2 at earlier drift levels compared to WRC. In addition, Specimen
WRC experienced uplift exceeding 10mm, whereas Specimen WRCUB did not.
6.11.5 Comparison of Specimens RC and WRC
A comparison of Specimen RC with Specimens WRC/WRCUB shows the following
trends:

194
Specimen RC experienced initial cap beam cracking at the same drift as Specimen
WRC.
Specimen RC experienced initial uplift earlier than both WRC and WRCUB
(4.7% drift vs. 8.3% & 10.6%, respectively). Despite this, Specimen RC
experienced less overall uplift compared to WRC and WRCUB.
Specimen RC experienced less cracking than both WRC and WRCUB.
6 .12 DESIGN RECOMMENDATIO NS
Results from numerical analyses and experimental investigations were used to develop
the following design recommendations for CFT column-to-cap beam connections:
Diameter of Annular Ring
In order to provide adequate anchorage and transfer stresses to the surrounding
concrete and reinforcement, it is recommended that the outer diameter of the
annular ring be dimensioned as:
(6.2)
where is the outer diameter of the annular ring, is the diameter of the column,
and is the thickness of the steel tube. The measured response of Specimen
EMB80 shows that the diameter of the annular ring can be reduced according to
Eq. 6.4 without influencing the capacity of the embedded connection.

195
Width of Cap Beam
Results from Specimen EMB80 also show that the width of the cap beam, ,
can be reduced to twice the diameter of the column without influencing the
capacity of the embedded CFT connection.
(6.3)
Length of Weld In WRC Connections
The welds of the welded RC connections should be designed to develop the full
capacity of the reinforcing bar.

196
CHAPTER 7
CONCLUSIONS
An experimental research program was undertaken at The University of Washington to
investigate the behavior of CFT column-to-cap beam connections. This chapter
summarizes the research which was conducted, presents the results and conclusions, and
provides recommendations for future research.
7 .1 SUMMARY OF RESEARCH
Five scaled CFT bridge piers were experimentally tested under combined axial-flexure
loading to investigate the performance of different CFT column-to-cap beam connection
types. Three categories of connections were evaluated; 1) an embedded connection in
which the steel tube is embedded in the cap beam concrete, 2) a welded reinforced
concrete connection in which headed reinforcing bars are welded to the inside of the steel
tube and extend into the cap beam, and 3) a reinforced concrete connection in which a
traditional reinforced concrete cage is placed within the CFT column and extends into the
cap beam. Two embedded connection tests were conducted to evaluate the influence of
steel tube fabrication methods; one with a straight seam welded tube, and one with spiral
welded tube. In addition, two welded reinforced concrete connection test were conducted
to evaluate the influence of debonded reinforcing bars. Each specimen was subjected to a
constant axial load, as well as a cyclic, displacement-controlled lateral loading protocol.
The behavior of each specimen was observed, measured, and compared to evaluate the
influence of the different connection parameters.

197
7 .2 RESEARCH RESULTS AND CONCLUSIONS
The following conclusions were drawn based on the interpretation of experimental
observations and measured responses:
Influence of Reduced Cap Beam Width and Annular Ring Diameter:
The width of the cap beam can be reduced to 2D without influencing the capacity
of the embedded CFT connections. Specimens with a reduced cap beam width of
2D experience an increase in cap beam damage.
The diameter of the annular ring can be reduced to D + 16t without influencing
the capacity of the embedded connection.
Influence of Steel Fabrication Type:
Steel tubes fabricated with a straight seam weld provide an increase in drift
ductility. Specimen EMB96 reached its final damage state of steel tube tearing at
a greater drift than Specimen EMB80, despite its larger D/t ratio.
Influence of Debonded Reinforcing Bars:
Specimens with debonded Welded RC connections experience reduced cap beam
damage compared to those with bonded RC connections. The failure mode of
Specimen WRCUB was reinforcing bar fracture, compared to pullout of
Specimen WRC.

198
Influence of Transverse Reinforcement
The specimen with transverse reinforcement experienced a decrease in cap beam
damage compared to those without. This decrease in damage can be attributed to
the confining effect of the transverse reinforcement in the void and soffit region.
7 .3 RECOMMENDATIONS FOR F UTURE RESEARCH
The objective of this research program was to develop connection details capable of
sustaining cyclic loading while mitigating damage in the superstructure components.
While the embedded specimens achieved the design objectives, additional research is
required to further develop the welded RC connection details to achieve design
objectives. Based on the improved response of the RC connection detail, it is
recommended to incorporate transverse reinforcement in the embedded region of the
WRC connection.

199
BIBLIOGRPAHY
AASHTO (2011). AASHTO LRFD Bridge Design Specification. American Association
of State Highway and Transportation Official, Washington, DC.
ACI (2011). Building Code Requirements for Structural Concrete. American Concrete
Institute, Farmington Hills, MI.
AISC (2011). Steel Construction Manual. American Institute of Steel Construction,
Chicago, IL, 14 edition.
ATC-24 (1992). Guidelines for Testing Steel Components. Applied Technology Council,
Redwood City, CA.
Caltrans (2010). Caltrans Seismic Design Criteria. California Department of
Transportation, Sacramento, CA.
Kawaguchi, J. and Morino, S. (2006). Experimental study on strength and stiffness of
bare type cft column base with central reinforcing bars. Composite Construction
in Steel and Concrete V.
Kingsley, A. (2005). Experimental and analytical investigation of embedded column base
connections for concrete filled high strength steel tubes. Master’s thesis,
University of Washington.
Lee, J. (2011). Experimental investigation of embedded connections for concrete-filled
steel tube columns subjected to combined axial-flexural loading. Master’s thesis,
University of Washington.
Lehman and Roeder (2012) Initial Investigation of Reinforced Concrete Filled Tubes for
use in Bridge Foundations
Marson, J. and Bruneau, M. (2004). Cyclic testing of concrete-filled circular steel bridge
piers having encased fixed-base detail. ASCE Journal of Bridge Engineering,
9(1):14–23.
Montejo, L., Gonzalez-Roman, L. A., and Kowalsky, M. (2013). Seismic performance
evaluation of reinforced concrete-filled steel tube pile/column bridge bents.
Journal of Earthquake Engineering, 16(3):401–424.
O’Neill, K. (2011). Experimental Investigation of Circular Concrete Filled Steel Tube
Geometry on Seismic Performance. Master’s thesis, University of Washington.
Stephens, M. (2014). Performance Based Design Expressions for CFT Bridges. Proposal,
University of Washington.

200
Williams, T. (2006). Experimental investigation of high strength concrete filled steel
tubes in embedded column base foundation connections. Master’s thesis,
University of Washington.

201
APPENDIX A
RAW STRAIN GAUGE DATA
Figure A.1: EMB80 Raw tube strain gauge data 1

202
Figure A.2: EMB80 Raw tube strain gauge data 2

203
Figure A.3: EMB80 Raw tube strain gauge data 3

204
Figure A.4: EMB80 Raw tube strain gauge data 4

205
Figure A.5: WRC Raw longitudinal reinforcing bar strain gauge data 1

206
Figure A.6: WRC Raw longitudinal reinforcing bar strain gauge data 2

207
Figure A.7: WRC Raw longitudinal tube strain gauge data

208
Figure A.8: WRCUB Raw longitudinal reinforcing bar strain gauge data 1

209
Figure A.9: WRCUB Raw longitudinal reinforcing bar strain gauge data 2

210
Figure A.10: WRCUB Raw longitudinal tube strain gauge data

211
Figure A.11: RC Raw longitudinal reinforcing bar strain gauge data 1

212
Figure A.12: RC Raw longitudinal reinforcing bar strain gauge data 2
Figure A.13: RC Raw transverse reinforcing bar strain gauge data