
CFD Modeling Coupled with Electric Field Analysis for ...
9
J ournal of Power and Energy Systems Vol. 2, No. 1, 2008 447 CFD Modeling Coupled with Electric Field Analysis for Joule-Heated Glass Melters * Shinsuke MATSUNO**, Yoshiyuki ISO**, Hiroyuki UCHIDA**, Isamu OONO**, Toshiki FUKUI*** and Takaaki OOBA*** **IHI Corporation 1 Shin-nakahara-cho, Isogo-ku, Yokohama, Japan E-mail:[email protected] *** Japan Nuclear Fuel Limited 4-91 Aza-okitsuke, Oaza-obuchi, Rokkasyo-mura, Kamikita-gun, Aomori, Japan Abstract A computational fluid dynamics model on a joule-heated glass melter, which is used for the vitrification process of high-level liquid waste, has been developed to simulate the operation of actual melters. Electric field simulation is coupled with the thermal and flow field calculation to investigate the effects of the joule-heating on the buoyancy-driven flow of the molten glass. The melter is operated in a cyclic sequence including a bottom-heating phase, a drain phase and a bottom-cooling phase. In order to estimate the transient behavior of actual melters, unsteady simulations for several tens hours are necessary. It is found that there is non-uniformity of the heating at the bottom of the melter during bottom-heating phases. It is generated by the asymmetrical electric current distribution due to the arrangement of the electrodes. The temperature distribution at the bottom, however, is kept almost symmetrically due to the mixing effect by natural convection of the glass. Computational results are compared with experimental data obtained by actual operations of a prototype melter. The temperature distribution and electric resistances between electrodes predicted by the simulations indicate that the characteristics of the simulated melter show good agreements with the actual melter. Key words: Glass Melter, High-Level Waste, CFD, Electric Field, Joule-Heating 1. Introduction High-level radioactive liquid waste (HLW) generated by the nuclear fuel cycle is immobilized using glass melters. Although it is important to predict the performance of the melter to control the quality of the vitrification, operational data obtained from actual melters are quite limited due to its high-temperature and radioactive environment. Therefore, numerical analyses, which can provide more information on the characteristics of the melters, play an important role in R&D of the vitrification process. Computational fluid dynamics (CFD) has been applied to various industrial glass furnaces for last two decades. Substantial progress has been made in developing of numerical models for each component of the furnace, such as the molten glass flow, combustion space and batch layer (1)(2) . While radiation heat transfer from the combustion space is mainly used to melt the glass raw material in such melters, joule-heating is the dominant energy source in our HLW glass melters. Since the electric, thermal and flow field are strongly influenced each other, it is necessary to solve them simultaneously to simulate the behavior of the melter. *Received 6 Aug., 2007 (No. 07-0341) [DOI: 10.1299/jpes.2.447]
Transcript of CFD Modeling Coupled with Electric Field Analysis for ...
Journal of Power andEnergy
Systems
Vol. 2, No. 1, 2008
447
CFD Modeling Coupled with Electric Field Analysis for Joule-Heated Glass Melters *
Shinsuke MATSUNO**, Yoshiyuki ISO**, Hiroyuki UCHIDA**, Isamu OONO**, Toshiki FUKUI*** and Takaaki OOBA***
**IHI Corporation 1 Shin-nakahara-cho, Isogo-ku, Yokohama, Japan
E-mail:[email protected] *** Japan Nuclear Fuel Limited
4-91 Aza-okitsuke, Oaza-obuchi, Rokkasyo-mura, Kamikita-gun, Aomori, Japan Abstract A computational fluid dynamics model on a joule-heated glass melter, which is used for the vitrification process of high-level liquid waste, has been developed to simulate the operation of actual melters. Electric field simulation is coupled with the thermal and flow field calculation to investigate the effects of the joule-heating on the buoyancy-driven flow of the molten glass. The melter is operated in a cyclic sequence including a bottom-heating phase, a drain phase and a bottom-cooling phase. In order to estimate the transient behavior of actual melters, unsteady simulations for several tens hours are necessary. It is found that there is non-uniformity of the heating at the bottom of the melter during bottom-heating phases. It is generated by the asymmetrical electric current distribution due to the arrangement of the electrodes. The temperature distribution at the bottom, however, is kept almost symmetrically due to the mixing effect by natural convection of the glass. Computational results are compared with experimental data obtained by actual operations of a prototype melter. The temperature distribution and electric resistances between electrodes predicted by the simulations indicate that the characteristics of the simulated melter show good agreements with the actual melter.
Key words: Glass Melter, High-Level Waste, CFD, Electric Field, Joule-Heating
1. Introduction
High-level radioactive liquid waste (HLW) generated by the nuclear fuel cycle is immobilized using glass melters. Although it is important to predict the performance of the melter to control the quality of the vitrification, operational data obtained from actual melters are quite limited due to its high-temperature and radioactive environment. Therefore, numerical analyses, which can provide more information on the characteristics of the melters, play an important role in R&D of the vitrification process.
Computational fluid dynamics (CFD) has been applied to various industrial glass furnaces for last two decades. Substantial progress has been made in developing of numerical models for each component of the furnace, such as the molten glass flow, combustion space and batch layer(1)(2). While radiation heat transfer from the combustion space is mainly used to melt the glass raw material in such melters, joule-heating is the dominant energy source in our HLW glass melters. Since the electric, thermal and flow field are strongly influenced each other, it is necessary to solve them simultaneously to simulate the behavior of the melter.
*Received 6 Aug., 2007 (No. 07-0341) [DOI: 10.1299/jpes.2.447]
Journal of Power and Energy Systems
Vol. 2, No. 1, 2008
448
Joule-heated HLW melters have been also investigated using a two-dimensional model or a three-dimensional model only for the molten glass(3)(4). However, it is necessary to apply three-dimensional models including structural materials to define the proper boundary conditions and to clarify the actual structure of the electric and flow pattern in the melter.
In the present study, CFD coupled with the electric field analysis has been applied to a joule-heated HLW glass melter with a three-dimensional model to simulate the behavior of the molten glass including its electric potential, temperature and velocity. The melting characteristics are discussed considering the interaction between each field in the melter. Besides, the computational results are compared with the experimental data to estimate the accuracy of the numerical model.
Nomenclature
pc specific heat g gravitational acceleration vector Gr Grashof number H enthalpy
tk thermal conductivity Nu Nusselt number p pressure P electric power Pr Prandtl number Q volumetric heat generation rate t time u velocity vector
Greek symbols
ρ density σ electrical conductivity τ shear stress tensor φ electric potential
Subscripts
b boundary i i-th time step j joule-heating
sp specified
2. HLW Glass Melter
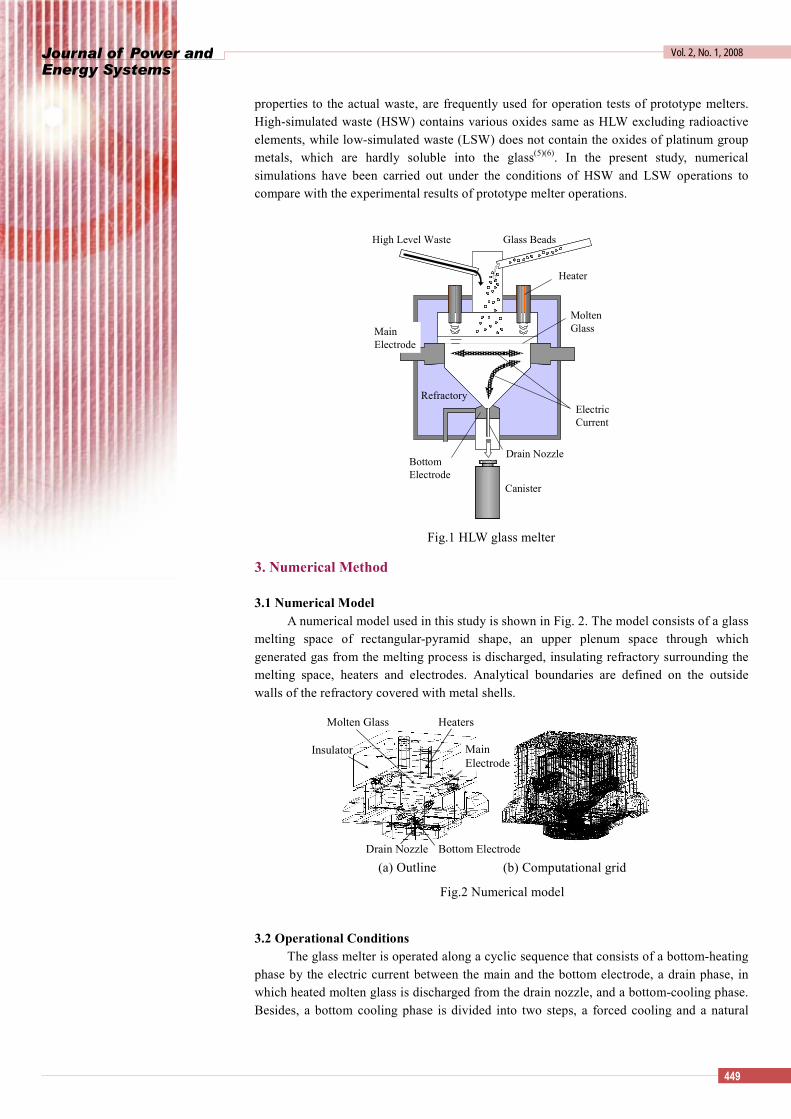
Figure 1 describes a schematic of the HLW glass melter. The liquid waste and the glass material (beads) are supplied from the upper port into the melting space, and poured into a metal canister from the drain nozzle at the bottom after melting and mixing inside the melter. Heating energy to melt the glass is supplied by joule-heating generated by the electric current between three electrodes installed on the walls of the melting space. There are two main electrodes, which are located on the opposing side-walls, and one bottom electrode, as shown in Fig.1. An electric circuit to heat the glass in the bottom region is formed between the right main electrode and the bottom electrode along the operational sequence, in addition to the main circuit between two main electrodes. Since the viscosity of the glass decreases by the joule-heating, the molten glass flows in the melting space and transfer the energy to the walls and the glass surface.
Instead of the actual radioactive waste, simulated wastes, which have similar
Journal of Power and Energy Systems
Vol. 2, No. 1, 2008
449
properties to the actual waste, are frequently used for operation tests of prototype melters. High-simulated waste (HSW) contains various oxides same as HLW excluding radioactive elements, while low-simulated waste (LSW) does not contain the oxides of platinum group metals, which are hardly soluble into the glass(5)(6). In the present study, numerical simulations have been carried out under the conditions of HSW and LSW operations to compare with the experimental results of prototype melter operations.
3. Numerical Method
3.1 Numerical Model A numerical model used in this study is shown in Fig. 2. The model consists of a glass
melting space of rectangular-pyramid shape, an upper plenum space through which generated gas from the melting process is discharged, insulating refractory surrounding the melting space, heaters and electrodes. Analytical boundaries are defined on the outside walls of the refractory covered with metal shells.
3.2 Operational Conditions The glass melter is operated along a cyclic sequence that consists of a bottom-heating
phase by the electric current between the main and the bottom electrode, a drain phase, in which heated molten glass is discharged from the drain nozzle, and a bottom-cooling phase. Besides, a bottom cooling phase is divided into two steps, a forced cooling and a natural
(a) Outline (b) Computational grid
Fig.2 Numerical model
Main Electrode
Bottom ElectrodeDrain Nozzle
HeatersMolten Glass
Insulator
Fig.1 HLW glass melter
ElectricCurrent
Bottom Electrode
Molten Glass
Drain Nozzle
High Level Waste
Main Electrode
Glass Beads
Canister
Heater
Refractory

Journal of Power and Energy Systems
Vol. 2, No. 1, 2008
450
cooling. During a forced cooling step, cooling air is supplied to the inside cooling channel of the bottom electrode to decrease the electrode temperature immediately, and a natural cooling phase follows without any special operations. Typical patterns of the bottom electrode temperature and the flow rate of the glass drain during one batch are shown in Fig. 3. The bottom electrode temperature arises by the bottom heating and the drain of hot molten glass, then drops sharply due to the forced bottom cooling and rebounds during the natural cooling step, in which the cooled electrode is heated again by the surrounding hot refractory. The electric current between two main electrodes is kept constant through the batches. Upper heaters, which supply additional power to melt the glass materials, are also operated statically during the batches only when joule-heating is insufficient. In order to achieve a cyclic stable batch numerically, unsteady calculations with identical conditions for several batches were carried out.
Major operational conditions for HSW are summarized in Table 1.
Table 1 Operational Conditions for HSW(kW)
Joule-heating between Main Electrodes
110.1
Joule-heating between Main and Bottom Electrode
13.1 (Max.)
Heating
Upper Heater 33.0
Main Electrodes 21.4 CoolingBottom Electrode 10.3
(Max.)
3.3 Basic Equations The commercial CFD code, Fluent Ver. 6.2 was used in this study. Basic conservation
equations can be described as below: Mass
( ) 0=⋅∇+∂∂ uρρ
t (1)
Momentum
( ) ( ) gτuuu ρρρ +⋅∇+−∇=⋅∇+∂∂ pt
(2)
Energy
( ) ( ) jQHck
HHt p
t +
∇⋅∇=⋅∇+
∂∂ uρρ (3)
Flow Rate of Drain
Forced Cooling of Bottom Electrode
Heating Drain Cooling
Time
Bottom Electrode Temperature
Fig.3 Operational sequences
Journal of Power and Energy Systems
Vol. 2, No. 1, 2008
451
Electric Potential
( ) 0=∇⋅∇ φσ (4)
Buoyancy forces are considered based on Boussinesq approximation, which is valid for the molten glass between 700 and 1200 with at most 2.5 % error compared with the buoyancy force based on its density variation. The molten glass is treated as an incompressible Newtonian fluid(6).
Electric potential are assumed to be static because the frequency of the actual AC power supply is much larger than that of the unsteady flow field calculation. The effective electric power was kept identical to the experimental data. The heat generation density of joule-heating is defined as following:
2j φσ ∇=Q (5)
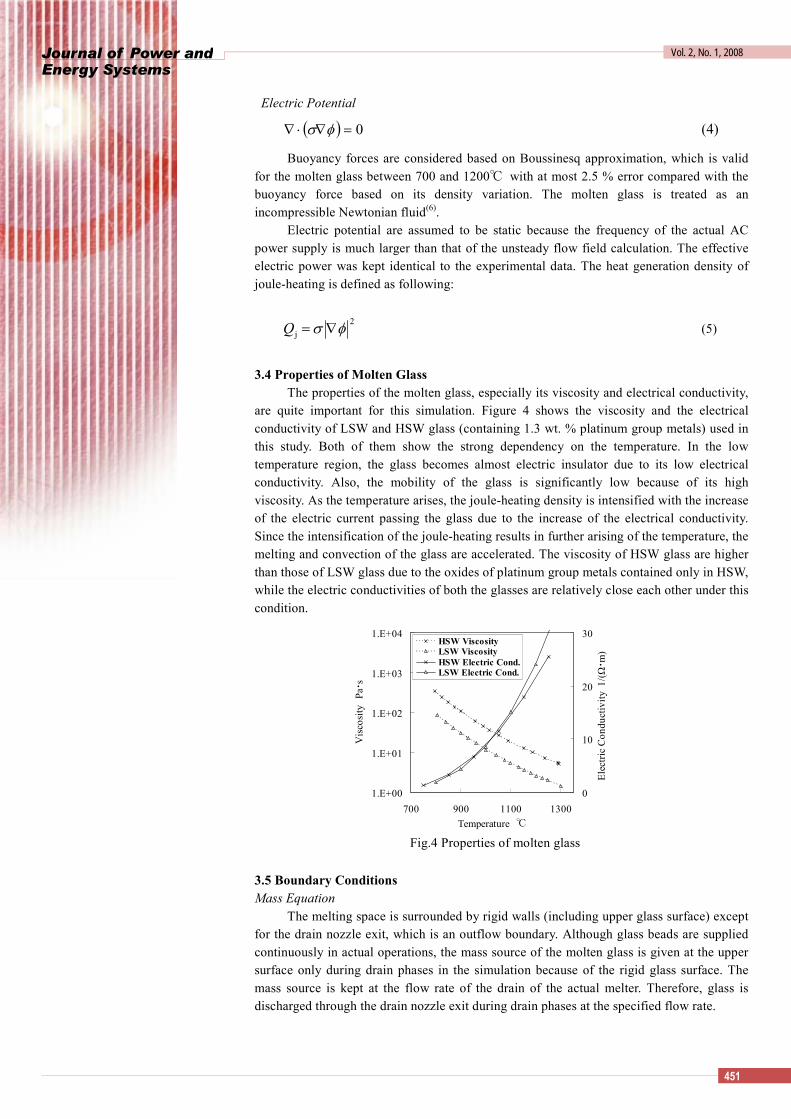
3.4 Properties of Molten Glass The properties of the molten glass, especially its viscosity and electrical conductivity,
are quite important for this simulation. Figure 4 shows the viscosity and the electrical conductivity of LSW and HSW glass (containing 1.3 wt. % platinum group metals) used in this study. Both of them show the strong dependency on the temperature. In the low temperature region, the glass becomes almost electric insulator due to its low electrical conductivity. Also, the mobility of the glass is significantly low because of its high viscosity. As the temperature arises, the joule-heating density is intensified with the increase of the electric current passing the glass due to the increase of the electrical conductivity. Since the intensification of the joule-heating results in further arising of the temperature, the melting and convection of the glass are accelerated. The viscosity of HSW glass are higher than those of LSW glass due to the oxides of platinum group metals contained only in HSW, while the electric conductivities of both the glasses are relatively close each other under this condition.
3.5 Boundary Conditions Mass Equation
The melting space is surrounded by rigid walls (including upper glass surface) except for the drain nozzle exit, which is an outflow boundary. Although glass beads are supplied continuously in actual operations, the mass source of the molten glass is given at the upper surface only during drain phases in the simulation because of the rigid glass surface. The mass source is kept at the flow rate of the drain of the actual melter. Therefore, glass is discharged through the drain nozzle exit during drain phases at the specified flow rate.
1.E+00
1.E+01
1.E+02
1.E+03
1.E+04
700 900 1100 1300Temperature
Vis
cosi
ty
Pa・ s
0
10
20
30
Elec
tric
Con
duct
ivity
1/(Ω
・ m)
HSW ViscosityLSW ViscosityHSW Electric Cond.LSW Electric Cond.
Fig.4 Properties of molten glass
Journal of Power and Energy Systems
Vol. 2, No. 1, 2008
452
Momentum Equation
The velocity boundaries on the walls surrounding the melting space are defined as non-slip conditions. Also, the velocity is zero on the boundary surface between the glass and the upper plenum space because there is a melting solid material layer on the liquid surface in the melter.
Energy Equation
The heat transfer conditions of the outside walls are given based on the empirical equation of natural convection heat transfer as below:
( ) 5/2PrGr0214.0Nu ⋅= (6)
Electric Potential Equation The electric potential is solved only inside of the glass melting space. Thus, the
electric potentials (voltages) as the boundary conditions are specified on the surface of each electrode. On the other walls of the melting space, the boundary conditions of the flux (electric current) are given as zero.
If the electric potentials of the electrodes are held constant, the calculation is possible to diverge because the increase (or decrease) of the temperature and the joule-heating occur simultaneously due to the temperature-dependency of the electrical conductivity, as mentioned in the previous section. To avoid this problem, the total power input is specified as shown in Table 1, and the electric potential on each electrode surface at i-th time step is given based on the actual power at the previous time step.
1
sp1
bb / −−= iii PPφφ (7)
It is possible to maintain the total power supply at the specified value by adjusting the
electric potential on the electrodes at each time step.
4. Results and Discussion
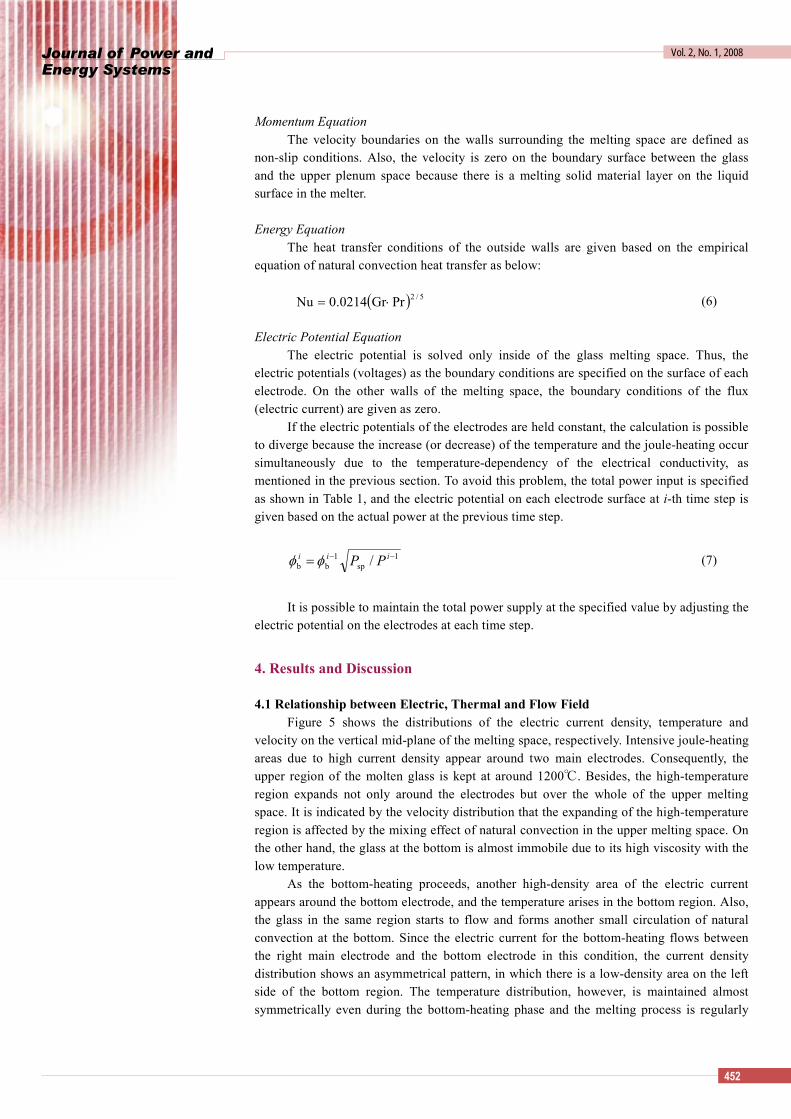
4.1 Relationship between Electric, Thermal and Flow Field Figure 5 shows the distributions of the electric current density, temperature and
velocity on the vertical mid-plane of the melting space, respectively. Intensive joule-heating areas due to high current density appear around two main electrodes. Consequently, the upper region of the molten glass is kept at around 1200. Besides, the high-temperature region expands not only around the electrodes but over the whole of the upper melting space. It is indicated by the velocity distribution that the expanding of the high-temperature region is affected by the mixing effect of natural convection in the upper melting space. On the other hand, the glass at the bottom is almost immobile due to its high viscosity with the low temperature.
As the bottom-heating proceeds, another high-density area of the electric current appears around the bottom electrode, and the temperature arises in the bottom region. Also, the glass in the same region starts to flow and forms another small circulation of natural convection at the bottom. Since the electric current for the bottom-heating flows between the right main electrode and the bottom electrode in this condition, the current density distribution shows an asymmetrical pattern, in which there is a low-density area on the left side of the bottom region. The temperature distribution, however, is maintained almost symmetrically even during the bottom-heating phase and the melting process is regularly
Journal of Power and Energy Systems
Vol. 2, No. 1, 2008
453
accomplished. It is because the mixing effect of the small circulation of the glass dominates the heat transfer in the bottom region.
It has been clarified that the electric, thermal and flow field in the melter are strongly influenced each other and the melting performance is significantly affected by the natural convections of the molten glass.
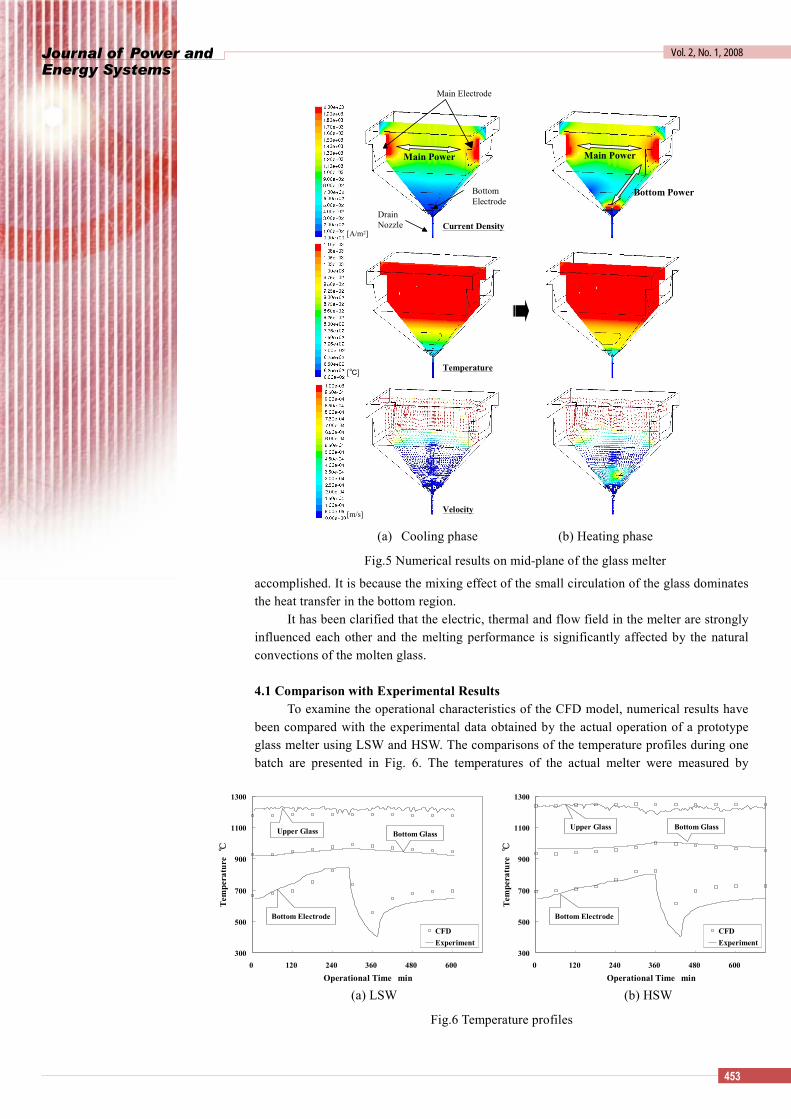
4.1 Comparison with Experimental Results To examine the operational characteristics of the CFD model, numerical results have
been compared with the experimental data obtained by the actual operation of a prototype glass melter using LSW and HSW. The comparisons of the temperature profiles during one batch are presented in Fig. 6. The temperatures of the actual melter were measured by
(a) Cooling phase (b) Heating phase
Fig.5 Numerical results on mid-plane of the glass melter
[A/m2]
Main Electrode
BottomElectrode
DrainNozzle Current Density
Temperature
Velocity
[]
[m/s]
Main Power
Bottom Power
Main Power
300
500
700
900
1100
1300
0 120 240 360 480 600
Operational Time min
Tem
pera
ture
CFDExperiment
Bottom GlassUpper Glass
Bottom Electrode
300
500
700
900
1100
1300
0 120 240 360 480 600
Operational Time min
Tem
pera
ture
CFDExperiment
Bottom GlassUpper Glass
Bottom Electrode
(a) LSW (b) HSW
Fig.6 Temperature profiles
Journal of Power and Energy Systems
Vol. 2, No. 1, 2008
454
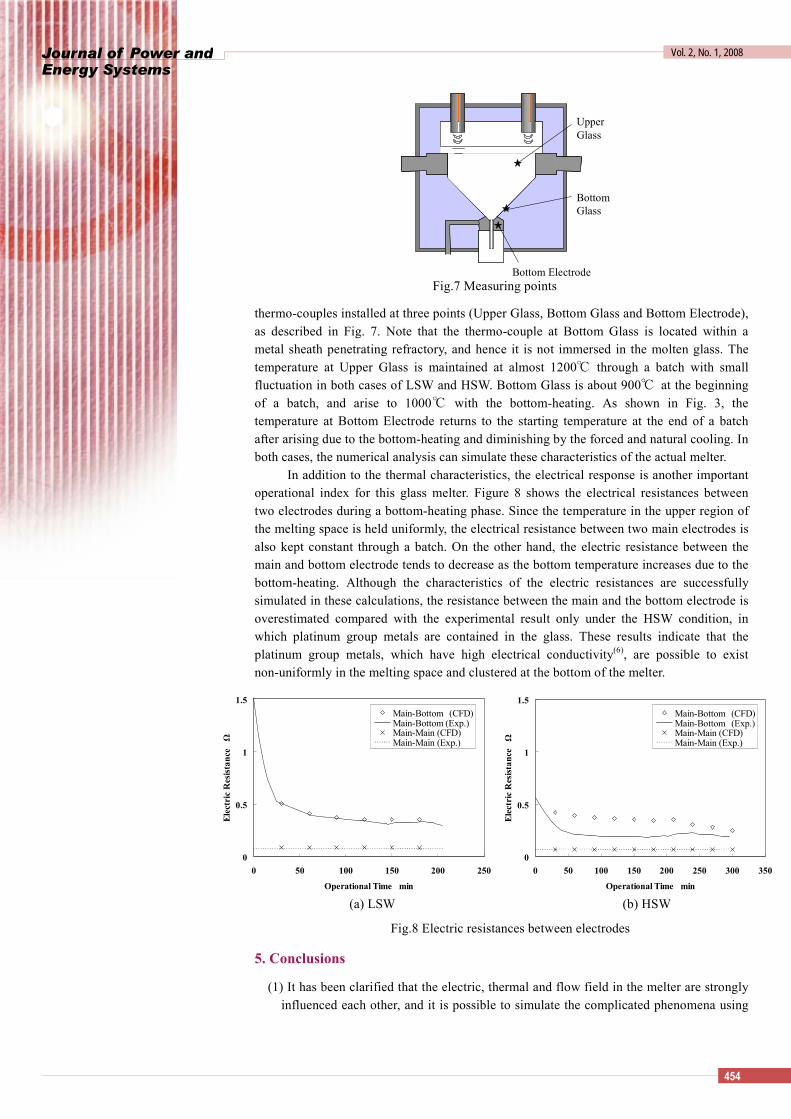
thermo-couples installed at three points (Upper Glass, Bottom Glass and Bottom Electrode), as described in Fig. 7. Note that the thermo-couple at Bottom Glass is located within a metal sheath penetrating refractory, and hence it is not immersed in the molten glass. The temperature at Upper Glass is maintained at almost 1200 through a batch with small fluctuation in both cases of LSW and HSW. Bottom Glass is about 900 at the beginning of a batch, and arise to 1000 with the bottom-heating. As shown in Fig. 3, the temperature at Bottom Electrode returns to the starting temperature at the end of a batch after arising due to the bottom-heating and diminishing by the forced and natural cooling. In both cases, the numerical analysis can simulate these characteristics of the actual melter.
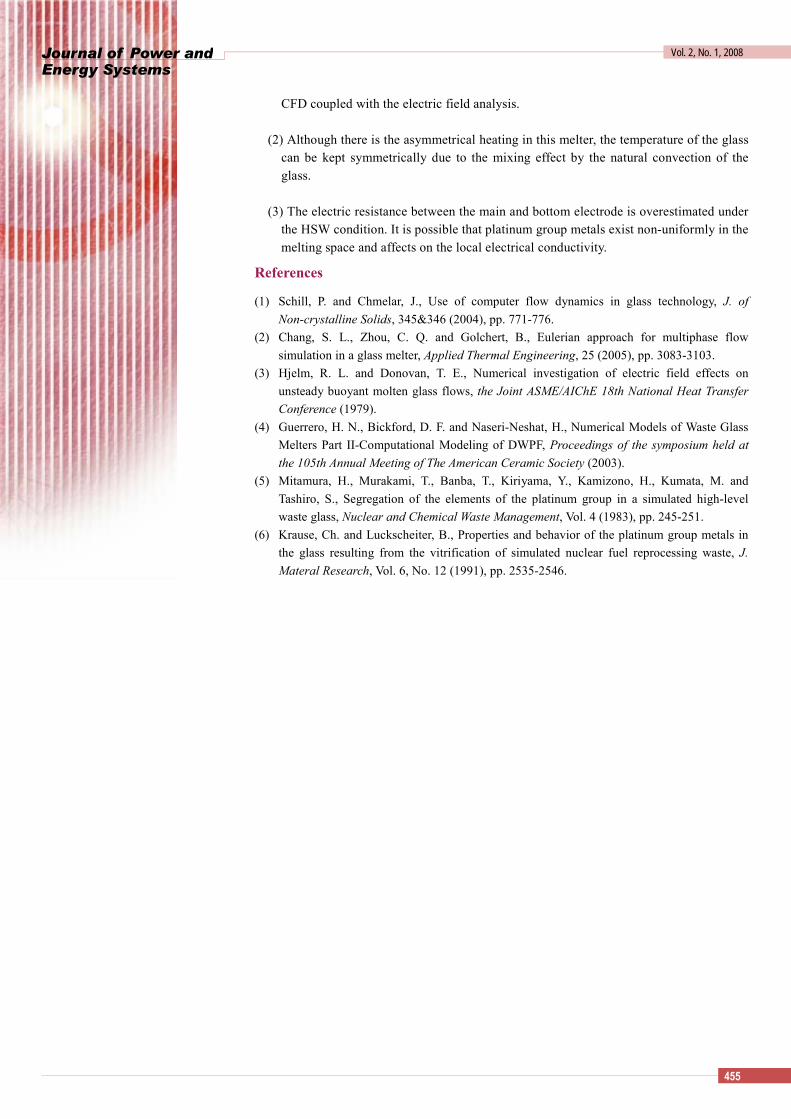
In addition to the thermal characteristics, the electrical response is another important operational index for this glass melter. Figure 8 shows the electrical resistances between two electrodes during a bottom-heating phase. Since the temperature in the upper region of the melting space is held uniformly, the electrical resistance between two main electrodes is also kept constant through a batch. On the other hand, the electric resistance between the main and bottom electrode tends to decrease as the bottom temperature increases due to the bottom-heating. Although the characteristics of the electric resistances are successfully simulated in these calculations, the resistance between the main and the bottom electrode is overestimated compared with the experimental result only under the HSW condition, in which platinum group metals are contained in the glass. These results indicate that the platinum group metals, which have high electrical conductivity(6), are possible to exist non-uniformly in the melting space and clustered at the bottom of the melter.
5. Conclusions
(1) It has been clarified that the electric, thermal and flow field in the melter are strongly influenced each other, and it is possible to simulate the complicated phenomena using
Bottom Electrode
UpperGlass
BottomGlass
Fig.7 Measuring points
0
0.5
1
1.5
0 50 100 150 200 250 300 350
Operational Time min
Ele
ctri
c R
esist
ance
Ω
Main-Bottom (CFD)Main-Bottom (Exp.)Main-Main (CFD)Main-Main (Exp.)
0
0.5
1
1.5
0 50 100 150 200 250
Operational Time min
Elec
tric
Res
ista
nce
Ω
Main-Bottom (CFD)Main-Bottom (Exp.)Main-Main (CFD)Main-Main (Exp.)
(a) LSW (b) HSW
Fig.8 Electric resistances between electrodes
Journal of Power and Energy Systems
Vol. 2, No. 1, 2008
455
CFD coupled with the electric field analysis. (2) Although there is the asymmetrical heating in this melter, the temperature of the glass
can be kept symmetrically due to the mixing effect by the natural convection of the glass.
(3) The electric resistance between the main and bottom electrode is overestimated under
the HSW condition. It is possible that platinum group metals exist non-uniformly in the melting space and affects on the local electrical conductivity.
References
(1) Schill, P. and Chmelar, J., Use of computer flow dynamics in glass technology, J. of Non-crystalline Solids, 345&346 (2004), pp. 771-776.
(2) Chang, S. L., Zhou, C. Q. and Golchert, B., Eulerian approach for multiphase flow simulation in a glass melter, Applied Thermal Engineering, 25 (2005), pp. 3083-3103.
(3) Hjelm, R. L. and Donovan, T. E., Numerical investigation of electric field effects on unsteady buoyant molten glass flows, the Joint ASME/AIChE 18th National Heat Transfer Conference (1979).
(4) Guerrero, H. N., Bickford, D. F. and Naseri-Neshat, H., Numerical Models of Waste Glass Melters Part II-Computational Modeling of DWPF, Proceedings of the symposium held at the 105th Annual Meeting of The American Ceramic Society (2003).
(5) Mitamura, H., Murakami, T., Banba, T., Kiriyama, Y., Kamizono, H., Kumata, M. and Tashiro, S., Segregation of the elements of the platinum group in a simulated high-level waste glass, Nuclear and Chemical Waste Management, Vol. 4 (1983), pp. 245-251.
(6) Krause, Ch. and Luckscheiter, B., Properties and behavior of the platinum group metals in the glass resulting from the vitrification of simulated nuclear fuel reprocessing waste, J. Materal Research, Vol. 6, No. 12 (1991), pp. 2535-2546.